Syrian vs Immigrants from Bahamas Births to Unmarried Women
COMPARE
Syrian
Immigrants from Bahamas
Births to Unmarried Women
Births to Unmarried Women Comparison
Syrians
Immigrants from Bahamas
30.2%
BIRTHS TO UNMARRIED WOMEN
88.2/ 100
METRIC RATING
123rd/ 347
METRIC RANK
40.1%
BIRTHS TO UNMARRIED WOMEN
0.0/ 100
METRIC RATING
318th/ 347
METRIC RANK
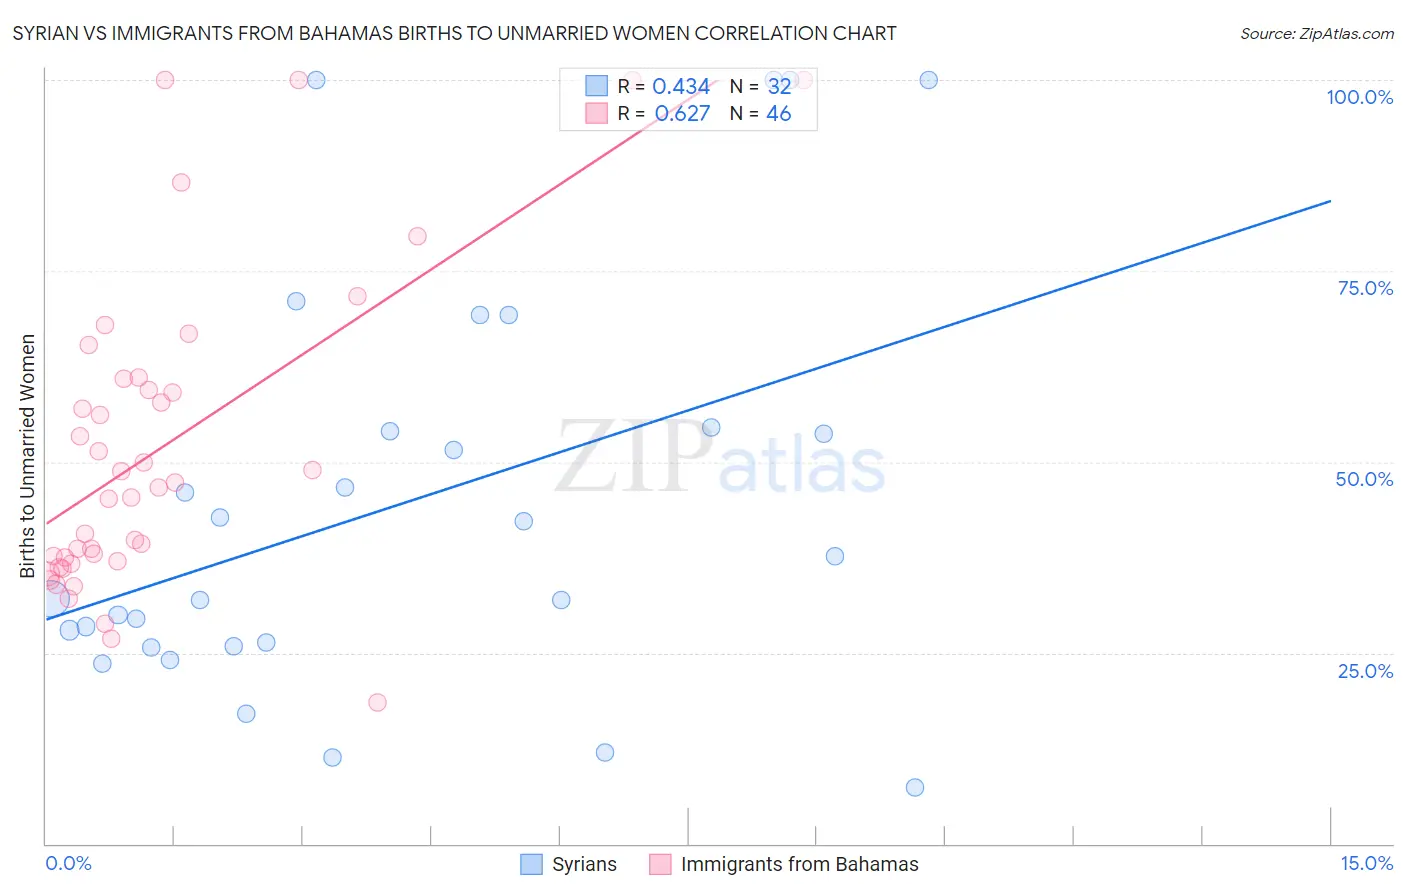
Syrian vs Immigrants from Bahamas Births to Unmarried Women Correlation Chart
The statistical analysis conducted on geographies consisting of 250,644,243 people shows a moderate positive correlation between the proportion of Syrians and percentage of births to unmarried women in the United States with a correlation coefficient (R) of 0.434 and weighted average of 30.2%. Similarly, the statistical analysis conducted on geographies consisting of 103,055,032 people shows a significant positive correlation between the proportion of Immigrants from Bahamas and percentage of births to unmarried women in the United States with a correlation coefficient (R) of 0.627 and weighted average of 40.1%, a difference of 33.0%.
Births to Unmarried Women Correlation Summary
| Measurement | Syrian | Immigrants from Bahamas |
| Minimum | 7.3% | 18.5% |
| Maximum | 100.0% | 100.0% |
| Range | 92.7% | 81.5% |
| Mean | 44.5% | 51.9% |
| Median | 34.9% | 47.0% |
| Interquartile 25% (IQ1) | 26.1% | 37.0% |
| Interquartile 75% (IQ3) | 54.3% | 60.9% |
| Interquartile Range (IQR) | 28.2% | 23.9% |
| Standard Deviation (Sample) | 26.8% | 20.6% |
| Standard Deviation (Population) | 26.4% | 20.3% |
Similar Demographics by Births to Unmarried Women
Demographics Similar to Syrians by Births to Unmarried Women
In terms of births to unmarried women, the demographic groups most similar to Syrians are Croatian (30.2%, a difference of 0.040%), Vietnamese (30.2%, a difference of 0.11%), Immigrants from Argentina (30.1%, a difference of 0.13%), Korean (30.1%, a difference of 0.18%), and European (30.2%, a difference of 0.23%).
| Demographics | Rating | Rank | Births to Unmarried Women |
| Immigrants | Italy | 91.7 /100 | #116 | Exceptional 29.9% |
| Immigrants | Netherlands | 91.1 /100 | #117 | Exceptional 29.9% |
| Immigrants | Norway | 91.0 /100 | #118 | Exceptional 29.9% |
| Argentineans | 90.5 /100 | #119 | Exceptional 30.0% |
| Ugandans | 89.2 /100 | #120 | Excellent 30.1% |
| Koreans | 88.9 /100 | #121 | Excellent 30.1% |
| Immigrants | Argentina | 88.7 /100 | #122 | Excellent 30.1% |
| Syrians | 88.2 /100 | #123 | Excellent 30.2% |
| Croatians | 88.0 /100 | #124 | Excellent 30.2% |
| Vietnamese | 87.7 /100 | #125 | Excellent 30.2% |
| Europeans | 87.2 /100 | #126 | Excellent 30.2% |
| Chinese | 87.1 /100 | #127 | Excellent 30.2% |
| Icelanders | 86.0 /100 | #128 | Excellent 30.3% |
| Immigrants | Spain | 85.8 /100 | #129 | Excellent 30.3% |
| Immigrants | Bosnia and Herzegovina | 85.7 /100 | #130 | Excellent 30.3% |
Demographics Similar to Immigrants from Bahamas by Births to Unmarried Women
In terms of births to unmarried women, the demographic groups most similar to Immigrants from Bahamas are Immigrants from Dominican Republic (40.1%, a difference of 0.070%), Yakama (40.3%, a difference of 0.56%), Crow (40.4%, a difference of 0.61%), Apache (39.9%, a difference of 0.62%), and Dominican (39.8%, a difference of 0.68%).
| Demographics | Rating | Rank | Births to Unmarried Women |
| Immigrants | Azores | 0.0 /100 | #311 | Tragic 39.6% |
| U.S. Virgin Islanders | 0.0 /100 | #312 | Tragic 39.6% |
| Africans | 0.0 /100 | #313 | Tragic 39.7% |
| Immigrants | Caribbean | 0.0 /100 | #314 | Tragic 39.8% |
| Dominicans | 0.0 /100 | #315 | Tragic 39.8% |
| Apache | 0.0 /100 | #316 | Tragic 39.9% |
| Immigrants | Dominican Republic | 0.0 /100 | #317 | Tragic 40.1% |
| Immigrants | Bahamas | 0.0 /100 | #318 | Tragic 40.1% |
| Yakama | 0.0 /100 | #319 | Tragic 40.3% |
| Crow | 0.0 /100 | #320 | Tragic 40.4% |
| Bahamians | 0.0 /100 | #321 | Tragic 40.8% |
| Cajuns | 0.0 /100 | #322 | Tragic 41.0% |
| Sioux | 0.0 /100 | #323 | Tragic 41.0% |
| Cape Verdeans | 0.0 /100 | #324 | Tragic 41.3% |
| Cheyenne | 0.0 /100 | #325 | Tragic 41.3% |