Swiss vs Immigrants from Norway Female Poverty
COMPARE
Swiss
Immigrants from Norway
Female Poverty
Female Poverty Comparison
Swiss
Immigrants from Norway
12.2%
FEMALE POVERTY
97.7/ 100
METRIC RATING
69th/ 347
METRIC RANK
12.8%
FEMALE POVERTY
89.3/ 100
METRIC RATING
124th/ 347
METRIC RANK
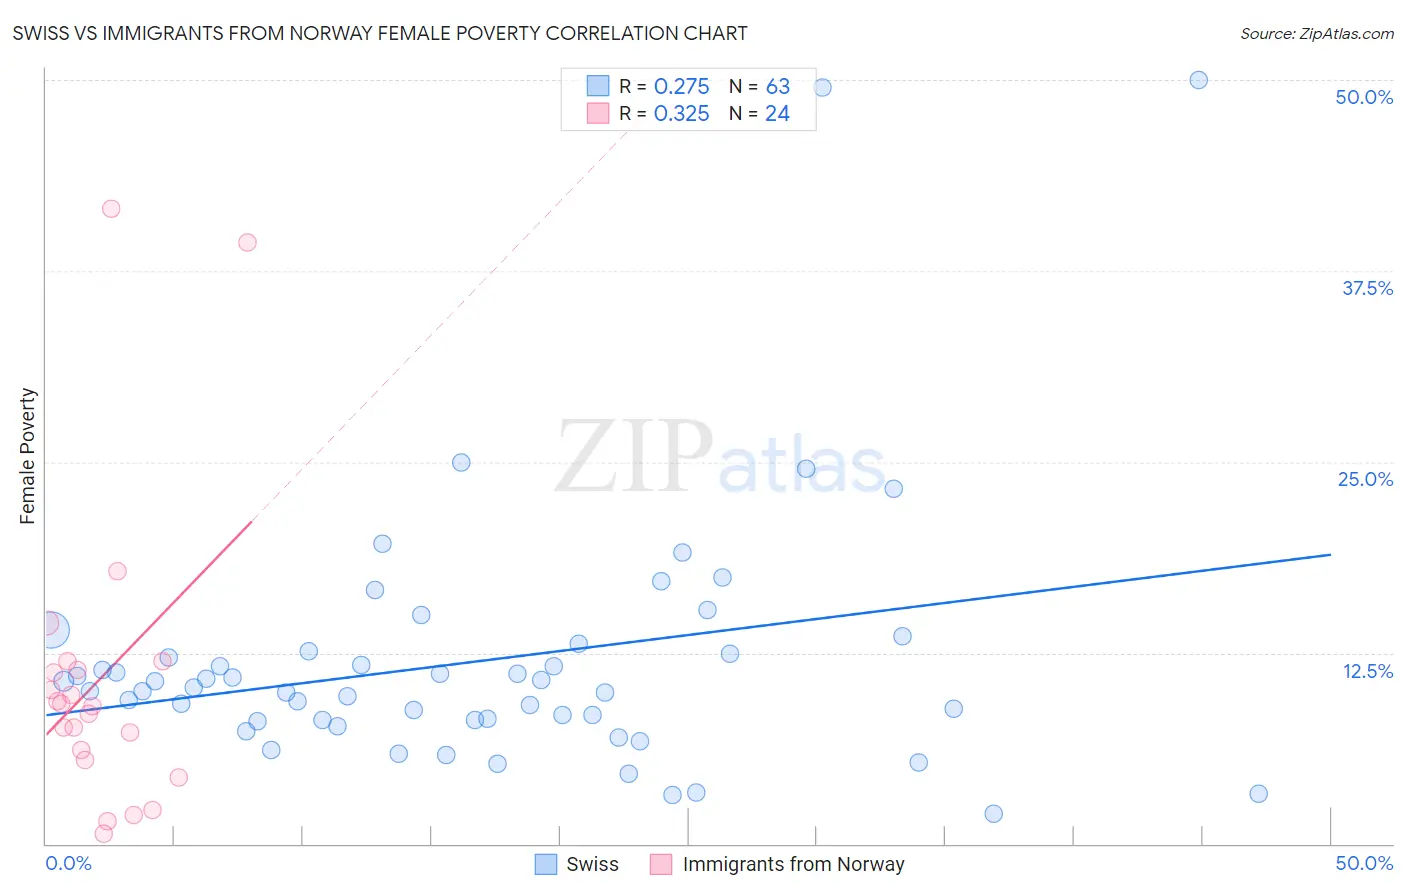
Swiss vs Immigrants from Norway Female Poverty Correlation Chart
The statistical analysis conducted on geographies consisting of 464,552,447 people shows a weak positive correlation between the proportion of Swiss and poverty level among females in the United States with a correlation coefficient (R) of 0.275 and weighted average of 12.2%. Similarly, the statistical analysis conducted on geographies consisting of 116,674,936 people shows a mild positive correlation between the proportion of Immigrants from Norway and poverty level among females in the United States with a correlation coefficient (R) of 0.325 and weighted average of 12.8%, a difference of 4.3%.
Female Poverty Correlation Summary
| Measurement | Swiss | Immigrants from Norway |
| Minimum | 1.9% | 0.68% |
| Maximum | 50.0% | 41.6% |
| Range | 48.1% | 40.9% |
| Mean | 11.9% | 10.8% |
| Median | 10.2% | 9.1% |
| Interquartile 25% (IQ1) | 8.1% | 5.8% |
| Interquartile 75% (IQ3) | 12.6% | 11.6% |
| Interquartile Range (IQR) | 4.5% | 5.8% |
| Standard Deviation (Sample) | 8.4% | 10.0% |
| Standard Deviation (Population) | 8.3% | 9.8% |
Similar Demographics by Female Poverty
Demographics Similar to Swiss by Female Poverty
In terms of female poverty, the demographic groups most similar to Swiss are Immigrants from Belgium (12.2%, a difference of 0.030%), Immigrants from Netherlands (12.2%, a difference of 0.10%), Immigrants from Eastern Asia (12.2%, a difference of 0.14%), Carpatho Rusyn (12.2%, a difference of 0.15%), and Cambodian (12.2%, a difference of 0.19%).
| Demographics | Rating | Rank | Female Poverty |
| Immigrants | Italy | 98.0 /100 | #62 | Exceptional 12.2% |
| Ukrainians | 98.0 /100 | #63 | Exceptional 12.2% |
| Germans | 98.0 /100 | #64 | Exceptional 12.2% |
| Indians (Asian) | 97.9 /100 | #65 | Exceptional 12.2% |
| Austrians | 97.9 /100 | #66 | Exceptional 12.2% |
| Immigrants | Eastern Asia | 97.8 /100 | #67 | Exceptional 12.2% |
| Immigrants | Netherlands | 97.8 /100 | #68 | Exceptional 12.2% |
| Swiss | 97.7 /100 | #69 | Exceptional 12.2% |
| Immigrants | Belgium | 97.7 /100 | #70 | Exceptional 12.2% |
| Carpatho Rusyns | 97.6 /100 | #71 | Exceptional 12.2% |
| Cambodians | 97.5 /100 | #72 | Exceptional 12.2% |
| Zimbabweans | 97.5 /100 | #73 | Exceptional 12.3% |
| Immigrants | Canada | 97.5 /100 | #74 | Exceptional 12.3% |
| Europeans | 97.4 /100 | #75 | Exceptional 12.3% |
| Immigrants | Eastern Europe | 97.2 /100 | #76 | Exceptional 12.3% |
Demographics Similar to Immigrants from Norway by Female Poverty
In terms of female poverty, the demographic groups most similar to Immigrants from Norway are Argentinean (12.8%, a difference of 0.050%), Immigrants from Ukraine (12.8%, a difference of 0.12%), Immigrants from South Eastern Asia (12.7%, a difference of 0.18%), South African (12.8%, a difference of 0.23%), and French Canadian (12.7%, a difference of 0.24%).
| Demographics | Rating | Rank | Female Poverty |
| Immigrants | Southern Europe | 90.9 /100 | #117 | Exceptional 12.7% |
| Sri Lankans | 90.9 /100 | #118 | Exceptional 12.7% |
| Albanians | 90.8 /100 | #119 | Exceptional 12.7% |
| New Zealanders | 90.6 /100 | #120 | Exceptional 12.7% |
| Immigrants | Hungary | 90.3 /100 | #121 | Exceptional 12.7% |
| French Canadians | 90.2 /100 | #122 | Exceptional 12.7% |
| Immigrants | South Eastern Asia | 89.9 /100 | #123 | Excellent 12.7% |
| Immigrants | Norway | 89.3 /100 | #124 | Excellent 12.8% |
| Argentineans | 89.1 /100 | #125 | Excellent 12.8% |
| Immigrants | Ukraine | 88.8 /100 | #126 | Excellent 12.8% |
| South Africans | 88.4 /100 | #127 | Excellent 12.8% |
| Immigrants | Belarus | 88.2 /100 | #128 | Excellent 12.8% |
| Immigrants | Brazil | 87.9 /100 | #129 | Excellent 12.8% |
| Immigrants | Vietnam | 87.1 /100 | #130 | Excellent 12.8% |
| Immigrants | Argentina | 87.0 /100 | #131 | Excellent 12.8% |