Swiss vs Immigrants from Norway Single Female Poverty
COMPARE
Swiss
Immigrants from Norway
Single Female Poverty
Single Female Poverty Comparison
Swiss
Immigrants from Norway
21.4%
SINGLE FEMALE POVERTY
24.2/ 100
METRIC RATING
198th/ 347
METRIC RANK
20.8%
SINGLE FEMALE POVERTY
63.0/ 100
METRIC RATING
167th/ 347
METRIC RANK
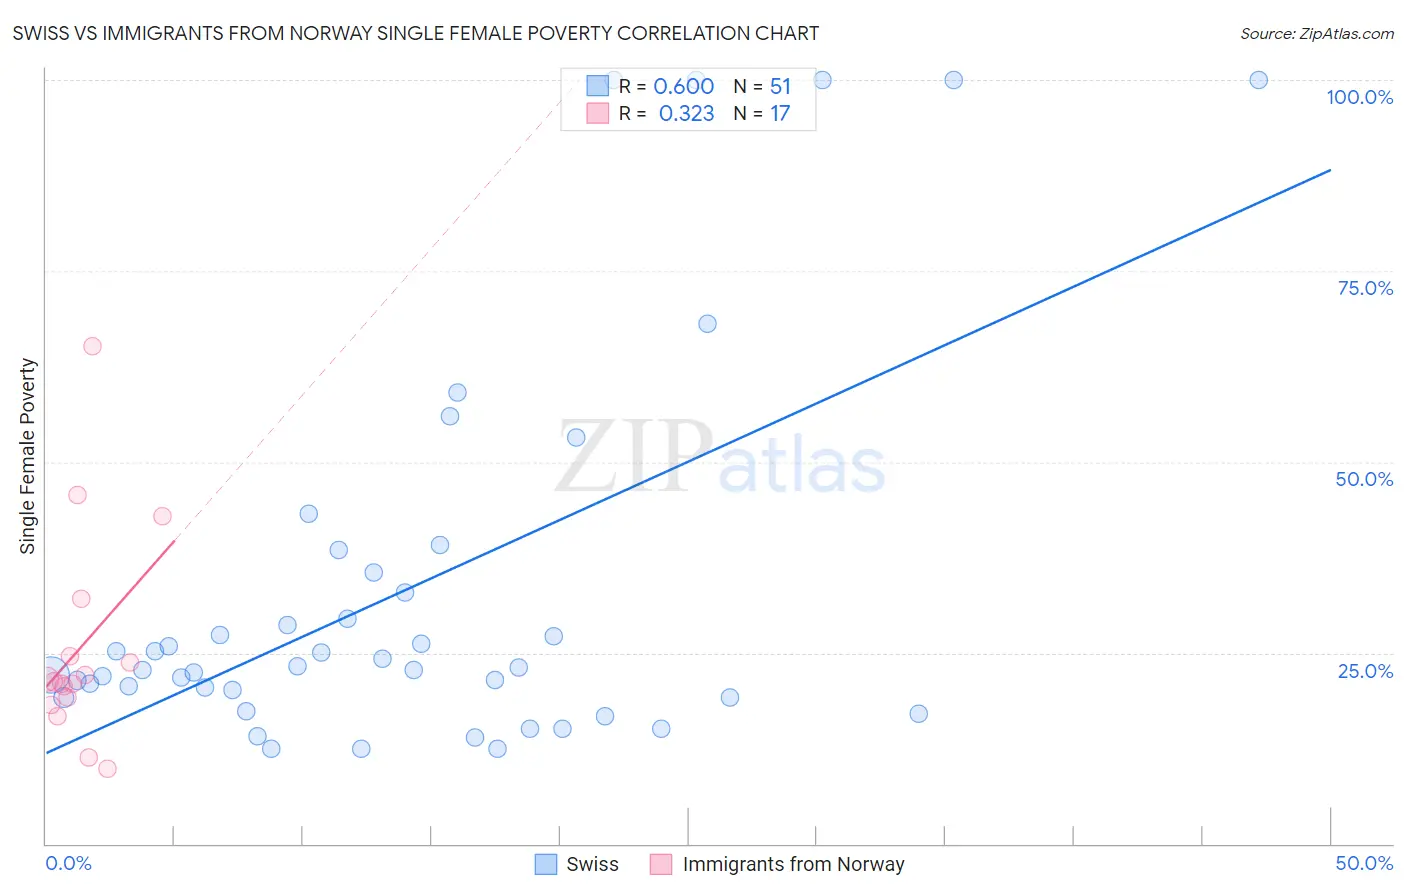
Swiss vs Immigrants from Norway Single Female Poverty Correlation Chart
The statistical analysis conducted on geographies consisting of 453,637,180 people shows a substantial positive correlation between the proportion of Swiss and poverty level among single females in the United States with a correlation coefficient (R) of 0.600 and weighted average of 21.4%. Similarly, the statistical analysis conducted on geographies consisting of 115,651,083 people shows a mild positive correlation between the proportion of Immigrants from Norway and poverty level among single females in the United States with a correlation coefficient (R) of 0.323 and weighted average of 20.8%, a difference of 2.6%.
Single Female Poverty Correlation Summary
| Measurement | Swiss | Immigrants from Norway |
| Minimum | 12.5% | 9.8% |
| Maximum | 100.0% | 65.2% |
| Range | 87.5% | 55.4% |
| Mean | 33.2% | 25.7% |
| Median | 23.1% | 21.2% |
| Interquartile 25% (IQ1) | 19.2% | 18.7% |
| Interquartile 75% (IQ3) | 35.5% | 28.3% |
| Interquartile Range (IQR) | 16.3% | 9.6% |
| Standard Deviation (Sample) | 25.2% | 13.8% |
| Standard Deviation (Population) | 25.0% | 13.4% |
Similar Demographics by Single Female Poverty
Demographics Similar to Swiss by Single Female Poverty
In terms of single female poverty, the demographic groups most similar to Swiss are Japanese (21.3%, a difference of 0.17%), Immigrants (21.4%, a difference of 0.19%), Immigrants from Saudi Arabia (21.3%, a difference of 0.23%), Irish (21.4%, a difference of 0.25%), and Nicaraguan (21.3%, a difference of 0.27%).
| Demographics | Rating | Rank | Single Female Poverty |
| Immigrants | Germany | 31.1 /100 | #191 | Fair 21.3% |
| Immigrants | Jamaica | 30.5 /100 | #192 | Fair 21.3% |
| Basques | 28.1 /100 | #193 | Fair 21.3% |
| Czechoslovakians | 27.7 /100 | #194 | Fair 21.3% |
| Nicaraguans | 27.6 /100 | #195 | Fair 21.3% |
| Immigrants | Saudi Arabia | 27.1 /100 | #196 | Fair 21.3% |
| Japanese | 26.4 /100 | #197 | Fair 21.3% |
| Swiss | 24.2 /100 | #198 | Fair 21.4% |
| Immigrants | Immigrants | 22.0 /100 | #199 | Fair 21.4% |
| Irish | 21.4 /100 | #200 | Fair 21.4% |
| Nigerians | 20.9 /100 | #201 | Fair 21.4% |
| Immigrants | Kenya | 20.7 /100 | #202 | Fair 21.4% |
| Immigrants | Haiti | 18.8 /100 | #203 | Poor 21.5% |
| Immigrants | Africa | 16.7 /100 | #204 | Poor 21.5% |
| Finns | 16.2 /100 | #205 | Poor 21.5% |
Demographics Similar to Immigrants from Norway by Single Female Poverty
In terms of single female poverty, the demographic groups most similar to Immigrants from Norway are Norwegian (20.8%, a difference of 0.0%), Ugandan (20.8%, a difference of 0.070%), Immigrants from Costa Rica (20.9%, a difference of 0.090%), Iraqi (20.8%, a difference of 0.10%), and Lebanese (20.8%, a difference of 0.32%).
| Demographics | Rating | Rank | Single Female Poverty |
| Arabs | 70.8 /100 | #160 | Good 20.7% |
| Kenyans | 68.5 /100 | #161 | Good 20.8% |
| Northern Europeans | 68.4 /100 | #162 | Good 20.8% |
| Lebanese | 67.6 /100 | #163 | Good 20.8% |
| Iraqis | 64.5 /100 | #164 | Good 20.8% |
| Ugandans | 64.0 /100 | #165 | Good 20.8% |
| Norwegians | 63.0 /100 | #166 | Good 20.8% |
| Immigrants | Norway | 63.0 /100 | #167 | Good 20.8% |
| Immigrants | Costa Rica | 61.5 /100 | #168 | Good 20.9% |
| Immigrants | Trinidad and Tobago | 56.3 /100 | #169 | Average 20.9% |
| New Zealanders | 53.2 /100 | #170 | Average 21.0% |
| Moroccans | 52.8 /100 | #171 | Average 21.0% |
| Guyanese | 52.0 /100 | #172 | Average 21.0% |
| Immigrants | Guyana | 50.6 /100 | #173 | Average 21.0% |
| Cubans | 50.0 /100 | #174 | Average 21.0% |