Native Hawaiian vs Immigrants from Norway Female Poverty
COMPARE
Native Hawaiian
Immigrants from Norway
Female Poverty
Female Poverty Comparison
Native Hawaiians
Immigrants from Norway
12.5%
FEMALE POVERTY
95.1/ 100
METRIC RATING
98th/ 347
METRIC RANK
12.8%
FEMALE POVERTY
89.3/ 100
METRIC RATING
124th/ 347
METRIC RANK
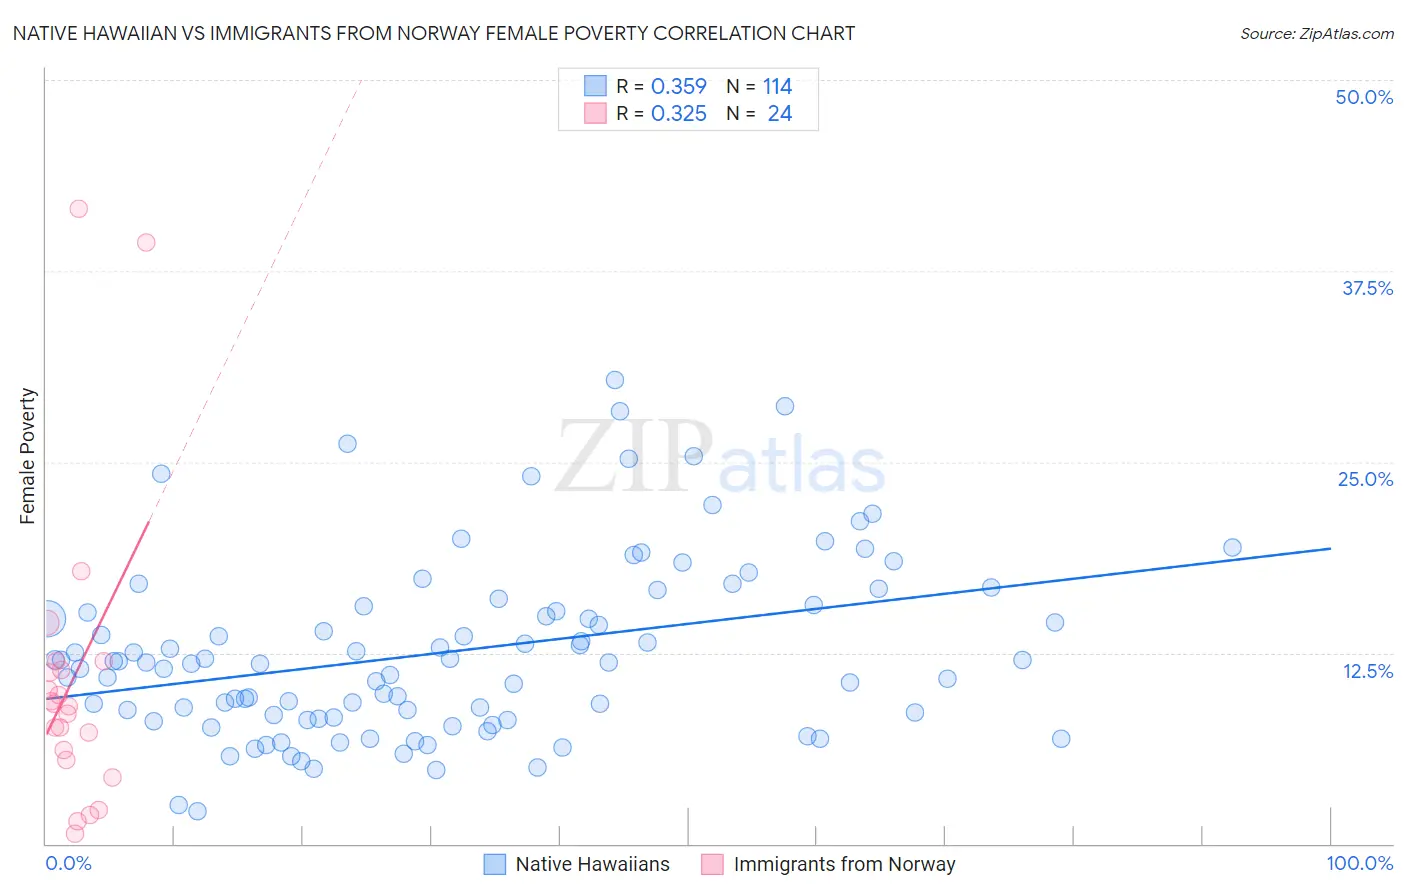
Native Hawaiian vs Immigrants from Norway Female Poverty Correlation Chart
The statistical analysis conducted on geographies consisting of 331,828,170 people shows a mild positive correlation between the proportion of Native Hawaiians and poverty level among females in the United States with a correlation coefficient (R) of 0.359 and weighted average of 12.5%. Similarly, the statistical analysis conducted on geographies consisting of 116,674,936 people shows a mild positive correlation between the proportion of Immigrants from Norway and poverty level among females in the United States with a correlation coefficient (R) of 0.325 and weighted average of 12.8%, a difference of 2.2%.
Female Poverty Correlation Summary
| Measurement | Native Hawaiian | Immigrants from Norway |
| Minimum | 2.1% | 0.68% |
| Maximum | 30.4% | 41.6% |
| Range | 28.2% | 40.9% |
| Mean | 12.6% | 10.8% |
| Median | 11.9% | 9.1% |
| Interquartile 25% (IQ1) | 8.2% | 5.8% |
| Interquartile 75% (IQ3) | 15.6% | 11.6% |
| Interquartile Range (IQR) | 7.3% | 5.8% |
| Standard Deviation (Sample) | 5.8% | 10.0% |
| Standard Deviation (Population) | 5.8% | 9.8% |
Similar Demographics by Female Poverty
Demographics Similar to Native Hawaiians by Female Poverty
In terms of female poverty, the demographic groups most similar to Native Hawaiians are Australian (12.5%, a difference of 0.020%), Romanian (12.5%, a difference of 0.020%), British (12.5%, a difference of 0.050%), Immigrants from South Africa (12.5%, a difference of 0.13%), and Immigrants from Indonesia (12.5%, a difference of 0.17%).
| Demographics | Rating | Rank | Female Poverty |
| Belgians | 95.8 /100 | #91 | Exceptional 12.4% |
| Czechoslovakians | 95.7 /100 | #92 | Exceptional 12.4% |
| Immigrants | Egypt | 95.5 /100 | #93 | Exceptional 12.5% |
| Immigrants | Indonesia | 95.4 /100 | #94 | Exceptional 12.5% |
| Immigrants | South Africa | 95.4 /100 | #95 | Exceptional 12.5% |
| British | 95.2 /100 | #96 | Exceptional 12.5% |
| Australians | 95.2 /100 | #97 | Exceptional 12.5% |
| Native Hawaiians | 95.1 /100 | #98 | Exceptional 12.5% |
| Romanians | 95.1 /100 | #99 | Exceptional 12.5% |
| Immigrants | Latvia | 94.8 /100 | #100 | Exceptional 12.5% |
| Tlingit-Haida | 94.8 /100 | #101 | Exceptional 12.5% |
| Immigrants | China | 94.5 /100 | #102 | Exceptional 12.5% |
| Slavs | 94.5 /100 | #103 | Exceptional 12.5% |
| Palestinians | 94.3 /100 | #104 | Exceptional 12.5% |
| Scottish | 94.1 /100 | #105 | Exceptional 12.5% |
Demographics Similar to Immigrants from Norway by Female Poverty
In terms of female poverty, the demographic groups most similar to Immigrants from Norway are Argentinean (12.8%, a difference of 0.050%), Immigrants from Ukraine (12.8%, a difference of 0.12%), Immigrants from South Eastern Asia (12.7%, a difference of 0.18%), South African (12.8%, a difference of 0.23%), and French Canadian (12.7%, a difference of 0.24%).
| Demographics | Rating | Rank | Female Poverty |
| Immigrants | Southern Europe | 90.9 /100 | #117 | Exceptional 12.7% |
| Sri Lankans | 90.9 /100 | #118 | Exceptional 12.7% |
| Albanians | 90.8 /100 | #119 | Exceptional 12.7% |
| New Zealanders | 90.6 /100 | #120 | Exceptional 12.7% |
| Immigrants | Hungary | 90.3 /100 | #121 | Exceptional 12.7% |
| French Canadians | 90.2 /100 | #122 | Exceptional 12.7% |
| Immigrants | South Eastern Asia | 89.9 /100 | #123 | Excellent 12.7% |
| Immigrants | Norway | 89.3 /100 | #124 | Excellent 12.8% |
| Argentineans | 89.1 /100 | #125 | Excellent 12.8% |
| Immigrants | Ukraine | 88.8 /100 | #126 | Excellent 12.8% |
| South Africans | 88.4 /100 | #127 | Excellent 12.8% |
| Immigrants | Belarus | 88.2 /100 | #128 | Excellent 12.8% |
| Immigrants | Brazil | 87.9 /100 | #129 | Excellent 12.8% |
| Immigrants | Vietnam | 87.1 /100 | #130 | Excellent 12.8% |
| Immigrants | Argentina | 87.0 /100 | #131 | Excellent 12.8% |