Swiss vs Immigrants from Czechoslovakia Female Poverty
COMPARE
Swiss
Immigrants from Czechoslovakia
Female Poverty
Female Poverty Comparison
Swiss
Immigrants from Czechoslovakia
12.2%
FEMALE POVERTY
97.7/ 100
METRIC RATING
69th/ 347
METRIC RANK
11.9%
FEMALE POVERTY
99.2/ 100
METRIC RATING
45th/ 347
METRIC RANK
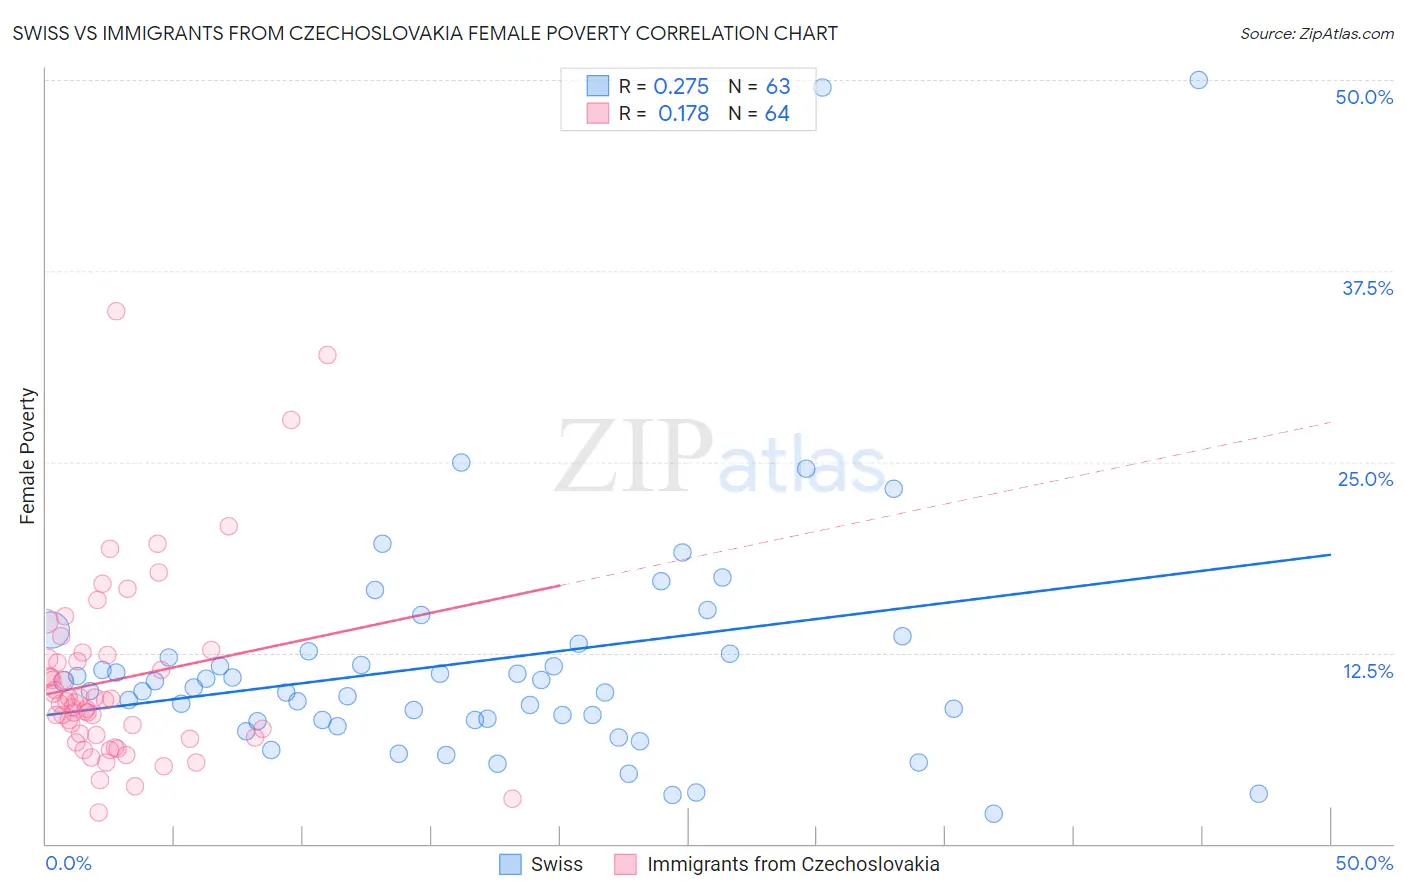
Swiss vs Immigrants from Czechoslovakia Female Poverty Correlation Chart
The statistical analysis conducted on geographies consisting of 464,552,447 people shows a weak positive correlation between the proportion of Swiss and poverty level among females in the United States with a correlation coefficient (R) of 0.275 and weighted average of 12.2%. Similarly, the statistical analysis conducted on geographies consisting of 195,448,057 people shows a poor positive correlation between the proportion of Immigrants from Czechoslovakia and poverty level among females in the United States with a correlation coefficient (R) of 0.178 and weighted average of 11.9%, a difference of 2.8%.
Female Poverty Correlation Summary
| Measurement | Swiss | Immigrants from Czechoslovakia |
| Minimum | 1.9% | 2.0% |
| Maximum | 50.0% | 34.9% |
| Range | 48.1% | 32.8% |
| Mean | 11.9% | 10.7% |
| Median | 10.2% | 9.3% |
| Interquartile 25% (IQ1) | 8.1% | 7.0% |
| Interquartile 75% (IQ3) | 12.6% | 12.2% |
| Interquartile Range (IQR) | 4.5% | 5.2% |
| Standard Deviation (Sample) | 8.4% | 6.2% |
| Standard Deviation (Population) | 8.3% | 6.1% |
Similar Demographics by Female Poverty
Demographics Similar to Swiss by Female Poverty
In terms of female poverty, the demographic groups most similar to Swiss are Immigrants from Belgium (12.2%, a difference of 0.030%), Immigrants from Netherlands (12.2%, a difference of 0.10%), Immigrants from Eastern Asia (12.2%, a difference of 0.14%), Carpatho Rusyn (12.2%, a difference of 0.15%), and Cambodian (12.2%, a difference of 0.19%).
| Demographics | Rating | Rank | Female Poverty |
| Immigrants | Italy | 98.0 /100 | #62 | Exceptional 12.2% |
| Ukrainians | 98.0 /100 | #63 | Exceptional 12.2% |
| Germans | 98.0 /100 | #64 | Exceptional 12.2% |
| Indians (Asian) | 97.9 /100 | #65 | Exceptional 12.2% |
| Austrians | 97.9 /100 | #66 | Exceptional 12.2% |
| Immigrants | Eastern Asia | 97.8 /100 | #67 | Exceptional 12.2% |
| Immigrants | Netherlands | 97.8 /100 | #68 | Exceptional 12.2% |
| Swiss | 97.7 /100 | #69 | Exceptional 12.2% |
| Immigrants | Belgium | 97.7 /100 | #70 | Exceptional 12.2% |
| Carpatho Rusyns | 97.6 /100 | #71 | Exceptional 12.2% |
| Cambodians | 97.5 /100 | #72 | Exceptional 12.2% |
| Zimbabweans | 97.5 /100 | #73 | Exceptional 12.3% |
| Immigrants | Canada | 97.5 /100 | #74 | Exceptional 12.3% |
| Europeans | 97.4 /100 | #75 | Exceptional 12.3% |
| Immigrants | Eastern Europe | 97.2 /100 | #76 | Exceptional 12.3% |
Demographics Similar to Immigrants from Czechoslovakia by Female Poverty
In terms of female poverty, the demographic groups most similar to Immigrants from Czechoslovakia are Turkish (11.9%, a difference of 0.0%), Tongan (11.9%, a difference of 0.090%), Korean (11.9%, a difference of 0.16%), Czech (11.9%, a difference of 0.20%), and Immigrants from Moldova (11.9%, a difference of 0.20%).
| Demographics | Rating | Rank | Female Poverty |
| Russians | 99.3 /100 | #38 | Exceptional 11.8% |
| Immigrants | Poland | 99.3 /100 | #39 | Exceptional 11.8% |
| Macedonians | 99.3 /100 | #40 | Exceptional 11.8% |
| Czechs | 99.2 /100 | #41 | Exceptional 11.9% |
| Immigrants | Moldova | 99.2 /100 | #42 | Exceptional 11.9% |
| Koreans | 99.2 /100 | #43 | Exceptional 11.9% |
| Tongans | 99.2 /100 | #44 | Exceptional 11.9% |
| Immigrants | Czechoslovakia | 99.2 /100 | #45 | Exceptional 11.9% |
| Turks | 99.2 /100 | #46 | Exceptional 11.9% |
| Asians | 99.1 /100 | #47 | Exceptional 11.9% |
| Immigrants | Japan | 99.0 /100 | #48 | Exceptional 11.9% |
| Immigrants | Romania | 99.0 /100 | #49 | Exceptional 12.0% |
| Slovenes | 98.9 /100 | #50 | Exceptional 12.0% |
| Immigrants | Bulgaria | 98.9 /100 | #51 | Exceptional 12.0% |
| Immigrants | Croatia | 98.7 /100 | #52 | Exceptional 12.0% |