Inupiat vs Immigrants from Norway Female Poverty
COMPARE
Inupiat
Immigrants from Norway
Female Poverty
Female Poverty Comparison
Inupiat
Immigrants from Norway
16.2%
FEMALE POVERTY
0.0/ 100
METRIC RATING
286th/ 347
METRIC RANK
12.8%
FEMALE POVERTY
89.3/ 100
METRIC RATING
124th/ 347
METRIC RANK
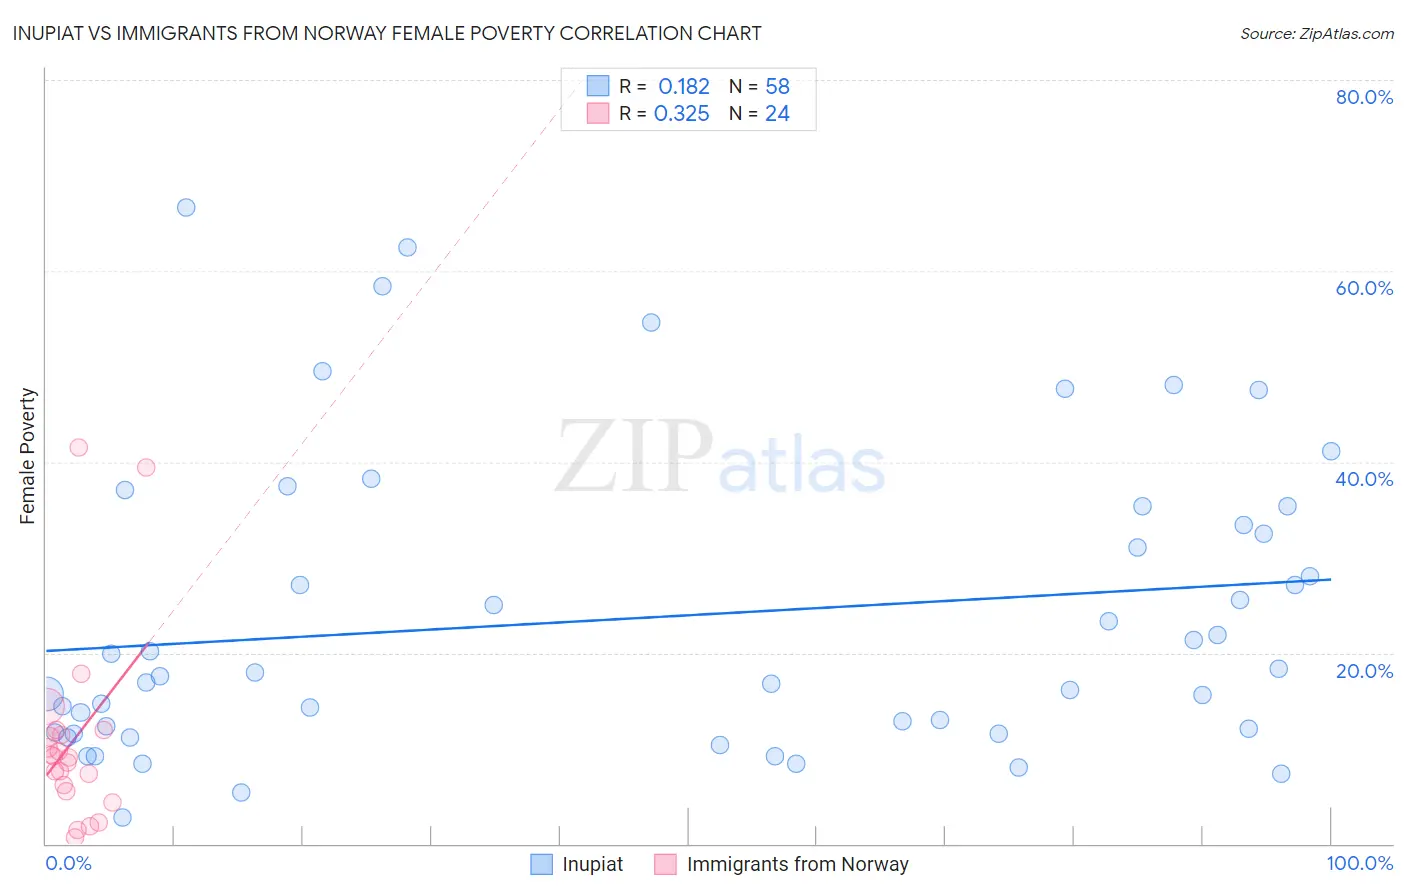
Inupiat vs Immigrants from Norway Female Poverty Correlation Chart
The statistical analysis conducted on geographies consisting of 96,314,579 people shows a poor positive correlation between the proportion of Inupiat and poverty level among females in the United States with a correlation coefficient (R) of 0.182 and weighted average of 16.2%. Similarly, the statistical analysis conducted on geographies consisting of 116,674,936 people shows a mild positive correlation between the proportion of Immigrants from Norway and poverty level among females in the United States with a correlation coefficient (R) of 0.325 and weighted average of 12.8%, a difference of 27.3%.
Female Poverty Correlation Summary
| Measurement | Inupiat | Immigrants from Norway |
| Minimum | 2.8% | 0.68% |
| Maximum | 66.7% | 41.6% |
| Range | 63.9% | 40.9% |
| Mean | 23.7% | 10.8% |
| Median | 17.7% | 9.1% |
| Interquartile 25% (IQ1) | 11.6% | 5.8% |
| Interquartile 75% (IQ3) | 33.3% | 11.6% |
| Interquartile Range (IQR) | 21.7% | 5.8% |
| Standard Deviation (Sample) | 15.6% | 10.0% |
| Standard Deviation (Population) | 15.5% | 9.8% |
Similar Demographics by Female Poverty
Demographics Similar to Inupiat by Female Poverty
In terms of female poverty, the demographic groups most similar to Inupiat are Immigrants from Belize (16.3%, a difference of 0.19%), Comanche (16.2%, a difference of 0.44%), Spanish American (16.2%, a difference of 0.52%), Immigrants from Cuba (16.1%, a difference of 0.57%), and Immigrants from Haiti (16.1%, a difference of 0.65%).
| Demographics | Rating | Rank | Female Poverty |
| Immigrants | Bahamas | 0.0 /100 | #279 | Tragic 16.1% |
| Vietnamese | 0.0 /100 | #280 | Tragic 16.1% |
| West Indians | 0.0 /100 | #281 | Tragic 16.1% |
| Immigrants | Haiti | 0.0 /100 | #282 | Tragic 16.1% |
| Immigrants | Cuba | 0.0 /100 | #283 | Tragic 16.1% |
| Spanish Americans | 0.0 /100 | #284 | Tragic 16.2% |
| Comanche | 0.0 /100 | #285 | Tragic 16.2% |
| Inupiat | 0.0 /100 | #286 | Tragic 16.2% |
| Immigrants | Belize | 0.0 /100 | #287 | Tragic 16.3% |
| Indonesians | 0.0 /100 | #288 | Tragic 16.4% |
| Blackfeet | 0.0 /100 | #289 | Tragic 16.4% |
| Immigrants | Bangladesh | 0.0 /100 | #290 | Tragic 16.4% |
| Yaqui | 0.0 /100 | #291 | Tragic 16.4% |
| Immigrants | Zaire | 0.0 /100 | #292 | Tragic 16.4% |
| Immigrants | Latin America | 0.0 /100 | #293 | Tragic 16.4% |
Demographics Similar to Immigrants from Norway by Female Poverty
In terms of female poverty, the demographic groups most similar to Immigrants from Norway are Argentinean (12.8%, a difference of 0.050%), Immigrants from Ukraine (12.8%, a difference of 0.12%), Immigrants from South Eastern Asia (12.7%, a difference of 0.18%), South African (12.8%, a difference of 0.23%), and French Canadian (12.7%, a difference of 0.24%).
| Demographics | Rating | Rank | Female Poverty |
| Immigrants | Southern Europe | 90.9 /100 | #117 | Exceptional 12.7% |
| Sri Lankans | 90.9 /100 | #118 | Exceptional 12.7% |
| Albanians | 90.8 /100 | #119 | Exceptional 12.7% |
| New Zealanders | 90.6 /100 | #120 | Exceptional 12.7% |
| Immigrants | Hungary | 90.3 /100 | #121 | Exceptional 12.7% |
| French Canadians | 90.2 /100 | #122 | Exceptional 12.7% |
| Immigrants | South Eastern Asia | 89.9 /100 | #123 | Excellent 12.7% |
| Immigrants | Norway | 89.3 /100 | #124 | Excellent 12.8% |
| Argentineans | 89.1 /100 | #125 | Excellent 12.8% |
| Immigrants | Ukraine | 88.8 /100 | #126 | Excellent 12.8% |
| South Africans | 88.4 /100 | #127 | Excellent 12.8% |
| Immigrants | Belarus | 88.2 /100 | #128 | Excellent 12.8% |
| Immigrants | Brazil | 87.9 /100 | #129 | Excellent 12.8% |
| Immigrants | Vietnam | 87.1 /100 | #130 | Excellent 12.8% |
| Immigrants | Argentina | 87.0 /100 | #131 | Excellent 12.8% |