Immigrants from Argentina vs Immigrants from Norway Female Poverty
COMPARE
Immigrants from Argentina
Immigrants from Norway
Female Poverty
Female Poverty Comparison
Immigrants from Argentina
Immigrants from Norway
12.8%
FEMALE POVERTY
87.0/ 100
METRIC RATING
131st/ 347
METRIC RANK
12.8%
FEMALE POVERTY
89.3/ 100
METRIC RATING
124th/ 347
METRIC RANK
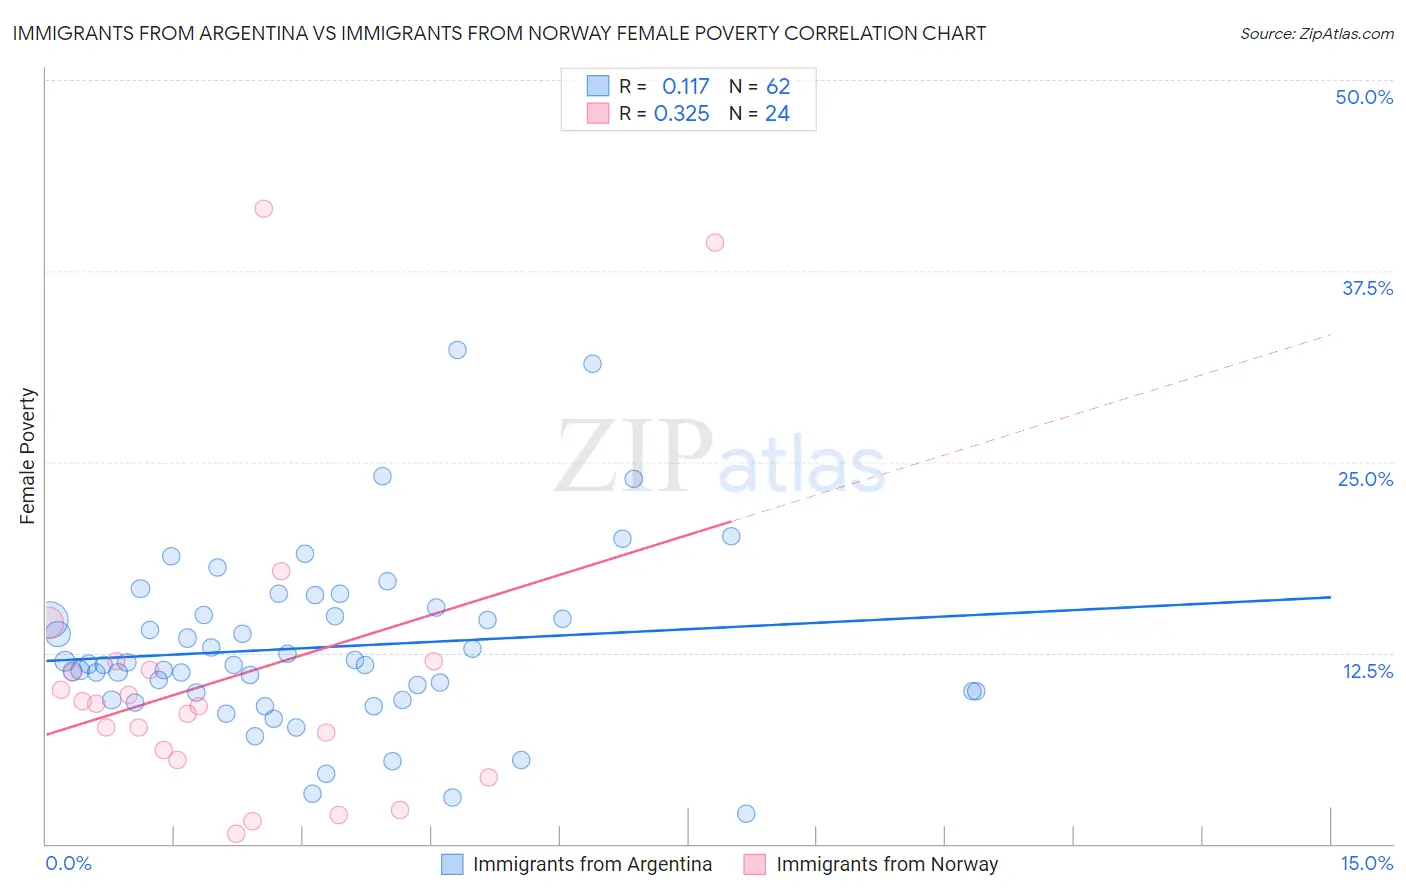
Immigrants from Argentina vs Immigrants from Norway Female Poverty Correlation Chart
The statistical analysis conducted on geographies consisting of 264,332,384 people shows a poor positive correlation between the proportion of Immigrants from Argentina and poverty level among females in the United States with a correlation coefficient (R) of 0.117 and weighted average of 12.8%. Similarly, the statistical analysis conducted on geographies consisting of 116,674,936 people shows a mild positive correlation between the proportion of Immigrants from Norway and poverty level among females in the United States with a correlation coefficient (R) of 0.325 and weighted average of 12.8%, a difference of 0.56%.
Female Poverty Correlation Summary
| Measurement | Immigrants from Argentina | Immigrants from Norway |
| Minimum | 1.9% | 0.68% |
| Maximum | 32.3% | 41.6% |
| Range | 30.4% | 40.9% |
| Mean | 12.9% | 10.8% |
| Median | 11.7% | 9.1% |
| Interquartile 25% (IQ1) | 9.9% | 5.8% |
| Interquartile 75% (IQ3) | 15.0% | 11.6% |
| Interquartile Range (IQR) | 5.0% | 5.8% |
| Standard Deviation (Sample) | 5.7% | 10.0% |
| Standard Deviation (Population) | 5.7% | 9.8% |
Demographics Similar to Immigrants from Argentina and Immigrants from Norway by Female Poverty
In terms of female poverty, the demographic groups most similar to Immigrants from Argentina are Immigrants from Jordan (12.8%, a difference of 0.010%), Immigrants from Vietnam (12.8%, a difference of 0.030%), Immigrants from Western Europe (12.8%, a difference of 0.070%), Immigrants from Brazil (12.8%, a difference of 0.22%), and Immigrants from Switzerland (12.9%, a difference of 0.24%). Similarly, the demographic groups most similar to Immigrants from Norway are Argentinean (12.8%, a difference of 0.050%), Immigrants from Ukraine (12.8%, a difference of 0.12%), Immigrants from South Eastern Asia (12.7%, a difference of 0.18%), South African (12.8%, a difference of 0.23%), and French Canadian (12.7%, a difference of 0.24%).
| Demographics | Rating | Rank | Female Poverty |
| Immigrants | Southern Europe | 90.9 /100 | #117 | Exceptional 12.7% |
| Sri Lankans | 90.9 /100 | #118 | Exceptional 12.7% |
| Albanians | 90.8 /100 | #119 | Exceptional 12.7% |
| New Zealanders | 90.6 /100 | #120 | Exceptional 12.7% |
| Immigrants | Hungary | 90.3 /100 | #121 | Exceptional 12.7% |
| French Canadians | 90.2 /100 | #122 | Exceptional 12.7% |
| Immigrants | South Eastern Asia | 89.9 /100 | #123 | Excellent 12.7% |
| Immigrants | Norway | 89.3 /100 | #124 | Excellent 12.8% |
| Argentineans | 89.1 /100 | #125 | Excellent 12.8% |
| Immigrants | Ukraine | 88.8 /100 | #126 | Excellent 12.8% |
| South Africans | 88.4 /100 | #127 | Excellent 12.8% |
| Immigrants | Belarus | 88.2 /100 | #128 | Excellent 12.8% |
| Immigrants | Brazil | 87.9 /100 | #129 | Excellent 12.8% |
| Immigrants | Vietnam | 87.1 /100 | #130 | Excellent 12.8% |
| Immigrants | Argentina | 87.0 /100 | #131 | Excellent 12.8% |
| Immigrants | Jordan | 86.9 /100 | #132 | Excellent 12.8% |
| Immigrants | Western Europe | 86.6 /100 | #133 | Excellent 12.8% |
| Immigrants | Switzerland | 85.8 /100 | #134 | Excellent 12.9% |
| French | 85.6 /100 | #135 | Excellent 12.9% |
| Peruvians | 85.2 /100 | #136 | Excellent 12.9% |
| Chileans | 84.7 /100 | #137 | Excellent 12.9% |