Swiss vs Immigrants from Eritrea Female Poverty
COMPARE
Swiss
Immigrants from Eritrea
Female Poverty
Female Poverty Comparison
Swiss
Immigrants from Eritrea
12.2%
FEMALE POVERTY
97.7/ 100
METRIC RATING
69th/ 347
METRIC RANK
14.6%
FEMALE POVERTY
2.4/ 100
METRIC RATING
226th/ 347
METRIC RANK
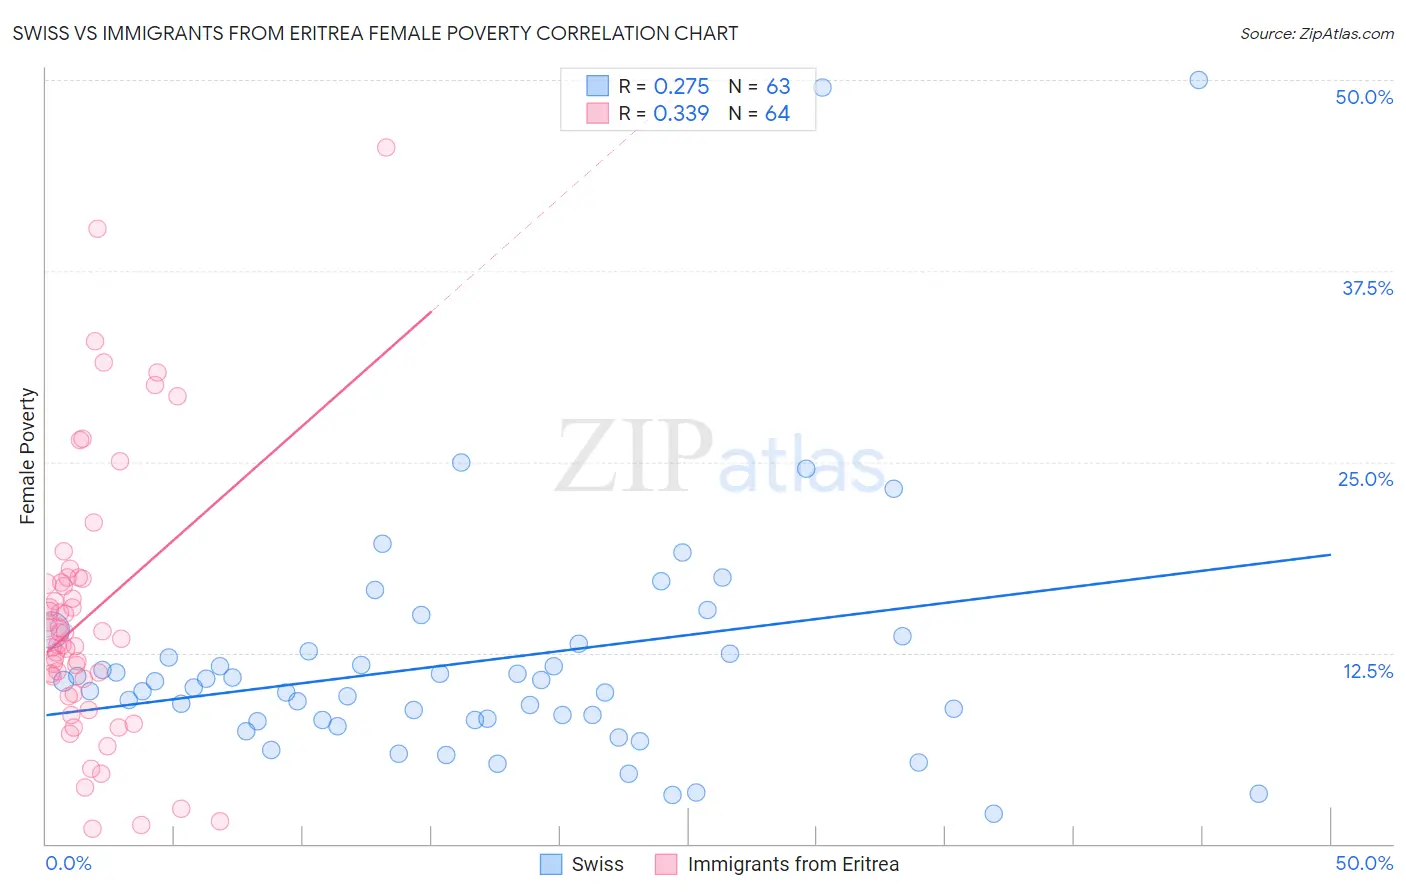
Swiss vs Immigrants from Eritrea Female Poverty Correlation Chart
The statistical analysis conducted on geographies consisting of 464,552,447 people shows a weak positive correlation between the proportion of Swiss and poverty level among females in the United States with a correlation coefficient (R) of 0.275 and weighted average of 12.2%. Similarly, the statistical analysis conducted on geographies consisting of 104,846,826 people shows a mild positive correlation between the proportion of Immigrants from Eritrea and poverty level among females in the United States with a correlation coefficient (R) of 0.339 and weighted average of 14.6%, a difference of 19.7%.
Female Poverty Correlation Summary
| Measurement | Swiss | Immigrants from Eritrea |
| Minimum | 1.9% | 1.0% |
| Maximum | 50.0% | 45.6% |
| Range | 48.1% | 44.6% |
| Mean | 11.9% | 15.0% |
| Median | 10.2% | 13.6% |
| Interquartile 25% (IQ1) | 8.1% | 10.3% |
| Interquartile 75% (IQ3) | 12.6% | 17.2% |
| Interquartile Range (IQR) | 4.5% | 6.9% |
| Standard Deviation (Sample) | 8.4% | 8.9% |
| Standard Deviation (Population) | 8.3% | 8.8% |
Similar Demographics by Female Poverty
Demographics Similar to Swiss by Female Poverty
In terms of female poverty, the demographic groups most similar to Swiss are Immigrants from Belgium (12.2%, a difference of 0.030%), Immigrants from Netherlands (12.2%, a difference of 0.10%), Immigrants from Eastern Asia (12.2%, a difference of 0.14%), Carpatho Rusyn (12.2%, a difference of 0.15%), and Cambodian (12.2%, a difference of 0.19%).
| Demographics | Rating | Rank | Female Poverty |
| Immigrants | Italy | 98.0 /100 | #62 | Exceptional 12.2% |
| Ukrainians | 98.0 /100 | #63 | Exceptional 12.2% |
| Germans | 98.0 /100 | #64 | Exceptional 12.2% |
| Indians (Asian) | 97.9 /100 | #65 | Exceptional 12.2% |
| Austrians | 97.9 /100 | #66 | Exceptional 12.2% |
| Immigrants | Eastern Asia | 97.8 /100 | #67 | Exceptional 12.2% |
| Immigrants | Netherlands | 97.8 /100 | #68 | Exceptional 12.2% |
| Swiss | 97.7 /100 | #69 | Exceptional 12.2% |
| Immigrants | Belgium | 97.7 /100 | #70 | Exceptional 12.2% |
| Carpatho Rusyns | 97.6 /100 | #71 | Exceptional 12.2% |
| Cambodians | 97.5 /100 | #72 | Exceptional 12.2% |
| Zimbabweans | 97.5 /100 | #73 | Exceptional 12.3% |
| Immigrants | Canada | 97.5 /100 | #74 | Exceptional 12.3% |
| Europeans | 97.4 /100 | #75 | Exceptional 12.3% |
| Immigrants | Eastern Europe | 97.2 /100 | #76 | Exceptional 12.3% |
Demographics Similar to Immigrants from Eritrea by Female Poverty
In terms of female poverty, the demographic groups most similar to Immigrants from Eritrea are Immigrants from Nigeria (14.7%, a difference of 0.31%), American (14.6%, a difference of 0.33%), Immigrants from Micronesia (14.6%, a difference of 0.33%), German Russian (14.7%, a difference of 0.45%), and Ghanaian (14.7%, a difference of 0.52%).
| Demographics | Rating | Rank | Female Poverty |
| Japanese | 4.1 /100 | #219 | Tragic 14.5% |
| Alsatians | 4.0 /100 | #220 | Tragic 14.5% |
| Immigrants | Cambodia | 3.7 /100 | #221 | Tragic 14.5% |
| Immigrants | Nonimmigrants | 3.7 /100 | #222 | Tragic 14.5% |
| Immigrants | Africa | 3.3 /100 | #223 | Tragic 14.5% |
| Americans | 2.8 /100 | #224 | Tragic 14.6% |
| Immigrants | Micronesia | 2.8 /100 | #225 | Tragic 14.6% |
| Immigrants | Eritrea | 2.4 /100 | #226 | Tragic 14.6% |
| Immigrants | Nigeria | 2.1 /100 | #227 | Tragic 14.7% |
| German Russians | 2.0 /100 | #228 | Tragic 14.7% |
| Ghanaians | 1.9 /100 | #229 | Tragic 14.7% |
| Alaska Natives | 1.8 /100 | #230 | Tragic 14.7% |
| Nigerians | 1.7 /100 | #231 | Tragic 14.8% |
| Osage | 1.5 /100 | #232 | Tragic 14.8% |
| Immigrants | Saudi Arabia | 1.4 /100 | #233 | Tragic 14.8% |