Italian vs Immigrants from Japan Married-Couple Family Poverty
COMPARE
Italian
Immigrants from Japan
Married-Couple Family Poverty
Married-Couple Family Poverty Comparison
Italians
Immigrants from Japan
4.0%
MARRIED-COUPLE FAMILY POVERTY
100.0/ 100
METRIC RATING
18th/ 347
METRIC RANK
4.3%
MARRIED-COUPLE FAMILY POVERTY
99.8/ 100
METRIC RATING
44th/ 347
METRIC RANK
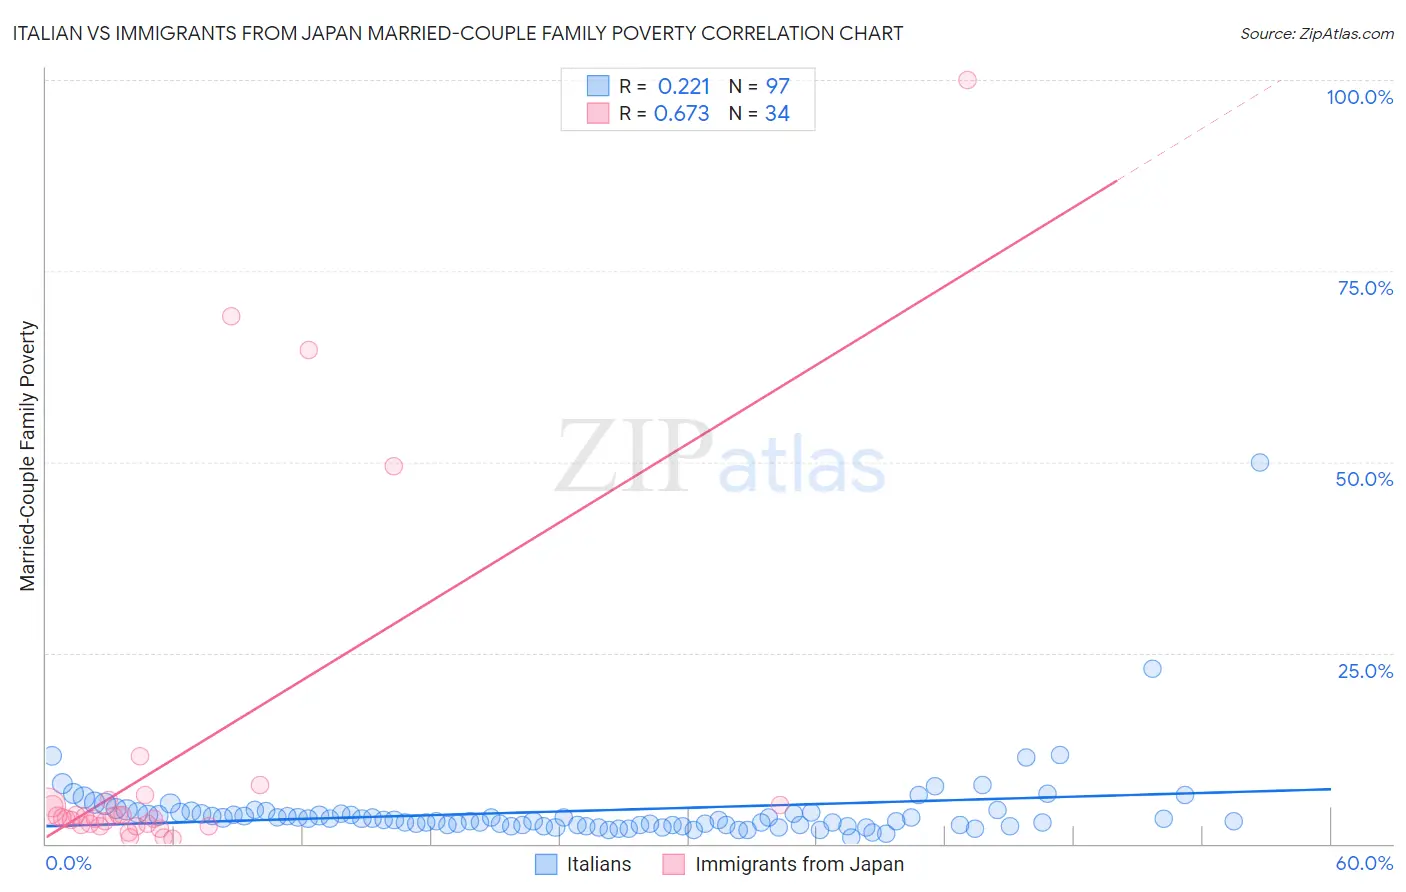
Italian vs Immigrants from Japan Married-Couple Family Poverty Correlation Chart
The statistical analysis conducted on geographies consisting of 559,685,630 people shows a weak positive correlation between the proportion of Italians and poverty level among married-couple families in the United States with a correlation coefficient (R) of 0.221 and weighted average of 4.0%. Similarly, the statistical analysis conducted on geographies consisting of 337,873,757 people shows a significant positive correlation between the proportion of Immigrants from Japan and poverty level among married-couple families in the United States with a correlation coefficient (R) of 0.673 and weighted average of 4.3%, a difference of 6.5%.
Married-Couple Family Poverty Correlation Summary
| Measurement | Italian | Immigrants from Japan |
| Minimum | 0.87% | 0.67% |
| Maximum | 50.0% | 100.0% |
| Range | 49.1% | 99.3% |
| Mean | 4.3% | 11.5% |
| Median | 3.1% | 3.5% |
| Interquartile 25% (IQ1) | 2.4% | 2.5% |
| Interquartile 75% (IQ3) | 4.1% | 5.0% |
| Interquartile Range (IQR) | 1.6% | 2.5% |
| Standard Deviation (Sample) | 5.5% | 23.0% |
| Standard Deviation (Population) | 5.4% | 22.6% |
Similar Demographics by Married-Couple Family Poverty
Demographics Similar to Italians by Married-Couple Family Poverty
In terms of married-couple family poverty, the demographic groups most similar to Italians are Filipino (4.0%, a difference of 0.010%), German (4.0%, a difference of 0.040%), Polish (4.0%, a difference of 0.31%), Slovak (4.0%, a difference of 0.34%), and Czech (4.0%, a difference of 0.38%).
| Demographics | Rating | Rank | Married-Couple Family Poverty |
| Lithuanians | 100.0 /100 | #11 | Exceptional 4.0% |
| Bulgarians | 100.0 /100 | #12 | Exceptional 4.0% |
| Czechs | 100.0 /100 | #13 | Exceptional 4.0% |
| Slovaks | 100.0 /100 | #14 | Exceptional 4.0% |
| Poles | 100.0 /100 | #15 | Exceptional 4.0% |
| Germans | 100.0 /100 | #16 | Exceptional 4.0% |
| Filipinos | 100.0 /100 | #17 | Exceptional 4.0% |
| Italians | 100.0 /100 | #18 | Exceptional 4.0% |
| Immigrants | Ireland | 99.9 /100 | #19 | Exceptional 4.1% |
| Maltese | 99.9 /100 | #20 | Exceptional 4.1% |
| Zimbabweans | 99.9 /100 | #21 | Exceptional 4.1% |
| Immigrants | Singapore | 99.9 /100 | #22 | Exceptional 4.1% |
| Bhutanese | 99.9 /100 | #23 | Exceptional 4.1% |
| Eastern Europeans | 99.9 /100 | #24 | Exceptional 4.1% |
| Immigrants | Taiwan | 99.9 /100 | #25 | Exceptional 4.1% |
Demographics Similar to Immigrants from Japan by Married-Couple Family Poverty
In terms of married-couple family poverty, the demographic groups most similar to Immigrants from Japan are Serbian (4.3%, a difference of 0.020%), British (4.3%, a difference of 0.050%), Immigrants from South Central Asia (4.3%, a difference of 0.16%), Australian (4.3%, a difference of 0.23%), and Turkish (4.3%, a difference of 0.31%).
| Demographics | Rating | Rank | Married-Couple Family Poverty |
| Iranians | 99.9 /100 | #37 | Exceptional 4.2% |
| Belgians | 99.9 /100 | #38 | Exceptional 4.2% |
| Immigrants | Northern Europe | 99.8 /100 | #39 | Exceptional 4.2% |
| French Canadians | 99.8 /100 | #40 | Exceptional 4.2% |
| Northern Europeans | 99.8 /100 | #41 | Exceptional 4.3% |
| Scottish | 99.8 /100 | #42 | Exceptional 4.3% |
| Swiss | 99.8 /100 | #43 | Exceptional 4.3% |
| Immigrants | Japan | 99.8 /100 | #44 | Exceptional 4.3% |
| Serbians | 99.8 /100 | #45 | Exceptional 4.3% |
| British | 99.8 /100 | #46 | Exceptional 4.3% |
| Immigrants | South Central Asia | 99.8 /100 | #47 | Exceptional 4.3% |
| Australians | 99.7 /100 | #48 | Exceptional 4.3% |
| Turks | 99.7 /100 | #49 | Exceptional 4.3% |
| Burmese | 99.7 /100 | #50 | Exceptional 4.3% |
| Immigrants | Lithuania | 99.7 /100 | #51 | Exceptional 4.3% |