Italian vs Immigrants from Japan Unemployment Among Seniors over 75 years
COMPARE
Italian
Immigrants from Japan
Unemployment Among Seniors over 75 years
Unemployment Among Seniors over 75 years Comparison
Italians
Immigrants from Japan
10.0%
UNEMPLOYMENT AMONG SENIORS OVER 75 YEARS
0.0/ 100
METRIC RATING
306th/ 347
METRIC RANK
8.0%
UNEMPLOYMENT AMONG SENIORS OVER 75 YEARS
99.7/ 100
METRIC RATING
79th/ 347
METRIC RANK
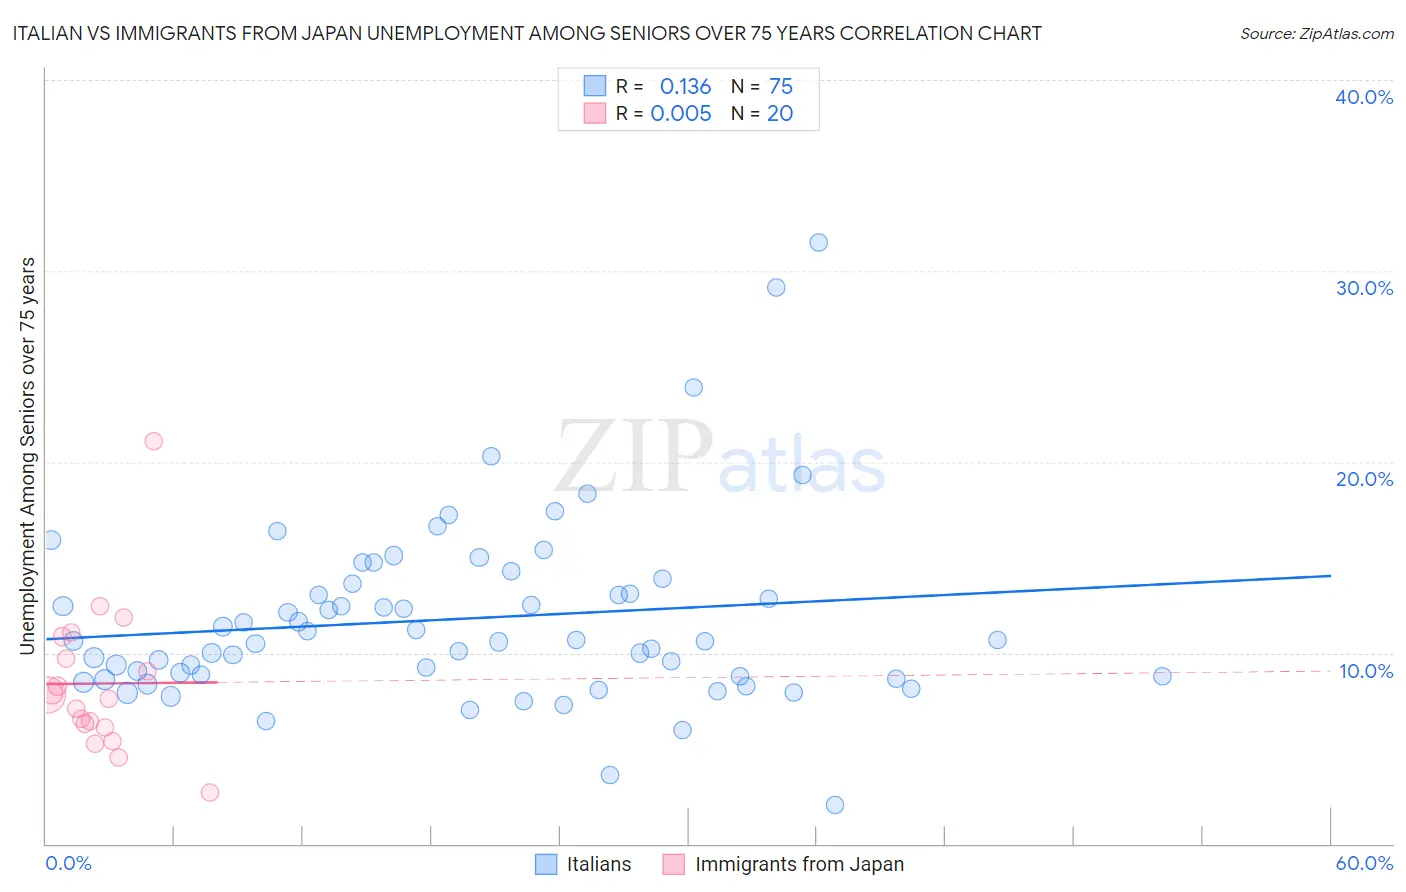
Italian vs Immigrants from Japan Unemployment Among Seniors over 75 years Correlation Chart
The statistical analysis conducted on geographies consisting of 235,398,566 people shows a poor positive correlation between the proportion of Italians and unemployment rate among seniors over the age of 75 in the United States with a correlation coefficient (R) of 0.136 and weighted average of 10.0%. Similarly, the statistical analysis conducted on geographies consisting of 184,448,468 people shows no correlation between the proportion of Immigrants from Japan and unemployment rate among seniors over the age of 75 in the United States with a correlation coefficient (R) of 0.005 and weighted average of 8.0%, a difference of 24.4%.
Unemployment Among Seniors over 75 years Correlation Summary
| Measurement | Italian | Immigrants from Japan |
| Minimum | 2.0% | 2.7% |
| Maximum | 31.5% | 21.1% |
| Range | 29.5% | 18.4% |
| Mean | 11.8% | 8.4% |
| Median | 10.6% | 7.7% |
| Interquartile 25% (IQ1) | 8.8% | 6.2% |
| Interquartile 75% (IQ3) | 13.6% | 10.3% |
| Interquartile Range (IQR) | 4.8% | 4.1% |
| Standard Deviation (Sample) | 4.8% | 3.9% |
| Standard Deviation (Population) | 4.8% | 3.8% |
Similar Demographics by Unemployment Among Seniors over 75 years
Demographics Similar to Italians by Unemployment Among Seniors over 75 years
In terms of unemployment among seniors over 75 years, the demographic groups most similar to Italians are Immigrants from Fiji (10.0%, a difference of 0.13%), Swedish (10.0%, a difference of 0.15%), Scotch-Irish (10.0%, a difference of 0.34%), Puget Sound Salish (10.0%, a difference of 0.35%), and Finnish (10.0%, a difference of 0.42%).
| Demographics | Rating | Rank | Unemployment Among Seniors over 75 years |
| Belgians | 0.0 /100 | #299 | Tragic 9.9% |
| Iraqis | 0.0 /100 | #300 | Tragic 9.9% |
| Welsh | 0.0 /100 | #301 | Tragic 10.0% |
| Finns | 0.0 /100 | #302 | Tragic 10.0% |
| Puget Sound Salish | 0.0 /100 | #303 | Tragic 10.0% |
| Scotch-Irish | 0.0 /100 | #304 | Tragic 10.0% |
| Swedes | 0.0 /100 | #305 | Tragic 10.0% |
| Italians | 0.0 /100 | #306 | Tragic 10.0% |
| Immigrants | Fiji | 0.0 /100 | #307 | Tragic 10.0% |
| Whites/Caucasians | 0.0 /100 | #308 | Tragic 10.1% |
| English | 0.0 /100 | #309 | Tragic 10.1% |
| Hungarians | 0.0 /100 | #310 | Tragic 10.1% |
| Scottish | 0.0 /100 | #311 | Tragic 10.1% |
| Chippewa | 0.0 /100 | #312 | Tragic 10.1% |
| Nepalese | 0.0 /100 | #313 | Tragic 10.1% |
Demographics Similar to Immigrants from Japan by Unemployment Among Seniors over 75 years
In terms of unemployment among seniors over 75 years, the demographic groups most similar to Immigrants from Japan are Immigrants from Australia (8.0%, a difference of 0.020%), Cuban (8.0%, a difference of 0.020%), Bhutanese (8.0%, a difference of 0.040%), Arapaho (8.1%, a difference of 0.15%), and Immigrants from Belarus (8.0%, a difference of 0.20%).
| Demographics | Rating | Rank | Unemployment Among Seniors over 75 years |
| Bolivians | 99.9 /100 | #72 | Exceptional 8.0% |
| Immigrants | France | 99.9 /100 | #73 | Exceptional 8.0% |
| Spanish Americans | 99.8 /100 | #74 | Exceptional 8.0% |
| Immigrants | Uganda | 99.8 /100 | #75 | Exceptional 8.0% |
| Immigrants | Venezuela | 99.8 /100 | #76 | Exceptional 8.0% |
| Immigrants | Turkey | 99.8 /100 | #77 | Exceptional 8.0% |
| Immigrants | Belarus | 99.8 /100 | #78 | Exceptional 8.0% |
| Immigrants | Japan | 99.7 /100 | #79 | Exceptional 8.0% |
| Immigrants | Australia | 99.7 /100 | #80 | Exceptional 8.0% |
| Cubans | 99.7 /100 | #81 | Exceptional 8.0% |
| Bhutanese | 99.7 /100 | #82 | Exceptional 8.0% |
| Arapaho | 99.7 /100 | #83 | Exceptional 8.1% |
| U.S. Virgin Islanders | 99.7 /100 | #84 | Exceptional 8.1% |
| Immigrants | Indonesia | 99.7 /100 | #85 | Exceptional 8.1% |
| Immigrants | Singapore | 99.7 /100 | #86 | Exceptional 8.1% |