Immigrants from Ethiopia vs Barbadian Married-Couple Family Poverty
COMPARE
Immigrants from Ethiopia
Barbadian
Married-Couple Family Poverty
Married-Couple Family Poverty Comparison
Immigrants from Ethiopia
Barbadians
5.1%
MARRIED-COUPLE FAMILY POVERTY
72.4/ 100
METRIC RATING
155th/ 347
METRIC RANK
6.3%
MARRIED-COUPLE FAMILY POVERTY
0.1/ 100
METRIC RATING
274th/ 347
METRIC RANK
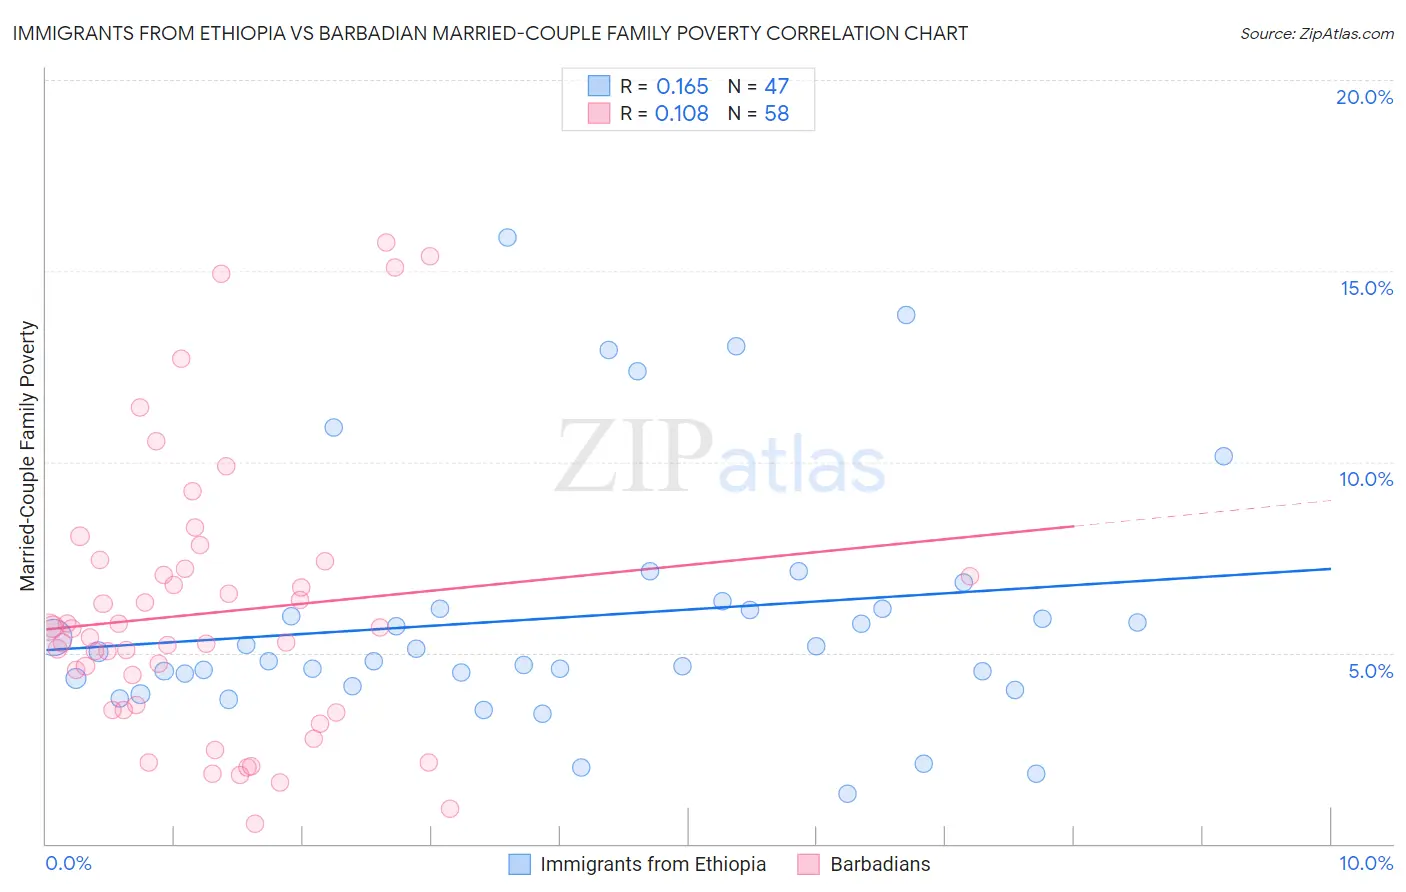
Immigrants from Ethiopia vs Barbadian Married-Couple Family Poverty Correlation Chart
The statistical analysis conducted on geographies consisting of 210,673,890 people shows a poor positive correlation between the proportion of Immigrants from Ethiopia and poverty level among married-couple families in the United States with a correlation coefficient (R) of 0.165 and weighted average of 5.1%. Similarly, the statistical analysis conducted on geographies consisting of 140,986,203 people shows a poor positive correlation between the proportion of Barbadians and poverty level among married-couple families in the United States with a correlation coefficient (R) of 0.108 and weighted average of 6.3%, a difference of 23.9%.
Married-Couple Family Poverty Correlation Summary
| Measurement | Immigrants from Ethiopia | Barbadian |
| Minimum | 1.3% | 0.52% |
| Maximum | 15.9% | 15.7% |
| Range | 14.6% | 15.2% |
| Mean | 5.9% | 6.0% |
| Median | 5.0% | 5.5% |
| Interquartile 25% (IQ1) | 4.3% | 3.5% |
| Interquartile 75% (IQ3) | 6.2% | 7.2% |
| Interquartile Range (IQR) | 1.8% | 3.7% |
| Standard Deviation (Sample) | 3.2% | 3.6% |
| Standard Deviation (Population) | 3.2% | 3.5% |
Similar Demographics by Married-Couple Family Poverty
Demographics Similar to Immigrants from Ethiopia by Married-Couple Family Poverty
In terms of married-couple family poverty, the demographic groups most similar to Immigrants from Ethiopia are Sri Lankan (5.1%, a difference of 0.040%), Delaware (5.1%, a difference of 0.19%), Argentinean (5.1%, a difference of 0.26%), Immigrants from South Eastern Asia (5.1%, a difference of 0.31%), and Immigrants from Saudi Arabia (5.1%, a difference of 0.31%).
| Demographics | Rating | Rank | Married-Couple Family Poverty |
| Immigrants | Russia | 78.7 /100 | #148 | Good 5.0% |
| Immigrants | Oceania | 78.6 /100 | #149 | Good 5.0% |
| Brazilians | 78.3 /100 | #150 | Good 5.0% |
| Immigrants | Cameroon | 77.3 /100 | #151 | Good 5.0% |
| Albanians | 77.2 /100 | #152 | Good 5.0% |
| Immigrants | Kuwait | 76.3 /100 | #153 | Good 5.0% |
| Delaware | 73.7 /100 | #154 | Good 5.1% |
| Immigrants | Ethiopia | 72.4 /100 | #155 | Good 5.1% |
| Sri Lankans | 72.2 /100 | #156 | Good 5.1% |
| Argentineans | 70.7 /100 | #157 | Good 5.1% |
| Immigrants | South Eastern Asia | 70.4 /100 | #158 | Good 5.1% |
| Immigrants | Saudi Arabia | 70.3 /100 | #159 | Good 5.1% |
| Pennsylvania Germans | 68.5 /100 | #160 | Good 5.1% |
| Ethiopians | 68.1 /100 | #161 | Good 5.1% |
| Immigrants | Jordan | 66.5 /100 | #162 | Good 5.1% |
Demographics Similar to Barbadians by Married-Couple Family Poverty
In terms of married-couple family poverty, the demographic groups most similar to Barbadians are Colville (6.3%, a difference of 0.050%), Choctaw (6.3%, a difference of 0.16%), Yaqui (6.3%, a difference of 0.62%), Indonesian (6.3%, a difference of 0.75%), and Trinidadian and Tobagonian (6.2%, a difference of 0.83%).
| Demographics | Rating | Rank | Married-Couple Family Poverty |
| Spanish Americans | 0.2 /100 | #267 | Tragic 6.2% |
| Alaska Natives | 0.2 /100 | #268 | Tragic 6.2% |
| Immigrants | West Indies | 0.1 /100 | #269 | Tragic 6.2% |
| Immigrants | Jamaica | 0.1 /100 | #270 | Tragic 6.2% |
| Immigrants | Bahamas | 0.1 /100 | #271 | Tragic 6.2% |
| Trinidadians and Tobagonians | 0.1 /100 | #272 | Tragic 6.2% |
| Colville | 0.1 /100 | #273 | Tragic 6.3% |
| Barbadians | 0.1 /100 | #274 | Tragic 6.3% |
| Choctaw | 0.1 /100 | #275 | Tragic 6.3% |
| Yaqui | 0.1 /100 | #276 | Tragic 6.3% |
| Indonesians | 0.1 /100 | #277 | Tragic 6.3% |
| Immigrants | Trinidad and Tobago | 0.1 /100 | #278 | Tragic 6.4% |
| Houma | 0.0 /100 | #279 | Tragic 6.4% |
| West Indians | 0.0 /100 | #280 | Tragic 6.4% |
| Mexican American Indians | 0.0 /100 | #281 | Tragic 6.4% |