Immigrants from Caribbean vs Ottawa Married-Couple Family Poverty
COMPARE
Immigrants from Caribbean
Ottawa
Married-Couple Family Poverty
Married-Couple Family Poverty Comparison
Immigrants from Caribbean
Ottawa
7.3%
MARRIED-COUPLE FAMILY POVERTY
0.0/ 100
METRIC RATING
321st/ 347
METRIC RANK
5.2%
MARRIED-COUPLE FAMILY POVERTY
54.5/ 100
METRIC RATING
169th/ 347
METRIC RANK
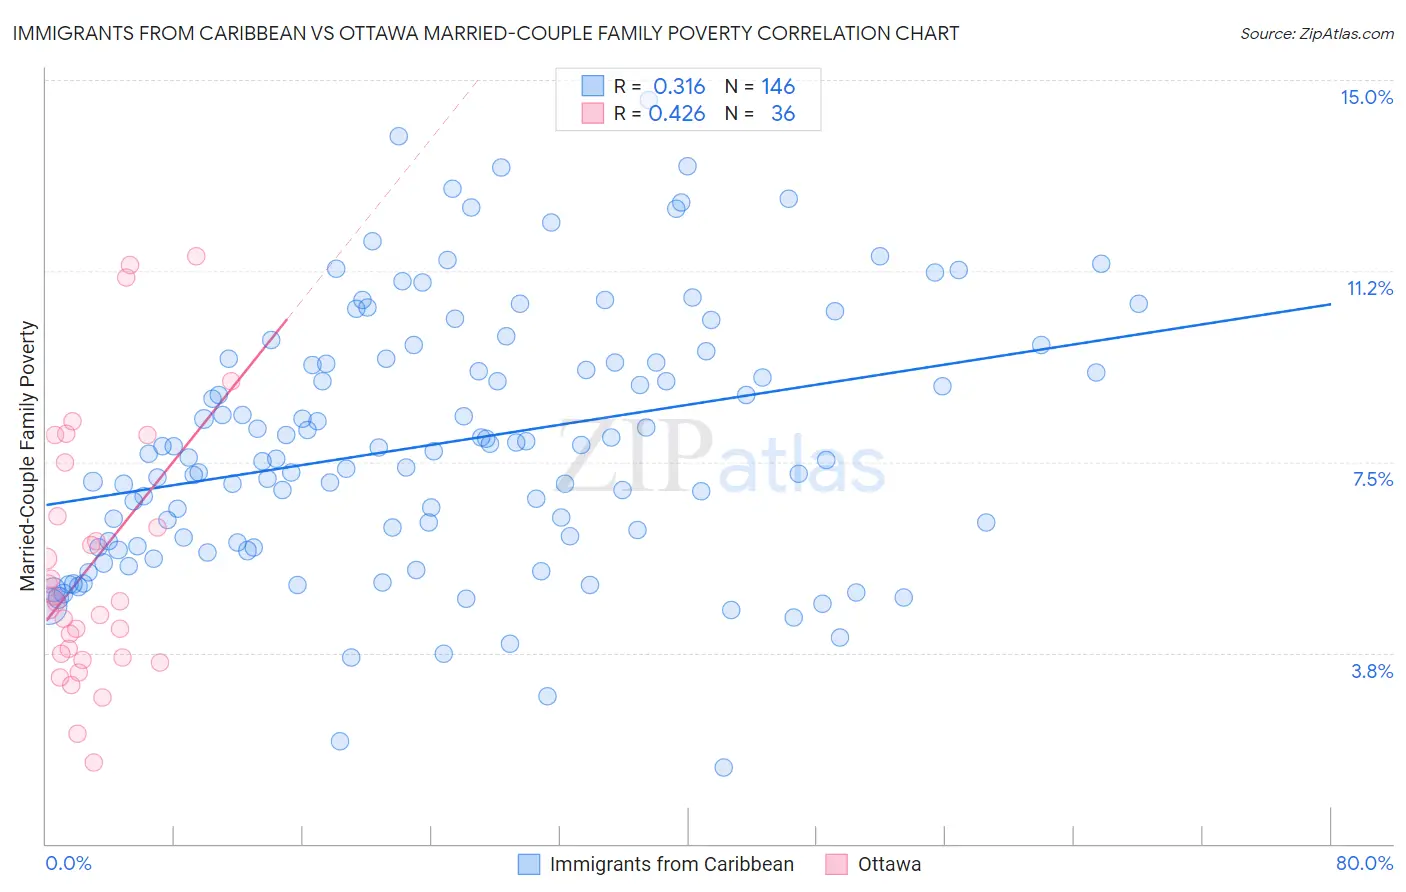
Immigrants from Caribbean vs Ottawa Married-Couple Family Poverty Correlation Chart
The statistical analysis conducted on geographies consisting of 444,708,318 people shows a mild positive correlation between the proportion of Immigrants from Caribbean and poverty level among married-couple families in the United States with a correlation coefficient (R) of 0.316 and weighted average of 7.3%. Similarly, the statistical analysis conducted on geographies consisting of 49,836,436 people shows a moderate positive correlation between the proportion of Ottawa and poverty level among married-couple families in the United States with a correlation coefficient (R) of 0.426 and weighted average of 5.2%, a difference of 41.5%.
Married-Couple Family Poverty Correlation Summary
| Measurement | Immigrants from Caribbean | Ottawa |
| Minimum | 1.5% | 1.6% |
| Maximum | 14.6% | 11.5% |
| Range | 13.1% | 10.0% |
| Mean | 7.9% | 5.5% |
| Median | 7.7% | 4.8% |
| Interquartile 25% (IQ1) | 5.9% | 3.7% |
| Interquartile 75% (IQ3) | 9.4% | 7.0% |
| Interquartile Range (IQR) | 3.5% | 3.3% |
| Standard Deviation (Sample) | 2.5% | 2.5% |
| Standard Deviation (Population) | 2.5% | 2.5% |
Similar Demographics by Married-Couple Family Poverty
Demographics Similar to Immigrants from Caribbean by Married-Couple Family Poverty
In terms of married-couple family poverty, the demographic groups most similar to Immigrants from Caribbean are Immigrants from Honduras (7.3%, a difference of 0.030%), Immigrants from Grenada (7.3%, a difference of 0.77%), Vietnamese (7.4%, a difference of 1.1%), Immigrants from Central America (7.4%, a difference of 1.2%), and Immigrants from Cuba (7.5%, a difference of 1.7%).
| Demographics | Rating | Rank | Married-Couple Family Poverty |
| British West Indians | 0.0 /100 | #314 | Tragic 7.1% |
| Inupiat | 0.0 /100 | #315 | Tragic 7.1% |
| Hondurans | 0.0 /100 | #316 | Tragic 7.2% |
| Mexicans | 0.0 /100 | #317 | Tragic 7.2% |
| Immigrants | Guatemala | 0.0 /100 | #318 | Tragic 7.2% |
| Immigrants | Latin America | 0.0 /100 | #319 | Tragic 7.2% |
| Immigrants | Grenada | 0.0 /100 | #320 | Tragic 7.3% |
| Immigrants | Caribbean | 0.0 /100 | #321 | Tragic 7.3% |
| Immigrants | Honduras | 0.0 /100 | #322 | Tragic 7.3% |
| Vietnamese | 0.0 /100 | #323 | Tragic 7.4% |
| Immigrants | Central America | 0.0 /100 | #324 | Tragic 7.4% |
| Immigrants | Cuba | 0.0 /100 | #325 | Tragic 7.5% |
| Immigrants | Bangladesh | 0.0 /100 | #326 | Tragic 7.5% |
| Hispanics or Latinos | 0.0 /100 | #327 | Tragic 7.5% |
| Immigrants | Mexico | 0.0 /100 | #328 | Tragic 7.6% |
Demographics Similar to Ottawa by Married-Couple Family Poverty
In terms of married-couple family poverty, the demographic groups most similar to Ottawa are Immigrants from Argentina (5.2%, a difference of 0.010%), Immigrants from Uganda (5.2%, a difference of 0.040%), Bermudan (5.2%, a difference of 0.19%), Immigrants from Northern Africa (5.2%, a difference of 0.37%), and Alsatian (5.2%, a difference of 0.39%).
| Demographics | Rating | Rank | Married-Couple Family Poverty |
| Immigrants | Jordan | 66.5 /100 | #162 | Good 5.1% |
| Sierra Leoneans | 64.1 /100 | #163 | Good 5.1% |
| Hawaiians | 62.3 /100 | #164 | Good 5.1% |
| Immigrants | Malaysia | 62.2 /100 | #165 | Good 5.1% |
| Paraguayans | 61.5 /100 | #166 | Good 5.1% |
| Costa Ricans | 61.5 /100 | #167 | Good 5.1% |
| Immigrants | Uganda | 54.9 /100 | #168 | Average 5.2% |
| Ottawa | 54.5 /100 | #169 | Average 5.2% |
| Immigrants | Argentina | 54.4 /100 | #170 | Average 5.2% |
| Bermudans | 52.9 /100 | #171 | Average 5.2% |
| Immigrants | Northern Africa | 51.3 /100 | #172 | Average 5.2% |
| Alsatians | 51.2 /100 | #173 | Average 5.2% |
| Immigrants | Eastern Africa | 50.0 /100 | #174 | Average 5.2% |
| Marshallese | 47.9 /100 | #175 | Average 5.2% |
| Menominee | 47.8 /100 | #176 | Average 5.2% |