Immigrants from Caribbean vs Yuman Married-Couple Family Poverty
COMPARE
Immigrants from Caribbean
Yuman
Married-Couple Family Poverty
Married-Couple Family Poverty Comparison
Immigrants from Caribbean
Yuman
7.3%
MARRIED-COUPLE FAMILY POVERTY
0.0/ 100
METRIC RATING
321st/ 347
METRIC RANK
9.7%
MARRIED-COUPLE FAMILY POVERTY
0.0/ 100
METRIC RATING
340th/ 347
METRIC RANK
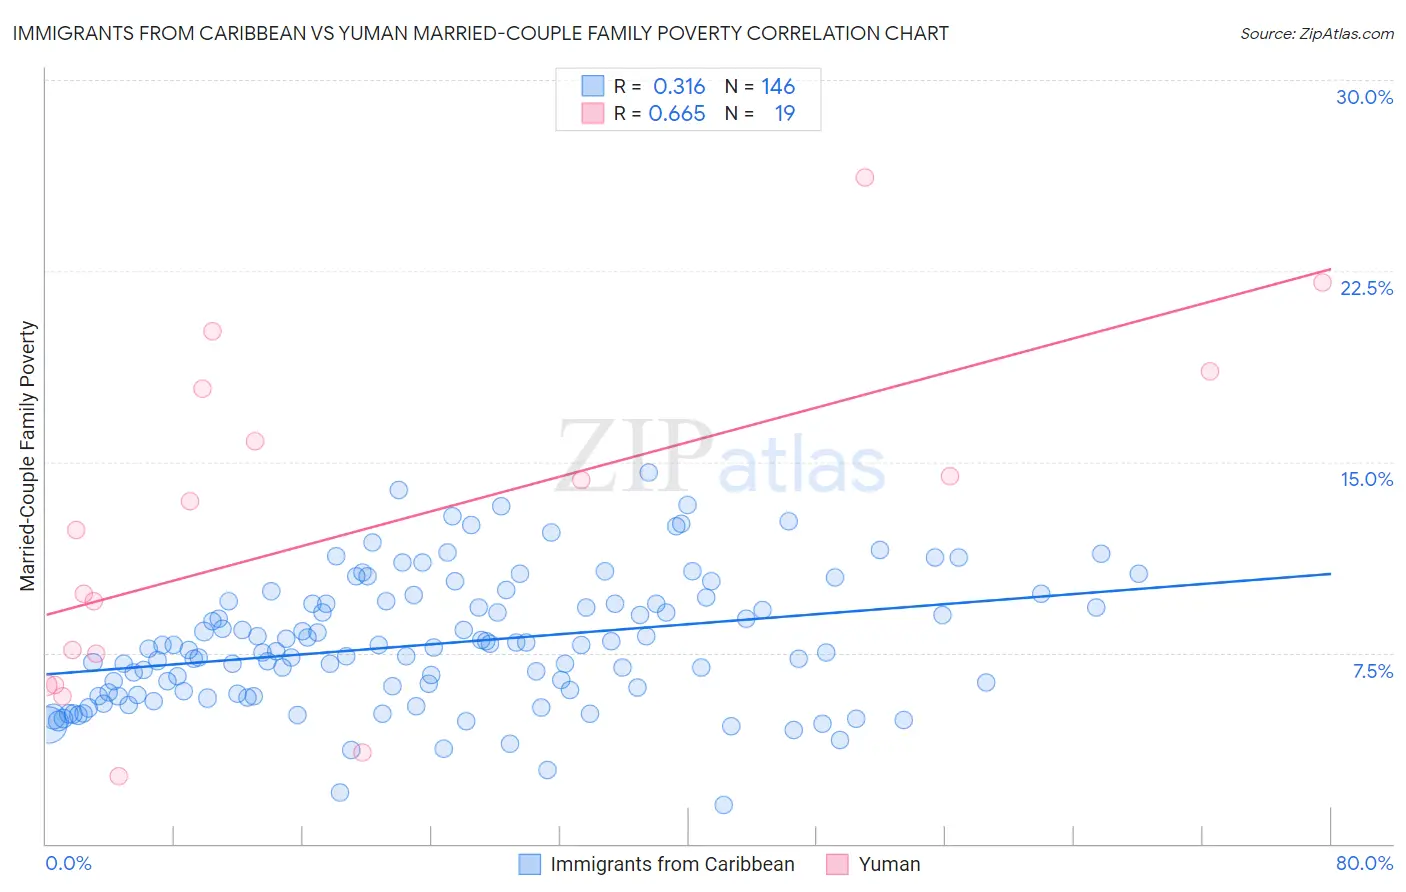
Immigrants from Caribbean vs Yuman Married-Couple Family Poverty Correlation Chart
The statistical analysis conducted on geographies consisting of 444,708,318 people shows a mild positive correlation between the proportion of Immigrants from Caribbean and poverty level among married-couple families in the United States with a correlation coefficient (R) of 0.316 and weighted average of 7.3%. Similarly, the statistical analysis conducted on geographies consisting of 40,644,577 people shows a significant positive correlation between the proportion of Yuman and poverty level among married-couple families in the United States with a correlation coefficient (R) of 0.665 and weighted average of 9.7%, a difference of 32.6%.
Married-Couple Family Poverty Correlation Summary
| Measurement | Immigrants from Caribbean | Yuman |
| Minimum | 1.5% | 2.7% |
| Maximum | 14.6% | 26.2% |
| Range | 13.1% | 23.5% |
| Mean | 7.9% | 12.3% |
| Median | 7.7% | 12.3% |
| Interquartile 25% (IQ1) | 5.9% | 6.2% |
| Interquartile 75% (IQ3) | 9.4% | 17.9% |
| Interquartile Range (IQR) | 3.5% | 11.6% |
| Standard Deviation (Sample) | 2.5% | 6.6% |
| Standard Deviation (Population) | 2.5% | 6.4% |
Demographics Similar to Immigrants from Caribbean and Yuman by Married-Couple Family Poverty
In terms of married-couple family poverty, the demographic groups most similar to Immigrants from Caribbean are Immigrants from Honduras (7.3%, a difference of 0.030%), Immigrants from Grenada (7.3%, a difference of 0.77%), Vietnamese (7.4%, a difference of 1.1%), Immigrants from Central America (7.4%, a difference of 1.2%), and Immigrants from Cuba (7.5%, a difference of 1.7%). Similarly, the demographic groups most similar to Yuman are Crow (9.6%, a difference of 1.8%), Cheyenne (9.4%, a difference of 3.2%), Yakama (9.0%, a difference of 8.7%), Apache (9.0%, a difference of 8.7%), and Sioux (8.7%, a difference of 11.9%).
| Demographics | Rating | Rank | Married-Couple Family Poverty |
| Immigrants | Grenada | 0.0 /100 | #320 | Tragic 7.3% |
| Immigrants | Caribbean | 0.0 /100 | #321 | Tragic 7.3% |
| Immigrants | Honduras | 0.0 /100 | #322 | Tragic 7.3% |
| Vietnamese | 0.0 /100 | #323 | Tragic 7.4% |
| Immigrants | Central America | 0.0 /100 | #324 | Tragic 7.4% |
| Immigrants | Cuba | 0.0 /100 | #325 | Tragic 7.5% |
| Immigrants | Bangladesh | 0.0 /100 | #326 | Tragic 7.5% |
| Hispanics or Latinos | 0.0 /100 | #327 | Tragic 7.5% |
| Immigrants | Mexico | 0.0 /100 | #328 | Tragic 7.6% |
| Natives/Alaskans | 0.0 /100 | #329 | Tragic 8.2% |
| Paiute | 0.0 /100 | #330 | Tragic 8.3% |
| Central American Indians | 0.0 /100 | #331 | Tragic 8.3% |
| Dominicans | 0.0 /100 | #332 | Tragic 8.3% |
| Lumbee | 0.0 /100 | #333 | Tragic 8.3% |
| Immigrants | Dominican Republic | 0.0 /100 | #334 | Tragic 8.4% |
| Sioux | 0.0 /100 | #335 | Tragic 8.7% |
| Apache | 0.0 /100 | #336 | Tragic 9.0% |
| Yakama | 0.0 /100 | #337 | Tragic 9.0% |
| Cheyenne | 0.0 /100 | #338 | Tragic 9.4% |
| Crow | 0.0 /100 | #339 | Tragic 9.6% |
| Yuman | 0.0 /100 | #340 | Tragic 9.7% |