Immigrants from Burma/Myanmar vs Immigrants from Denmark Married-Couple Family Poverty
COMPARE
Immigrants from Burma/Myanmar
Immigrants from Denmark
Married-Couple Family Poverty
Married-Couple Family Poverty Comparison
Immigrants from Burma/Myanmar
Immigrants from Denmark
6.0%
MARRIED-COUPLE FAMILY POVERTY
0.5/ 100
METRIC RATING
257th/ 347
METRIC RANK
4.6%
MARRIED-COUPLE FAMILY POVERTY
98.8/ 100
METRIC RATING
83rd/ 347
METRIC RANK
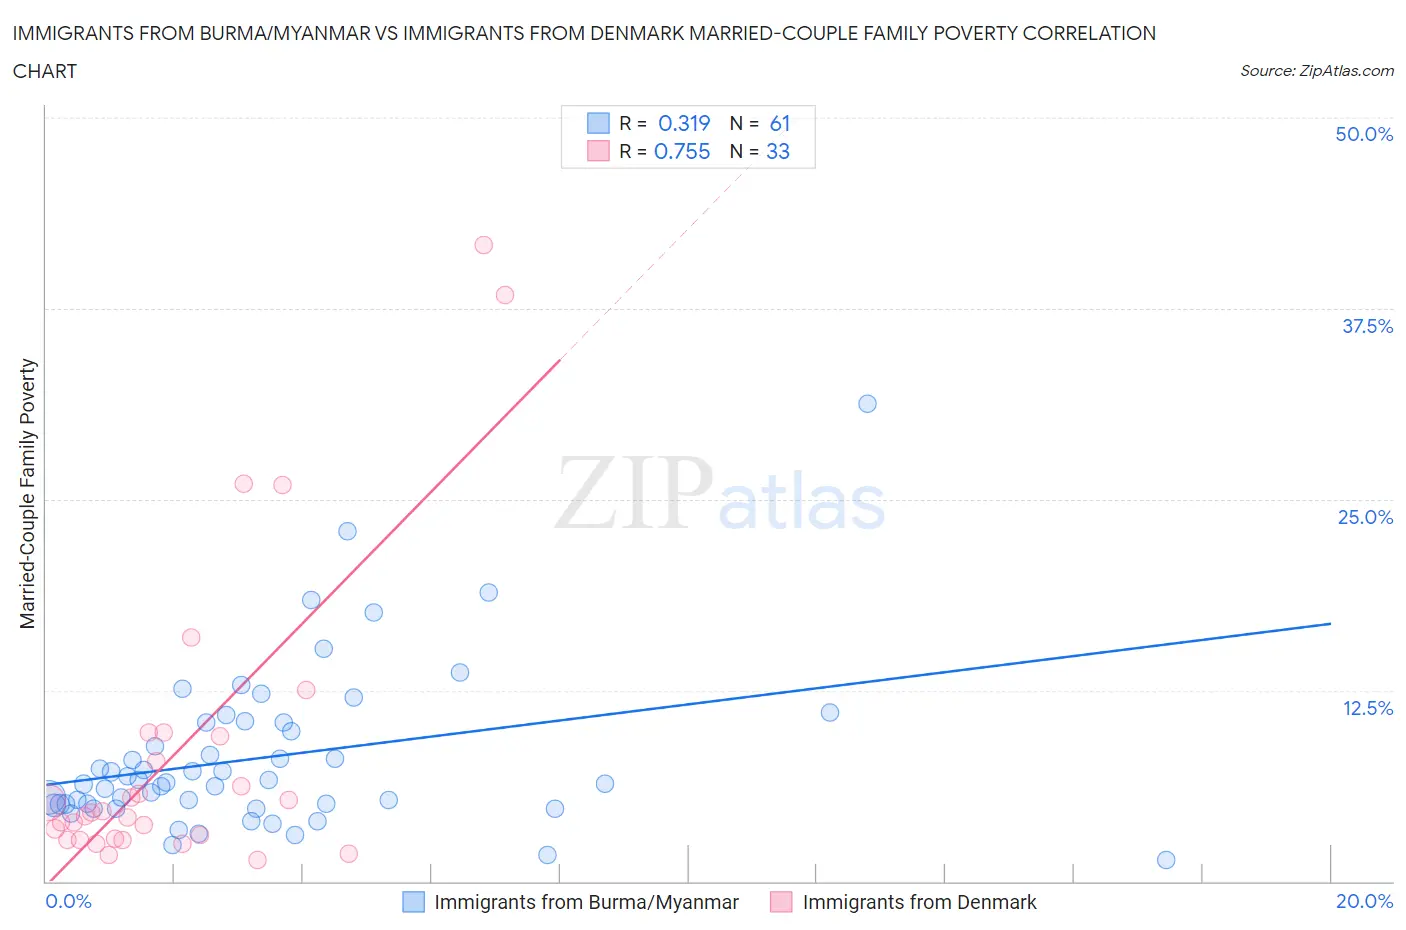
Immigrants from Burma/Myanmar vs Immigrants from Denmark Married-Couple Family Poverty Correlation Chart
The statistical analysis conducted on geographies consisting of 171,978,611 people shows a mild positive correlation between the proportion of Immigrants from Burma/Myanmar and poverty level among married-couple families in the United States with a correlation coefficient (R) of 0.319 and weighted average of 6.0%. Similarly, the statistical analysis conducted on geographies consisting of 135,843,951 people shows a strong positive correlation between the proportion of Immigrants from Denmark and poverty level among married-couple families in the United States with a correlation coefficient (R) of 0.755 and weighted average of 4.6%, a difference of 32.3%.
Married-Couple Family Poverty Correlation Summary
| Measurement | Immigrants from Burma/Myanmar | Immigrants from Denmark |
| Minimum | 1.4% | 1.4% |
| Maximum | 31.2% | 41.7% |
| Range | 29.8% | 40.3% |
| Mean | 8.1% | 8.5% |
| Median | 6.5% | 4.5% |
| Interquartile 25% (IQ1) | 5.0% | 2.8% |
| Interquartile 75% (IQ3) | 10.4% | 9.6% |
| Interquartile Range (IQR) | 5.4% | 6.8% |
| Standard Deviation (Sample) | 5.3% | 10.1% |
| Standard Deviation (Population) | 5.3% | 9.9% |
Similar Demographics by Married-Couple Family Poverty
Demographics Similar to Immigrants from Burma/Myanmar by Married-Couple Family Poverty
In terms of married-couple family poverty, the demographic groups most similar to Immigrants from Burma/Myanmar are Immigrants (6.0%, a difference of 0.13%), Bangladeshi (6.0%, a difference of 0.24%), Alaskan Athabascan (6.1%, a difference of 0.71%), Comanche (6.0%, a difference of 0.74%), and Immigrants from Somalia (6.0%, a difference of 0.89%).
| Demographics | Rating | Rank | Married-Couple Family Poverty |
| Immigrants | Eritrea | 1.1 /100 | #250 | Tragic 5.9% |
| Immigrants | Ghana | 1.0 /100 | #251 | Tragic 5.9% |
| Immigrants | Western Asia | 0.7 /100 | #252 | Tragic 6.0% |
| Africans | 0.7 /100 | #253 | Tragic 6.0% |
| Immigrants | Somalia | 0.7 /100 | #254 | Tragic 6.0% |
| Comanche | 0.7 /100 | #255 | Tragic 6.0% |
| Bangladeshis | 0.5 /100 | #256 | Tragic 6.0% |
| Immigrants | Burma/Myanmar | 0.5 /100 | #257 | Tragic 6.0% |
| Immigrants | Immigrants | 0.5 /100 | #258 | Tragic 6.0% |
| Alaskan Athabascans | 0.4 /100 | #259 | Tragic 6.1% |
| Jamaicans | 0.3 /100 | #260 | Tragic 6.1% |
| Senegalese | 0.3 /100 | #261 | Tragic 6.1% |
| Shoshone | 0.3 /100 | #262 | Tragic 6.1% |
| Immigrants | Senegal | 0.3 /100 | #263 | Tragic 6.1% |
| Immigrants | Congo | 0.2 /100 | #264 | Tragic 6.1% |
Demographics Similar to Immigrants from Denmark by Married-Couple Family Poverty
In terms of married-couple family poverty, the demographic groups most similar to Immigrants from Denmark are Immigrants from Croatia (4.6%, a difference of 0.13%), Canadian (4.5%, a difference of 0.16%), South African (4.6%, a difference of 0.36%), Immigrants from Turkey (4.6%, a difference of 0.40%), and Immigrants from Greece (4.5%, a difference of 0.41%).
| Demographics | Rating | Rank | Married-Couple Family Poverty |
| Immigrants | South Africa | 99.1 /100 | #76 | Exceptional 4.5% |
| Immigrants | Latvia | 99.1 /100 | #77 | Exceptional 4.5% |
| Scotch-Irish | 99.1 /100 | #78 | Exceptional 4.5% |
| Immigrants | Iran | 99.0 /100 | #79 | Exceptional 4.5% |
| Icelanders | 99.0 /100 | #80 | Exceptional 4.5% |
| Immigrants | Greece | 98.9 /100 | #81 | Exceptional 4.5% |
| Canadians | 98.8 /100 | #82 | Exceptional 4.5% |
| Immigrants | Denmark | 98.8 /100 | #83 | Exceptional 4.6% |
| Immigrants | Croatia | 98.7 /100 | #84 | Exceptional 4.6% |
| South Africans | 98.7 /100 | #85 | Exceptional 4.6% |
| Immigrants | Turkey | 98.6 /100 | #86 | Exceptional 4.6% |
| Immigrants | North Macedonia | 98.6 /100 | #87 | Exceptional 4.6% |
| Bolivians | 98.6 /100 | #88 | Exceptional 4.6% |
| Immigrants | Czechoslovakia | 98.5 /100 | #89 | Exceptional 4.6% |
| Immigrants | Switzerland | 98.5 /100 | #90 | Exceptional 4.6% |