Guatemalan vs Immigrants from Sri Lanka Married-Couple Family Poverty
COMPARE
Guatemalan
Immigrants from Sri Lanka
Married-Couple Family Poverty
Married-Couple Family Poverty Comparison
Guatemalans
Immigrants from Sri Lanka
7.0%
MARRIED-COUPLE FAMILY POVERTY
0.0/ 100
METRIC RATING
307th/ 347
METRIC RANK
4.4%
MARRIED-COUPLE FAMILY POVERTY
99.6/ 100
METRIC RATING
63rd/ 347
METRIC RANK
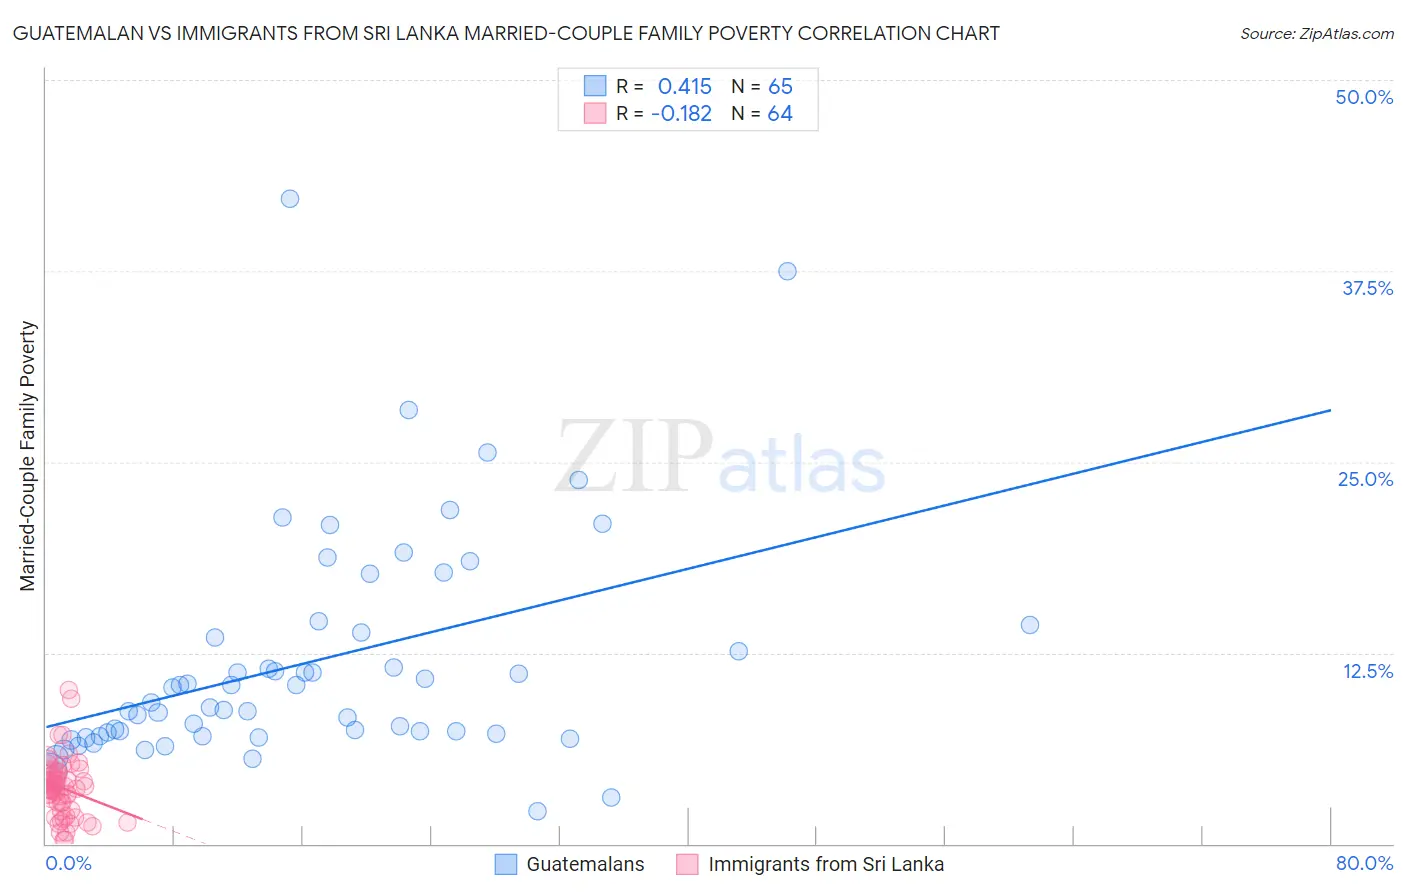
Guatemalan vs Immigrants from Sri Lanka Married-Couple Family Poverty Correlation Chart
The statistical analysis conducted on geographies consisting of 406,520,979 people shows a moderate positive correlation between the proportion of Guatemalans and poverty level among married-couple families in the United States with a correlation coefficient (R) of 0.415 and weighted average of 7.0%. Similarly, the statistical analysis conducted on geographies consisting of 149,331,706 people shows a poor negative correlation between the proportion of Immigrants from Sri Lanka and poverty level among married-couple families in the United States with a correlation coefficient (R) of -0.182 and weighted average of 4.4%, a difference of 60.0%.
Married-Couple Family Poverty Correlation Summary
| Measurement | Guatemalan | Immigrants from Sri Lanka |
| Minimum | 2.1% | 0.22% |
| Maximum | 42.2% | 10.1% |
| Range | 40.1% | 9.9% |
| Mean | 11.9% | 3.7% |
| Median | 9.3% | 3.7% |
| Interquartile 25% (IQ1) | 7.1% | 2.5% |
| Interquartile 75% (IQ3) | 14.1% | 4.6% |
| Interquartile Range (IQR) | 7.0% | 2.2% |
| Standard Deviation (Sample) | 7.5% | 1.9% |
| Standard Deviation (Population) | 7.5% | 1.9% |
Similar Demographics by Married-Couple Family Poverty
Demographics Similar to Guatemalans by Married-Couple Family Poverty
In terms of married-couple family poverty, the demographic groups most similar to Guatemalans are Spanish American Indian (7.1%, a difference of 0.18%), Hopi (7.1%, a difference of 0.78%), Immigrants from Nicaragua (7.1%, a difference of 0.81%), Immigrants from Dominica (7.1%, a difference of 0.86%), and Immigrants from Armenia (7.1%, a difference of 0.86%).
| Demographics | Rating | Rank | Married-Couple Family Poverty |
| Immigrants | Belize | 0.0 /100 | #300 | Tragic 6.7% |
| Central Americans | 0.0 /100 | #301 | Tragic 6.7% |
| Immigrants | Ecuador | 0.0 /100 | #302 | Tragic 6.7% |
| Immigrants | El Salvador | 0.0 /100 | #303 | Tragic 6.8% |
| Cubans | 0.0 /100 | #304 | Tragic 6.8% |
| Haitians | 0.0 /100 | #305 | Tragic 6.8% |
| Immigrants | Haiti | 0.0 /100 | #306 | Tragic 7.0% |
| Guatemalans | 0.0 /100 | #307 | Tragic 7.0% |
| Spanish American Indians | 0.0 /100 | #308 | Tragic 7.1% |
| Hopi | 0.0 /100 | #309 | Tragic 7.1% |
| Immigrants | Nicaragua | 0.0 /100 | #310 | Tragic 7.1% |
| Immigrants | Dominica | 0.0 /100 | #311 | Tragic 7.1% |
| Immigrants | Armenia | 0.0 /100 | #312 | Tragic 7.1% |
| Immigrants | St. Vincent and the Grenadines | 0.0 /100 | #313 | Tragic 7.1% |
| British West Indians | 0.0 /100 | #314 | Tragic 7.1% |
Demographics Similar to Immigrants from Sri Lanka by Married-Couple Family Poverty
In terms of married-couple family poverty, the demographic groups most similar to Immigrants from Sri Lanka are Immigrants from Australia (4.4%, a difference of 0.36%), Okinawan (4.4%, a difference of 0.37%), Immigrants from Bulgaria (4.4%, a difference of 0.41%), Tlingit-Haida (4.4%, a difference of 0.49%), and Immigrants from Sweden (4.4%, a difference of 0.56%).
| Demographics | Rating | Rank | Married-Couple Family Poverty |
| Immigrants | Zimbabwe | 99.7 /100 | #56 | Exceptional 4.3% |
| Immigrants | Netherlands | 99.7 /100 | #57 | Exceptional 4.3% |
| Czechoslovakians | 99.7 /100 | #58 | Exceptional 4.4% |
| Immigrants | Sweden | 99.6 /100 | #59 | Exceptional 4.4% |
| Tlingit-Haida | 99.6 /100 | #60 | Exceptional 4.4% |
| Okinawans | 99.6 /100 | #61 | Exceptional 4.4% |
| Immigrants | Australia | 99.6 /100 | #62 | Exceptional 4.4% |
| Immigrants | Sri Lanka | 99.6 /100 | #63 | Exceptional 4.4% |
| Immigrants | Bulgaria | 99.5 /100 | #64 | Exceptional 4.4% |
| Macedonians | 99.4 /100 | #65 | Exceptional 4.4% |
| Immigrants | Serbia | 99.4 /100 | #66 | Exceptional 4.4% |
| Immigrants | Canada | 99.4 /100 | #67 | Exceptional 4.4% |
| Slavs | 99.4 /100 | #68 | Exceptional 4.4% |
| New Zealanders | 99.4 /100 | #69 | Exceptional 4.4% |
| Immigrants | Korea | 99.4 /100 | #70 | Exceptional 4.5% |