Chinese vs Immigrants from Bahamas Single Male Poverty
COMPARE
Chinese
Immigrants from Bahamas
Single Male Poverty
Single Male Poverty Comparison
Chinese
Immigrants from Bahamas
11.0%
SINGLE MALE POVERTY
100.0/ 100
METRIC RATING
14th/ 347
METRIC RANK
14.4%
SINGLE MALE POVERTY
0.0/ 100
METRIC RATING
284th/ 347
METRIC RANK
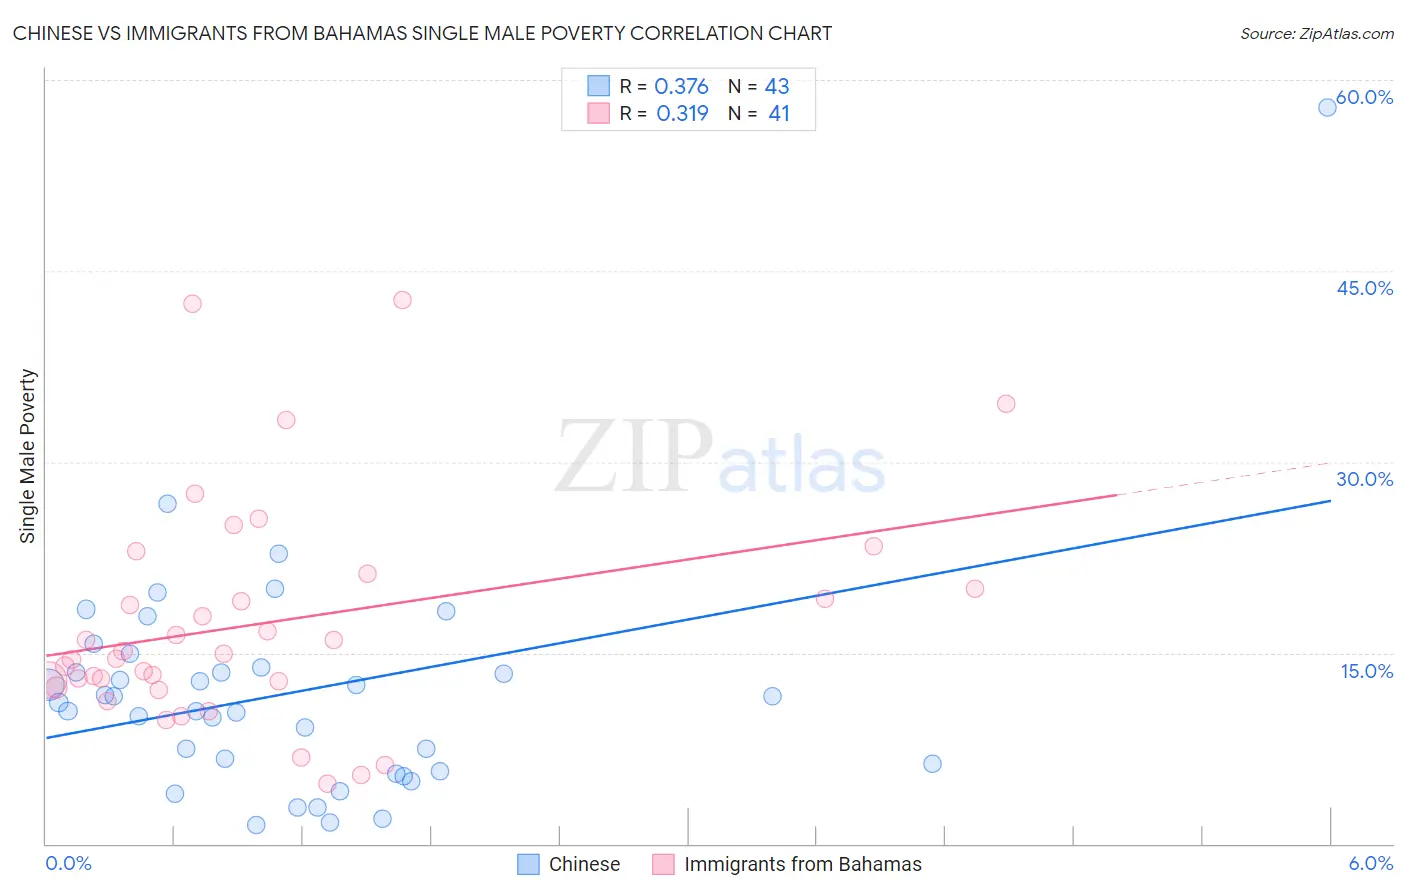
Chinese vs Immigrants from Bahamas Single Male Poverty Correlation Chart
The statistical analysis conducted on geographies consisting of 62,746,830 people shows a mild positive correlation between the proportion of Chinese and poverty level among single males in the United States with a correlation coefficient (R) of 0.376 and weighted average of 11.0%. Similarly, the statistical analysis conducted on geographies consisting of 101,111,257 people shows a mild positive correlation between the proportion of Immigrants from Bahamas and poverty level among single males in the United States with a correlation coefficient (R) of 0.319 and weighted average of 14.4%, a difference of 31.1%.
Single Male Poverty Correlation Summary
| Measurement | Chinese | Immigrants from Bahamas |
| Minimum | 1.5% | 4.7% |
| Maximum | 57.9% | 42.7% |
| Range | 56.4% | 38.1% |
| Mean | 11.9% | 17.4% |
| Median | 11.1% | 14.9% |
| Interquartile 25% (IQ1) | 5.7% | 12.5% |
| Interquartile 75% (IQ3) | 13.8% | 20.6% |
| Interquartile Range (IQR) | 8.1% | 8.1% |
| Standard Deviation (Sample) | 9.3% | 8.8% |
| Standard Deviation (Population) | 9.2% | 8.7% |
Similar Demographics by Single Male Poverty
Demographics Similar to Chinese by Single Male Poverty
In terms of single male poverty, the demographic groups most similar to Chinese are Korean (11.0%, a difference of 0.050%), Immigrants from South Central Asia (10.9%, a difference of 0.57%), Immigrants from Afghanistan (10.9%, a difference of 0.69%), Immigrants from Philippines (10.9%, a difference of 0.76%), and Immigrants from Fiji (10.9%, a difference of 0.78%).
| Demographics | Rating | Rank | Single Male Poverty |
| Afghans | 100.0 /100 | #7 | Exceptional 10.7% |
| Thais | 100.0 /100 | #8 | Exceptional 10.8% |
| Taiwanese | 100.0 /100 | #9 | Exceptional 10.9% |
| Immigrants | Fiji | 100.0 /100 | #10 | Exceptional 10.9% |
| Immigrants | Philippines | 100.0 /100 | #11 | Exceptional 10.9% |
| Immigrants | Afghanistan | 100.0 /100 | #12 | Exceptional 10.9% |
| Immigrants | South Central Asia | 100.0 /100 | #13 | Exceptional 10.9% |
| Chinese | 100.0 /100 | #14 | Exceptional 11.0% |
| Koreans | 100.0 /100 | #15 | Exceptional 11.0% |
| Bhutanese | 100.0 /100 | #16 | Exceptional 11.1% |
| Tsimshian | 100.0 /100 | #17 | Exceptional 11.1% |
| Immigrants | Bolivia | 100.0 /100 | #18 | Exceptional 11.1% |
| Immigrants | Moldova | 100.0 /100 | #19 | Exceptional 11.2% |
| Ethiopians | 100.0 /100 | #20 | Exceptional 11.2% |
| Asians | 100.0 /100 | #21 | Exceptional 11.2% |
Demographics Similar to Immigrants from Bahamas by Single Male Poverty
In terms of single male poverty, the demographic groups most similar to Immigrants from Bahamas are French (14.4%, a difference of 0.13%), Celtic (14.5%, a difference of 0.46%), Iroquois (14.5%, a difference of 0.58%), White/Caucasian (14.5%, a difference of 0.59%), and Immigrants from Dominica (14.5%, a difference of 0.67%).
| Demographics | Rating | Rank | Single Male Poverty |
| Immigrants | Honduras | 0.0 /100 | #277 | Tragic 14.1% |
| Slovaks | 0.0 /100 | #278 | Tragic 14.1% |
| Indonesians | 0.0 /100 | #279 | Tragic 14.1% |
| Hmong | 0.0 /100 | #280 | Tragic 14.2% |
| Hispanics or Latinos | 0.0 /100 | #281 | Tragic 14.2% |
| Spanish Americans | 0.0 /100 | #282 | Tragic 14.2% |
| Yaqui | 0.0 /100 | #283 | Tragic 14.2% |
| Immigrants | Bahamas | 0.0 /100 | #284 | Tragic 14.4% |
| French | 0.0 /100 | #285 | Tragic 14.4% |
| Celtics | 0.0 /100 | #286 | Tragic 14.5% |
| Iroquois | 0.0 /100 | #287 | Tragic 14.5% |
| Whites/Caucasians | 0.0 /100 | #288 | Tragic 14.5% |
| Immigrants | Dominica | 0.0 /100 | #289 | Tragic 14.5% |
| U.S. Virgin Islanders | 0.0 /100 | #290 | Tragic 14.5% |
| Bahamians | 0.0 /100 | #291 | Tragic 14.6% |