Pima vs Immigrants from Bahamas Single Male Poverty
COMPARE
Pima
Immigrants from Bahamas
Single Male Poverty
Single Male Poverty Comparison
Pima
Immigrants from Bahamas
20.2%
SINGLE MALE POVERTY
0.0/ 100
METRIC RATING
334th/ 347
METRIC RANK
14.4%
SINGLE MALE POVERTY
0.0/ 100
METRIC RATING
284th/ 347
METRIC RANK
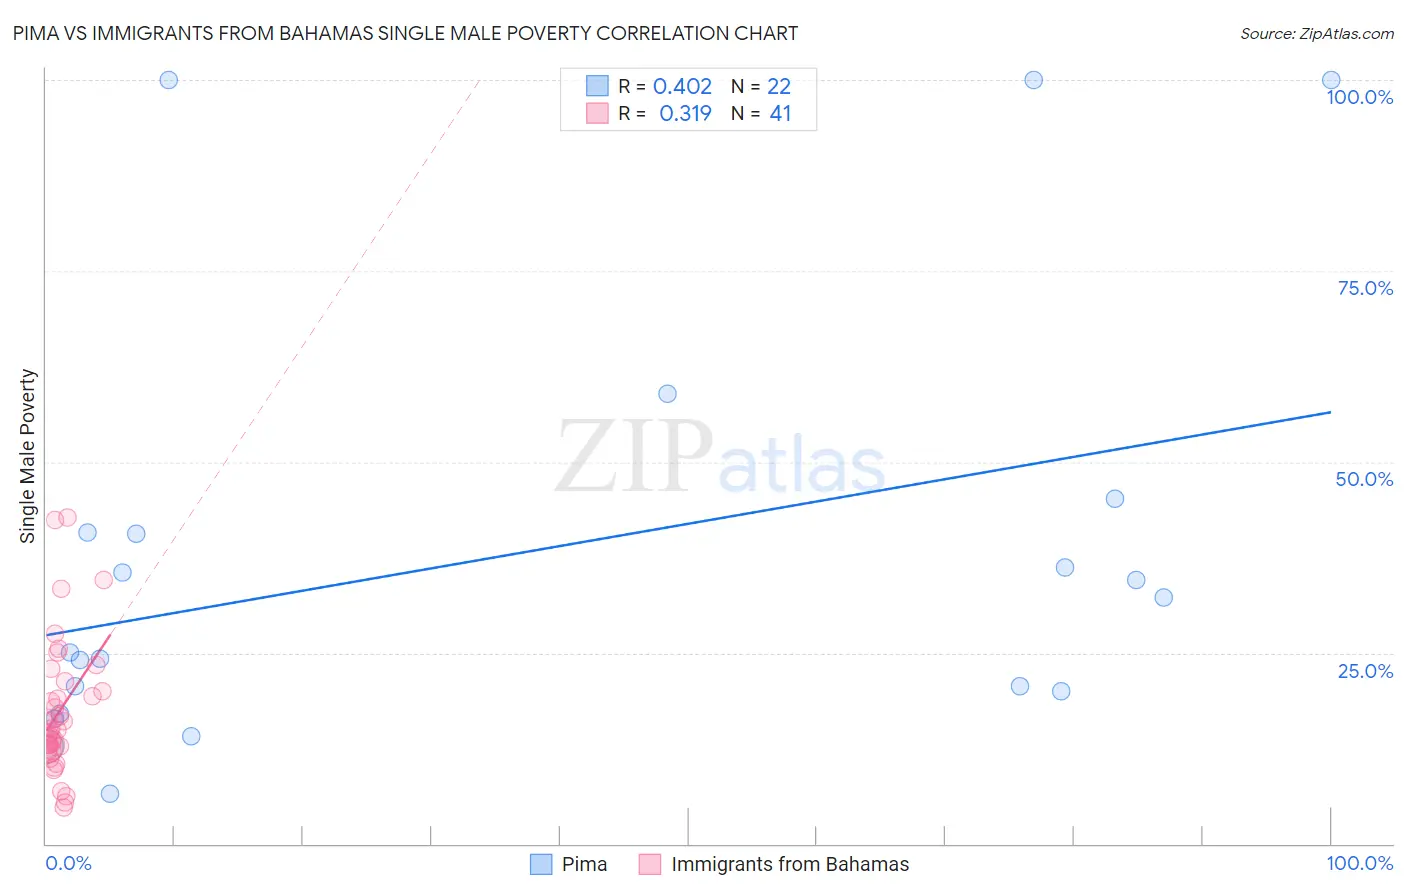
Pima vs Immigrants from Bahamas Single Male Poverty Correlation Chart
The statistical analysis conducted on geographies consisting of 60,152,261 people shows a moderate positive correlation between the proportion of Pima and poverty level among single males in the United States with a correlation coefficient (R) of 0.402 and weighted average of 20.2%. Similarly, the statistical analysis conducted on geographies consisting of 101,111,257 people shows a mild positive correlation between the proportion of Immigrants from Bahamas and poverty level among single males in the United States with a correlation coefficient (R) of 0.319 and weighted average of 14.4%, a difference of 39.9%.
Single Male Poverty Correlation Summary
| Measurement | Pima | Immigrants from Bahamas |
| Minimum | 6.5% | 4.7% |
| Maximum | 100.0% | 42.7% |
| Range | 93.5% | 38.1% |
| Mean | 37.5% | 17.4% |
| Median | 28.6% | 14.9% |
| Interquartile 25% (IQ1) | 20.0% | 12.5% |
| Interquartile 75% (IQ3) | 40.7% | 20.6% |
| Interquartile Range (IQR) | 20.7% | 8.1% |
| Standard Deviation (Sample) | 28.2% | 8.8% |
| Standard Deviation (Population) | 27.5% | 8.7% |
Similar Demographics by Single Male Poverty
Demographics Similar to Pima by Single Male Poverty
In terms of single male poverty, the demographic groups most similar to Pima are Inupiat (20.0%, a difference of 0.80%), Native/Alaskan (19.6%, a difference of 2.7%), Paiute (19.3%, a difference of 4.4%), Cajun (19.1%, a difference of 5.7%), and Yuman (21.3%, a difference of 5.7%).
| Demographics | Rating | Rank | Single Male Poverty |
| Menominee | 0.0 /100 | #327 | Tragic 17.7% |
| Kiowa | 0.0 /100 | #328 | Tragic 18.3% |
| Colville | 0.0 /100 | #329 | Tragic 18.4% |
| Cajuns | 0.0 /100 | #330 | Tragic 19.1% |
| Paiute | 0.0 /100 | #331 | Tragic 19.3% |
| Natives/Alaskans | 0.0 /100 | #332 | Tragic 19.6% |
| Inupiat | 0.0 /100 | #333 | Tragic 20.0% |
| Pima | 0.0 /100 | #334 | Tragic 20.2% |
| Yuman | 0.0 /100 | #335 | Tragic 21.3% |
| Tohono O'odham | 0.0 /100 | #336 | Tragic 21.6% |
| Apache | 0.0 /100 | #337 | Tragic 21.6% |
| Pueblo | 0.0 /100 | #338 | Tragic 21.6% |
| Arapaho | 0.0 /100 | #339 | Tragic 21.9% |
| Sioux | 0.0 /100 | #340 | Tragic 22.2% |
| Crow | 0.0 /100 | #341 | Tragic 23.3% |
Demographics Similar to Immigrants from Bahamas by Single Male Poverty
In terms of single male poverty, the demographic groups most similar to Immigrants from Bahamas are French (14.4%, a difference of 0.13%), Celtic (14.5%, a difference of 0.46%), Iroquois (14.5%, a difference of 0.58%), White/Caucasian (14.5%, a difference of 0.59%), and Immigrants from Dominica (14.5%, a difference of 0.67%).
| Demographics | Rating | Rank | Single Male Poverty |
| Immigrants | Honduras | 0.0 /100 | #277 | Tragic 14.1% |
| Slovaks | 0.0 /100 | #278 | Tragic 14.1% |
| Indonesians | 0.0 /100 | #279 | Tragic 14.1% |
| Hmong | 0.0 /100 | #280 | Tragic 14.2% |
| Hispanics or Latinos | 0.0 /100 | #281 | Tragic 14.2% |
| Spanish Americans | 0.0 /100 | #282 | Tragic 14.2% |
| Yaqui | 0.0 /100 | #283 | Tragic 14.2% |
| Immigrants | Bahamas | 0.0 /100 | #284 | Tragic 14.4% |
| French | 0.0 /100 | #285 | Tragic 14.4% |
| Celtics | 0.0 /100 | #286 | Tragic 14.5% |
| Iroquois | 0.0 /100 | #287 | Tragic 14.5% |
| Whites/Caucasians | 0.0 /100 | #288 | Tragic 14.5% |
| Immigrants | Dominica | 0.0 /100 | #289 | Tragic 14.5% |
| U.S. Virgin Islanders | 0.0 /100 | #290 | Tragic 14.5% |
| Bahamians | 0.0 /100 | #291 | Tragic 14.6% |