Chinese vs Immigrants from Panama Single Male Poverty
COMPARE
Chinese
Immigrants from Panama
Single Male Poverty
Single Male Poverty Comparison
Chinese
Immigrants from Panama
11.0%
SINGLE MALE POVERTY
100.0/ 100
METRIC RATING
14th/ 347
METRIC RANK
12.6%
SINGLE MALE POVERTY
72.1/ 100
METRIC RATING
150th/ 347
METRIC RANK
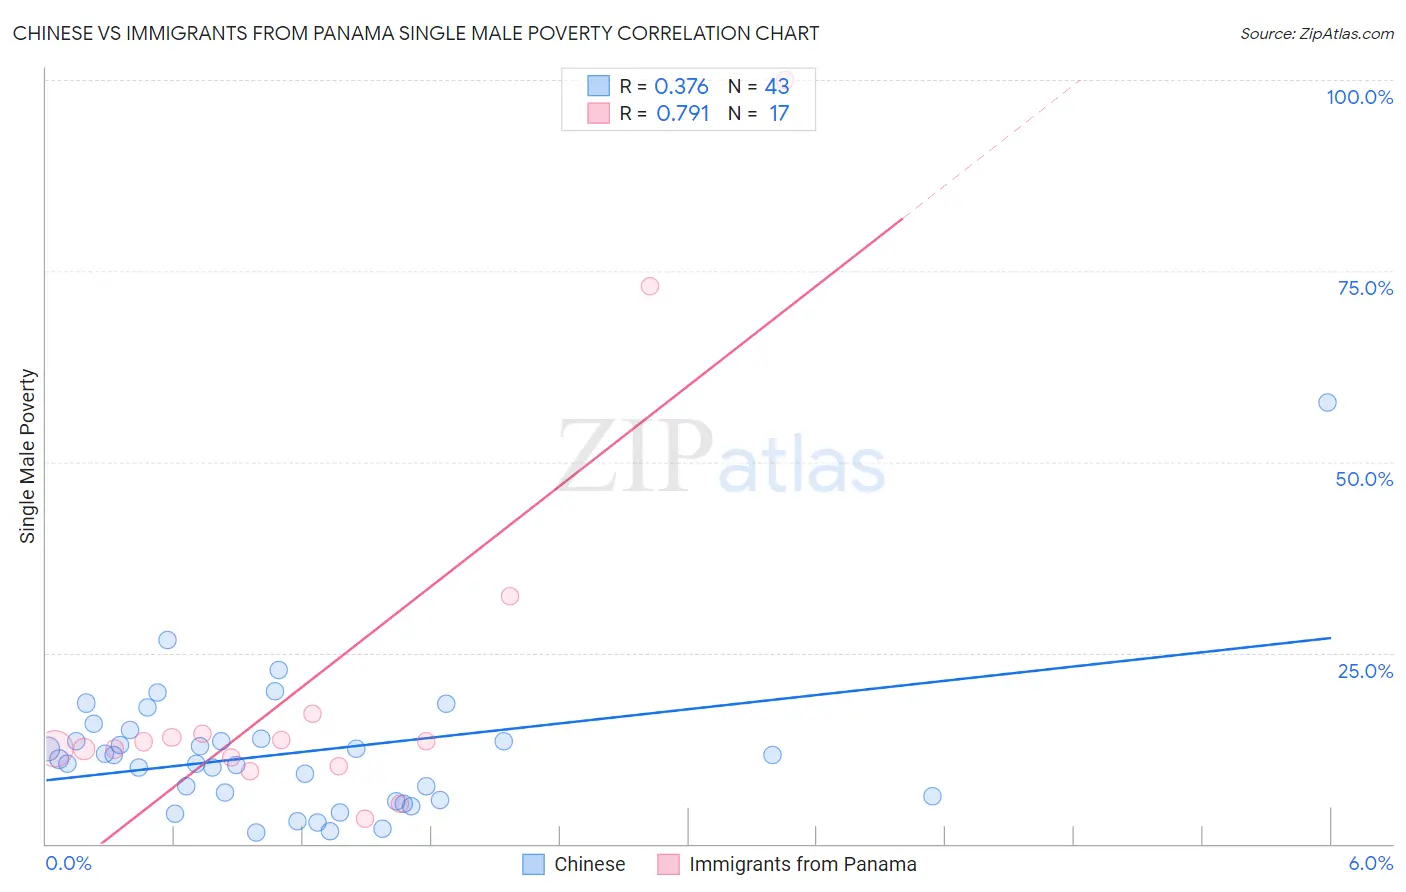
Chinese vs Immigrants from Panama Single Male Poverty Correlation Chart
The statistical analysis conducted on geographies consisting of 62,746,830 people shows a mild positive correlation between the proportion of Chinese and poverty level among single males in the United States with a correlation coefficient (R) of 0.376 and weighted average of 11.0%. Similarly, the statistical analysis conducted on geographies consisting of 206,693,503 people shows a strong positive correlation between the proportion of Immigrants from Panama and poverty level among single males in the United States with a correlation coefficient (R) of 0.791 and weighted average of 12.6%, a difference of 15.1%.
Single Male Poverty Correlation Summary
| Measurement | Chinese | Immigrants from Panama |
| Minimum | 1.5% | 3.3% |
| Maximum | 57.9% | 100.0% |
| Range | 56.4% | 96.7% |
| Mean | 11.9% | 21.6% |
| Median | 11.1% | 13.3% |
| Interquartile 25% (IQ1) | 5.7% | 10.7% |
| Interquartile 75% (IQ3) | 13.8% | 15.6% |
| Interquartile Range (IQR) | 8.1% | 4.9% |
| Standard Deviation (Sample) | 9.3% | 25.6% |
| Standard Deviation (Population) | 9.2% | 24.8% |
Similar Demographics by Single Male Poverty
Demographics Similar to Chinese by Single Male Poverty
In terms of single male poverty, the demographic groups most similar to Chinese are Korean (11.0%, a difference of 0.050%), Immigrants from South Central Asia (10.9%, a difference of 0.57%), Immigrants from Afghanistan (10.9%, a difference of 0.69%), Immigrants from Philippines (10.9%, a difference of 0.76%), and Immigrants from Fiji (10.9%, a difference of 0.78%).
| Demographics | Rating | Rank | Single Male Poverty |
| Afghans | 100.0 /100 | #7 | Exceptional 10.7% |
| Thais | 100.0 /100 | #8 | Exceptional 10.8% |
| Taiwanese | 100.0 /100 | #9 | Exceptional 10.9% |
| Immigrants | Fiji | 100.0 /100 | #10 | Exceptional 10.9% |
| Immigrants | Philippines | 100.0 /100 | #11 | Exceptional 10.9% |
| Immigrants | Afghanistan | 100.0 /100 | #12 | Exceptional 10.9% |
| Immigrants | South Central Asia | 100.0 /100 | #13 | Exceptional 10.9% |
| Chinese | 100.0 /100 | #14 | Exceptional 11.0% |
| Koreans | 100.0 /100 | #15 | Exceptional 11.0% |
| Bhutanese | 100.0 /100 | #16 | Exceptional 11.1% |
| Tsimshian | 100.0 /100 | #17 | Exceptional 11.1% |
| Immigrants | Bolivia | 100.0 /100 | #18 | Exceptional 11.1% |
| Immigrants | Moldova | 100.0 /100 | #19 | Exceptional 11.2% |
| Ethiopians | 100.0 /100 | #20 | Exceptional 11.2% |
| Asians | 100.0 /100 | #21 | Exceptional 11.2% |
Demographics Similar to Immigrants from Panama by Single Male Poverty
In terms of single male poverty, the demographic groups most similar to Immigrants from Panama are Immigrants from Hungary (12.6%, a difference of 0.010%), Australian (12.6%, a difference of 0.050%), Sierra Leonean (12.6%, a difference of 0.060%), Yugoslavian (12.6%, a difference of 0.13%), and Immigrants (12.7%, a difference of 0.13%).
| Demographics | Rating | Rank | Single Male Poverty |
| Immigrants | France | 75.8 /100 | #143 | Good 12.6% |
| Hawaiians | 75.1 /100 | #144 | Good 12.6% |
| Immigrants | Lebanon | 75.0 /100 | #145 | Good 12.6% |
| Native Hawaiians | 75.0 /100 | #146 | Good 12.6% |
| Malaysians | 74.8 /100 | #147 | Good 12.6% |
| Yugoslavians | 73.9 /100 | #148 | Good 12.6% |
| Sierra Leoneans | 73.0 /100 | #149 | Good 12.6% |
| Immigrants | Panama | 72.1 /100 | #150 | Good 12.6% |
| Immigrants | Hungary | 71.9 /100 | #151 | Good 12.6% |
| Australians | 71.4 /100 | #152 | Good 12.6% |
| Immigrants | Immigrants | 70.1 /100 | #153 | Good 12.7% |
| Immigrants | Scotland | 68.9 /100 | #154 | Good 12.7% |
| Immigrants | Spain | 68.7 /100 | #155 | Good 12.7% |
| Vietnamese | 67.9 /100 | #156 | Good 12.7% |
| Latvians | 67.9 /100 | #157 | Good 12.7% |