Chinese vs Spaniard Single Male Poverty
COMPARE
Chinese
Spaniard
Single Male Poverty
Single Male Poverty Comparison
Chinese
Spaniards
11.0%
SINGLE MALE POVERTY
100.0/ 100
METRIC RATING
14th/ 347
METRIC RANK
13.7%
SINGLE MALE POVERTY
0.4/ 100
METRIC RATING
255th/ 347
METRIC RANK
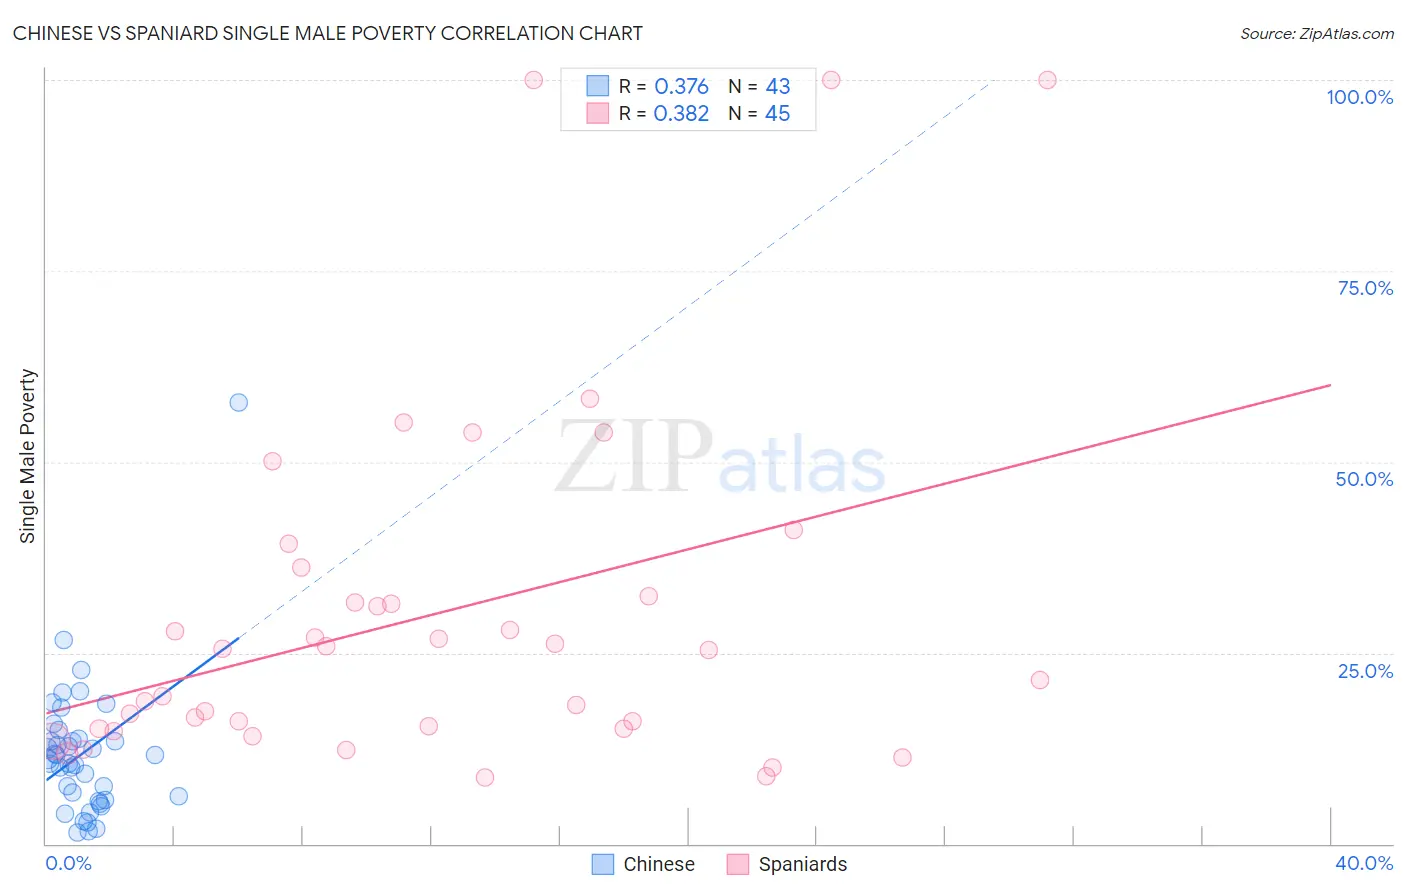
Chinese vs Spaniard Single Male Poverty Correlation Chart
The statistical analysis conducted on geographies consisting of 62,746,830 people shows a mild positive correlation between the proportion of Chinese and poverty level among single males in the United States with a correlation coefficient (R) of 0.376 and weighted average of 11.0%. Similarly, the statistical analysis conducted on geographies consisting of 390,345,278 people shows a mild positive correlation between the proportion of Spaniards and poverty level among single males in the United States with a correlation coefficient (R) of 0.382 and weighted average of 13.7%, a difference of 24.9%.
Single Male Poverty Correlation Summary
| Measurement | Chinese | Spaniard |
| Minimum | 1.5% | 8.7% |
| Maximum | 57.9% | 100.0% |
| Range | 56.4% | 91.3% |
| Mean | 11.9% | 30.0% |
| Median | 11.1% | 25.4% |
| Interquartile 25% (IQ1) | 5.7% | 15.0% |
| Interquartile 75% (IQ3) | 13.8% | 34.3% |
| Interquartile Range (IQR) | 8.1% | 19.3% |
| Standard Deviation (Sample) | 9.3% | 23.1% |
| Standard Deviation (Population) | 9.2% | 22.8% |
Similar Demographics by Single Male Poverty
Demographics Similar to Chinese by Single Male Poverty
In terms of single male poverty, the demographic groups most similar to Chinese are Korean (11.0%, a difference of 0.050%), Immigrants from South Central Asia (10.9%, a difference of 0.57%), Immigrants from Afghanistan (10.9%, a difference of 0.69%), Immigrants from Philippines (10.9%, a difference of 0.76%), and Immigrants from Fiji (10.9%, a difference of 0.78%).
| Demographics | Rating | Rank | Single Male Poverty |
| Afghans | 100.0 /100 | #7 | Exceptional 10.7% |
| Thais | 100.0 /100 | #8 | Exceptional 10.8% |
| Taiwanese | 100.0 /100 | #9 | Exceptional 10.9% |
| Immigrants | Fiji | 100.0 /100 | #10 | Exceptional 10.9% |
| Immigrants | Philippines | 100.0 /100 | #11 | Exceptional 10.9% |
| Immigrants | Afghanistan | 100.0 /100 | #12 | Exceptional 10.9% |
| Immigrants | South Central Asia | 100.0 /100 | #13 | Exceptional 10.9% |
| Chinese | 100.0 /100 | #14 | Exceptional 11.0% |
| Koreans | 100.0 /100 | #15 | Exceptional 11.0% |
| Bhutanese | 100.0 /100 | #16 | Exceptional 11.1% |
| Tsimshian | 100.0 /100 | #17 | Exceptional 11.1% |
| Immigrants | Bolivia | 100.0 /100 | #18 | Exceptional 11.1% |
| Immigrants | Moldova | 100.0 /100 | #19 | Exceptional 11.2% |
| Ethiopians | 100.0 /100 | #20 | Exceptional 11.2% |
| Asians | 100.0 /100 | #21 | Exceptional 11.2% |
Demographics Similar to Spaniards by Single Male Poverty
In terms of single male poverty, the demographic groups most similar to Spaniards are Immigrants from Belize (13.7%, a difference of 0.10%), Subsaharan African (13.7%, a difference of 0.11%), Immigrants from Central America (13.8%, a difference of 0.29%), Immigrants from Guatemala (13.8%, a difference of 0.35%), and Guatemalan (13.8%, a difference of 0.39%).
| Demographics | Rating | Rank | Single Male Poverty |
| Czechs | 1.2 /100 | #248 | Tragic 13.5% |
| Spanish | 1.0 /100 | #249 | Tragic 13.6% |
| Immigrants | Somalia | 1.0 /100 | #250 | Tragic 13.6% |
| Immigrants | Zaire | 0.9 /100 | #251 | Tragic 13.6% |
| Finns | 0.9 /100 | #252 | Tragic 13.6% |
| German Russians | 0.8 /100 | #253 | Tragic 13.6% |
| Sub-Saharan Africans | 0.5 /100 | #254 | Tragic 13.7% |
| Spaniards | 0.4 /100 | #255 | Tragic 13.7% |
| Immigrants | Belize | 0.4 /100 | #256 | Tragic 13.7% |
| Immigrants | Central America | 0.3 /100 | #257 | Tragic 13.8% |
| Immigrants | Guatemala | 0.3 /100 | #258 | Tragic 13.8% |
| Guatemalans | 0.3 /100 | #259 | Tragic 13.8% |
| Swiss | 0.3 /100 | #260 | Tragic 13.8% |
| Hungarians | 0.3 /100 | #261 | Tragic 13.8% |
| Fijians | 0.3 /100 | #262 | Tragic 13.8% |