Zip Codes with the Highest Percentage of Population Employed in Architecture & Engineering in Springfield, OR
RELATED REPORTS & OPTIONS
Architecture & Engineering
Springfield
Compare Zip Codes
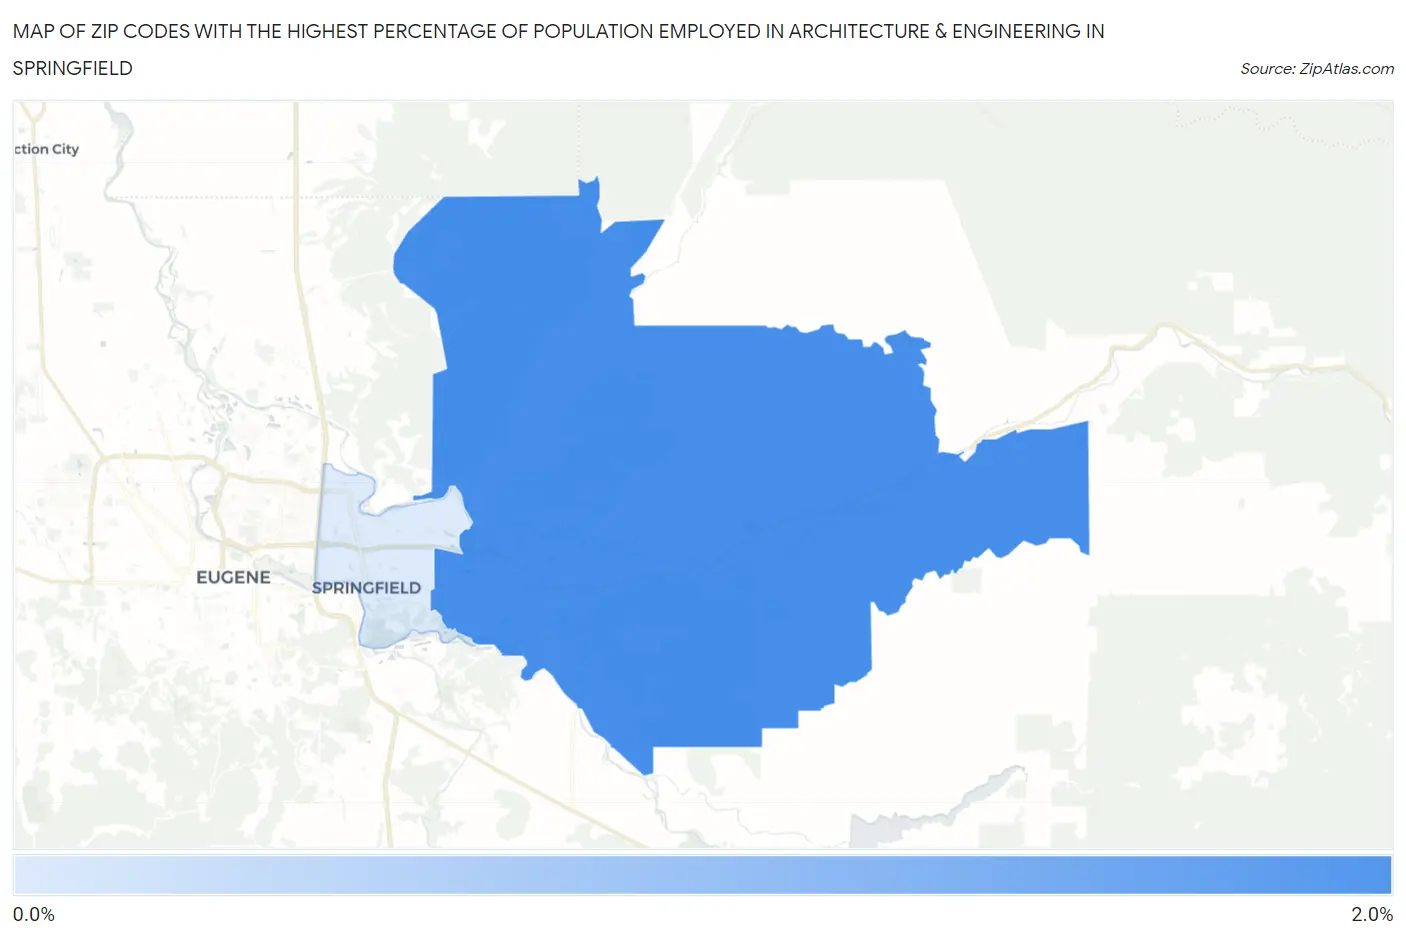
Map of Zip Codes with the Highest Percentage of Population Employed in Architecture & Engineering in Springfield
0.65%
1.8%
Zip Codes with the Highest Percentage of Population Employed in Architecture & Engineering in Springfield, OR
| Zip Code | % Employed | vs State | vs National | |
| 1. | 97478 | 1.8% | 2.8%(-1.06)#135 | 2.1%(-0.391)#11,085 |
| 2. | 97477 | 0.65% | 2.8%(-2.16)#222 | 2.1%(-1.49)#19,214 |
1
Common Questions
What are the Top Zip Codes with the Highest Percentage of Population Employed in Architecture & Engineering in Springfield, OR?
Top Zip Codes with the Highest Percentage of Population Employed in Architecture & Engineering in Springfield, OR are:
What zip code has the Highest Percentage of Population Employed in Architecture & Engineering in Springfield, OR?
97478 has the Highest Percentage of Population Employed in Architecture & Engineering in Springfield, OR with 1.8%.
What is the Percentage of Population Employed in Architecture & Engineering in Springfield, OR?
Percentage of Population Employed in Architecture & Engineering in Springfield is 1.1%.
What is the Percentage of Population Employed in Architecture & Engineering in Oregon?
Percentage of Population Employed in Architecture & Engineering in Oregon is 2.8%.
What is the Percentage of Population Employed in Architecture & Engineering in the United States?
Percentage of Population Employed in Architecture & Engineering in the United States is 2.1%.