Zip Codes with the Highest Percentage of Population Employed in Arts, Media & Entertainment in Springfield, OR
RELATED REPORTS & OPTIONS
Arts, Media & Entertainment
Springfield
Compare Zip Codes
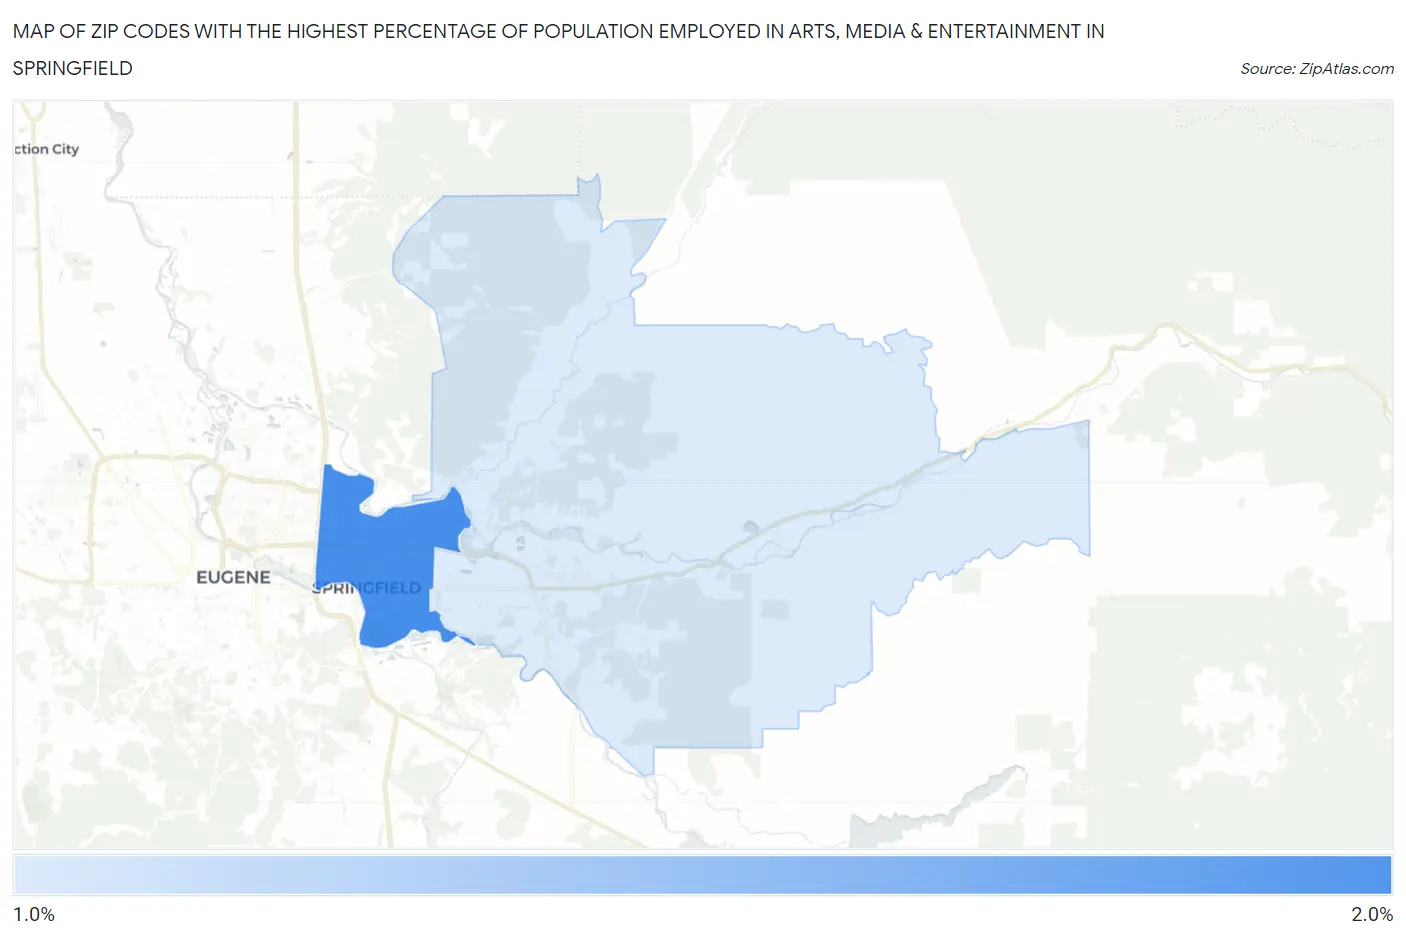
Map of Zip Codes with the Highest Percentage of Population Employed in Arts, Media & Entertainment in Springfield
1.2%
1.8%
Zip Codes with the Highest Percentage of Population Employed in Arts, Media & Entertainment in Springfield, OR
| Zip Code | % Employed | vs State | vs National | |
| 1. | 97477 | 1.8% | 2.5%(-0.687)#134 | 2.1%(-0.237)#8,839 |
| 2. | 97478 | 1.2% | 2.5%(-1.34)#193 | 2.1%(-0.894)#13,459 |
1
Common Questions
What are the Top Zip Codes with the Highest Percentage of Population Employed in Arts, Media & Entertainment in Springfield, OR?
Top Zip Codes with the Highest Percentage of Population Employed in Arts, Media & Entertainment in Springfield, OR are:
What zip code has the Highest Percentage of Population Employed in Arts, Media & Entertainment in Springfield, OR?
97477 has the Highest Percentage of Population Employed in Arts, Media & Entertainment in Springfield, OR with 1.8%.
What is the Percentage of Population Employed in Arts, Media & Entertainment in Springfield, OR?
Percentage of Population Employed in Arts, Media & Entertainment in Springfield is 1.6%.
What is the Percentage of Population Employed in Arts, Media & Entertainment in Oregon?
Percentage of Population Employed in Arts, Media & Entertainment in Oregon is 2.5%.
What is the Percentage of Population Employed in Arts, Media & Entertainment in the United States?
Percentage of Population Employed in Arts, Media & Entertainment in the United States is 2.1%.