Zip Codes with the Highest Percentage of Population Employed in Health Diagnosing & Treating in Gardnerville, NV
RELATED REPORTS & OPTIONS
Health Diagnosing & Treating
Gardnerville
Compare Zip Codes
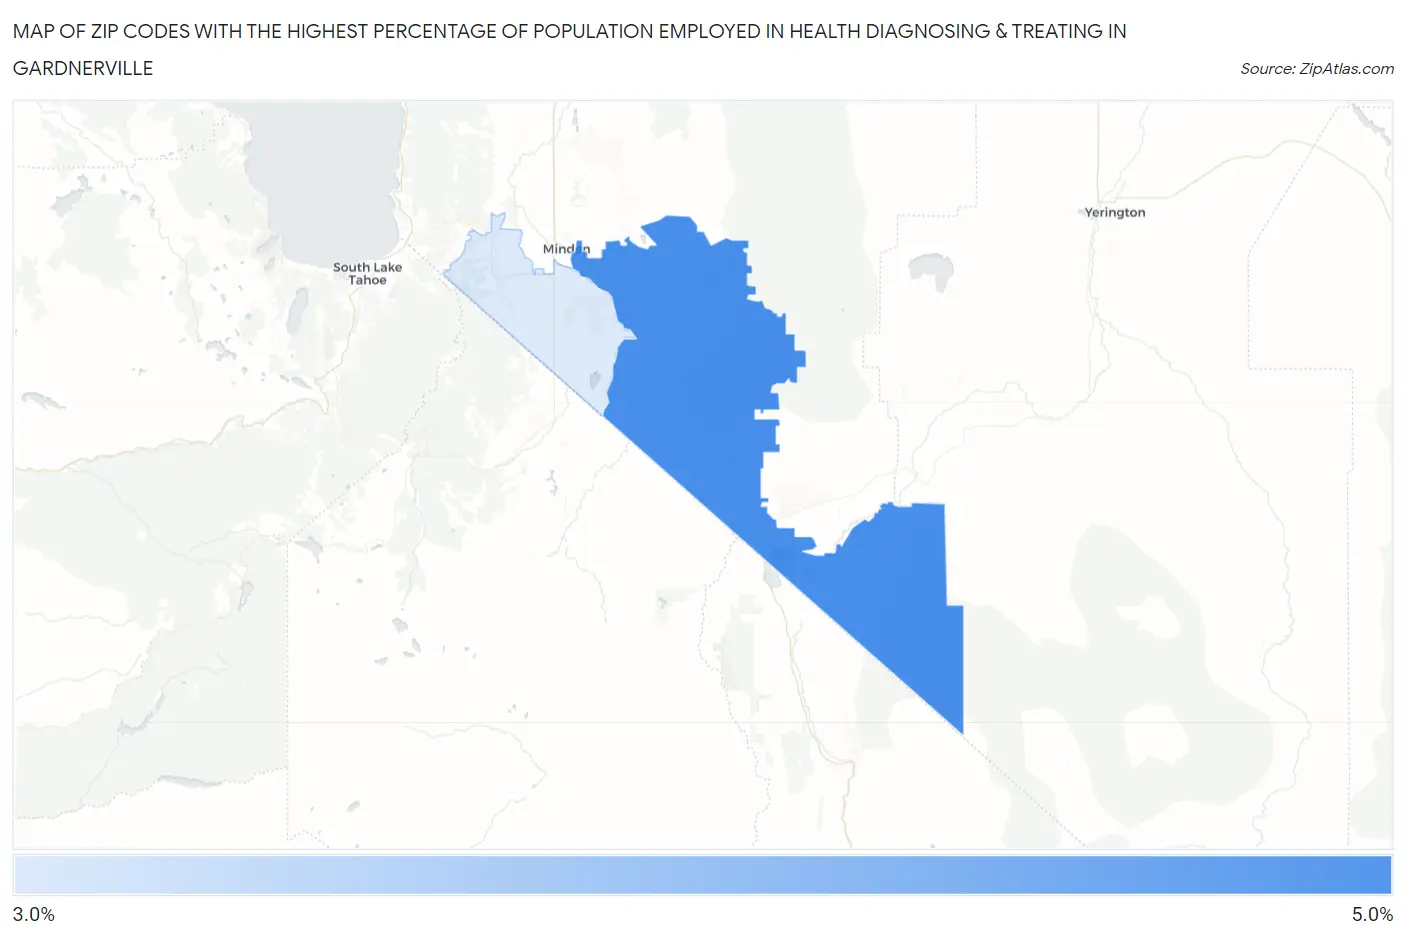
Map of Zip Codes with the Highest Percentage of Population Employed in Health Diagnosing & Treating in Gardnerville
3.2%
4.6%
Zip Codes with the Highest Percentage of Population Employed in Health Diagnosing & Treating in Gardnerville, NV
| Zip Code | % Employed | vs State | vs National | |
| 1. | 89410 | 4.6% | 4.9%(-0.325)#67 | 6.2%(-1.66)#19,307 |
| 2. | 89460 | 3.2% | 4.9%(-1.70)#92 | 6.2%(-3.03)#23,745 |
1
Common Questions
What are the Top Zip Codes with the Highest Percentage of Population Employed in Health Diagnosing & Treating in Gardnerville, NV?
Top Zip Codes with the Highest Percentage of Population Employed in Health Diagnosing & Treating in Gardnerville, NV are:
What zip code has the Highest Percentage of Population Employed in Health Diagnosing & Treating in Gardnerville, NV?
89410 has the Highest Percentage of Population Employed in Health Diagnosing & Treating in Gardnerville, NV with 4.6%.
What is the Percentage of Population Employed in Health Diagnosing & Treating in Gardnerville, NV?
Percentage of Population Employed in Health Diagnosing & Treating in Gardnerville is 3.6%.
What is the Percentage of Population Employed in Health Diagnosing & Treating in Nevada?
Percentage of Population Employed in Health Diagnosing & Treating in Nevada is 4.9%.
What is the Percentage of Population Employed in Health Diagnosing & Treating in the United States?
Percentage of Population Employed in Health Diagnosing & Treating in the United States is 6.2%.