Zip Codes with the Highest Percentage of Population Employed in Health Diagnosing & Treating in Pahrump, NV
RELATED REPORTS & OPTIONS
Health Diagnosing & Treating
Pahrump
Compare Zip Codes
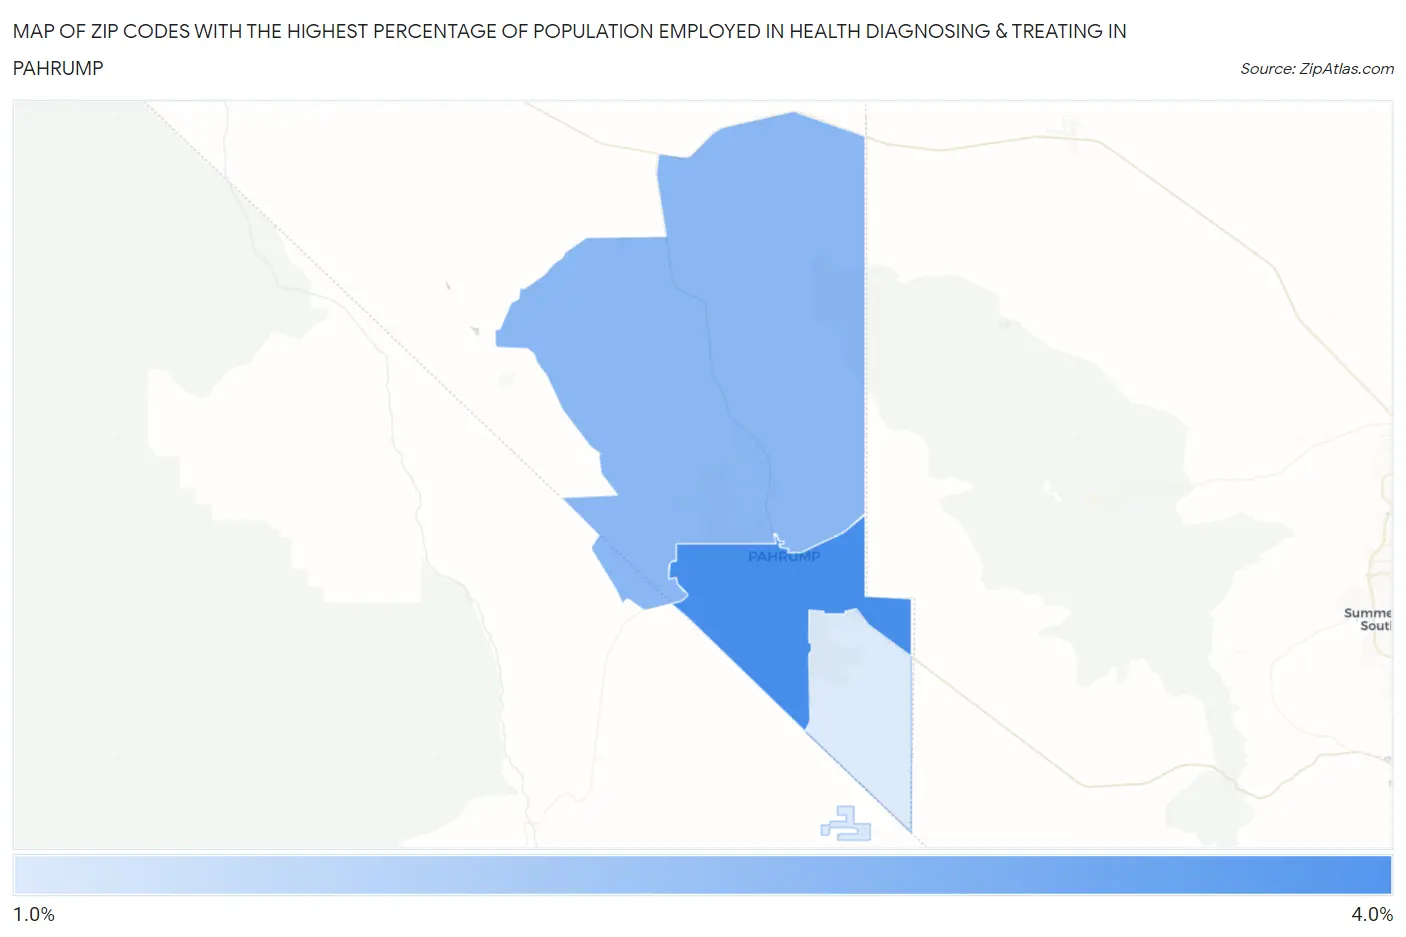
Map of Zip Codes with the Highest Percentage of Population Employed in Health Diagnosing & Treating in Pahrump
1.9%
3.3%
Zip Codes with the Highest Percentage of Population Employed in Health Diagnosing & Treating in Pahrump, NV
| Zip Code | % Employed | vs State | vs National | |
| 1. | 89048 | 3.3% | 4.9%(-1.64)#90 | 6.2%(-2.97)#23,572 |
| 2. | 89060 | 2.6% | 4.9%(-2.28)#102 | 6.2%(-3.61)#25,183 |
| 3. | 89061 | 1.9% | 4.9%(-3.05)#119 | 6.2%(-4.39)#26,708 |
1
Common Questions
What are the Top Zip Codes with the Highest Percentage of Population Employed in Health Diagnosing & Treating in Pahrump, NV?
Top Zip Codes with the Highest Percentage of Population Employed in Health Diagnosing & Treating in Pahrump, NV are:
What zip code has the Highest Percentage of Population Employed in Health Diagnosing & Treating in Pahrump, NV?
89048 has the Highest Percentage of Population Employed in Health Diagnosing & Treating in Pahrump, NV with 3.3%.
What is the Percentage of Population Employed in Health Diagnosing & Treating in Pahrump, NV?
Percentage of Population Employed in Health Diagnosing & Treating in Pahrump is 2.9%.
What is the Percentage of Population Employed in Health Diagnosing & Treating in Nevada?
Percentage of Population Employed in Health Diagnosing & Treating in Nevada is 4.9%.
What is the Percentage of Population Employed in Health Diagnosing & Treating in the United States?
Percentage of Population Employed in Health Diagnosing & Treating in the United States is 6.2%.