Clovis, NM Map & Demographics
Clovis Map
Clovis Overview
$27,905
PER CAPITA INCOME
$63,371
AVG FAMILY INCOME
$52,983
AVG HOUSEHOLD INCOME
42.5%
WAGE / INCOME GAP [ % ]
57.5¢/ $1
WAGE / INCOME GAP [ $ ]
$12,050
FAMILY INCOME DEFICIT
0.46
INEQUALITY / GINI INDEX
38,453
TOTAL POPULATION
19,608
MALE POPULATION
18,845
FEMALE POPULATION
104.05
MALES / 100 FEMALES
96.11
FEMALES / 100 MALES
31.7
MEDIAN AGE
3.2
AVG FAMILY SIZE
2.5
AVG HOUSEHOLD SIZE
18,439
LABOR FORCE [ PEOPLE ]
62.7%
PERCENT IN LABOR FORCE
8.4%
UNEMPLOYMENT RATE
Clovis Zip Codes
Income in Clovis
Income Overview in Clovis
Per Capita Income in Clovis is $27,905, while median incomes of families and households are $63,371 and $52,983 respectively.
| Characteristic | Number | Measure |
| Per Capita Income | 38,453 | $27,905 |
| Median Family Income | 9,144 | $63,371 |
| Mean Family Income | 9,144 | $81,066 |
| Median Household Income | 15,031 | $52,983 |
| Mean Household Income | 15,031 | $68,851 |
| Income Deficit | 9,144 | $12,050 |
| Wage / Income Gap (%) | 38,453 | 42.53% |
| Wage / Income Gap ($) | 38,453 | 57.47¢ per $1 |
| Gini / Inequality Index | 38,453 | 0.46 |
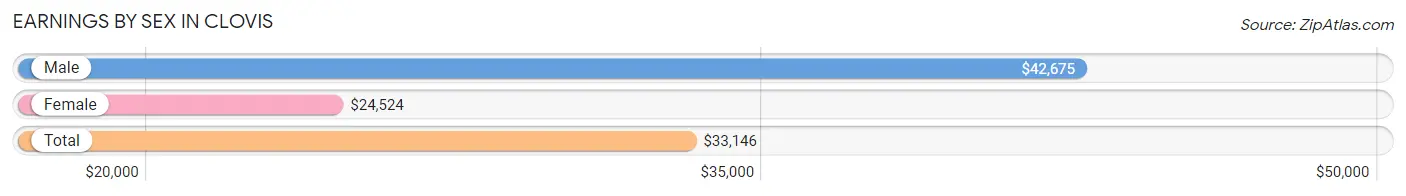
Earnings by Sex in Clovis
Average Earnings in Clovis are $33,146, $42,675 for men and $24,524 for women, a difference of 42.5%.
| Sex | Number | Average Earnings |
| Male | 10,956 (57.0%) | $42,675 |
| Female | 8,266 (43.0%) | $24,524 |
| Total | 19,222 (100.0%) | $33,146 |
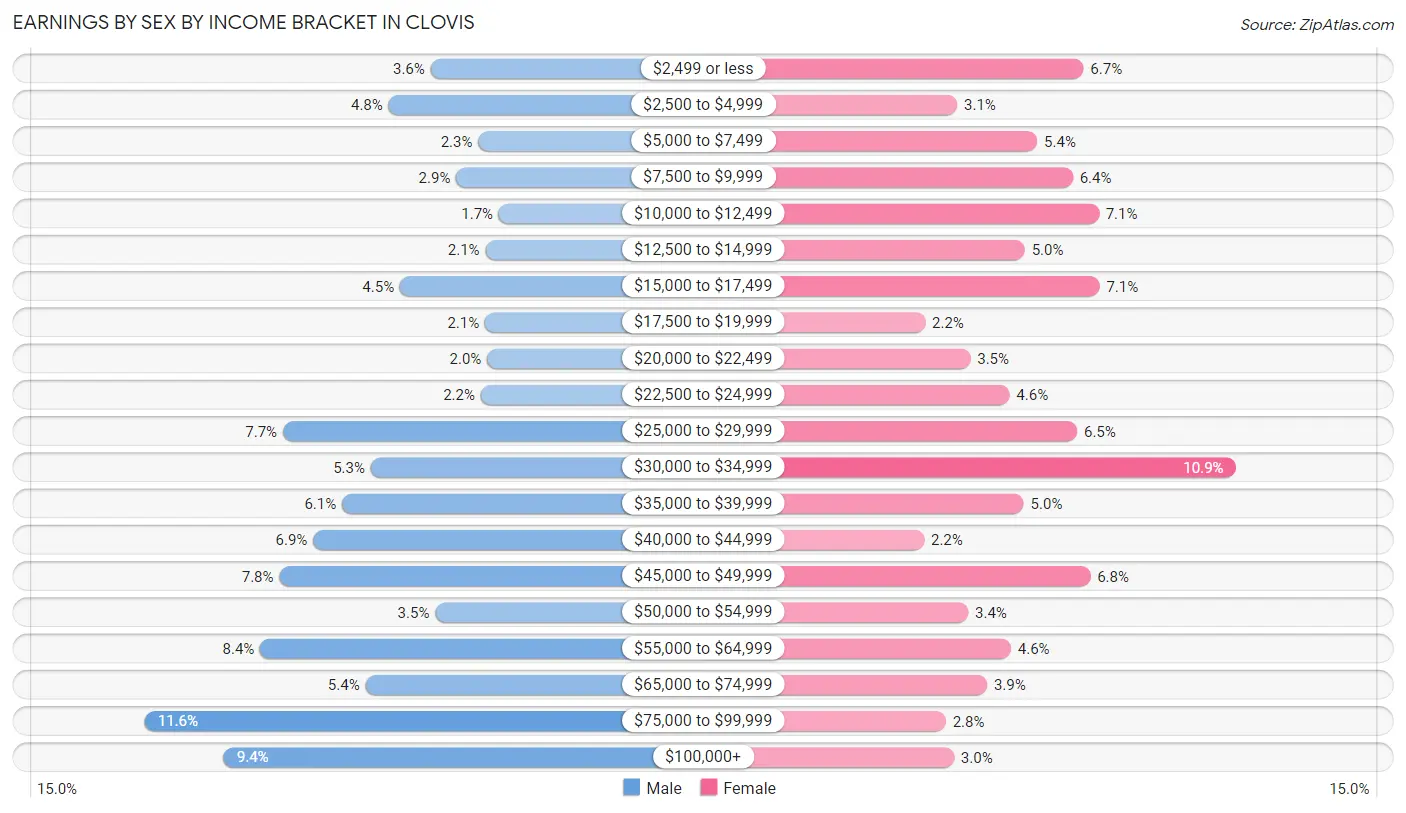
Earnings by Sex by Income Bracket in Clovis
The most common earnings brackets in Clovis are $75,000 to $99,999 for men (1,273 | 11.6%) and $30,000 to $34,999 for women (903 | 10.9%).
| Income | Male | Female |
| $2,499 or less | 393 (3.6%) | 550 (6.7%) |
| $2,500 to $4,999 | 523 (4.8%) | 256 (3.1%) |
| $5,000 to $7,499 | 247 (2.2%) | 442 (5.3%) |
| $7,500 to $9,999 | 314 (2.9%) | 525 (6.4%) |
| $10,000 to $12,499 | 183 (1.7%) | 585 (7.1%) |
| $12,500 to $14,999 | 225 (2.1%) | 413 (5.0%) |
| $15,000 to $17,499 | 488 (4.4%) | 587 (7.1%) |
| $17,500 to $19,999 | 226 (2.1%) | 182 (2.2%) |
| $20,000 to $22,499 | 219 (2.0%) | 287 (3.5%) |
| $22,500 to $24,999 | 239 (2.2%) | 378 (4.6%) |
| $25,000 to $29,999 | 848 (7.7%) | 535 (6.5%) |
| $30,000 to $34,999 | 577 (5.3%) | 903 (10.9%) |
| $35,000 to $39,999 | 666 (6.1%) | 411 (5.0%) |
| $40,000 to $44,999 | 755 (6.9%) | 179 (2.2%) |
| $45,000 to $49,999 | 859 (7.8%) | 565 (6.8%) |
| $50,000 to $54,999 | 379 (3.5%) | 282 (3.4%) |
| $55,000 to $64,999 | 918 (8.4%) | 381 (4.6%) |
| $65,000 to $74,999 | 594 (5.4%) | 326 (3.9%) |
| $75,000 to $99,999 | 1,273 (11.6%) | 230 (2.8%) |
| $100,000+ | 1,030 (9.4%) | 249 (3.0%) |
| Total | 10,956 (100.0%) | 8,266 (100.0%) |
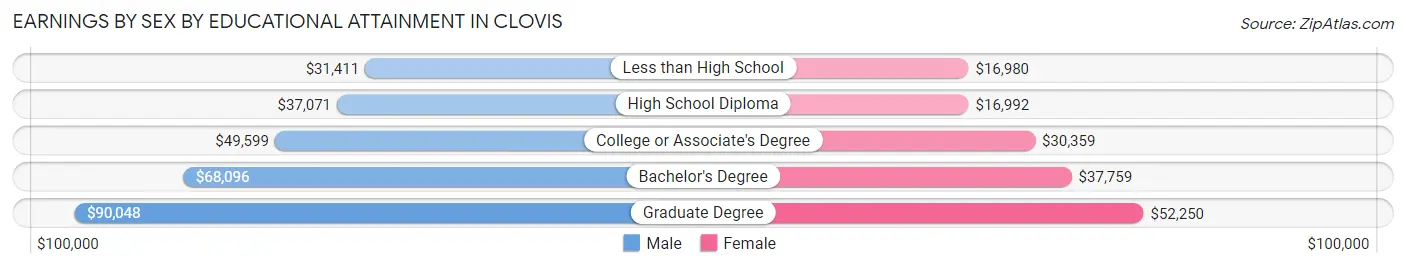
Earnings by Sex by Educational Attainment in Clovis
Average earnings in Clovis are $46,758 for men and $28,999 for women, a difference of 38.0%. Men with an educational attainment of graduate degree enjoy the highest average annual earnings of $90,048, while those with less than high school education earn the least with $31,411. Women with an educational attainment of graduate degree earn the most with the average annual earnings of $52,250, while those with less than high school education have the smallest earnings of $16,980.
| Educational Attainment | Male Income | Female Income |
| Less than High School | $31,411 | $16,980 |
| High School Diploma | $37,071 | $16,992 |
| College or Associate's Degree | $49,599 | $30,359 |
| Bachelor's Degree | $68,096 | $37,759 |
| Graduate Degree | $90,048 | $52,250 |
| Total | $46,758 | $28,999 |
Family Income in Clovis
Family Income Brackets in Clovis
According to the Clovis family income data, there are 1,993 families falling into the $50,000 to $74,999 income range, which is the most common income bracket and makes up 21.8% of all families. Conversely, the $200,000+ income bracket is the least frequent group with only 411 families (4.5%) belonging to this category.
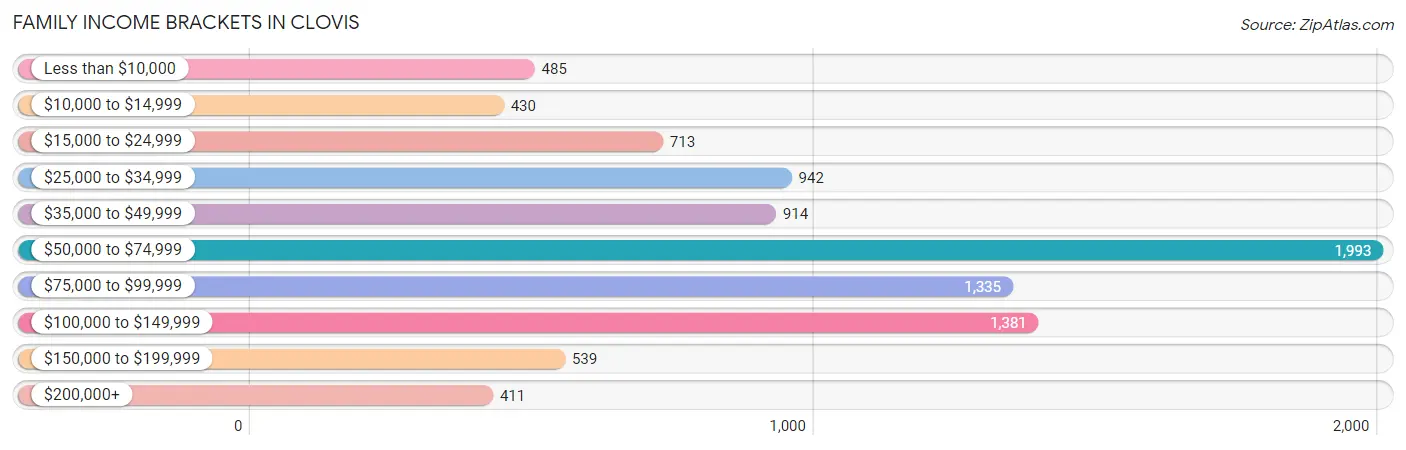
| Income Bracket | # Families | % Families |
| Less than $10,000 | 485 | 5.3% |
| $10,000 to $14,999 | 430 | 4.7% |
| $15,000 to $24,999 | 713 | 7.8% |
| $25,000 to $34,999 | 942 | 10.3% |
| $35,000 to $49,999 | 914 | 10.0% |
| $50,000 to $74,999 | 1,993 | 21.8% |
| $75,000 to $99,999 | 1,335 | 14.6% |
| $100,000 to $149,999 | 1,381 | 15.1% |
| $150,000 to $199,999 | 539 | 5.9% |
| $200,000+ | 411 | 4.5% |
Family Income by Famaliy Size in Clovis
4-person families (1,364 | 14.9%) account for the highest median family income in Clovis with $78,093 per family, while 2-person families (4,309 | 47.1%) have the highest median income of $28,039 per family member.
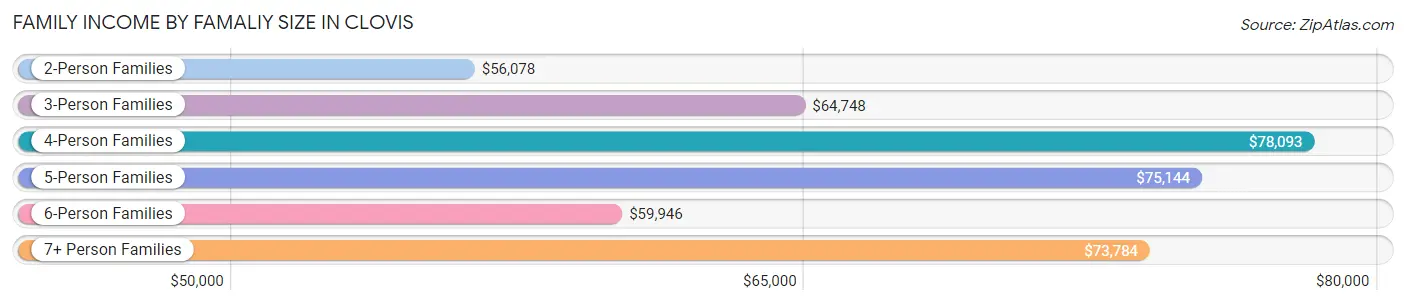
| Income Bracket | # Families | Median Income |
| 2-Person Families | 4,309 (47.1%) | $56,078 |
| 3-Person Families | 1,972 (21.6%) | $64,748 |
| 4-Person Families | 1,364 (14.9%) | $78,093 |
| 5-Person Families | 1,012 (11.1%) | $75,144 |
| 6-Person Families | 357 (3.9%) | $59,946 |
| 7+ Person Families | 130 (1.4%) | $73,784 |
| Total | 9,144 (100.0%) | $63,371 |
Family Income by Number of Earners in Clovis
The median family income in Clovis is $63,371, with families comprising 3+ earners (849) having the highest median family income of $110,859, while families with no earners (1,339) have the lowest median family income of $25,165, accounting for 9.3% and 14.6% of families, respectively.
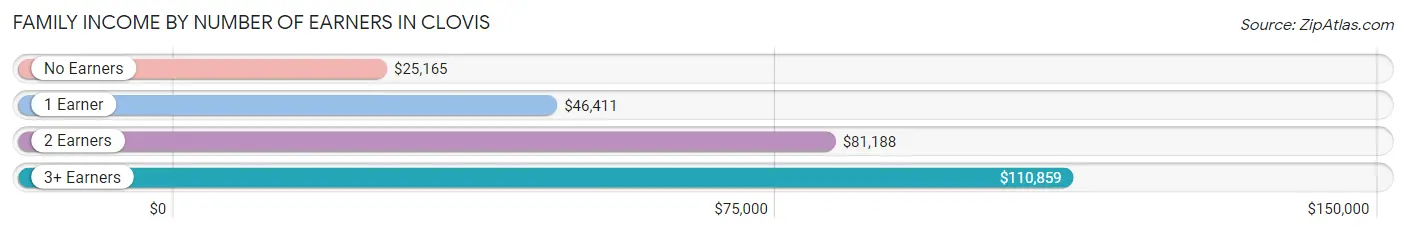
| Number of Earners | # Families | Median Income |
| No Earners | 1,339 (14.6%) | $25,165 |
| 1 Earner | 3,579 (39.1%) | $46,411 |
| 2 Earners | 3,377 (36.9%) | $81,188 |
| 3+ Earners | 849 (9.3%) | $110,859 |
| Total | 9,144 (100.0%) | $63,371 |
Household Income in Clovis
Household Income Brackets in Clovis
With 3,006 households falling in the category, the $50,000 to $74,999 income range is the most frequent in Clovis, accounting for 20.0% of all households. In contrast, only 421 households (2.8%) fall into the $200,000+ income bracket, making it the least populous group.
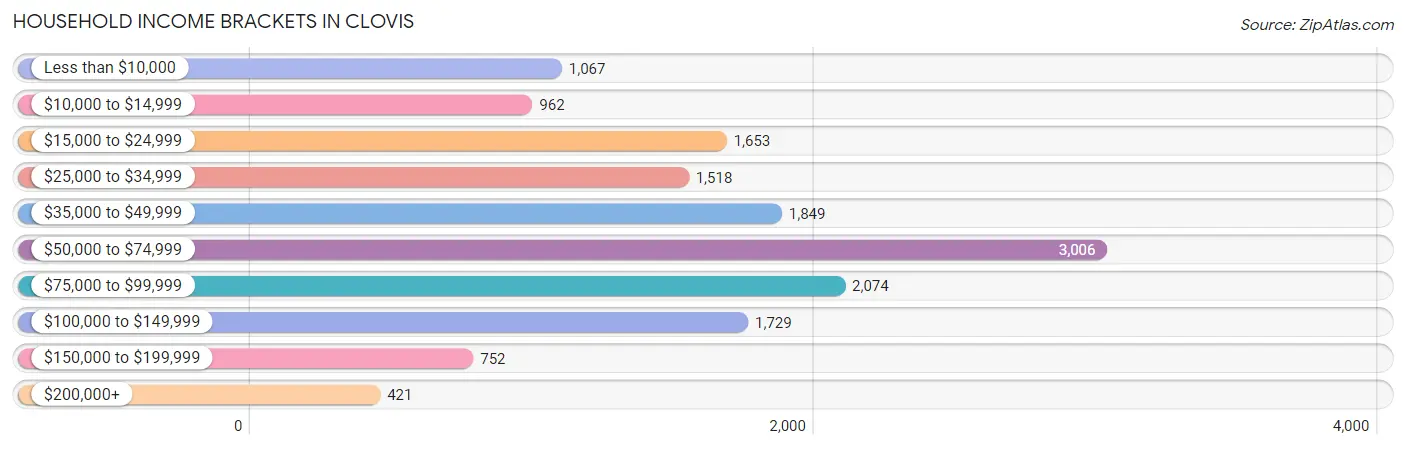
| Income Bracket | # Households | % Households |
| Less than $10,000 | 1,067 | 7.1% |
| $10,000 to $14,999 | 962 | 6.4% |
| $15,000 to $24,999 | 1,653 | 11.0% |
| $25,000 to $34,999 | 1,518 | 10.1% |
| $35,000 to $49,999 | 1,849 | 12.3% |
| $50,000 to $74,999 | 3,006 | 20.0% |
| $75,000 to $99,999 | 2,074 | 13.8% |
| $100,000 to $149,999 | 1,729 | 11.5% |
| $150,000 to $199,999 | 752 | 5.0% |
| $200,000+ | 421 | 2.8% |
Household Income by Householder Age in Clovis
The median household income in Clovis is $52,983, with the highest median household income of $61,208 found in the 45 to 64 years age bracket for the primary householder. A total of 4,330 households (28.8%) fall into this category. Meanwhile, the 65+ years age bracket for the primary householder has the lowest median household income of $35,634, with 3,300 households (22.0%) in this group.
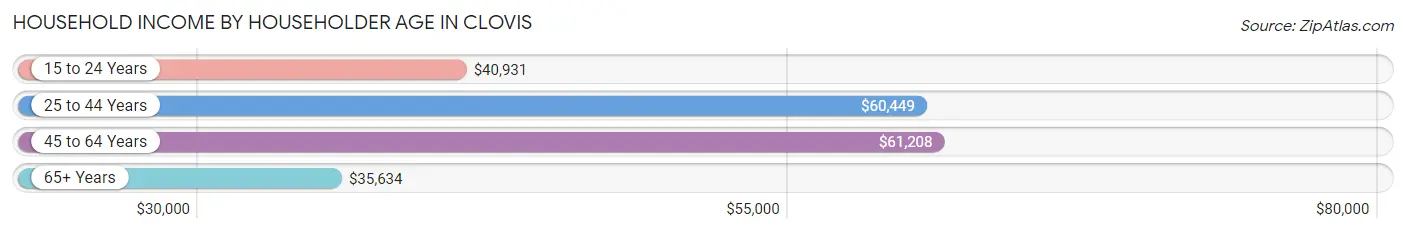
| Income Bracket | # Households | Median Income |
| 15 to 24 Years | 953 (6.3%) | $40,931 |
| 25 to 44 Years | 6,448 (42.9%) | $60,449 |
| 45 to 64 Years | 4,330 (28.8%) | $61,208 |
| 65+ Years | 3,300 (22.0%) | $35,634 |
| Total | 15,031 (100.0%) | $52,983 |
Poverty in Clovis
Income Below Poverty by Sex and Age in Clovis
With 18.2% poverty level for males and 24.9% for females among the residents of Clovis, 5 year old males and under 5 year old females are the most vulnerable to poverty, with 185 males (57.5%) and 593 females (43.6%) in their respective age groups living below the poverty level.
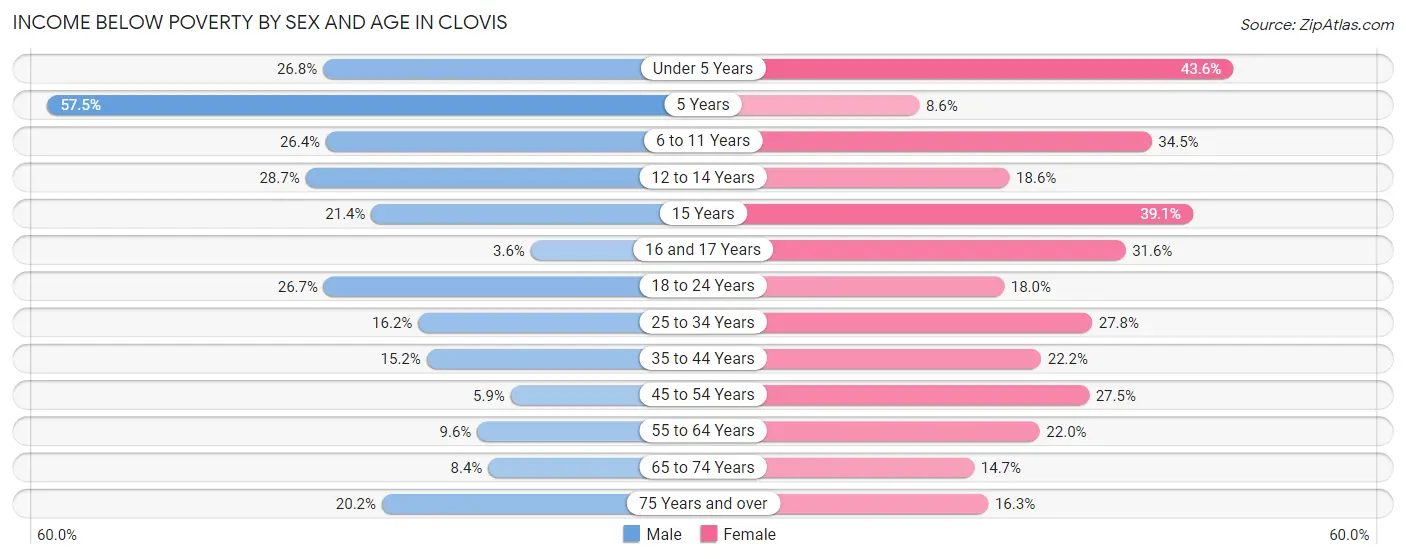
| Age Bracket | Male | Female |
| Under 5 Years | 420 (26.8%) | 593 (43.6%) |
| 5 Years | 185 (57.5%) | 28 (8.6%) |
| 6 to 11 Years | 350 (26.4%) | 550 (34.5%) |
| 12 to 14 Years | 332 (28.7%) | 148 (18.6%) |
| 15 Years | 62 (21.4%) | 50 (39.1%) |
| 16 and 17 Years | 17 (3.6%) | 213 (31.6%) |
| 18 to 24 Years | 634 (26.7%) | 334 (18.0%) |
| 25 to 34 Years | 608 (16.2%) | 869 (27.8%) |
| 35 to 44 Years | 379 (15.2%) | 505 (22.2%) |
| 45 to 54 Years | 99 (5.9%) | 468 (27.5%) |
| 55 to 64 Years | 176 (9.6%) | 457 (22.0%) |
| 65 to 74 Years | 105 (8.4%) | 202 (14.7%) |
| 75 Years and over | 156 (20.2%) | 212 (16.3%) |
| Total | 3,523 (18.2%) | 4,629 (24.9%) |
Income Above Poverty by Sex and Age in Clovis
According to the poverty statistics in Clovis, males aged 16 and 17 years and females aged 5 years are the age groups that are most secure financially, with 96.4% of males and 91.4% of females in these age groups living above the poverty line.
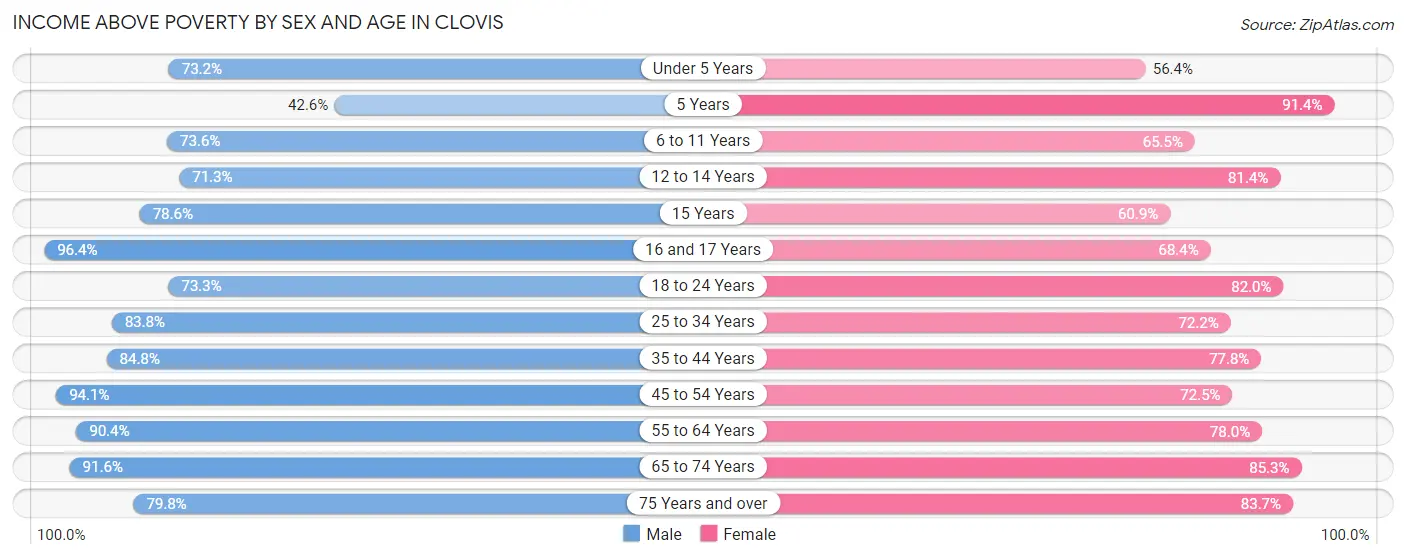
| Age Bracket | Male | Female |
| Under 5 Years | 1,149 (73.2%) | 768 (56.4%) |
| 5 Years | 137 (42.5%) | 298 (91.4%) |
| 6 to 11 Years | 974 (73.6%) | 1,045 (65.5%) |
| 12 to 14 Years | 824 (71.3%) | 646 (81.4%) |
| 15 Years | 228 (78.6%) | 78 (60.9%) |
| 16 and 17 Years | 450 (96.4%) | 462 (68.4%) |
| 18 to 24 Years | 1,742 (73.3%) | 1,517 (82.0%) |
| 25 to 34 Years | 3,153 (83.8%) | 2,252 (72.2%) |
| 35 to 44 Years | 2,110 (84.8%) | 1,774 (77.8%) |
| 45 to 54 Years | 1,588 (94.1%) | 1,234 (72.5%) |
| 55 to 64 Years | 1,657 (90.4%) | 1,619 (78.0%) |
| 65 to 74 Years | 1,150 (91.6%) | 1,171 (85.3%) |
| 75 Years and over | 616 (79.8%) | 1,090 (83.7%) |
| Total | 15,778 (81.8%) | 13,954 (75.1%) |
Income Below Poverty Among Married-Couple Families in Clovis
The poverty statistics for married-couple families in Clovis show that 6.9% or 433 of the total 6,304 families live below the poverty line. Families with 3 or 4 children have the highest poverty rate of 20.5%, comprising of 149 families. On the other hand, families with no children have the lowest poverty rate of 4.5%, which includes 147 families.
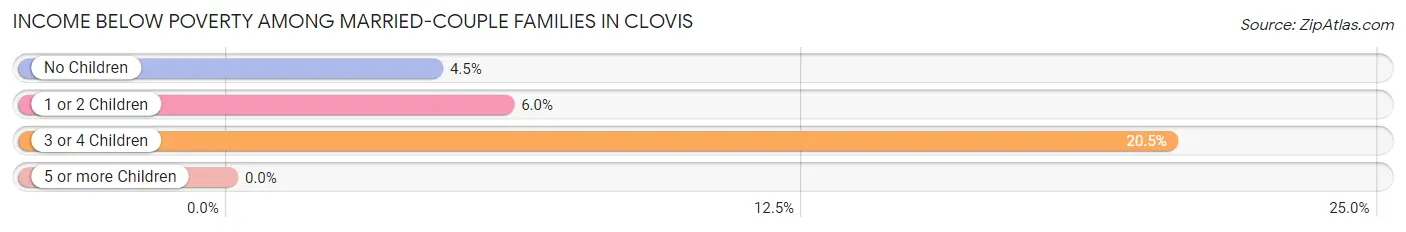
| Children | Above Poverty | Below Poverty |
| No Children | 3,149 (95.5%) | 147 (4.5%) |
| 1 or 2 Children | 2,143 (94.0%) | 137 (6.0%) |
| 3 or 4 Children | 579 (79.5%) | 149 (20.5%) |
| 5 or more Children | 0 (0.0%) | 0 (0.0%) |
| Total | 5,871 (93.1%) | 433 (6.9%) |
Income Below Poverty Among Single-Parent Households in Clovis
According to the poverty data in Clovis, 27.7% or 181 single-father households and 46.8% or 1,023 single-mother households are living below the poverty line. Among single-father households, those with 5 or more children have the highest poverty rate, with 17 households (100.0%) experiencing poverty. Likewise, among single-mother households, those with 5 or more children have the highest poverty rate, with 38 households (100.0%) falling below the poverty line.
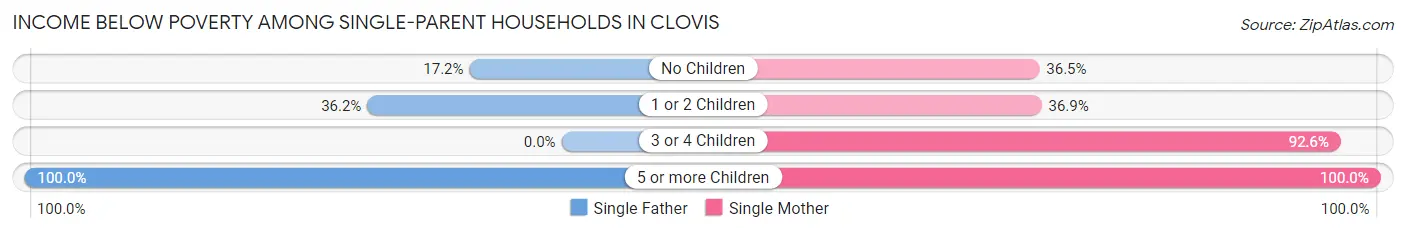
| Children | Single Father | Single Mother |
| No Children | 29 (17.2%) | 242 (36.4%) |
| 1 or 2 Children | 135 (36.2%) | 418 (36.9%) |
| 3 or 4 Children | 0 (0.0%) | 325 (92.6%) |
| 5 or more Children | 17 (100.0%) | 38 (100.0%) |
| Total | 181 (27.7%) | 1,023 (46.8%) |
Income Below Poverty Among Married-Couple vs Single-Parent Households in Clovis
The poverty data for Clovis shows that 433 of the married-couple family households (6.9%) and 1,204 of the single-parent households (42.4%) are living below the poverty level. Within the married-couple family households, those with 3 or 4 children have the highest poverty rate, with 149 households (20.5%) falling below the poverty line. Among the single-parent households, those with 5 or more children have the highest poverty rate, with 55 household (100.0%) living below poverty.
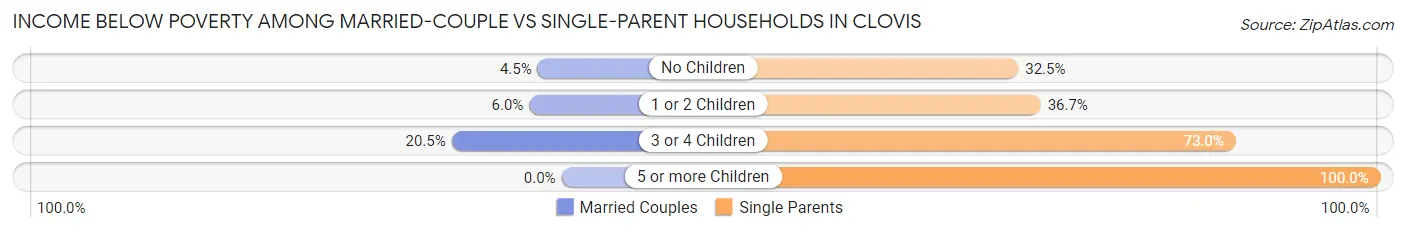
| Children | Married-Couple Families | Single-Parent Households |
| No Children | 147 (4.5%) | 271 (32.5%) |
| 1 or 2 Children | 137 (6.0%) | 553 (36.7%) |
| 3 or 4 Children | 149 (20.5%) | 325 (73.0%) |
| 5 or more Children | 0 (0.0%) | 55 (100.0%) |
| Total | 433 (6.9%) | 1,204 (42.4%) |
Race in Clovis
The most populous races in Clovis are White / Caucasian (22,054 | 57.4%), Hispanic or Latino (18,636 | 48.5%), and Some other Race (8,374 | 21.8%).
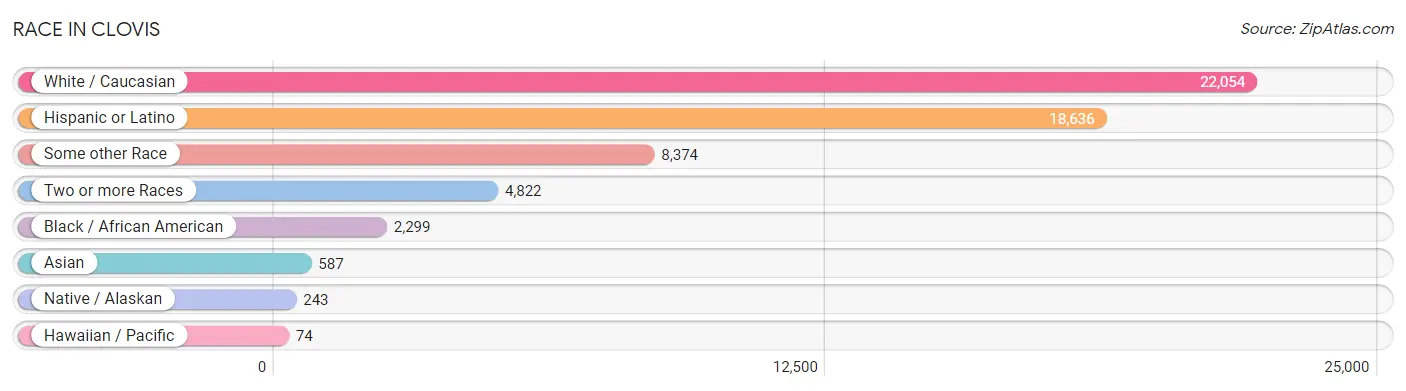
| Race | # Population | % Population |
| Asian | 587 | 1.5% |
| Black / African American | 2,299 | 6.0% |
| Hawaiian / Pacific | 74 | 0.2% |
| Hispanic or Latino | 18,636 | 48.5% |
| Native / Alaskan | 243 | 0.6% |
| White / Caucasian | 22,054 | 57.4% |
| Two or more Races | 4,822 | 12.5% |
| Some other Race | 8,374 | 21.8% |
| Total | 38,453 | 100.0% |
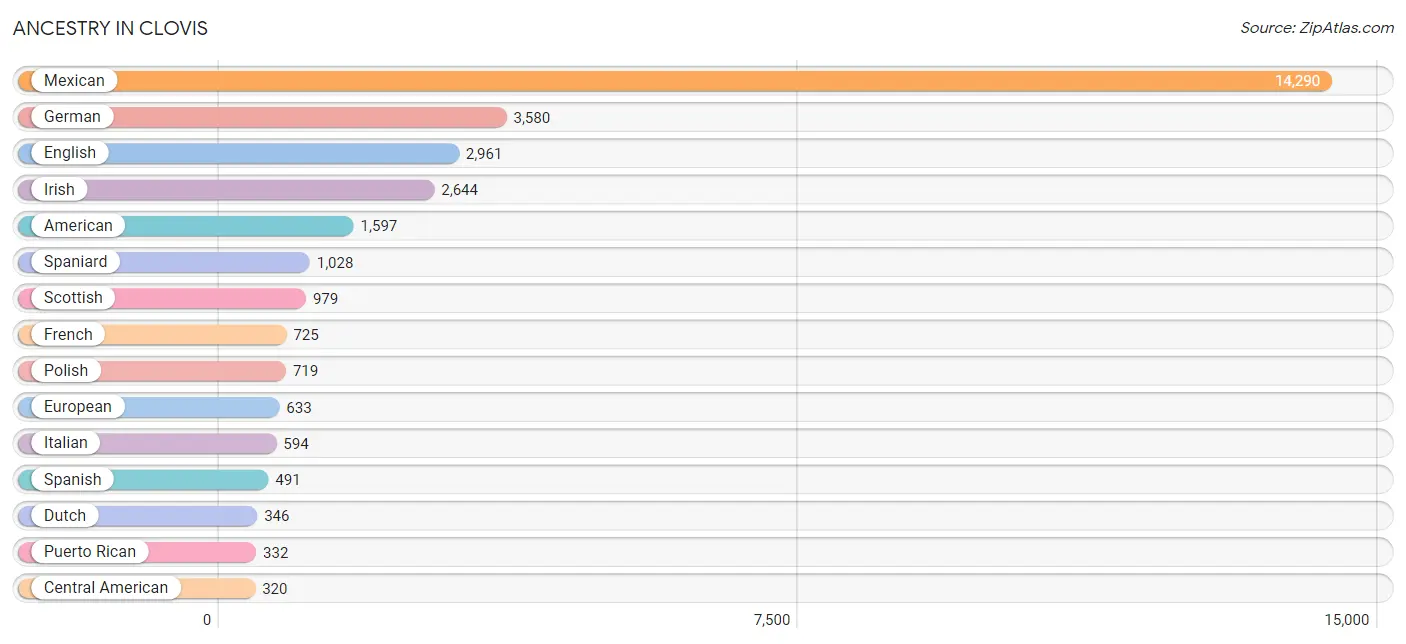
Ancestry in Clovis
The most populous ancestries reported in Clovis are Mexican (14,290 | 37.2%), German (3,580 | 9.3%), English (2,961 | 7.7%), Irish (2,644 | 6.9%), and American (1,597 | 4.2%), together accounting for 65.2% of all Clovis residents.
| Ancestry | # Population | % Population |
| African | 222 | 0.6% |
| American | 1,597 | 4.2% |
| Apache | 5 | 0.0% |
| Arab | 31 | 0.1% |
| Argentinean | 26 | 0.1% |
| Austrian | 23 | 0.1% |
| Bahamian | 9 | 0.0% |
| Bangladeshi | 16 | 0.0% |
| Belgian | 13 | 0.0% |
| Bhutanese | 17 | 0.0% |
| Blackfeet | 7 | 0.0% |
| British | 209 | 0.5% |
| Burmese | 211 | 0.5% |
| Canadian | 17 | 0.0% |
| Central American | 320 | 0.8% |
| Central American Indian | 9 | 0.0% |
| Cherokee | 191 | 0.5% |
| Cheyenne | 18 | 0.1% |
| Chickasaw | 3 | 0.0% |
| Chippewa | 1 | 0.0% |
| Choctaw | 57 | 0.2% |
| Colombian | 58 | 0.2% |
| Costa Rican | 34 | 0.1% |
| Cree | 58 | 0.2% |
| Czech | 18 | 0.1% |
| Danish | 20 | 0.1% |
| Dutch | 346 | 0.9% |
| Eastern European | 111 | 0.3% |
| English | 2,961 | 7.7% |
| European | 633 | 1.7% |
| Finnish | 15 | 0.0% |
| French | 725 | 1.9% |
| French Canadian | 63 | 0.2% |
| German | 3,580 | 9.3% |
| Greek | 226 | 0.6% |
| Guatemalan | 9 | 0.0% |
| Haitian | 34 | 0.1% |
| Honduran | 187 | 0.5% |
| Hungarian | 41 | 0.1% |
| Indian (Asian) | 49 | 0.1% |
| Irish | 2,644 | 6.9% |
| Italian | 594 | 1.5% |
| Kiowa | 87 | 0.2% |
| Korean | 232 | 0.6% |
| Laotian | 24 | 0.1% |
| Lithuanian | 56 | 0.2% |
| Malaysian | 69 | 0.2% |
| Mexican | 14,290 | 37.2% |
| Mexican American Indian | 55 | 0.1% |
| Native Hawaiian | 15 | 0.0% |
| Navajo | 57 | 0.2% |
| Northern European | 111 | 0.3% |
| Norwegian | 153 | 0.4% |
| Pakistani | 2 | 0.0% |
| Palestinian | 31 | 0.1% |
| Panamanian | 90 | 0.2% |
| Peruvian | 15 | 0.0% |
| Pima | 1 | 0.0% |
| Polish | 719 | 1.9% |
| Portuguese | 190 | 0.5% |
| Pueblo | 32 | 0.1% |
| Puerto Rican | 332 | 0.9% |
| Russian | 34 | 0.1% |
| Samoan | 5 | 0.0% |
| Scandinavian | 87 | 0.2% |
| Scotch-Irish | 116 | 0.3% |
| Scottish | 979 | 2.5% |
| Seminole | 3 | 0.0% |
| Sioux | 64 | 0.2% |
| South American | 99 | 0.3% |
| Spaniard | 1,028 | 2.7% |
| Spanish | 491 | 1.3% |
| Spanish American | 132 | 0.3% |
| Sri Lankan | 121 | 0.3% |
| Subsaharan African | 222 | 0.6% |
| Swedish | 234 | 0.6% |
| Thai | 52 | 0.1% |
| Ukrainian | 15 | 0.0% |
| Welsh | 196 | 0.5% | View All 79 Rows |
Immigrants in Clovis
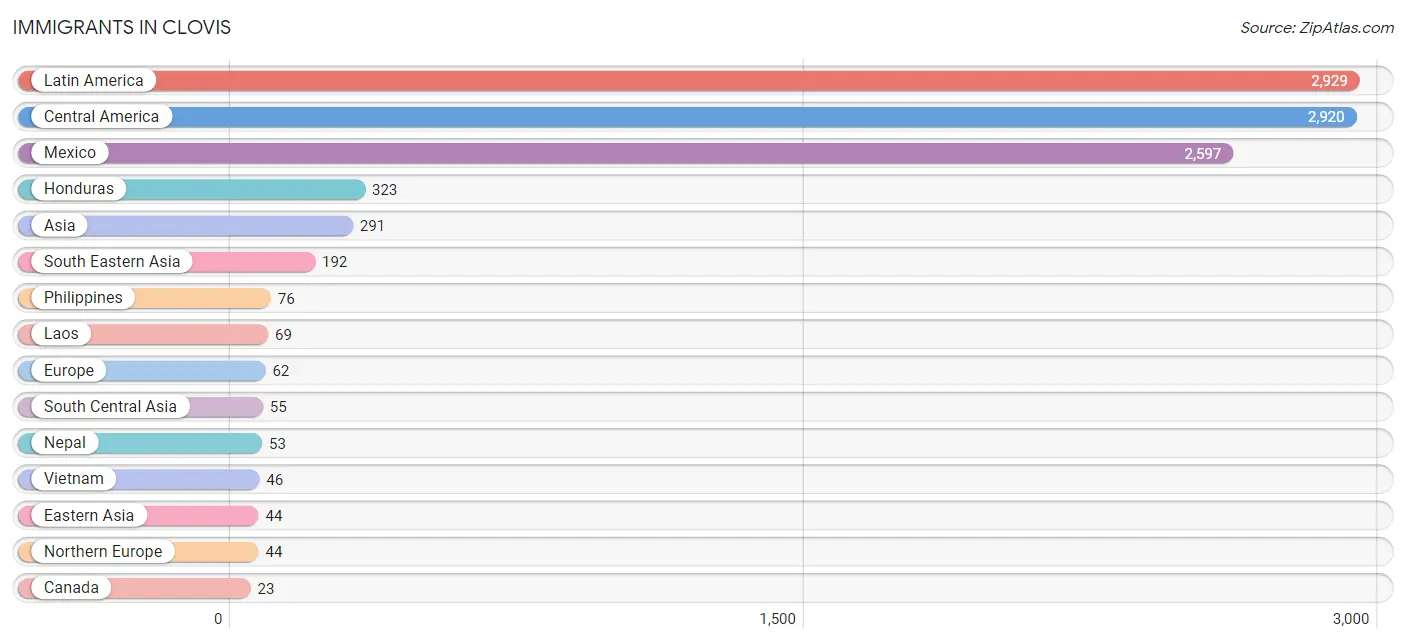
The most numerous immigrant groups reported in Clovis came from Latin America (2,929 | 7.6%), Central America (2,920 | 7.6%), Mexico (2,597 | 6.8%), Honduras (323 | 0.8%), and Asia (291 | 0.8%), together accounting for 23.6% of all Clovis residents.
| Immigration Origin | # Population | % Population |
| Africa | 6 | 0.0% |
| Asia | 291 | 0.8% |
| Bahamas | 9 | 0.0% |
| Canada | 23 | 0.1% |
| Caribbean | 9 | 0.0% |
| Central America | 2,920 | 7.6% |
| Eastern Asia | 44 | 0.1% |
| England | 14 | 0.0% |
| Europe | 62 | 0.2% |
| Germany | 18 | 0.1% |
| Honduras | 323 | 0.8% |
| India | 2 | 0.0% |
| Ireland | 14 | 0.0% |
| Japan | 21 | 0.1% |
| Korea | 23 | 0.1% |
| Laos | 69 | 0.2% |
| Latin America | 2,929 | 7.6% |
| Mexico | 2,597 | 6.8% |
| Nepal | 53 | 0.1% |
| Northern Europe | 44 | 0.1% |
| Philippines | 76 | 0.2% |
| South Central Asia | 55 | 0.1% |
| South Eastern Asia | 192 | 0.5% |
| Thailand | 1 | 0.0% |
| Vietnam | 46 | 0.1% |
| Western Europe | 18 | 0.1% | View All 26 Rows |
Sex and Age in Clovis
Sex and Age in Clovis
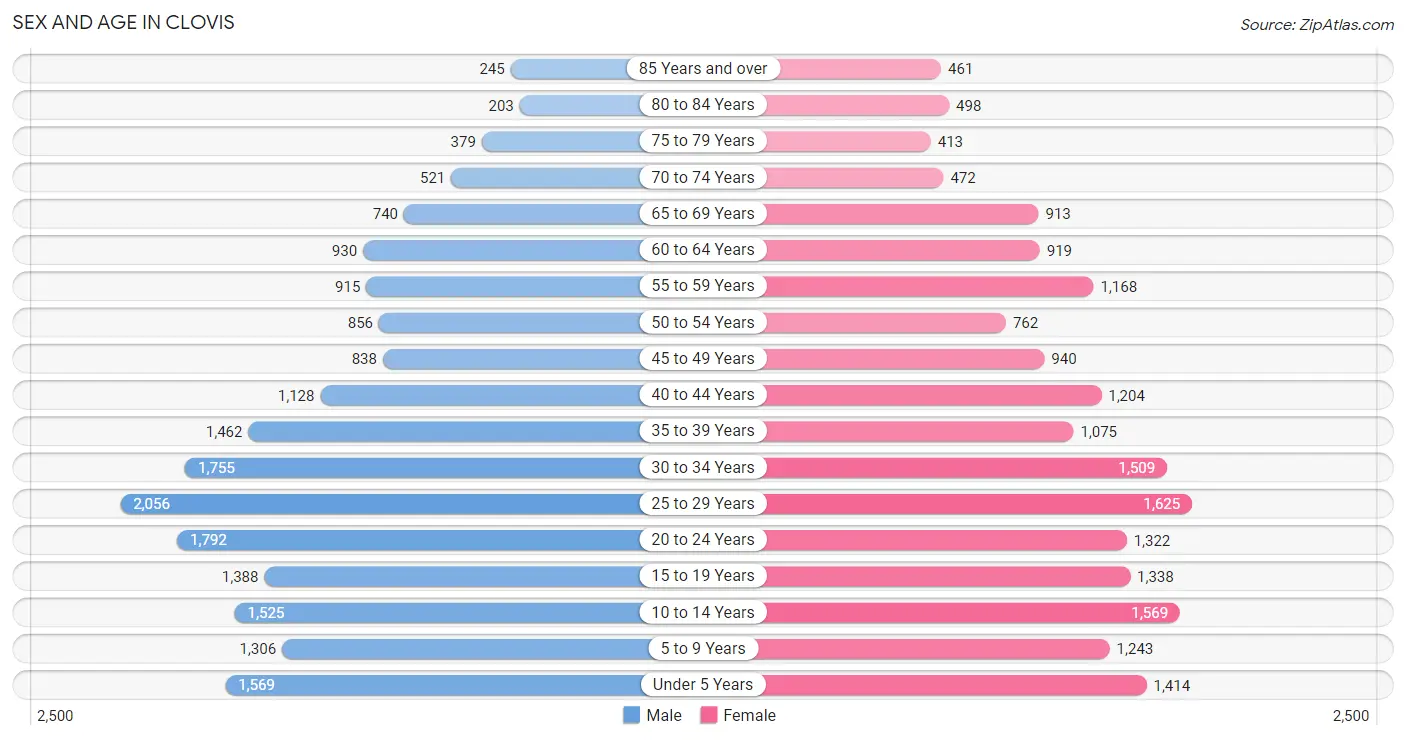
The most populous age groups in Clovis are 25 to 29 Years (2,056 | 10.5%) for men and 25 to 29 Years (1,625 | 8.6%) for women.
| Age Bracket | Male | Female |
| Under 5 Years | 1,569 (8.0%) | 1,414 (7.5%) |
| 5 to 9 Years | 1,306 (6.7%) | 1,243 (6.6%) |
| 10 to 14 Years | 1,525 (7.8%) | 1,569 (8.3%) |
| 15 to 19 Years | 1,388 (7.1%) | 1,338 (7.1%) |
| 20 to 24 Years | 1,792 (9.1%) | 1,322 (7.0%) |
| 25 to 29 Years | 2,056 (10.5%) | 1,625 (8.6%) |
| 30 to 34 Years | 1,755 (8.9%) | 1,509 (8.0%) |
| 35 to 39 Years | 1,462 (7.5%) | 1,075 (5.7%) |
| 40 to 44 Years | 1,128 (5.8%) | 1,204 (6.4%) |
| 45 to 49 Years | 838 (4.3%) | 940 (5.0%) |
| 50 to 54 Years | 856 (4.4%) | 762 (4.0%) |
| 55 to 59 Years | 915 (4.7%) | 1,168 (6.2%) |
| 60 to 64 Years | 930 (4.7%) | 919 (4.9%) |
| 65 to 69 Years | 740 (3.8%) | 913 (4.8%) |
| 70 to 74 Years | 521 (2.7%) | 472 (2.5%) |
| 75 to 79 Years | 379 (1.9%) | 413 (2.2%) |
| 80 to 84 Years | 203 (1.0%) | 498 (2.6%) |
| 85 Years and over | 245 (1.3%) | 461 (2.5%) |
| Total | 19,608 (100.0%) | 18,845 (100.0%) |
Families and Households in Clovis
Median Family Size in Clovis
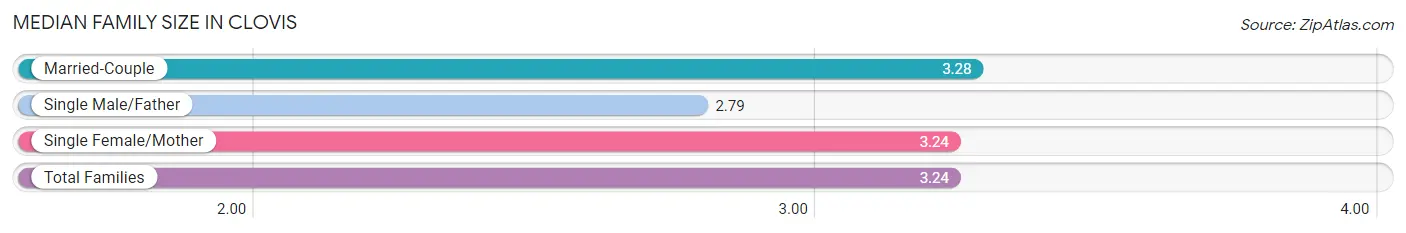
The median family size in Clovis is 3.24 persons per family, with married-couple families (6,304 | 68.9%) accounting for the largest median family size of 3.28 persons per family. On the other hand, single male/father families (653 | 7.1%) represent the smallest median family size with 2.79 persons per family.
| Family Type | # Families | Family Size |
| Married-Couple | 6,304 (68.9%) | 3.28 |
| Single Male/Father | 653 (7.1%) | 2.79 |
| Single Female/Mother | 2,187 (23.9%) | 3.24 |
| Total Families | 9,144 (100.0%) | 3.24 |
Median Household Size in Clovis
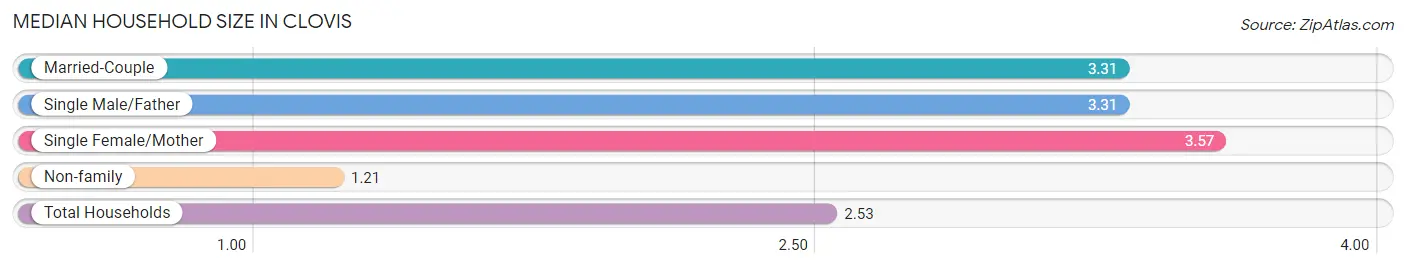
The median household size in Clovis is 2.53 persons per household, with single female/mother households (2,187 | 14.5%) accounting for the largest median household size of 3.57 persons per household. non-family households (5,887 | 39.2%) represent the smallest median household size with 1.21 persons per household.
| Household Type | # Households | Household Size |
| Married-Couple | 6,304 (41.9%) | 3.31 |
| Single Male/Father | 653 (4.3%) | 3.31 |
| Single Female/Mother | 2,187 (14.5%) | 3.57 |
| Non-family | 5,887 (39.2%) | 1.21 |
| Total Households | 15,031 (100.0%) | 2.53 |
Household Size by Marriage Status in Clovis
Out of a total of 15,031 households in Clovis, 9,144 (60.8%) are family households, while 5,887 (39.2%) are nonfamily households. The most numerous type of family households are 2-person households, comprising 3,720, and the most common type of nonfamily households are 1-person households, comprising 4,939.
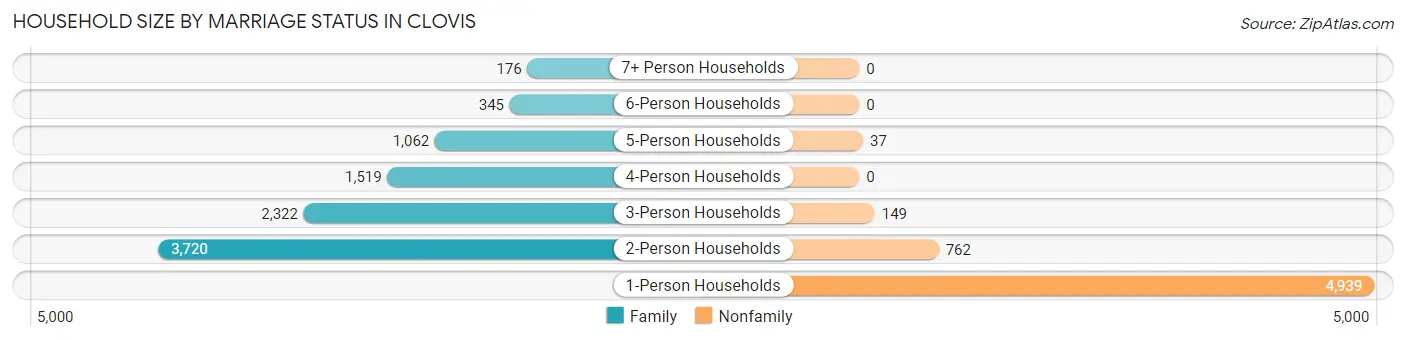
| Household Size | Family Households | Nonfamily Households |
| 1-Person Households | - | 4,939 (32.9%) |
| 2-Person Households | 3,720 (24.7%) | 762 (5.1%) |
| 3-Person Households | 2,322 (15.4%) | 149 (1.0%) |
| 4-Person Households | 1,519 (10.1%) | 0 (0.0%) |
| 5-Person Households | 1,062 (7.1%) | 37 (0.3%) |
| 6-Person Households | 345 (2.3%) | 0 (0.0%) |
| 7+ Person Households | 176 (1.2%) | 0 (0.0%) |
| Total | 9,144 (60.8%) | 5,887 (39.2%) |
Female Fertility in Clovis
Fertility by Age in Clovis
Average fertility rate in Clovis is 75.0 births per 1,000 women. Women in the age bracket of 15 to 19 years have the highest fertility rate with 157.0 births per 1,000 women. Women in the age bracket of 20 to 34 years acount for 60.9% of all women with births.
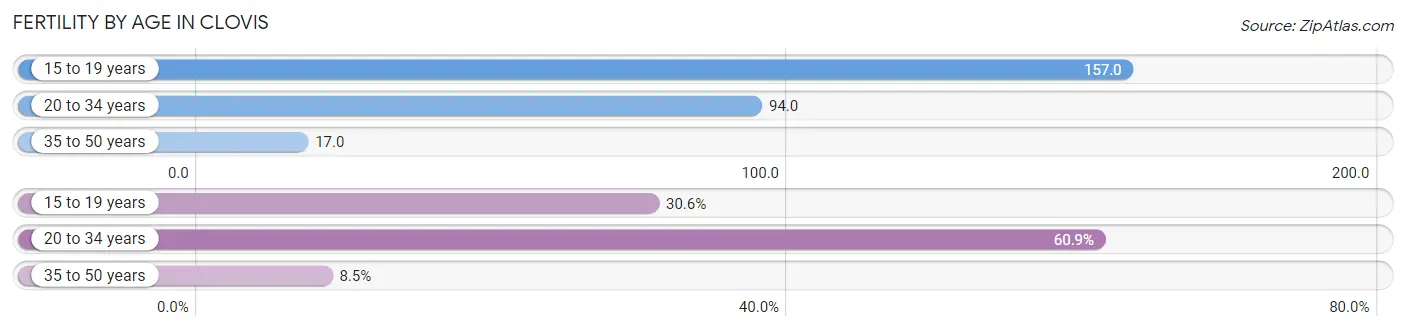
| Age Bracket | Women with Births | Births / 1,000 Women |
| 15 to 19 years | 210 (30.6%) | 157.0 |
| 20 to 34 years | 418 (60.9%) | 94.0 |
| 35 to 50 years | 58 (8.5%) | 17.0 |
| Total | 686 (100.0%) | 75.0 |
Fertility by Age by Marriage Status in Clovis
29.4% of women with births (686) in Clovis are married. The highest percentage of unmarried women with births falls into 15 to 19 years age bracket with 100.0% of them unmarried at the time of birth, while the lowest percentage of unmarried women with births belong to 35 to 50 years age bracket with 25.9% of them unmarried.
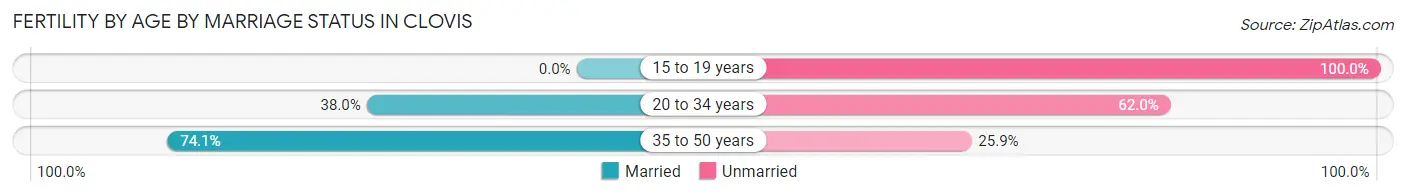
| Age Bracket | Married | Unmarried |
| 15 to 19 years | 0 (0.0%) | 210 (100.0%) |
| 20 to 34 years | 159 (38.0%) | 259 (62.0%) |
| 35 to 50 years | 43 (74.1%) | 15 (25.9%) |
| Total | 202 (29.4%) | 484 (70.6%) |
Fertility by Education in Clovis
Average fertility rate in Clovis is 75.0 births per 1,000 women. Women with the education attainment of less than high school have the highest fertility rate of 151.0 births per 1,000 women, while women with the education attainment of college or associate's degree have the lowest fertility at 29.0 births per 1,000 women. Women with the education attainment of less than high school represent 58.2% of all women with births.
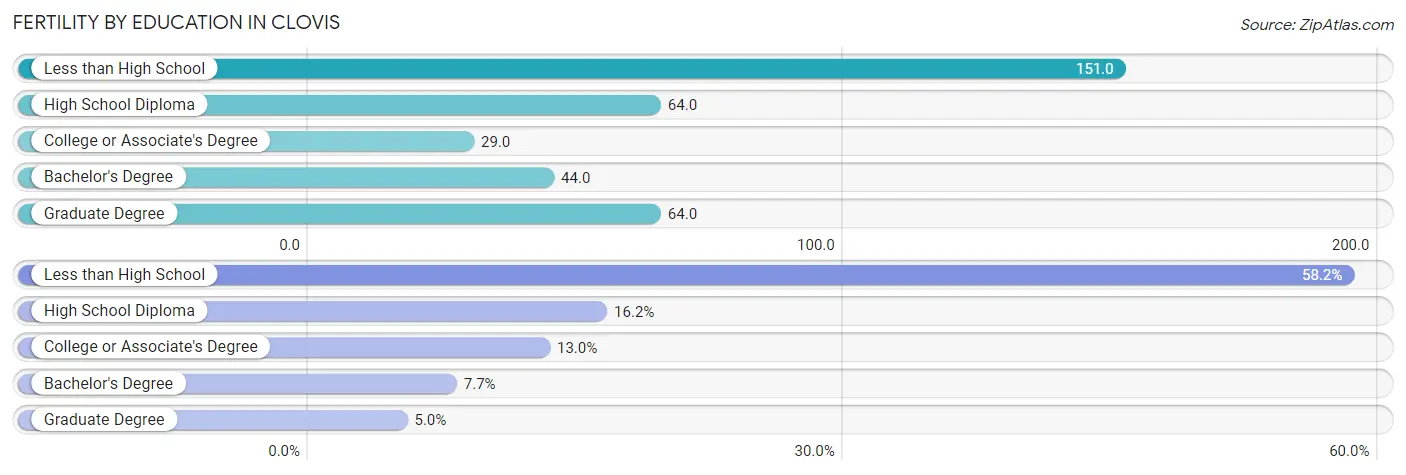
| Educational Attainment | Women with Births | Births / 1,000 Women |
| Less than High School | 399 (58.2%) | 151.0 |
| High School Diploma | 111 (16.2%) | 64.0 |
| College or Associate's Degree | 89 (13.0%) | 29.0 |
| Bachelor's Degree | 53 (7.7%) | 44.0 |
| Graduate Degree | 34 (5.0%) | 64.0 |
| Total | 686 (100.0%) | 75.0 |
Fertility by Education by Marriage Status in Clovis
70.6% of women with births in Clovis are unmarried. Women with the educational attainment of bachelor's degree are most likely to be married with 100.0% of them married at childbirth, while women with the educational attainment of less than high school are least likely to be married with 97.2% of them unmarried at childbirth.
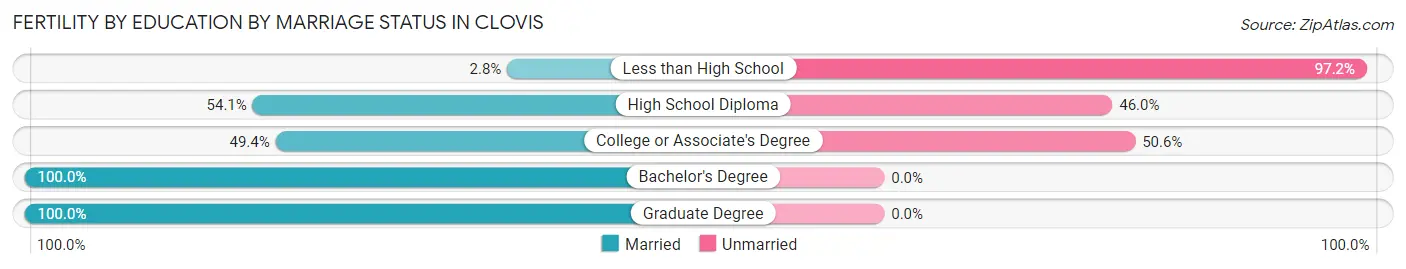
| Educational Attainment | Married | Unmarried |
| Less than High School | 11 (2.8%) | 388 (97.2%) |
| High School Diploma | 60 (54.0%) | 51 (46.0%) |
| College or Associate's Degree | 44 (49.4%) | 45 (50.6%) |
| Bachelor's Degree | 53 (100.0%) | 0 (0.0%) |
| Graduate Degree | 34 (100.0%) | 0 (0.0%) |
| Total | 202 (29.4%) | 484 (70.6%) |
Employment Characteristics in Clovis
Employment by Class of Employer in Clovis
Among the 16,782 employed individuals in Clovis, private company employees (10,282 | 61.3%), federal government employees (2,941 | 17.5%), and not-for-profit organizations (1,283 | 7.6%) make up the most common classes of employment.
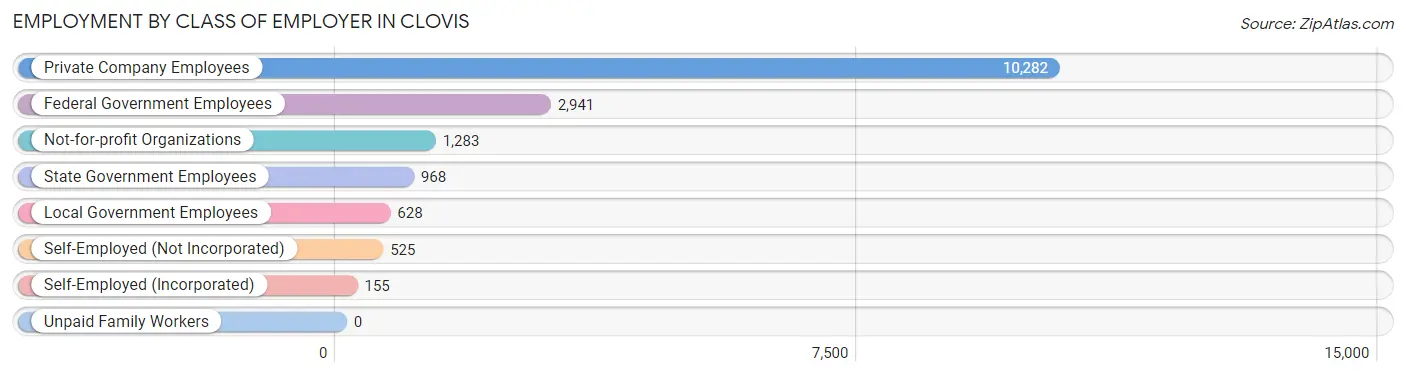
| Employer Class | # Employees | % Employees |
| Private Company Employees | 10,282 | 61.3% |
| Self-Employed (Incorporated) | 155 | 0.9% |
| Self-Employed (Not Incorporated) | 525 | 3.1% |
| Not-for-profit Organizations | 1,283 | 7.6% |
| Local Government Employees | 628 | 3.7% |
| State Government Employees | 968 | 5.8% |
| Federal Government Employees | 2,941 | 17.5% |
| Unpaid Family Workers | 0 | 0.0% |
| Total | 16,782 | 100.0% |
Employment Status by Age in Clovis
According to the labor force statistics for Clovis, out of the total population over 16 years of age (29,409), 62.7% or 18,439 individuals are in the labor force, with 8.4% or 1,549 of them unemployed. The age group with the highest labor force participation rate is 20 to 24 years, with 81.8% or 2,547 individuals in the labor force. Within the labor force, the 16 to 19 years age range has the highest percentage of unemployed individuals, with 17.4% or 155 of them being unemployed.
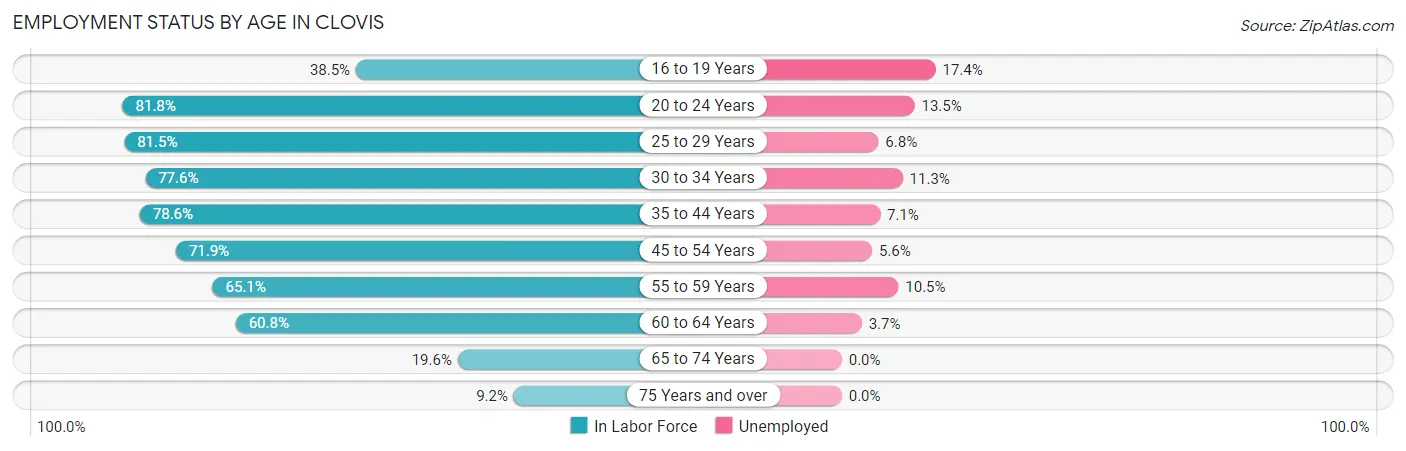
| Age Bracket | In Labor Force | Unemployed |
| 16 to 19 Years | 889 (38.5%) | 155 (17.4%) |
| 20 to 24 Years | 2,547 (81.8%) | 344 (13.5%) |
| 25 to 29 Years | 3,000 (81.5%) | 204 (6.8%) |
| 30 to 34 Years | 2,533 (77.6%) | 286 (11.3%) |
| 35 to 44 Years | 3,827 (78.6%) | 272 (7.1%) |
| 45 to 54 Years | 2,442 (71.9%) | 137 (5.6%) |
| 55 to 59 Years | 1,356 (65.1%) | 142 (10.5%) |
| 60 to 64 Years | 1,124 (60.8%) | 42 (3.7%) |
| 65 to 74 Years | 519 (19.6%) | 0 (0.0%) |
| 75 Years and over | 202 (9.2%) | 0 (0.0%) |
| Total | 18,439 (62.7%) | 1,549 (8.4%) |
Employment Status by Educational Attainment in Clovis
According to labor force statistics for Clovis, 74.6% of individuals (14,280) out of the total population between 25 and 64 years of age (19,142) are in the labor force, with 7.5% or 1,071 of them being unemployed. The group with the highest labor force participation rate are those with the educational attainment of bachelor's degree or higher, with 88.1% or 3,692 individuals in the labor force. Within the labor force, individuals with less than high school education have the highest percentage of unemployment, with 15.0% or 314 of them being unemployed.
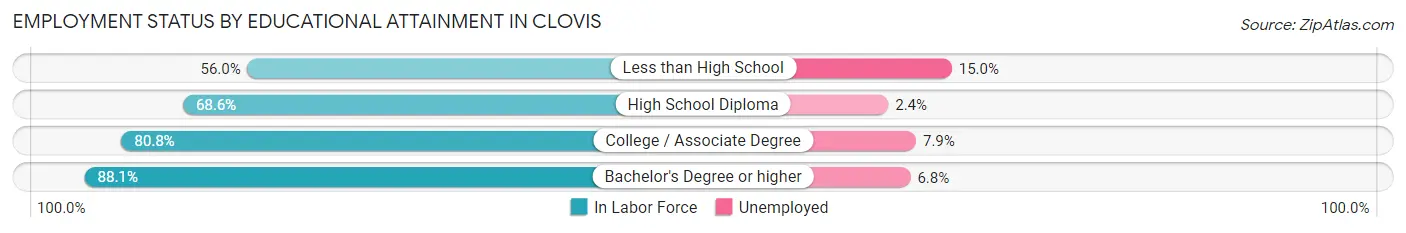
| Educational Attainment | In Labor Force | Unemployed |
| Less than High School | 2,093 (56.0%) | 561 (15.0%) |
| High School Diploma | 3,182 (68.6%) | 111 (2.4%) |
| College / Associate Degree | 5,313 (80.8%) | 519 (7.9%) |
| Bachelor's Degree or higher | 3,692 (88.1%) | 285 (6.8%) |
| Total | 14,280 (74.6%) | 1,436 (7.5%) |
Employment Occupations by Sex in Clovis
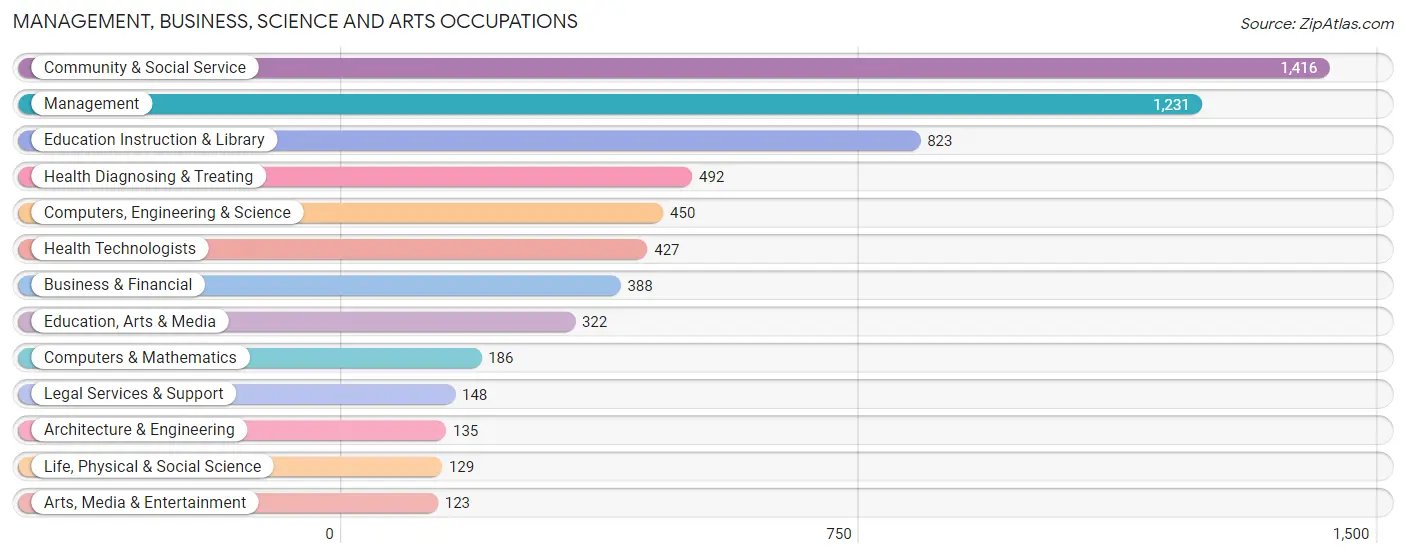
Management, Business, Science and Arts Occupations
The most common Management, Business, Science and Arts occupations in Clovis are Community & Social Service (1,416 | 9.5%), Management (1,231 | 8.2%), Education Instruction & Library (823 | 5.5%), Health Diagnosing & Treating (492 | 3.3%), and Computers, Engineering & Science (450 | 3.0%).
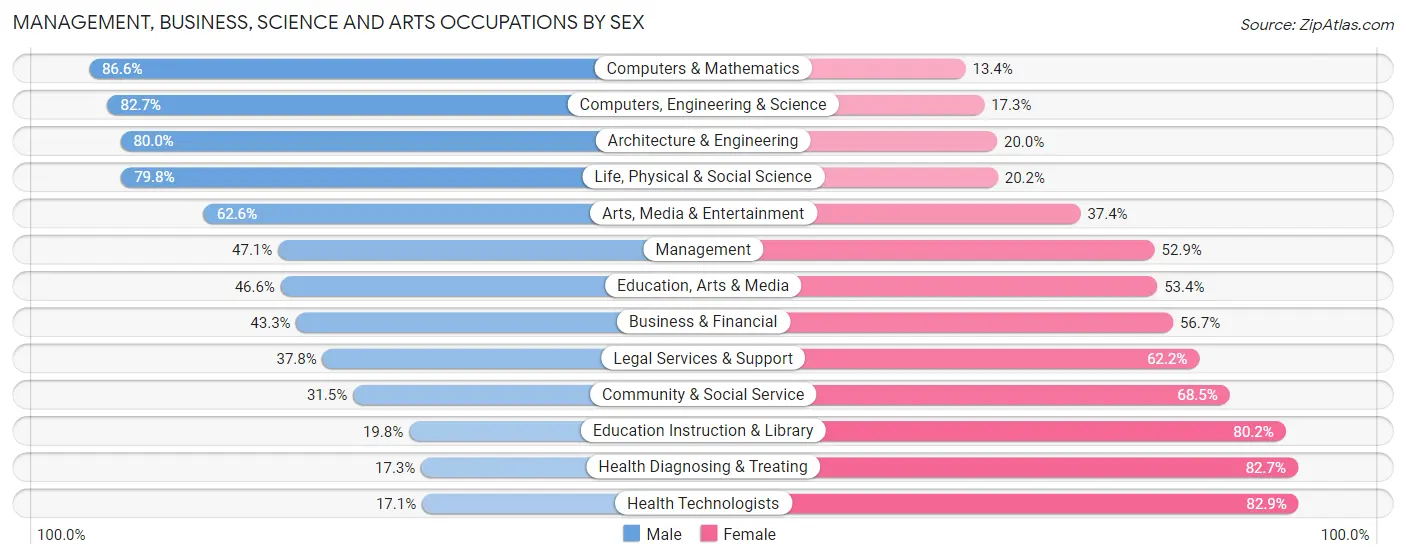
Management, Business, Science and Arts Occupations by Sex
Within the Management, Business, Science and Arts occupations in Clovis, the most male-oriented occupations are Computers & Mathematics (86.6%), Computers, Engineering & Science (82.7%), and Architecture & Engineering (80.0%), while the most female-oriented occupations are Health Technologists (82.9%), Health Diagnosing & Treating (82.7%), and Education Instruction & Library (80.2%).
| Occupation | Male | Female |
| Management | 580 (47.1%) | 651 (52.9%) |
| Business & Financial | 168 (43.3%) | 220 (56.7%) |
| Computers, Engineering & Science | 372 (82.7%) | 78 (17.3%) |
| Computers & Mathematics | 161 (86.6%) | 25 (13.4%) |
| Architecture & Engineering | 108 (80.0%) | 27 (20.0%) |
| Life, Physical & Social Science | 103 (79.8%) | 26 (20.2%) |
| Community & Social Service | 446 (31.5%) | 970 (68.5%) |
| Education, Arts & Media | 150 (46.6%) | 172 (53.4%) |
| Legal Services & Support | 56 (37.8%) | 92 (62.2%) |
| Education Instruction & Library | 163 (19.8%) | 660 (80.2%) |
| Arts, Media & Entertainment | 77 (62.6%) | 46 (37.4%) |
| Health Diagnosing & Treating | 85 (17.3%) | 407 (82.7%) |
| Health Technologists | 73 (17.1%) | 354 (82.9%) |
| Total (Category) | 1,651 (41.5%) | 2,326 (58.5%) |
| Total (Overall) | 8,177 (54.7%) | 6,784 (45.3%) |
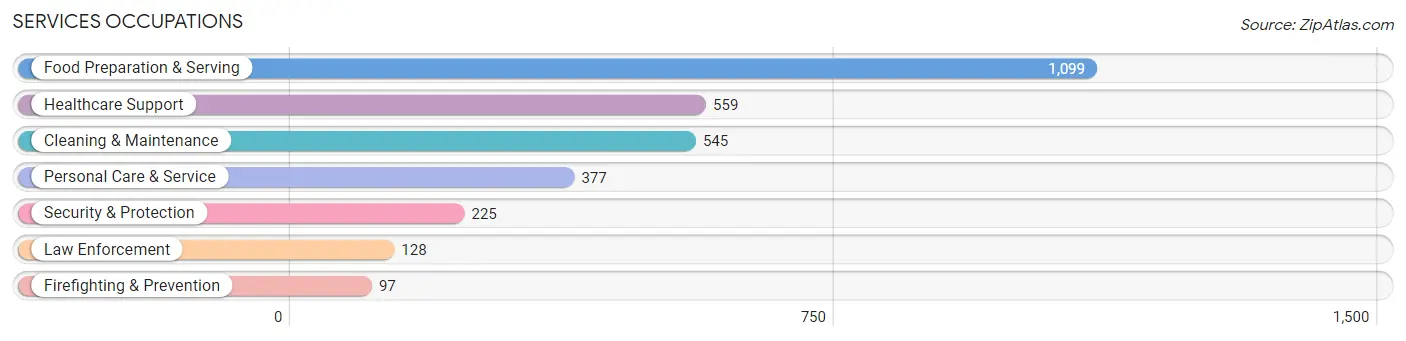
Services Occupations
The most common Services occupations in Clovis are Food Preparation & Serving (1,099 | 7.3%), Healthcare Support (559 | 3.7%), Cleaning & Maintenance (545 | 3.6%), Personal Care & Service (377 | 2.5%), and Security & Protection (225 | 1.5%).
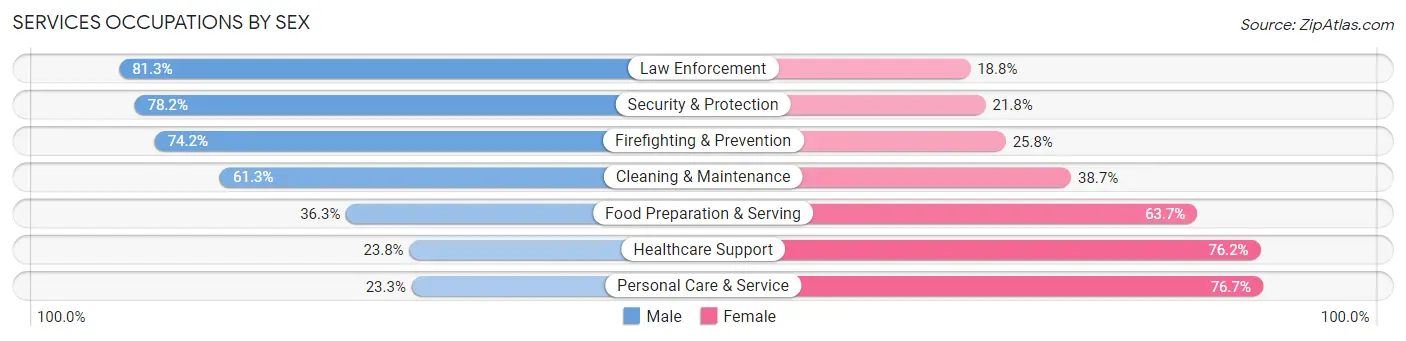
Services Occupations by Sex
Within the Services occupations in Clovis, the most male-oriented occupations are Law Enforcement (81.2%), Security & Protection (78.2%), and Firefighting & Prevention (74.2%), while the most female-oriented occupations are Personal Care & Service (76.7%), Healthcare Support (76.2%), and Food Preparation & Serving (63.7%).
| Occupation | Male | Female |
| Healthcare Support | 133 (23.8%) | 426 (76.2%) |
| Security & Protection | 176 (78.2%) | 49 (21.8%) |
| Firefighting & Prevention | 72 (74.2%) | 25 (25.8%) |
| Law Enforcement | 104 (81.2%) | 24 (18.8%) |
| Food Preparation & Serving | 399 (36.3%) | 700 (63.7%) |
| Cleaning & Maintenance | 334 (61.3%) | 211 (38.7%) |
| Personal Care & Service | 88 (23.3%) | 289 (76.7%) |
| Total (Category) | 1,130 (40.3%) | 1,675 (59.7%) |
| Total (Overall) | 8,177 (54.7%) | 6,784 (45.3%) |
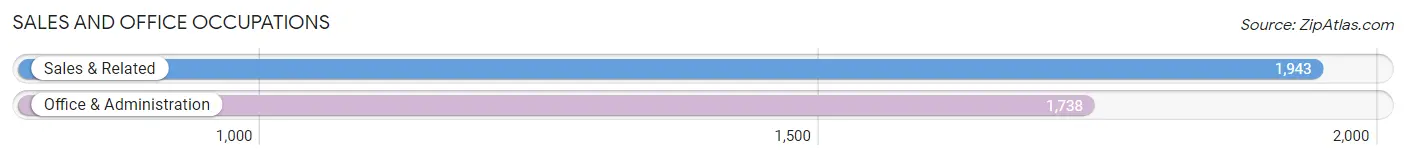
Sales and Office Occupations
The most common Sales and Office occupations in Clovis are Sales & Related (1,943 | 13.0%), and Office & Administration (1,738 | 11.6%).
Sales and Office Occupations by Sex
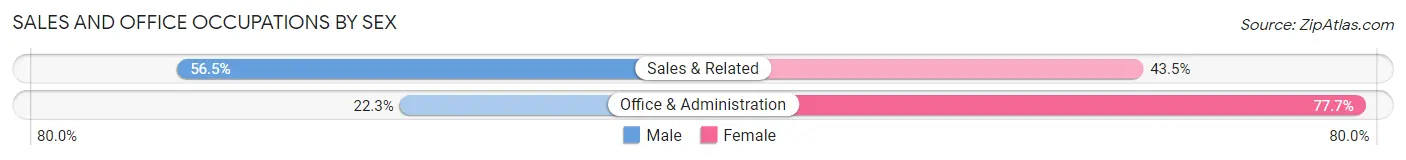
| Occupation | Male | Female |
| Sales & Related | 1,098 (56.5%) | 845 (43.5%) |
| Office & Administration | 388 (22.3%) | 1,350 (77.7%) |
| Total (Category) | 1,486 (40.4%) | 2,195 (59.6%) |
| Total (Overall) | 8,177 (54.7%) | 6,784 (45.3%) |
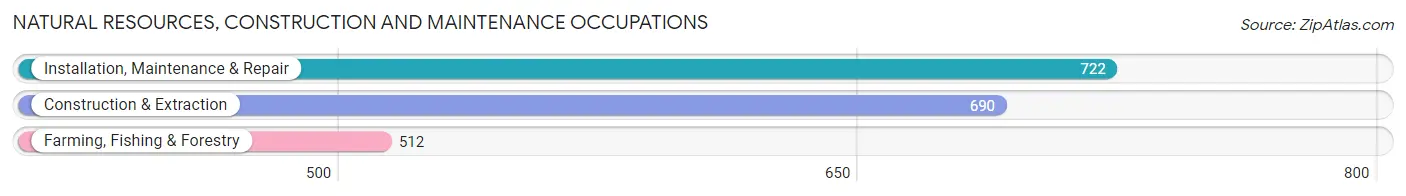
Natural Resources, Construction and Maintenance Occupations
The most common Natural Resources, Construction and Maintenance occupations in Clovis are Installation, Maintenance & Repair (722 | 4.8%), Construction & Extraction (690 | 4.6%), and Farming, Fishing & Forestry (512 | 3.4%).
Natural Resources, Construction and Maintenance Occupations by Sex
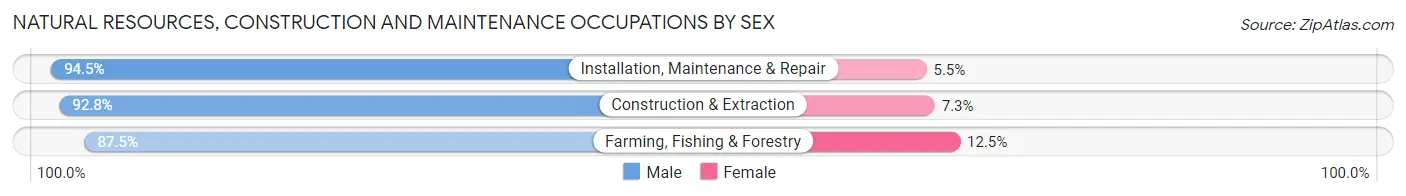
| Occupation | Male | Female |
| Farming, Fishing & Forestry | 448 (87.5%) | 64 (12.5%) |
| Construction & Extraction | 640 (92.7%) | 50 (7.2%) |
| Installation, Maintenance & Repair | 682 (94.5%) | 40 (5.5%) |
| Total (Category) | 1,770 (92.0%) | 154 (8.0%) |
| Total (Overall) | 8,177 (54.7%) | 6,784 (45.3%) |
Production, Transportation and Moving Occupations
The most common Production, Transportation and Moving occupations in Clovis are Transportation (1,124 | 7.5%), Production (798 | 5.3%), and Material Moving (652 | 4.4%).
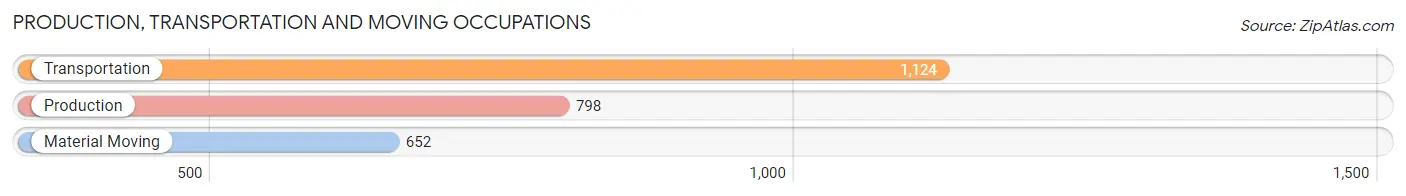
Production, Transportation and Moving Occupations by Sex
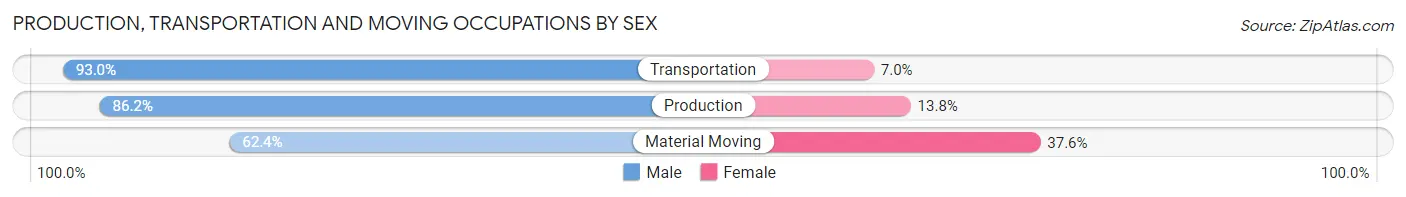
| Occupation | Male | Female |
| Production | 688 (86.2%) | 110 (13.8%) |
| Transportation | 1,045 (93.0%) | 79 (7.0%) |
| Material Moving | 407 (62.4%) | 245 (37.6%) |
| Total (Category) | 2,140 (83.1%) | 434 (16.9%) |
| Total (Overall) | 8,177 (54.7%) | 6,784 (45.3%) |
Employment Industries by Sex in Clovis
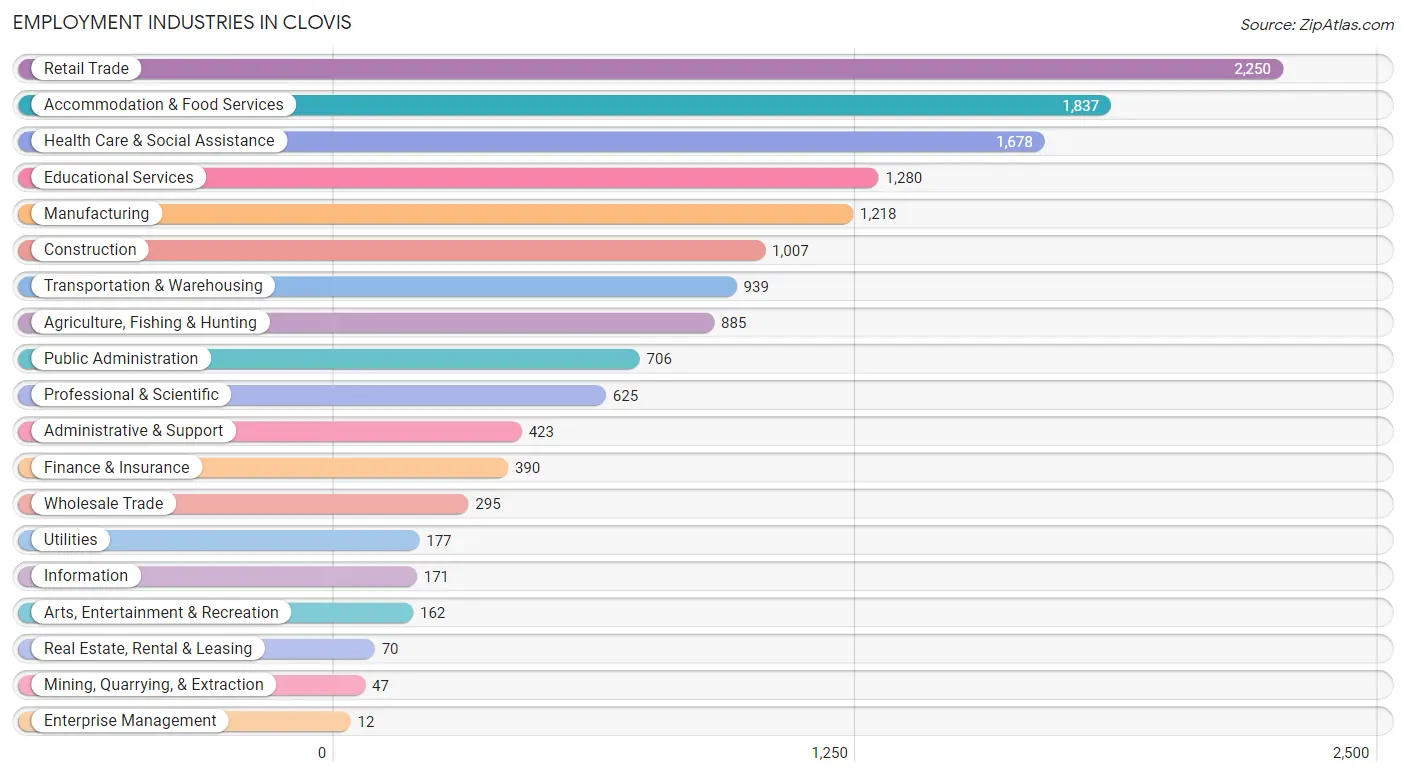
Employment Industries in Clovis
The major employment industries in Clovis include Retail Trade (2,250 | 15.0%), Accommodation & Food Services (1,837 | 12.3%), Health Care & Social Assistance (1,678 | 11.2%), Educational Services (1,280 | 8.6%), and Manufacturing (1,218 | 8.1%).
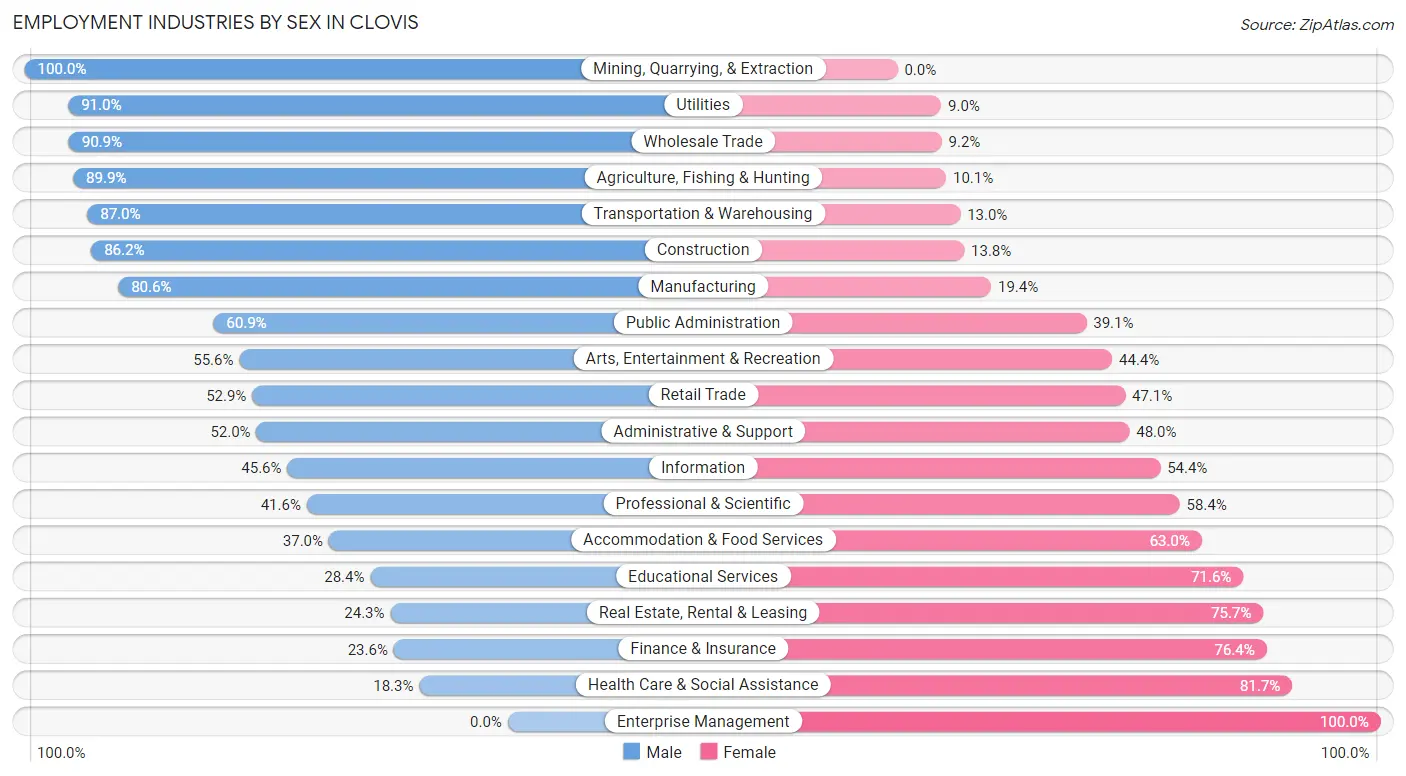
Employment Industries by Sex in Clovis
The Clovis industries that see more men than women are Mining, Quarrying, & Extraction (100.0%), Utilities (91.0%), and Wholesale Trade (90.8%), whereas the industries that tend to have a higher number of women are Enterprise Management (100.0%), Health Care & Social Assistance (81.7%), and Finance & Insurance (76.4%).
| Industry | Male | Female |
| Agriculture, Fishing & Hunting | 796 (89.9%) | 89 (10.1%) |
| Mining, Quarrying, & Extraction | 47 (100.0%) | 0 (0.0%) |
| Construction | 868 (86.2%) | 139 (13.8%) |
| Manufacturing | 982 (80.6%) | 236 (19.4%) |
| Wholesale Trade | 268 (90.8%) | 27 (9.1%) |
| Retail Trade | 1,190 (52.9%) | 1,060 (47.1%) |
| Transportation & Warehousing | 817 (87.0%) | 122 (13.0%) |
| Utilities | 161 (91.0%) | 16 (9.0%) |
| Information | 78 (45.6%) | 93 (54.4%) |
| Finance & Insurance | 92 (23.6%) | 298 (76.4%) |
| Real Estate, Rental & Leasing | 17 (24.3%) | 53 (75.7%) |
| Professional & Scientific | 260 (41.6%) | 365 (58.4%) |
| Enterprise Management | 0 (0.0%) | 12 (100.0%) |
| Administrative & Support | 220 (52.0%) | 203 (48.0%) |
| Educational Services | 364 (28.4%) | 916 (71.6%) |
| Health Care & Social Assistance | 307 (18.3%) | 1,371 (81.7%) |
| Arts, Entertainment & Recreation | 90 (55.6%) | 72 (44.4%) |
| Accommodation & Food Services | 680 (37.0%) | 1,157 (63.0%) |
| Public Administration | 430 (60.9%) | 276 (39.1%) |
| Total | 8,177 (54.7%) | 6,784 (45.3%) |
Education in Clovis
School Enrollment in Clovis
The most common levels of schooling among the 10,401 students in Clovis are high school (2,332 | 22.4%), middle school (2,224 | 21.4%), and elementary school (2,082 | 20.0%).
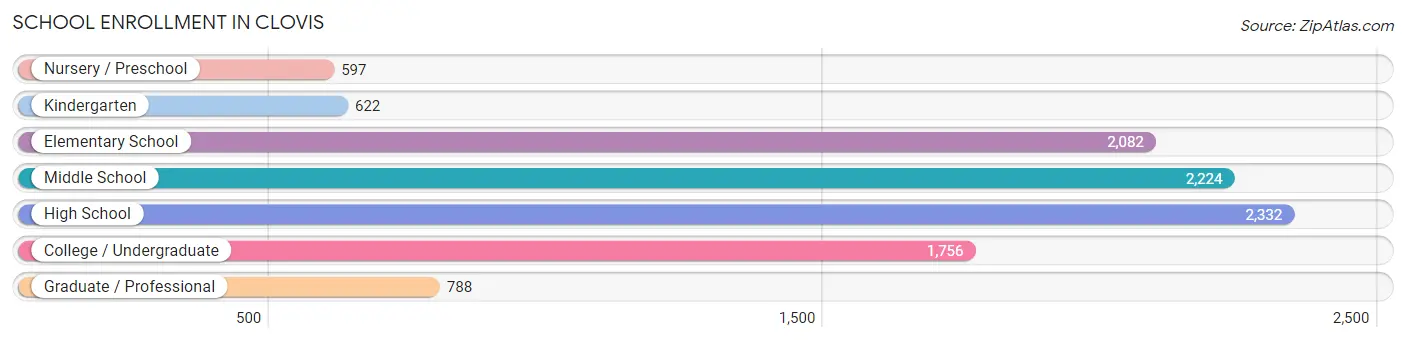
| School Level | # Students | % Students |
| Nursery / Preschool | 597 | 5.7% |
| Kindergarten | 622 | 6.0% |
| Elementary School | 2,082 | 20.0% |
| Middle School | 2,224 | 21.4% |
| High School | 2,332 | 22.4% |
| College / Undergraduate | 1,756 | 16.9% |
| Graduate / Professional | 788 | 7.6% |
| Total | 10,401 | 100.0% |
School Enrollment by Age by Funding Source in Clovis
Out of a total of 10,401 students who are enrolled in schools in Clovis, 624 (6.0%) attend a private institution, while the remaining 9,777 (94.0%) are enrolled in public schools. The age group of 35 years and over has the highest likelihood of being enrolled in private schools, with 132 (20.6% in the age bracket) enrolled. Conversely, the age group of 3 to 4 year olds has the lowest likelihood of being enrolled in a private school, with 581 (100.0% in the age bracket) attending a public institution.
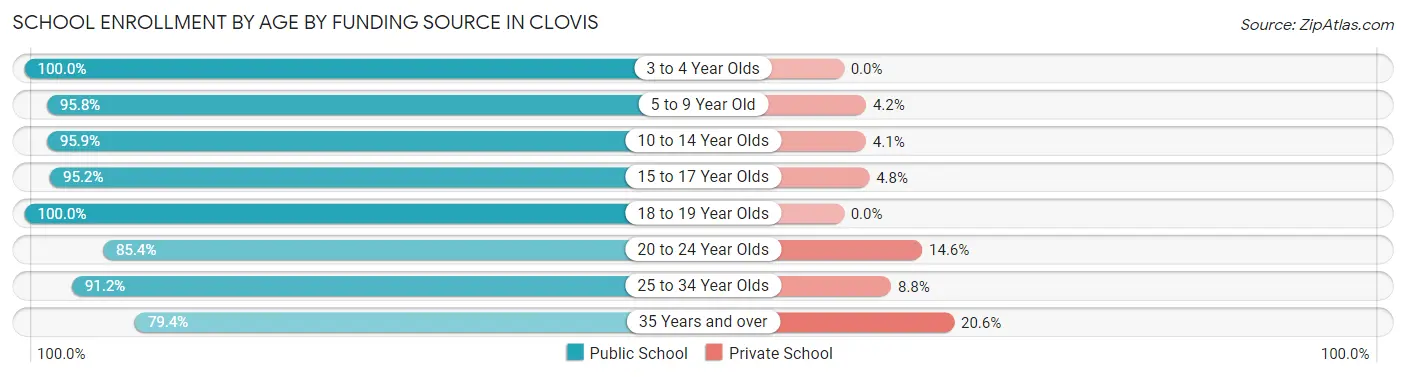
| Age Bracket | Public School | Private School |
| 3 to 4 Year Olds | 581 (100.0%) | 0 (0.0%) |
| 5 to 9 Year Old | 2,256 (95.8%) | 98 (4.2%) |
| 10 to 14 Year Olds | 2,917 (95.9%) | 126 (4.1%) |
| 15 to 17 Year Olds | 1,402 (95.2%) | 70 (4.8%) |
| 18 to 19 Year Olds | 543 (100.0%) | 0 (0.0%) |
| 20 to 24 Year Olds | 608 (85.4%) | 104 (14.6%) |
| 25 to 34 Year Olds | 961 (91.2%) | 93 (8.8%) |
| 35 Years and over | 510 (79.4%) | 132 (20.6%) |
| Total | 9,777 (94.0%) | 624 (6.0%) |
Educational Attainment by Field of Study in Clovis
Education (973 | 17.2%), business (804 | 14.2%), social sciences (779 | 13.8%), arts & humanities (532 | 9.4%), and bio, nature & agricultural (525 | 9.3%) are the most common fields of study among 5,664 individuals in Clovis who have obtained a bachelor's degree or higher.
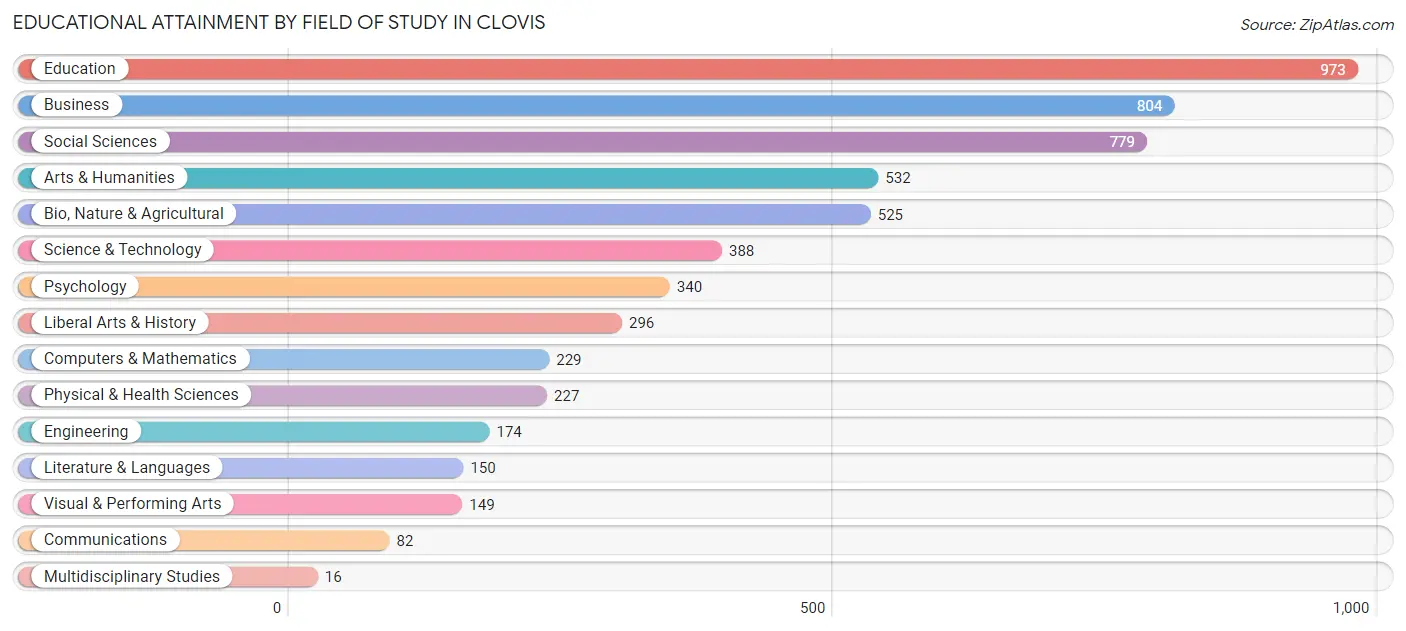
| Field of Study | # Graduates | % Graduates |
| Computers & Mathematics | 229 | 4.0% |
| Bio, Nature & Agricultural | 525 | 9.3% |
| Physical & Health Sciences | 227 | 4.0% |
| Psychology | 340 | 6.0% |
| Social Sciences | 779 | 13.8% |
| Engineering | 174 | 3.1% |
| Multidisciplinary Studies | 16 | 0.3% |
| Science & Technology | 388 | 6.9% |
| Business | 804 | 14.2% |
| Education | 973 | 17.2% |
| Literature & Languages | 150 | 2.6% |
| Liberal Arts & History | 296 | 5.2% |
| Visual & Performing Arts | 149 | 2.6% |
| Communications | 82 | 1.5% |
| Arts & Humanities | 532 | 9.4% |
| Total | 5,664 | 100.0% |
Transportation & Commute in Clovis
Vehicle Availability by Sex in Clovis
The most prevalent vehicle ownership categories in Clovis are males with 2 vehicles (4,382, accounting for 44.1%) and females with 2 vehicles (2,689, making up 64.4%).
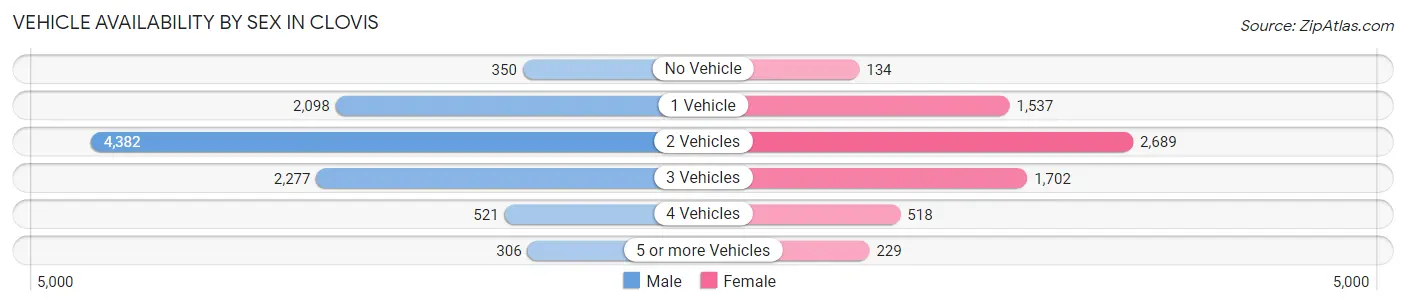
| Vehicles Available | Male | Female |
| No Vehicle | 350 (3.5%) | 134 (2.0%) |
| 1 Vehicle | 2,098 (21.1%) | 1,537 (22.6%) |
| 2 Vehicles | 4,382 (44.1%) | 2,689 (39.5%) |
| 3 Vehicles | 2,277 (22.9%) | 1,702 (25.0%) |
| 4 Vehicles | 521 (5.2%) | 518 (7.6%) |
| 5 or more Vehicles | 306 (3.1%) | 229 (3.4%) |
| Total | 9,934 (100.0%) | 6,809 (100.0%) |
Commute Time in Clovis
The most frequently occuring commute durations in Clovis are 10 to 14 minutes (3,981 commuters, 24.5%), 5 to 9 minutes (3,443 commuters, 21.1%), and 15 to 19 minutes (2,397 commuters, 14.7%).
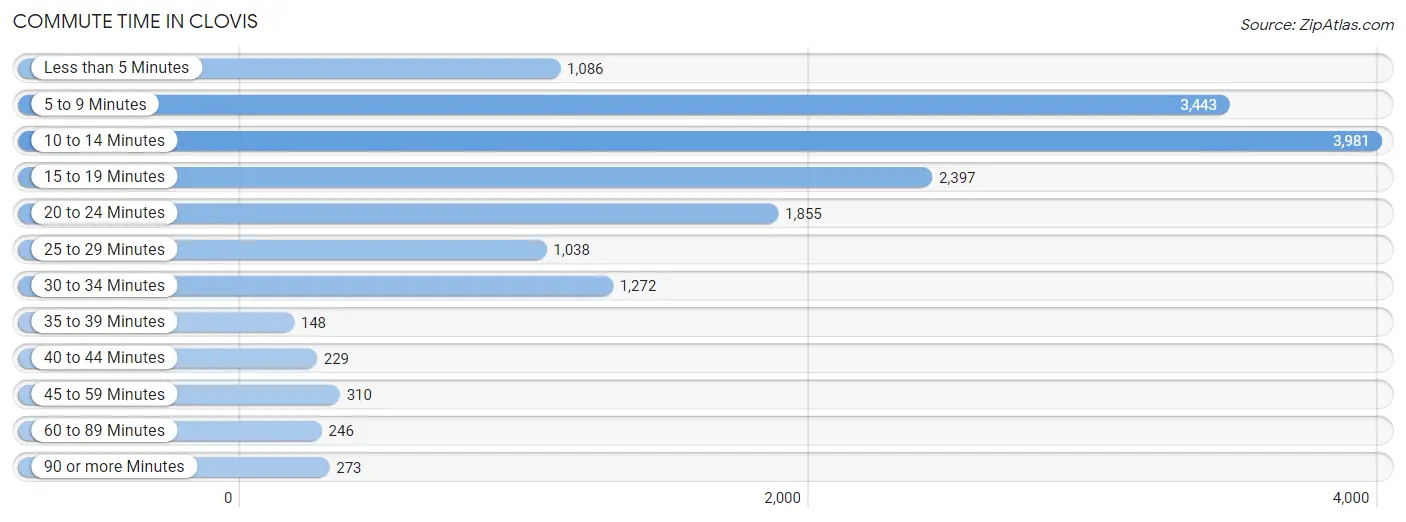
| Commute Time | # Commuters | % Commuters |
| Less than 5 Minutes | 1,086 | 6.7% |
| 5 to 9 Minutes | 3,443 | 21.1% |
| 10 to 14 Minutes | 3,981 | 24.5% |
| 15 to 19 Minutes | 2,397 | 14.7% |
| 20 to 24 Minutes | 1,855 | 11.4% |
| 25 to 29 Minutes | 1,038 | 6.4% |
| 30 to 34 Minutes | 1,272 | 7.8% |
| 35 to 39 Minutes | 148 | 0.9% |
| 40 to 44 Minutes | 229 | 1.4% |
| 45 to 59 Minutes | 310 | 1.9% |
| 60 to 89 Minutes | 246 | 1.5% |
| 90 or more Minutes | 273 | 1.7% |
Commute Time by Sex in Clovis
The most common commute times in Clovis are 10 to 14 minutes (1,915 commuters, 19.6%) for males and 10 to 14 minutes (2,066 commuters, 31.9%) for females.
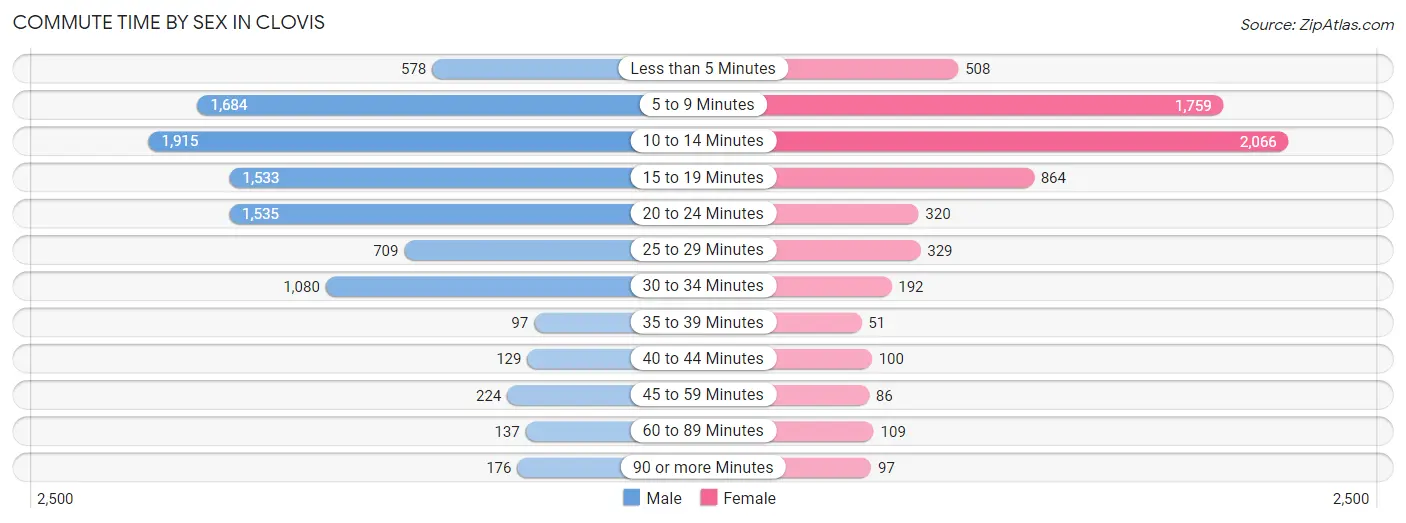
| Commute Time | Male | Female |
| Less than 5 Minutes | 578 (5.9%) | 508 (7.8%) |
| 5 to 9 Minutes | 1,684 (17.2%) | 1,759 (27.1%) |
| 10 to 14 Minutes | 1,915 (19.6%) | 2,066 (31.9%) |
| 15 to 19 Minutes | 1,533 (15.7%) | 864 (13.3%) |
| 20 to 24 Minutes | 1,535 (15.7%) | 320 (4.9%) |
| 25 to 29 Minutes | 709 (7.2%) | 329 (5.1%) |
| 30 to 34 Minutes | 1,080 (11.0%) | 192 (3.0%) |
| 35 to 39 Minutes | 97 (1.0%) | 51 (0.8%) |
| 40 to 44 Minutes | 129 (1.3%) | 100 (1.5%) |
| 45 to 59 Minutes | 224 (2.3%) | 86 (1.3%) |
| 60 to 89 Minutes | 137 (1.4%) | 109 (1.7%) |
| 90 or more Minutes | 176 (1.8%) | 97 (1.5%) |
Time of Departure to Work by Sex in Clovis
The most frequent times of departure to work in Clovis are 7:00 AM to 7:29 AM (1,691, 17.3%) for males and 7:30 AM to 7:59 AM (1,721, 26.6%) for females.
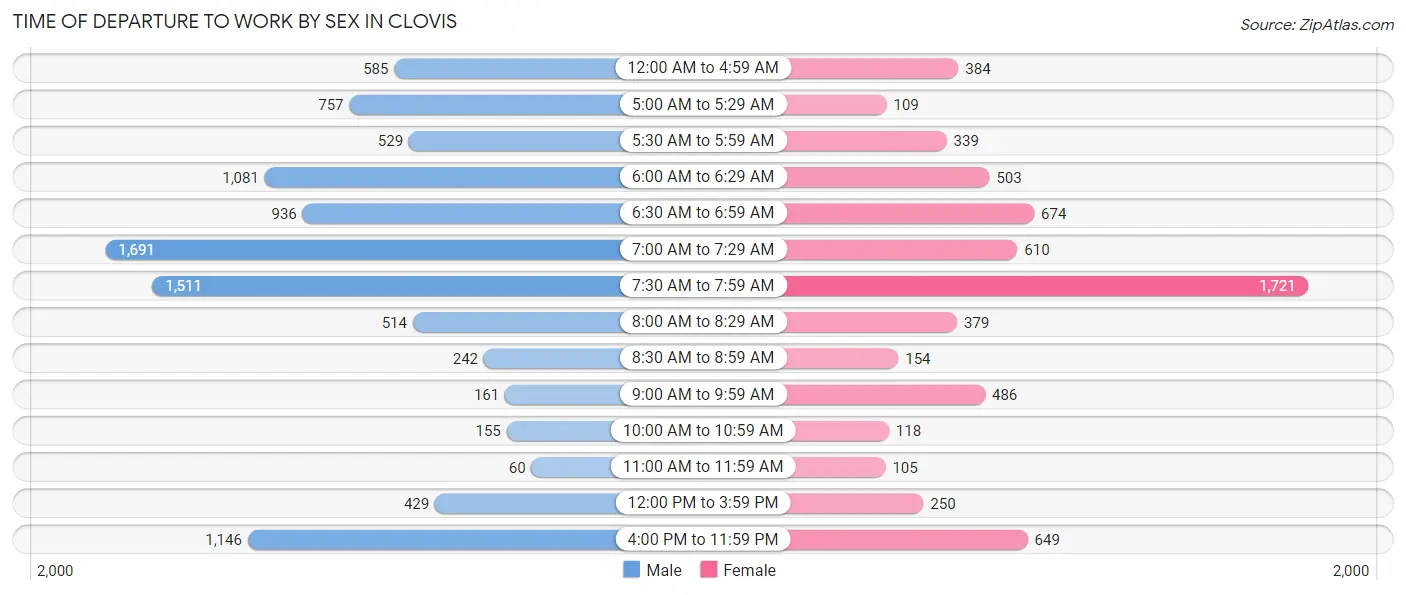
| Time of Departure | Male | Female |
| 12:00 AM to 4:59 AM | 585 (6.0%) | 384 (5.9%) |
| 5:00 AM to 5:29 AM | 757 (7.7%) | 109 (1.7%) |
| 5:30 AM to 5:59 AM | 529 (5.4%) | 339 (5.2%) |
| 6:00 AM to 6:29 AM | 1,081 (11.0%) | 503 (7.8%) |
| 6:30 AM to 6:59 AM | 936 (9.6%) | 674 (10.4%) |
| 7:00 AM to 7:29 AM | 1,691 (17.3%) | 610 (9.4%) |
| 7:30 AM to 7:59 AM | 1,511 (15.4%) | 1,721 (26.6%) |
| 8:00 AM to 8:29 AM | 514 (5.2%) | 379 (5.9%) |
| 8:30 AM to 8:59 AM | 242 (2.5%) | 154 (2.4%) |
| 9:00 AM to 9:59 AM | 161 (1.6%) | 486 (7.5%) |
| 10:00 AM to 10:59 AM | 155 (1.6%) | 118 (1.8%) |
| 11:00 AM to 11:59 AM | 60 (0.6%) | 105 (1.6%) |
| 12:00 PM to 3:59 PM | 429 (4.4%) | 250 (3.9%) |
| 4:00 PM to 11:59 PM | 1,146 (11.7%) | 649 (10.0%) |
| Total | 9,797 (100.0%) | 6,481 (100.0%) |
Housing Occupancy in Clovis
Occupancy by Ownership in Clovis
Of the total 15,031 dwellings in Clovis, owner-occupied units account for 8,820 (58.7%), while renter-occupied units make up 6,211 (41.3%).
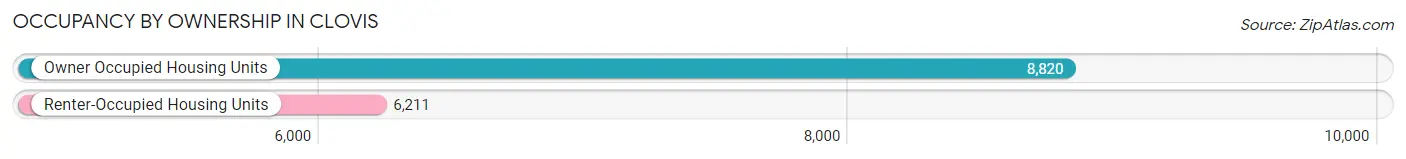
| Occupancy | # Housing Units | % Housing Units |
| Owner Occupied Housing Units | 8,820 | 58.7% |
| Renter-Occupied Housing Units | 6,211 | 41.3% |
| Total Occupied Housing Units | 15,031 | 100.0% |
Occupancy by Household Size in Clovis
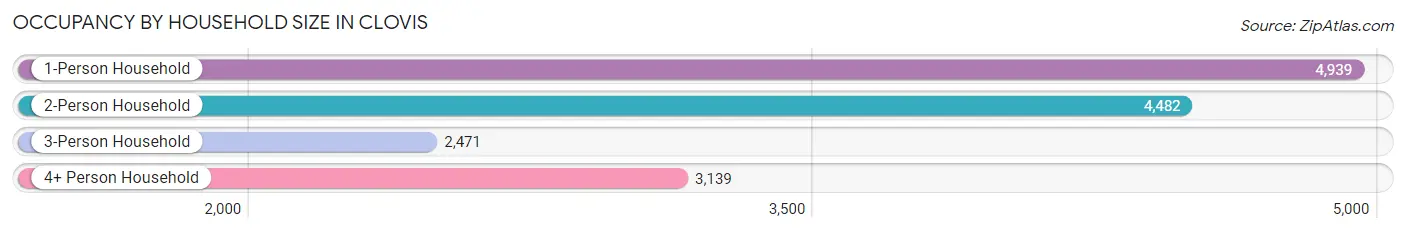
| Household Size | # Housing Units | % Housing Units |
| 1-Person Household | 4,939 | 32.9% |
| 2-Person Household | 4,482 | 29.8% |
| 3-Person Household | 2,471 | 16.4% |
| 4+ Person Household | 3,139 | 20.9% |
| Total Housing Units | 15,031 | 100.0% |
Occupancy by Ownership by Household Size in Clovis
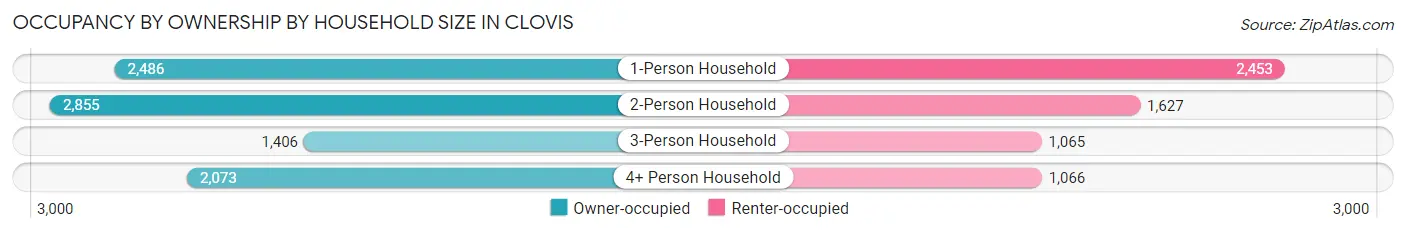
| Household Size | Owner-occupied | Renter-occupied |
| 1-Person Household | 2,486 (50.3%) | 2,453 (49.7%) |
| 2-Person Household | 2,855 (63.7%) | 1,627 (36.3%) |
| 3-Person Household | 1,406 (56.9%) | 1,065 (43.1%) |
| 4+ Person Household | 2,073 (66.0%) | 1,066 (34.0%) |
| Total Housing Units | 8,820 (58.7%) | 6,211 (41.3%) |
Occupancy by Educational Attainment in Clovis
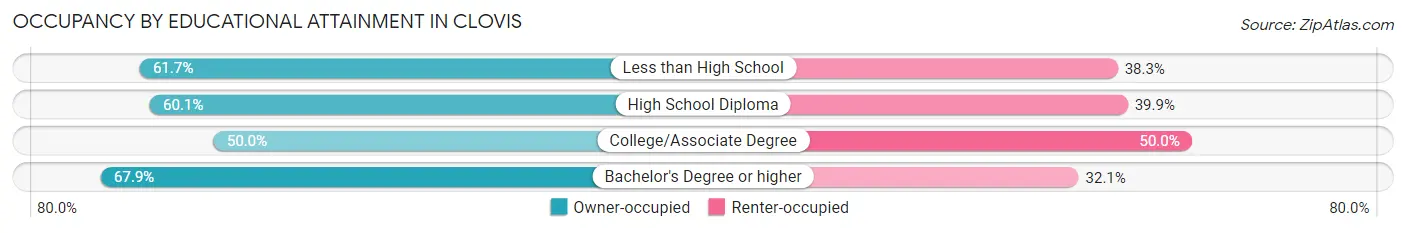
| Household Size | Owner-occupied | Renter-occupied |
| Less than High School | 1,686 (61.7%) | 1,047 (38.3%) |
| High School Diploma | 2,265 (60.1%) | 1,504 (39.9%) |
| College/Associate Degree | 2,573 (50.0%) | 2,574 (50.0%) |
| Bachelor's Degree or higher | 2,296 (67.9%) | 1,086 (32.1%) |
Occupancy by Age of Householder in Clovis
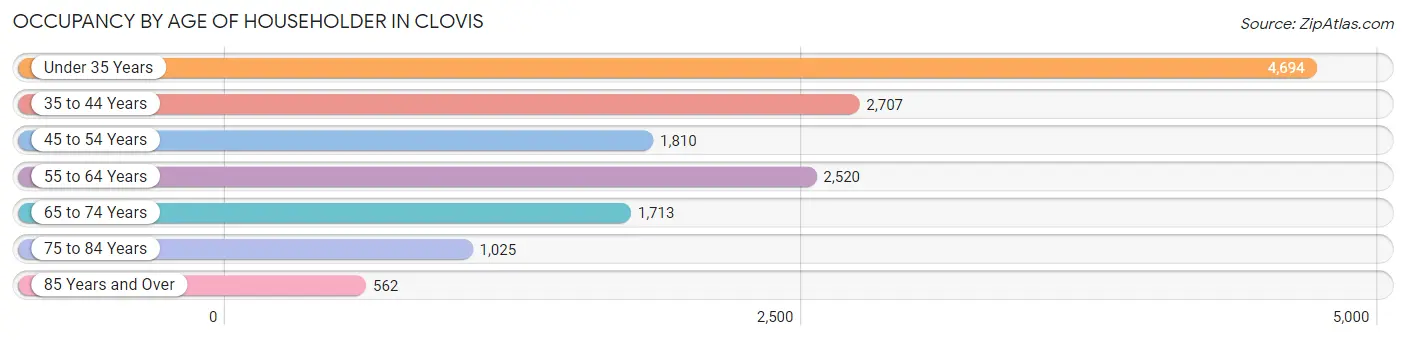
| Age Bracket | # Households | % Households |
| Under 35 Years | 4,694 | 31.2% |
| 35 to 44 Years | 2,707 | 18.0% |
| 45 to 54 Years | 1,810 | 12.0% |
| 55 to 64 Years | 2,520 | 16.8% |
| 65 to 74 Years | 1,713 | 11.4% |
| 75 to 84 Years | 1,025 | 6.8% |
| 85 Years and Over | 562 | 3.7% |
| Total | 15,031 | 100.0% |
Housing Finances in Clovis
Median Income by Occupancy in Clovis
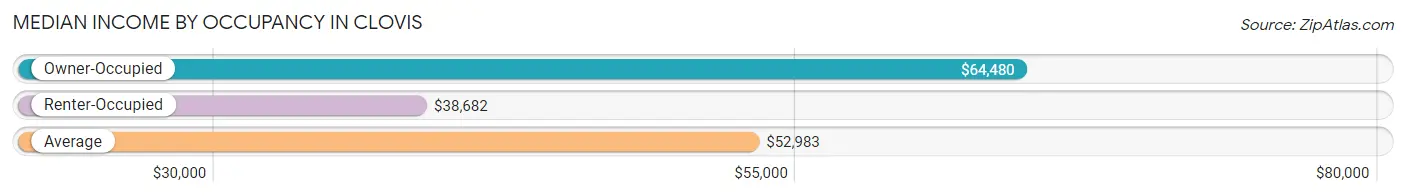
| Occupancy Type | # Households | Median Income |
| Owner-Occupied | 8,820 (58.7%) | $64,480 |
| Renter-Occupied | 6,211 (41.3%) | $38,682 |
| Average | 15,031 (100.0%) | $52,983 |
Occupancy by Householder Income Bracket in Clovis
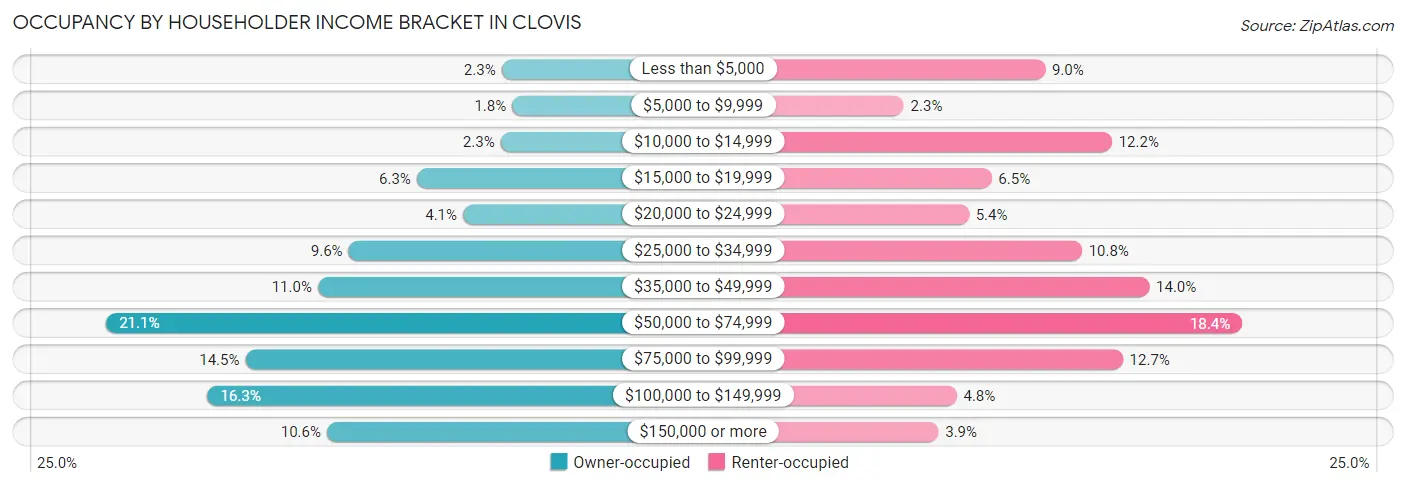
| Income Bracket | Owner-occupied | Renter-occupied |
| Less than $5,000 | 202 (2.3%) | 560 (9.0%) |
| $5,000 to $9,999 | 158 (1.8%) | 142 (2.3%) |
| $10,000 to $14,999 | 206 (2.3%) | 758 (12.2%) |
| $15,000 to $19,999 | 558 (6.3%) | 402 (6.5%) |
| $20,000 to $24,999 | 364 (4.1%) | 335 (5.4%) |
| $25,000 to $34,999 | 845 (9.6%) | 669 (10.8%) |
| $35,000 to $49,999 | 974 (11.0%) | 868 (14.0%) |
| $50,000 to $74,999 | 1,862 (21.1%) | 1,143 (18.4%) |
| $75,000 to $99,999 | 1,278 (14.5%) | 790 (12.7%) |
| $100,000 to $149,999 | 1,437 (16.3%) | 299 (4.8%) |
| $150,000 or more | 936 (10.6%) | 245 (3.9%) |
| Total | 8,820 (100.0%) | 6,211 (100.0%) |
Monthly Housing Cost Tiers in Clovis
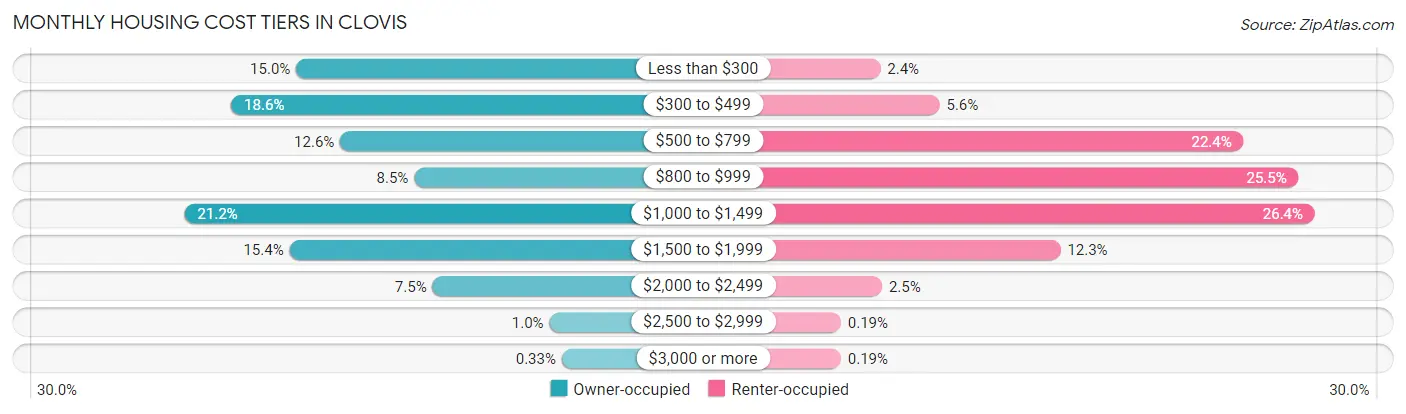
| Monthly Cost | Owner-occupied | Renter-occupied |
| Less than $300 | 1,323 (15.0%) | 147 (2.4%) |
| $300 to $499 | 1,640 (18.6%) | 350 (5.6%) |
| $500 to $799 | 1,109 (12.6%) | 1,393 (22.4%) |
| $800 to $999 | 748 (8.5%) | 1,582 (25.5%) |
| $1,000 to $1,499 | 1,867 (21.2%) | 1,638 (26.4%) |
| $1,500 to $1,999 | 1,356 (15.4%) | 765 (12.3%) |
| $2,000 to $2,499 | 659 (7.5%) | 153 (2.5%) |
| $2,500 to $2,999 | 89 (1.0%) | 12 (0.2%) |
| $3,000 or more | 29 (0.3%) | 12 (0.2%) |
| Total | 8,820 (100.0%) | 6,211 (100.0%) |
Physical Housing Characteristics in Clovis
Housing Structures in Clovis
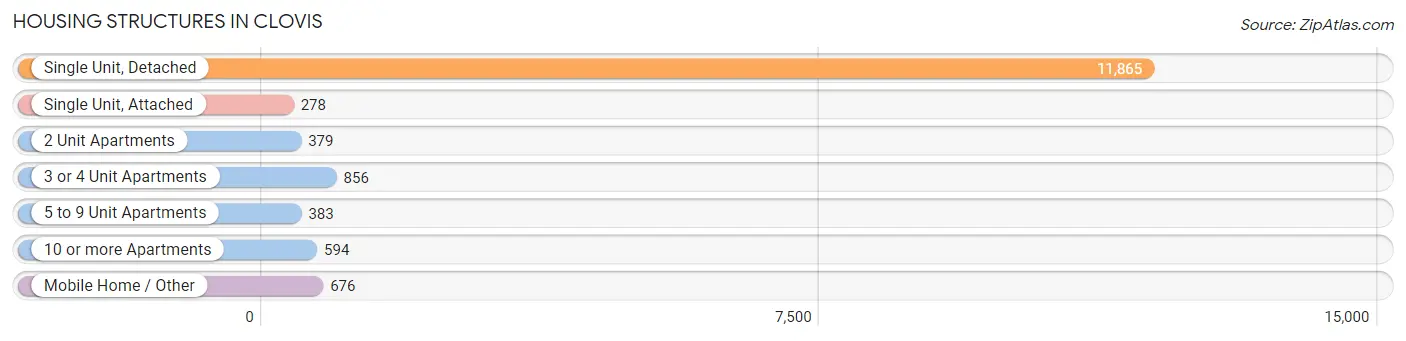
| Structure Type | # Housing Units | % Housing Units |
| Single Unit, Detached | 11,865 | 78.9% |
| Single Unit, Attached | 278 | 1.8% |
| 2 Unit Apartments | 379 | 2.5% |
| 3 or 4 Unit Apartments | 856 | 5.7% |
| 5 to 9 Unit Apartments | 383 | 2.5% |
| 10 or more Apartments | 594 | 4.0% |
| Mobile Home / Other | 676 | 4.5% |
| Total | 15,031 | 100.0% |
Housing Structures by Occupancy in Clovis
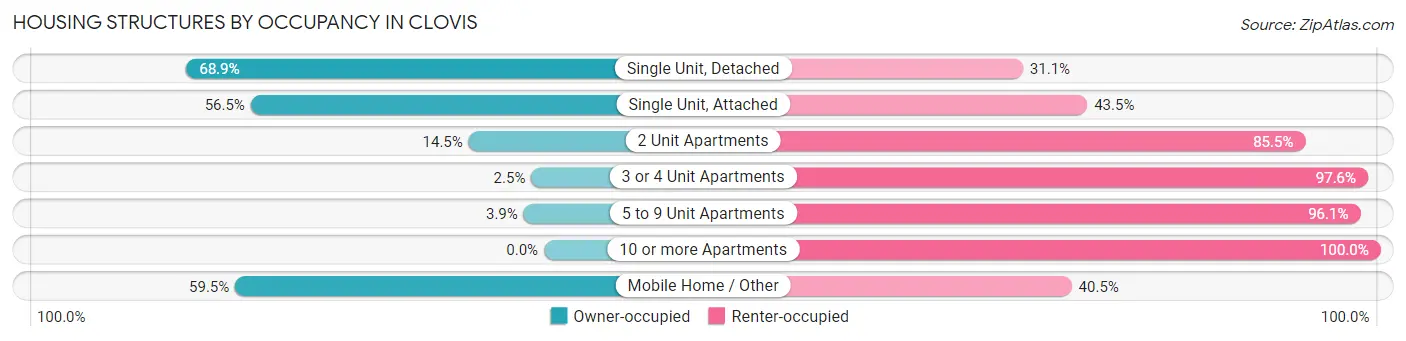
| Structure Type | Owner-occupied | Renter-occupied |
| Single Unit, Detached | 8,170 (68.9%) | 3,695 (31.1%) |
| Single Unit, Attached | 157 (56.5%) | 121 (43.5%) |
| 2 Unit Apartments | 55 (14.5%) | 324 (85.5%) |
| 3 or 4 Unit Apartments | 21 (2.5%) | 835 (97.6%) |
| 5 to 9 Unit Apartments | 15 (3.9%) | 368 (96.1%) |
| 10 or more Apartments | 0 (0.0%) | 594 (100.0%) |
| Mobile Home / Other | 402 (59.5%) | 274 (40.5%) |
| Total | 8,820 (58.7%) | 6,211 (41.3%) |
Housing Structures by Number of Rooms in Clovis
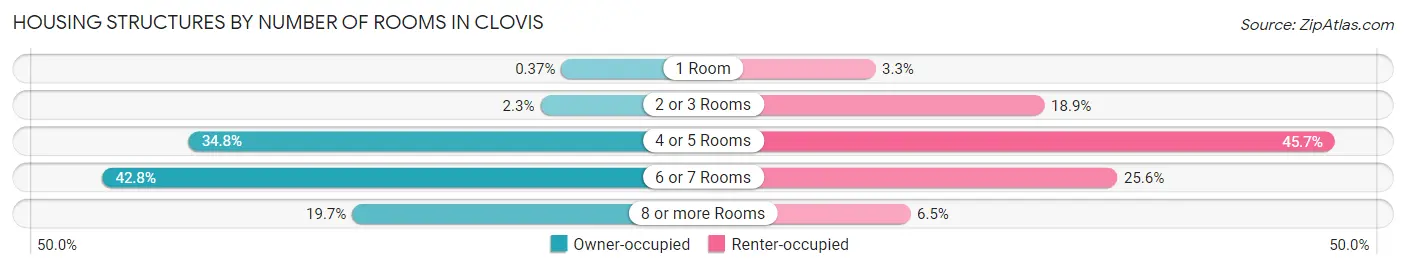
| Number of Rooms | Owner-occupied | Renter-occupied |
| 1 Room | 33 (0.4%) | 202 (3.3%) |
| 2 or 3 Rooms | 204 (2.3%) | 1,173 (18.9%) |
| 4 or 5 Rooms | 3,071 (34.8%) | 2,841 (45.7%) |
| 6 or 7 Rooms | 3,774 (42.8%) | 1,592 (25.6%) |
| 8 or more Rooms | 1,738 (19.7%) | 403 (6.5%) |
| Total | 8,820 (100.0%) | 6,211 (100.0%) |
Housing Structure by Heating Type in Clovis
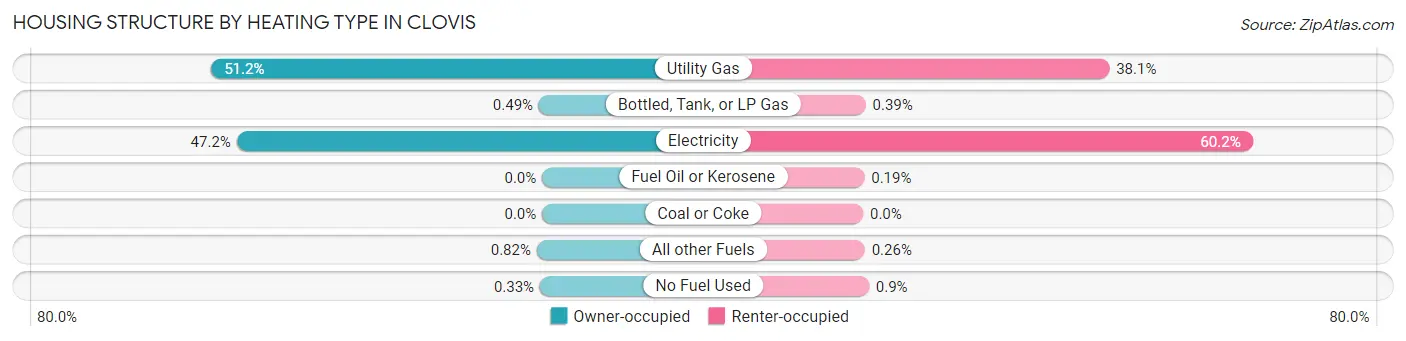
| Heating Type | Owner-occupied | Renter-occupied |
| Utility Gas | 4,511 (51.1%) | 2,364 (38.1%) |
| Bottled, Tank, or LP Gas | 43 (0.5%) | 24 (0.4%) |
| Electricity | 4,165 (47.2%) | 3,739 (60.2%) |
| Fuel Oil or Kerosene | 0 (0.0%) | 12 (0.2%) |
| Coal or Coke | 0 (0.0%) | 0 (0.0%) |
| All other Fuels | 72 (0.8%) | 16 (0.3%) |
| No Fuel Used | 29 (0.3%) | 56 (0.9%) |
| Total | 8,820 (100.0%) | 6,211 (100.0%) |
Household Vehicle Usage in Clovis
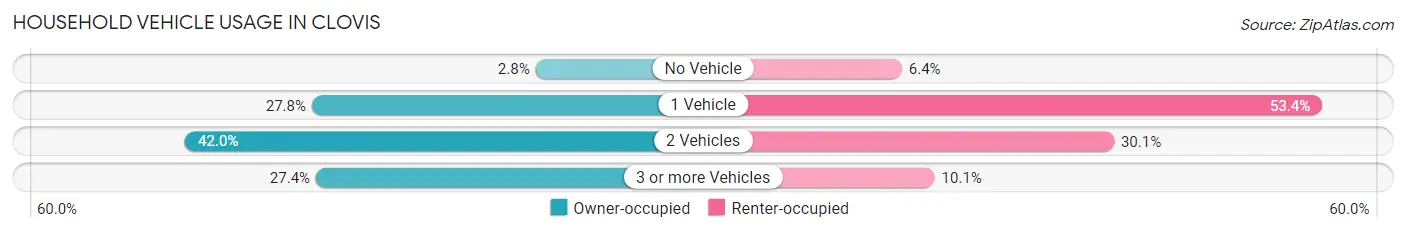
| Vehicles per Household | Owner-occupied | Renter-occupied |
| No Vehicle | 244 (2.8%) | 396 (6.4%) |
| 1 Vehicle | 2,455 (27.8%) | 3,319 (53.4%) |
| 2 Vehicles | 3,707 (42.0%) | 1,872 (30.1%) |
| 3 or more Vehicles | 2,414 (27.4%) | 624 (10.1%) |
| Total | 8,820 (100.0%) | 6,211 (100.0%) |
Real Estate & Mortgages in Clovis
Real Estate and Mortgage Overview in Clovis
| Characteristic | Without Mortgage | With Mortgage |
| Housing Units | 3,580 | 5,240 |
| Median Property Value | $105,400 | $181,700 |
| Median Household Income | $45,063 | $765 |
| Monthly Housing Costs | $360 | $29 |
| Real Estate Taxes | $520 | $249 |
Property Value by Mortgage Status in Clovis
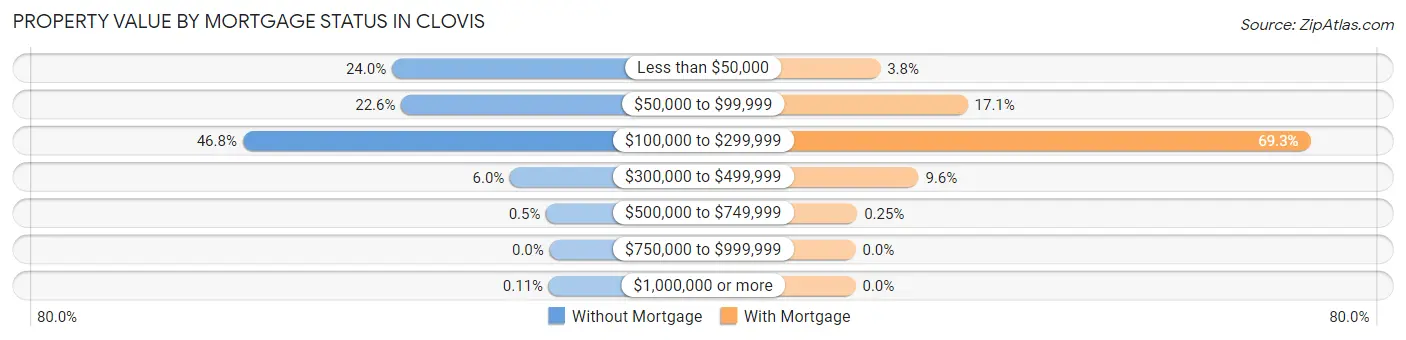
| Property Value | Without Mortgage | With Mortgage |
| Less than $50,000 | 860 (24.0%) | 197 (3.8%) |
| $50,000 to $99,999 | 809 (22.6%) | 895 (17.1%) |
| $100,000 to $299,999 | 1,674 (46.8%) | 3,632 (69.3%) |
| $300,000 to $499,999 | 215 (6.0%) | 503 (9.6%) |
| $500,000 to $749,999 | 18 (0.5%) | 13 (0.3%) |
| $750,000 to $999,999 | 0 (0.0%) | 0 (0.0%) |
| $1,000,000 or more | 4 (0.1%) | 0 (0.0%) |
| Total | 3,580 (100.0%) | 5,240 (100.0%) |
Household Income by Mortgage Status in Clovis
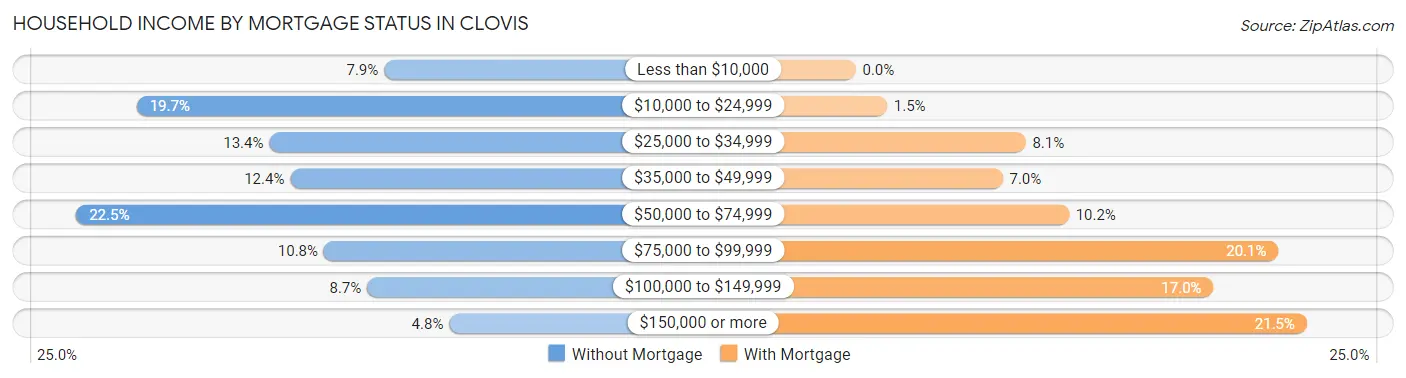
| Household Income | Without Mortgage | With Mortgage |
| Less than $10,000 | 282 (7.9%) | 0 (0.0%) |
| $10,000 to $24,999 | 704 (19.7%) | 78 (1.5%) |
| $25,000 to $34,999 | 478 (13.4%) | 424 (8.1%) |
| $35,000 to $49,999 | 442 (12.3%) | 367 (7.0%) |
| $50,000 to $74,999 | 807 (22.5%) | 532 (10.2%) |
| $75,000 to $99,999 | 385 (10.7%) | 1,055 (20.1%) |
| $100,000 to $149,999 | 311 (8.7%) | 893 (17.0%) |
| $150,000 or more | 171 (4.8%) | 1,126 (21.5%) |
| Total | 3,580 (100.0%) | 5,240 (100.0%) |
Property Value to Household Income Ratio in Clovis
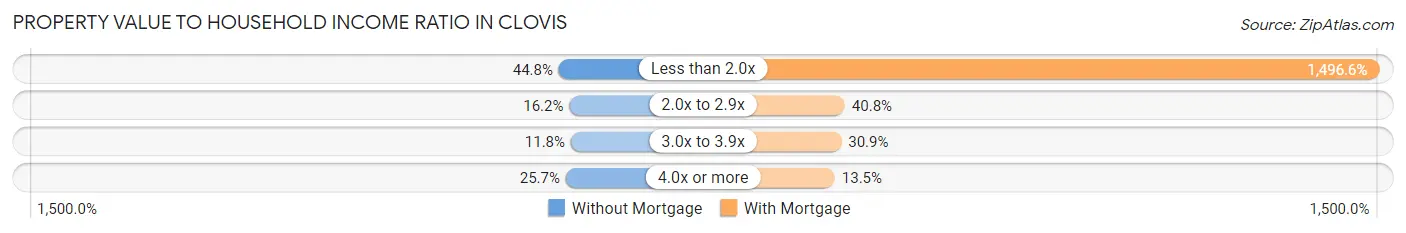
| Value-to-Income Ratio | Without Mortgage | With Mortgage |
| Less than 2.0x | 1,604 (44.8%) | 78,422 (1,496.6%) |
| 2.0x to 2.9x | 578 (16.2%) | 2,138 (40.8%) |
| 3.0x to 3.9x | 424 (11.8%) | 1,619 (30.9%) |
| 4.0x or more | 919 (25.7%) | 706 (13.5%) |
| Total | 3,580 (100.0%) | 5,240 (100.0%) |
Real Estate Taxes by Mortgage Status in Clovis

| Property Taxes | Without Mortgage | With Mortgage |
| Less than $800 | 2,233 (62.4%) | 16 (0.3%) |
| $800 to $1,499 | 941 (26.3%) | 1,489 (28.4%) |
| $800 to $1,499 | 273 (7.6%) | 1,807 (34.5%) |
| Total | 3,580 (100.0%) | 5,240 (100.0%) |
Health & Disability in Clovis
Health Insurance Coverage by Age in Clovis
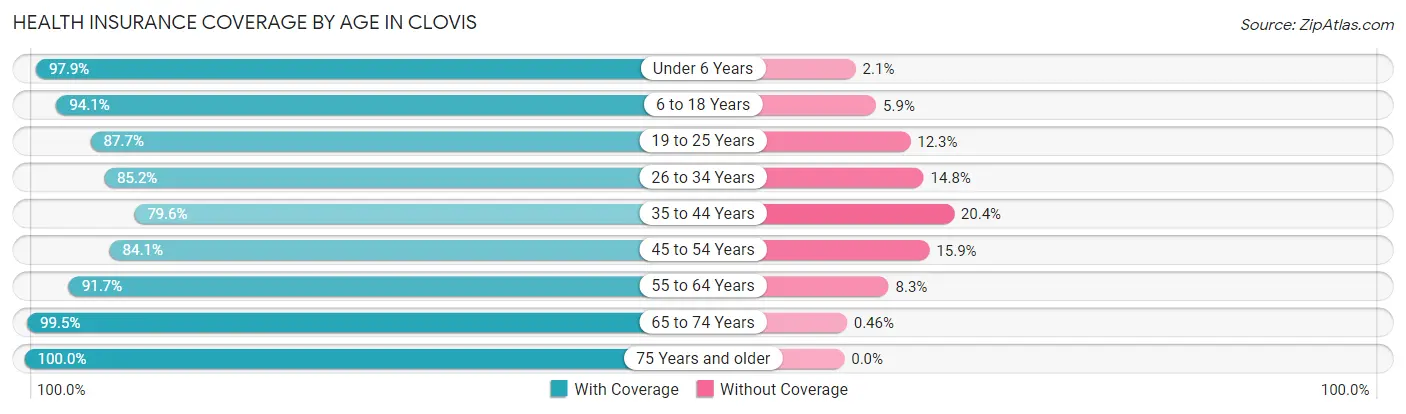
| Age Bracket | With Coverage | Without Coverage |
| Under 6 Years | 3,554 (97.9%) | 77 (2.1%) |
| 6 to 18 Years | 6,730 (94.1%) | 425 (5.9%) |
| 19 to 25 Years | 3,280 (87.7%) | 460 (12.3%) |
| 26 to 34 Years | 4,342 (85.2%) | 754 (14.8%) |
| 35 to 44 Years | 3,441 (79.6%) | 884 (20.4%) |
| 45 to 54 Years | 2,851 (84.1%) | 538 (15.9%) |
| 55 to 64 Years | 3,586 (91.7%) | 323 (8.3%) |
| 65 to 74 Years | 2,616 (99.5%) | 12 (0.5%) |
| 75 Years and older | 2,074 (100.0%) | 0 (0.0%) |
| Total | 32,474 (90.3%) | 3,473 (9.7%) |
Health Insurance Coverage by Citizenship Status in Clovis
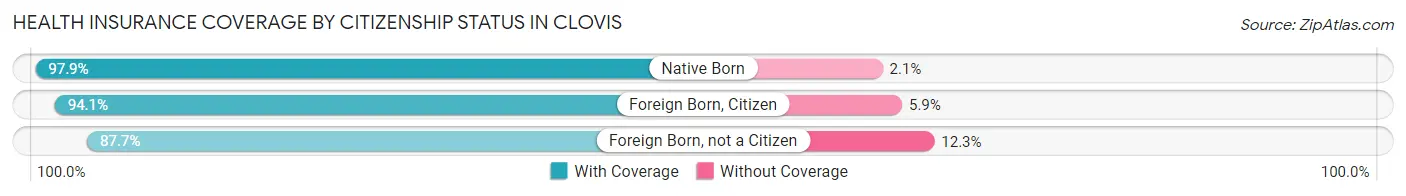
| Citizenship Status | With Coverage | Without Coverage |
| Native Born | 3,554 (97.9%) | 77 (2.1%) |
| Foreign Born, Citizen | 6,730 (94.1%) | 425 (5.9%) |
| Foreign Born, not a Citizen | 3,280 (87.7%) | 460 (12.3%) |
Health Insurance Coverage by Household Income in Clovis
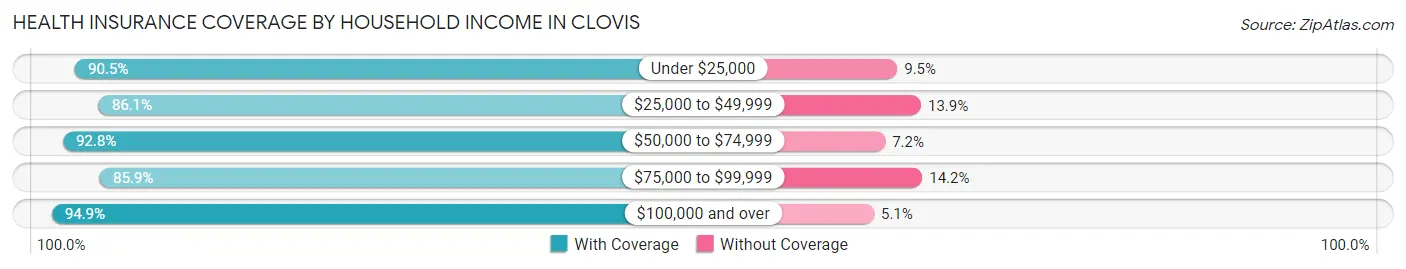
| Household Income | With Coverage | Without Coverage |
| Under $25,000 | 6,257 (90.5%) | 654 (9.5%) |
| $25,000 to $49,999 | 6,350 (86.1%) | 1,026 (13.9%) |
| $50,000 to $74,999 | 7,187 (92.8%) | 558 (7.2%) |
| $75,000 to $99,999 | 4,903 (85.9%) | 808 (14.1%) |
| $100,000 and over | 7,706 (94.9%) | 414 (5.1%) |
Public vs Private Health Insurance Coverage by Age in Clovis
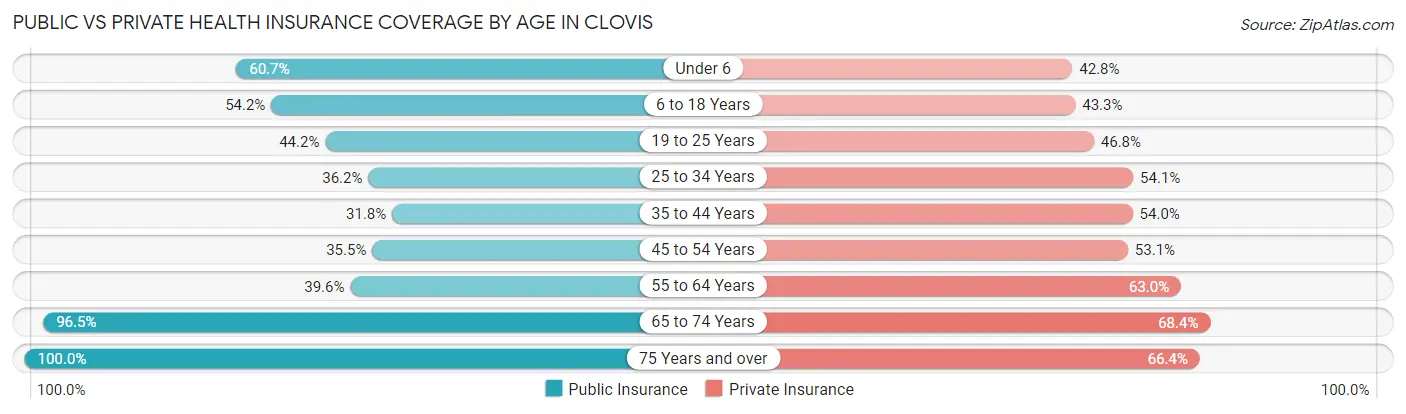
| Age Bracket | Public Insurance | Private Insurance |
| Under 6 | 2,204 (60.7%) | 1,554 (42.8%) |
| 6 to 18 Years | 3,880 (54.2%) | 3,101 (43.3%) |
| 19 to 25 Years | 1,653 (44.2%) | 1,750 (46.8%) |
| 25 to 34 Years | 1,845 (36.2%) | 2,756 (54.1%) |
| 35 to 44 Years | 1,375 (31.8%) | 2,335 (54.0%) |
| 45 to 54 Years | 1,202 (35.5%) | 1,800 (53.1%) |
| 55 to 64 Years | 1,546 (39.6%) | 2,461 (63.0%) |
| 65 to 74 Years | 2,537 (96.5%) | 1,797 (68.4%) |
| 75 Years and over | 2,074 (100.0%) | 1,378 (66.4%) |
| Total | 18,316 (50.9%) | 18,932 (52.7%) |
Disability Status by Sex by Age in Clovis
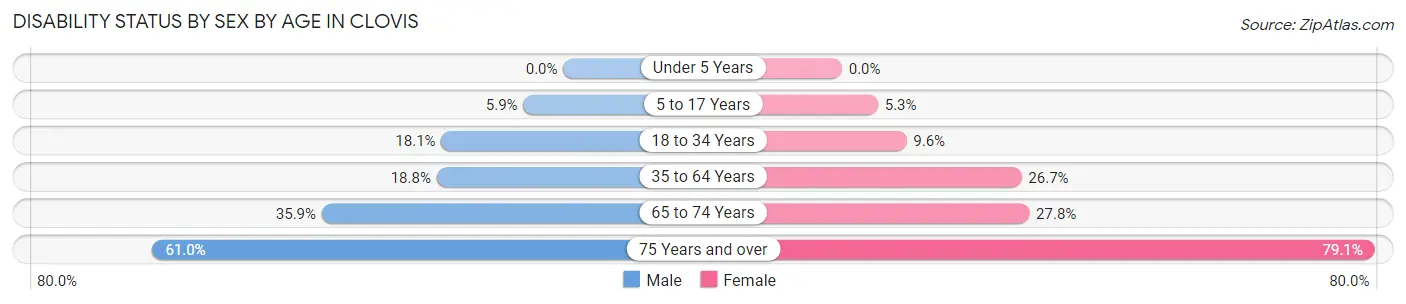
| Age Bracket | Male | Female |
| Under 5 Years | 0 (0.0%) | 0 (0.0%) |
| 5 to 17 Years | 212 (5.9%) | 193 (5.3%) |
| 18 to 34 Years | 827 (18.1%) | 468 (9.6%) |
| 35 to 64 Years | 1,053 (18.8%) | 1,606 (26.7%) |
| 65 to 74 Years | 450 (35.9%) | 382 (27.8%) |
| 75 Years and over | 471 (61.0%) | 1,030 (79.1%) |
Disability Class by Sex by Age in Clovis
Disability Class: Hearing Difficulty
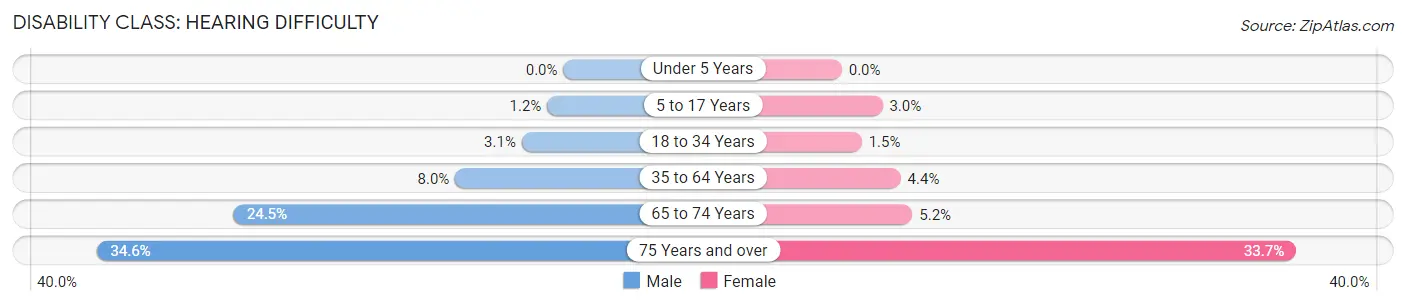
| Age Bracket | Male | Female |
| Under 5 Years | 0 (0.0%) | 0 (0.0%) |
| 5 to 17 Years | 43 (1.2%) | 109 (3.0%) |
| 18 to 34 Years | 141 (3.1%) | 72 (1.5%) |
| 35 to 64 Years | 450 (8.0%) | 263 (4.4%) |
| 65 to 74 Years | 307 (24.5%) | 72 (5.2%) |
| 75 Years and over | 267 (34.6%) | 439 (33.7%) |
Disability Class: Vision Difficulty
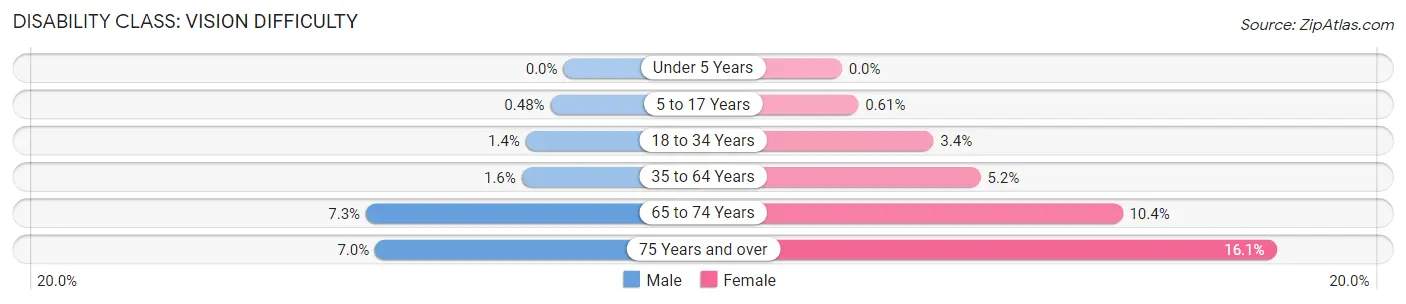
| Age Bracket | Male | Female |
| Under 5 Years | 0 (0.0%) | 0 (0.0%) |
| 5 to 17 Years | 17 (0.5%) | 22 (0.6%) |
| 18 to 34 Years | 64 (1.4%) | 166 (3.4%) |
| 35 to 64 Years | 87 (1.5%) | 310 (5.1%) |
| 65 to 74 Years | 92 (7.3%) | 143 (10.4%) |
| 75 Years and over | 54 (7.0%) | 210 (16.1%) |
Disability Class: Cognitive Difficulty
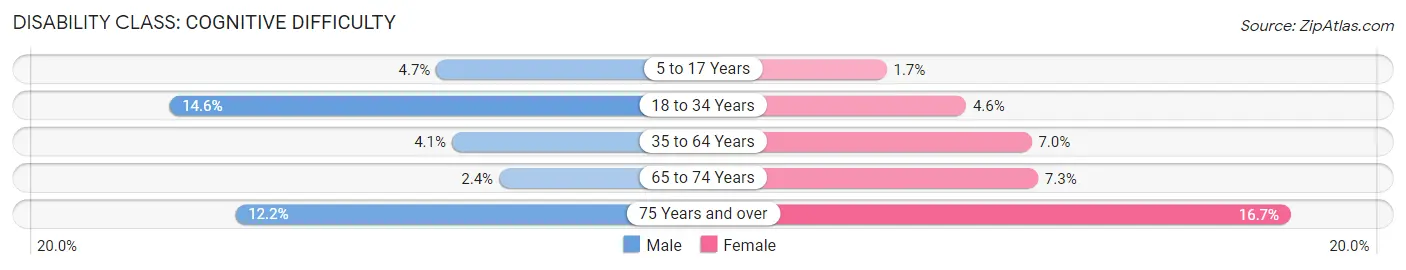
| Age Bracket | Male | Female |
| 5 to 17 Years | 169 (4.7%) | 60 (1.7%) |
| 18 to 34 Years | 668 (14.6%) | 225 (4.6%) |
| 35 to 64 Years | 232 (4.1%) | 424 (7.0%) |
| 65 to 74 Years | 30 (2.4%) | 100 (7.3%) |
| 75 Years and over | 94 (12.2%) | 217 (16.7%) |
Disability Class: Ambulatory Difficulty
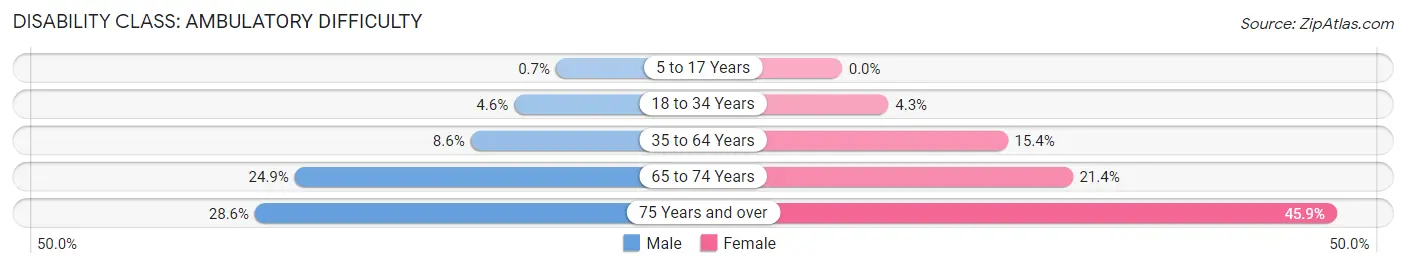
| Age Bracket | Male | Female |
| 5 to 17 Years | 25 (0.7%) | 0 (0.0%) |
| 18 to 34 Years | 209 (4.6%) | 211 (4.3%) |
| 35 to 64 Years | 483 (8.6%) | 926 (15.4%) |
| 65 to 74 Years | 313 (24.9%) | 294 (21.4%) |
| 75 Years and over | 221 (28.6%) | 598 (45.9%) |
Disability Class: Self-Care Difficulty
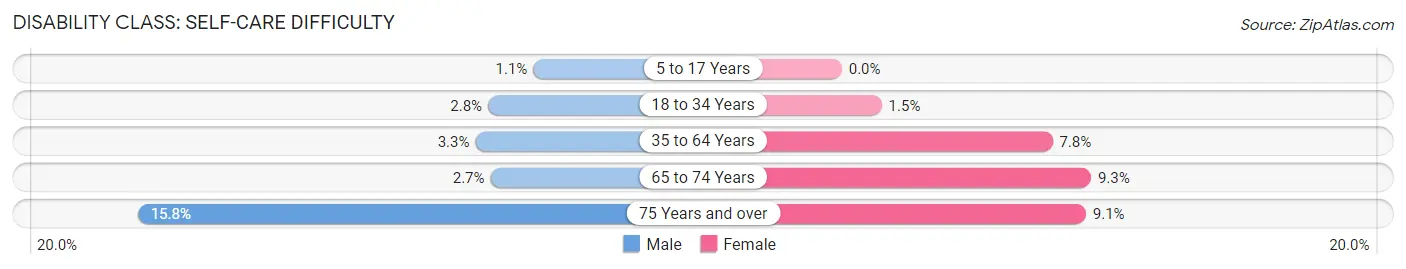
| Age Bracket | Male | Female |
| 5 to 17 Years | 40 (1.1%) | 0 (0.0%) |
| 18 to 34 Years | 128 (2.8%) | 72 (1.5%) |
| 35 to 64 Years | 183 (3.3%) | 471 (7.8%) |
| 65 to 74 Years | 34 (2.7%) | 127 (9.2%) |
| 75 Years and over | 122 (15.8%) | 118 (9.1%) |
Technology Access in Clovis
Computing Device Access in Clovis
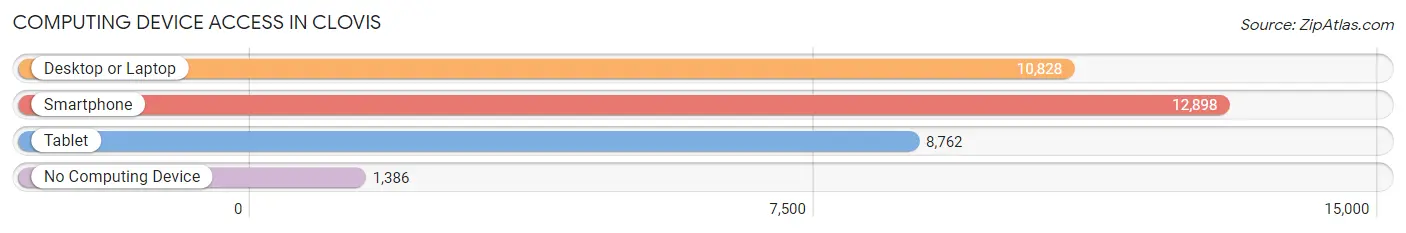
| Device Type | # Households | % Households |
| Desktop or Laptop | 10,828 | 72.0% |
| Smartphone | 12,898 | 85.8% |
| Tablet | 8,762 | 58.3% |
| No Computing Device | 1,386 | 9.2% |
| Total | 15,031 | 100.0% |
Internet Access in Clovis
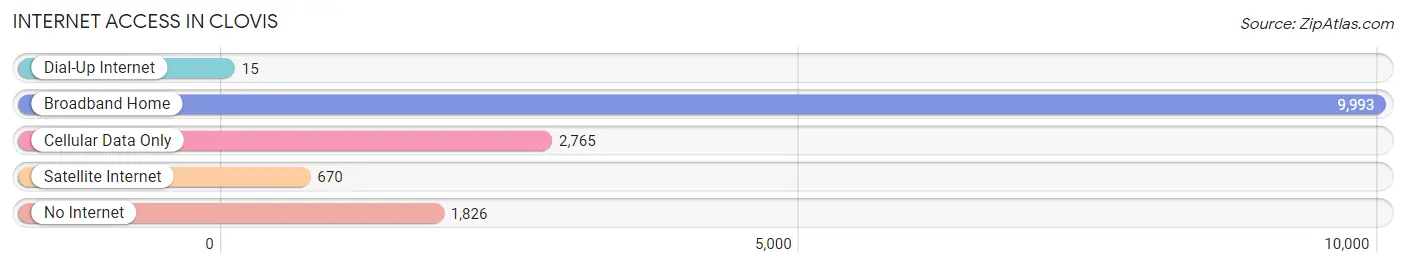
| Internet Type | # Households | % Households |
| Dial-Up Internet | 15 | 0.1% |
| Broadband Home | 9,993 | 66.5% |
| Cellular Data Only | 2,765 | 18.4% |
| Satellite Internet | 670 | 4.5% |
| No Internet | 1,826 | 12.1% |
| Total | 15,031 | 100.0% |
Clovis Summary
Clovis is a city located in Curry County, New Mexico, United States. It is the county seat of Curry County and is located in the eastern part of the state. The city is situated in the Llano Estacado region of the High Plains, and is the largest city in the region. As of the 2010 census, the population of Clovis was 37,775, making it the fifth-largest city in New Mexico.
History
Clovis was founded in 1906 by the Santa Fe Railway as a stop on its transcontinental route. The city was named after Clovis Cole, a local rancher who owned the land on which the city was built. The city quickly grew and by 1910, it had a population of 1,879.
In the early 20th century, Clovis was a major center for the cattle industry. The city was also home to a large number of sheep and goat ranches. In the 1920s, the city was the site of a major oil boom, which led to the construction of several oil refineries.
In the 1940s, Clovis was the site of a major military base, Cannon Air Force Base. The base was home to the 27th Fighter Wing, which was responsible for training pilots for World War II. The base was closed in the late 1990s, but the city still retains a strong military presence.
Geography
Clovis is located in the eastern part of New Mexico, in the Llano Estacado region of the High Plains. The city is situated at an elevation of 4,279 feet (1,305 m) above sea level. The city is located at the intersection of U.S. Route 60 and U.S. Route 84.
The city is located in a semi-arid climate, with hot summers and cold winters. The average annual temperature is 64 °F (18 °C). The average annual precipitation is 16.5 inches (419 mm).
Economy
Clovis is the economic center of the region, and is home to a variety of businesses and industries. The city is home to several large employers, including the Clovis Municipal Schools, the Clovis Community College, and the Clovis News Journal.
The city is also home to several manufacturing companies, including the Clovis Manufacturing Company, which produces a variety of products, including furniture, clothing, and automotive parts.
The city is also home to several retail stores including Walmart Kmart and Target
Demographics
As of the 2010 census, the population of Clovis was 37,775. The racial makeup of the city was 73.3% White, 1.3% African American, 1.2% Native American, 0.7% Asian, 0.1% Pacific Islander, 20.2% from other races, and 3.4% from two or more races. Hispanic or Latino of any race were 43.3% of the population.
The median income for a household in the city was $35,945, and the median income for a family was $41,945. The per capita income for the city was $17,845. About 17.2% of families and 21.2% of the population were below the poverty line, including 28.2% of those under age 18 and 11.2% of those age 65 or over.
Common Questions
What is Per Capita Income in Clovis?
Per Capita income in Clovis is $27,905.
What is the Median Family Income in Clovis?
Median Family Income in Clovis is $63,371.
What is the Median Household income in Clovis?
Median Household Income in Clovis is $52,983.
What is Income or Wage Gap in Clovis?
Income or Wage Gap in Clovis is 42.5%.
Women in Clovis earn 57.5 cents for every dollar earned by a man.
What is Family Income Deficit in Clovis?
Family Income Deficit in Clovis is $12,050.
Families that are below poverty line in Clovis earn $12,050 less on average than the poverty threshold level.
What is Inequality or Gini Index in Clovis?
Inequality or Gini Index in Clovis is 0.46.
What is the Total Population of Clovis?
Total Population of Clovis is 38,453.
What is the Total Male Population of Clovis?
Total Male Population of Clovis is 19,608.
What is the Total Female Population of Clovis?
Total Female Population of Clovis is 18,845.
What is the Ratio of Males per 100 Females in Clovis?
There are 104.05 Males per 100 Females in Clovis.
What is the Ratio of Females per 100 Males in Clovis?
There are 96.11 Females per 100 Males in Clovis.
What is the Median Population Age in Clovis?
Median Population Age in Clovis is 31.7 Years.
What is the Average Family Size in Clovis
Average Family Size in Clovis is 3.2 People.
What is the Average Household Size in Clovis
Average Household Size in Clovis is 2.5 People.
How Large is the Labor Force in Clovis?
There are 18,439 People in the Labor Forcein in Clovis.
What is the Percentage of People in the Labor Force in Clovis?
62.7% of People are in the Labor Force in Clovis.
What is the Unemployment Rate in Clovis?
Unemployment Rate in Clovis is 8.4%.