Gallup, NM Map & Demographics
Gallup Map
Gallup Overview
$25,241
PER CAPITA INCOME
$63,577
AVG FAMILY INCOME
$58,358
AVG HOUSEHOLD INCOME
11.9%
WAGE / INCOME GAP [ % ]
88.1¢/ $1
WAGE / INCOME GAP [ $ ]
$15,720
FAMILY INCOME DEFICIT
0.47
INEQUALITY / GINI INDEX
21,672
TOTAL POPULATION
10,696
MALE POPULATION
10,976
FEMALE POPULATION
97.45
MALES / 100 FEMALES
102.62
FEMALES / 100 MALES
34.1
MEDIAN AGE
3.7
AVG FAMILY SIZE
3.0
AVG HOUSEHOLD SIZE
8,750
LABOR FORCE [ PEOPLE ]
54.7%
PERCENT IN LABOR FORCE
3.9%
UNEMPLOYMENT RATE
Gallup Area Codes
Income in Gallup
Income Overview in Gallup
Per Capita Income in Gallup is $25,241, while median incomes of families and households are $63,577 and $58,358 respectively.
| Characteristic | Number | Measure |
| Per Capita Income | 21,672 | $25,241 |
| Median Family Income | 4,794 | $63,577 |
| Mean Family Income | 4,794 | $77,006 |
| Median Household Income | 7,086 | $58,358 |
| Mean Household Income | 7,086 | $73,423 |
| Income Deficit | 4,794 | $15,720 |
| Wage / Income Gap (%) | 21,672 | 11.93% |
| Wage / Income Gap ($) | 21,672 | 88.07¢ per $1 |
| Gini / Inequality Index | 21,672 | 0.47 |
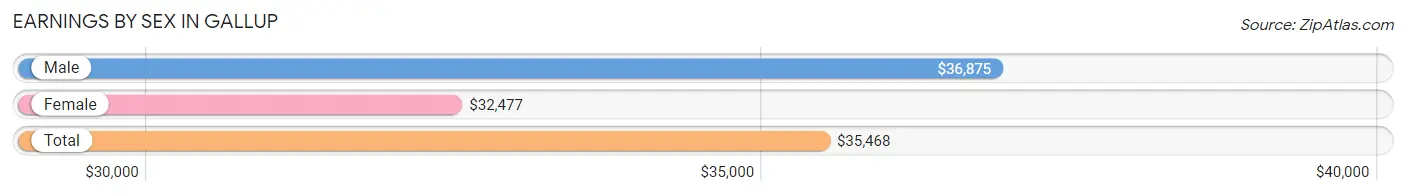
Earnings by Sex in Gallup
Average Earnings in Gallup are $35,468, $36,875 for men and $32,477 for women, a difference of 11.9%.
| Sex | Number | Average Earnings |
| Male | 4,439 (48.4%) | $36,875 |
| Female | 4,723 (51.5%) | $32,477 |
| Total | 9,162 (100.0%) | $35,468 |
Earnings by Sex by Income Bracket in Gallup
The most common earnings brackets in Gallup are $55,000 to $64,999 for men (645 | 14.5%) and $55,000 to $64,999 for women (539 | 11.4%).
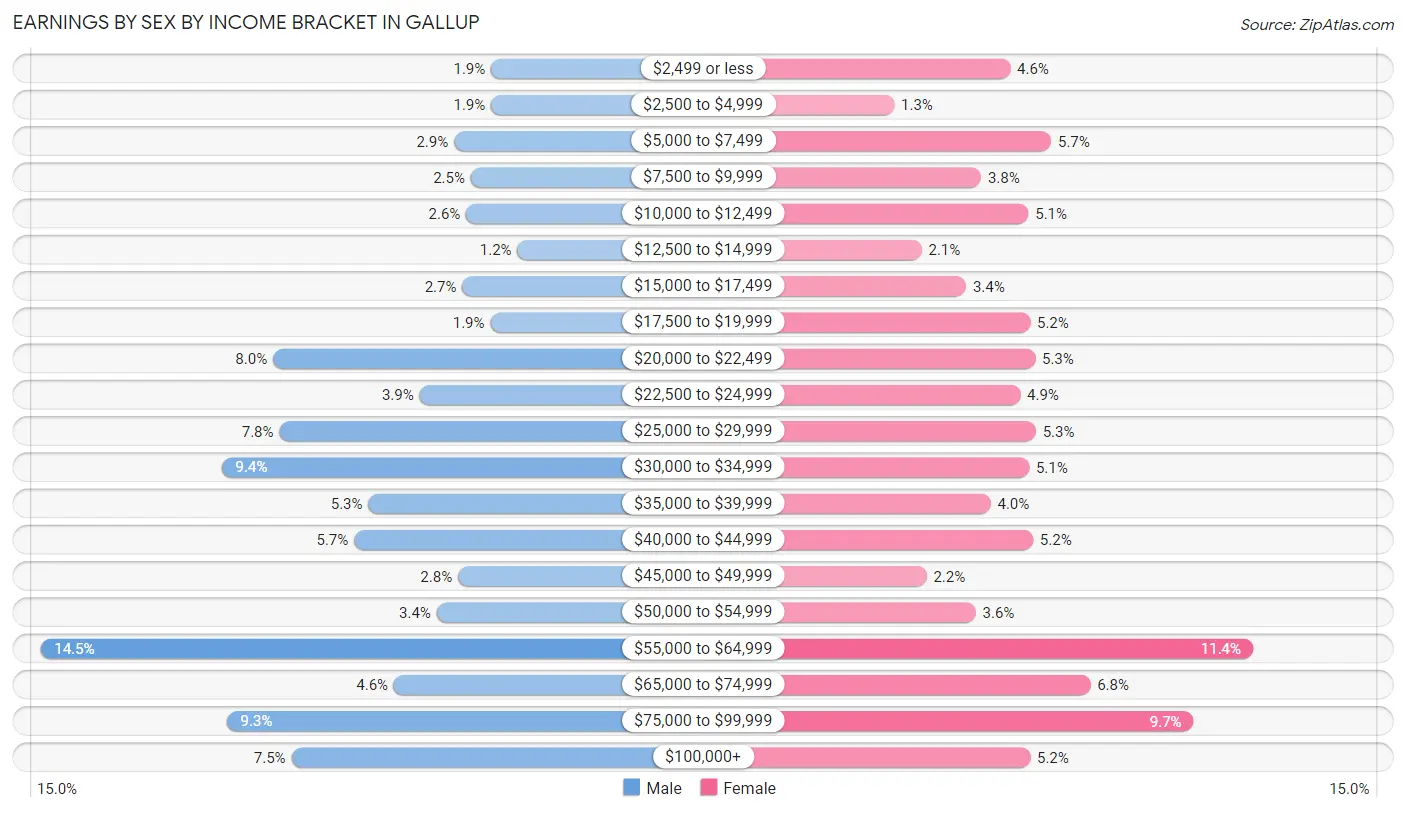
| Income | Male | Female |
| $2,499 or less | 84 (1.9%) | 217 (4.6%) |
| $2,500 to $4,999 | 84 (1.9%) | 63 (1.3%) |
| $5,000 to $7,499 | 130 (2.9%) | 271 (5.7%) |
| $7,500 to $9,999 | 109 (2.5%) | 178 (3.8%) |
| $10,000 to $12,499 | 115 (2.6%) | 241 (5.1%) |
| $12,500 to $14,999 | 51 (1.1%) | 99 (2.1%) |
| $15,000 to $17,499 | 120 (2.7%) | 158 (3.4%) |
| $17,500 to $19,999 | 85 (1.9%) | 243 (5.1%) |
| $20,000 to $22,499 | 356 (8.0%) | 250 (5.3%) |
| $22,500 to $24,999 | 173 (3.9%) | 230 (4.9%) |
| $25,000 to $29,999 | 348 (7.8%) | 251 (5.3%) |
| $30,000 to $34,999 | 419 (9.4%) | 242 (5.1%) |
| $35,000 to $39,999 | 237 (5.3%) | 191 (4.0%) |
| $40,000 to $44,999 | 255 (5.7%) | 247 (5.2%) |
| $45,000 to $49,999 | 125 (2.8%) | 106 (2.2%) |
| $50,000 to $54,999 | 152 (3.4%) | 171 (3.6%) |
| $55,000 to $64,999 | 645 (14.5%) | 539 (11.4%) |
| $65,000 to $74,999 | 205 (4.6%) | 323 (6.8%) |
| $75,000 to $99,999 | 413 (9.3%) | 460 (9.7%) |
| $100,000+ | 333 (7.5%) | 243 (5.1%) |
| Total | 4,439 (100.0%) | 4,723 (100.0%) |
Earnings by Sex by Educational Attainment in Gallup
Average earnings in Gallup are $41,645 for men and $35,397 for women, a difference of 15.0%. Men with an educational attainment of graduate degree enjoy the highest average annual earnings of $84,375, while those with high school diploma education earn the least with $30,617. Women with an educational attainment of graduate degree earn the most with the average annual earnings of $69,419, while those with high school diploma education have the smallest earnings of $20,440.
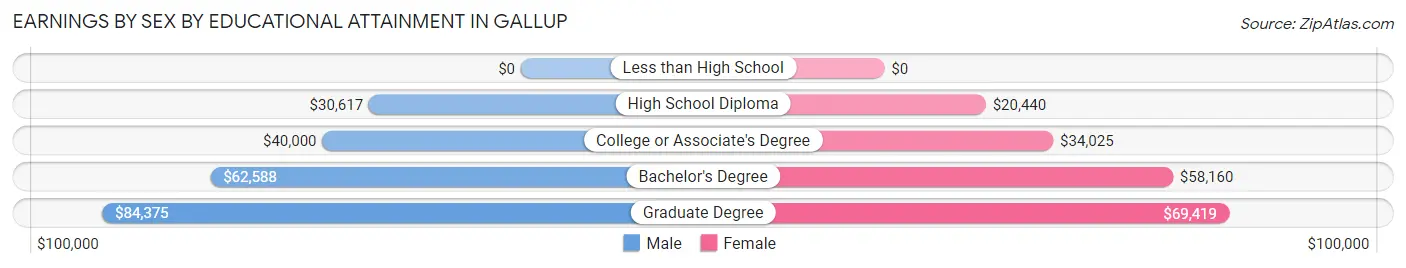
| Educational Attainment | Male Income | Female Income |
| Less than High School | - | - |
| High School Diploma | $30,617 | $20,440 |
| College or Associate's Degree | $40,000 | $34,025 |
| Bachelor's Degree | $62,588 | $58,160 |
| Graduate Degree | $84,375 | $69,419 |
| Total | $41,645 | $35,397 |
Family Income in Gallup
Family Income Brackets in Gallup
According to the Gallup family income data, there are 1,136 families falling into the $50,000 to $74,999 income range, which is the most common income bracket and makes up 23.7% of all families. Conversely, the $200,000+ income bracket is the least frequent group with only 221 families (4.6%) belonging to this category.
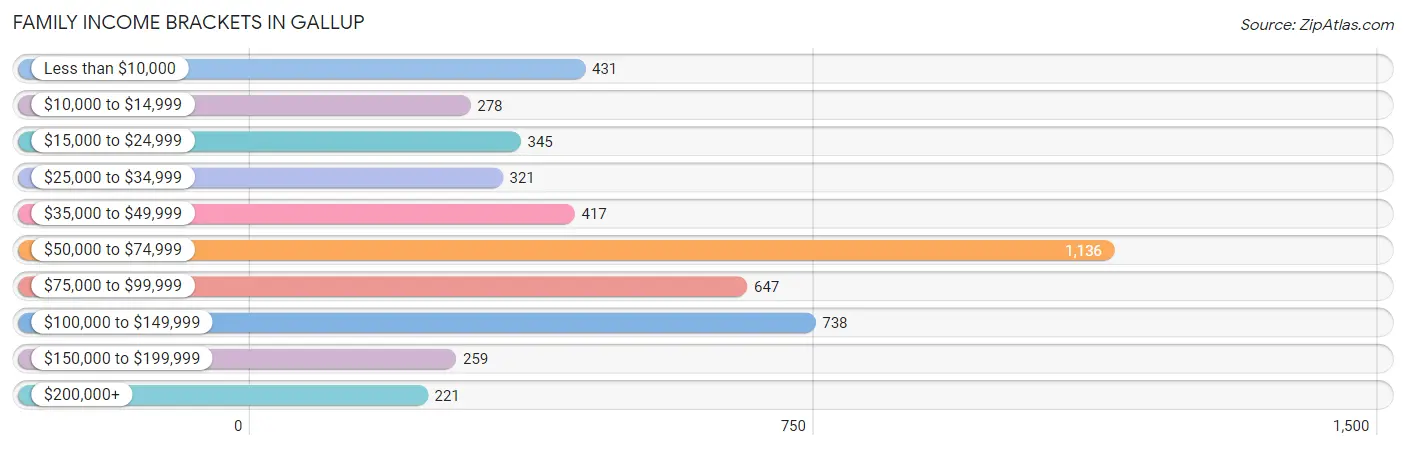
| Income Bracket | # Families | % Families |
| Less than $10,000 | 431 | 9.0% |
| $10,000 to $14,999 | 278 | 5.8% |
| $15,000 to $24,999 | 345 | 7.2% |
| $25,000 to $34,999 | 321 | 6.7% |
| $35,000 to $49,999 | 417 | 8.7% |
| $50,000 to $74,999 | 1,136 | 23.7% |
| $75,000 to $99,999 | 647 | 13.5% |
| $100,000 to $149,999 | 738 | 15.4% |
| $150,000 to $199,999 | 259 | 5.4% |
| $200,000+ | 221 | 4.6% |
Family Income by Famaliy Size in Gallup
4-person families (818 | 17.1%) account for the highest median family income in Gallup with $70,911 per family, while 2-person families (2,195 | 45.8%) have the highest median income of $27,590 per family member.
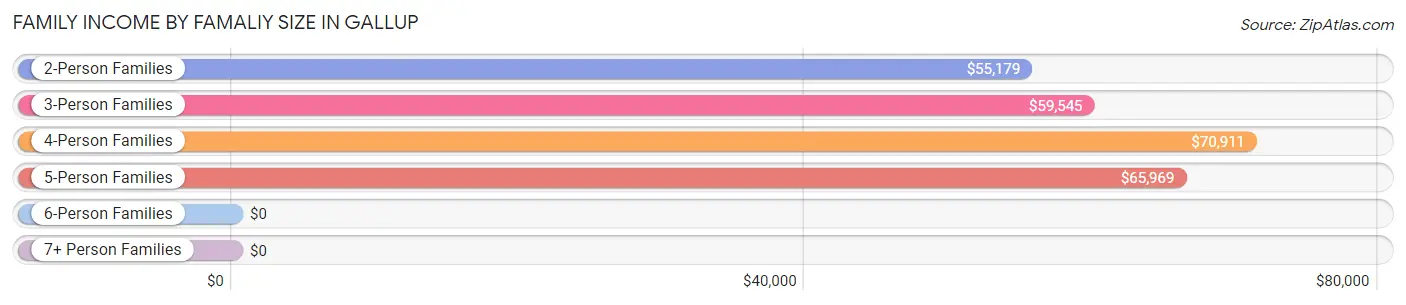
| Income Bracket | # Families | Median Income |
| 2-Person Families | 2,195 (45.8%) | $55,179 |
| 3-Person Families | 830 (17.3%) | $59,545 |
| 4-Person Families | 818 (17.1%) | $70,911 |
| 5-Person Families | 436 (9.1%) | $65,969 |
| 6-Person Families | 398 (8.3%) | $0 |
| 7+ Person Families | 117 (2.4%) | $0 |
| Total | 4,794 (100.0%) | $63,577 |
Family Income by Number of Earners in Gallup
The median family income in Gallup is $63,577, with families comprising 3+ earners (392) having the highest median family income of $146,985, while families with no earners (836) have the lowest median family income of $36,814, accounting for 8.2% and 17.4% of families, respectively.
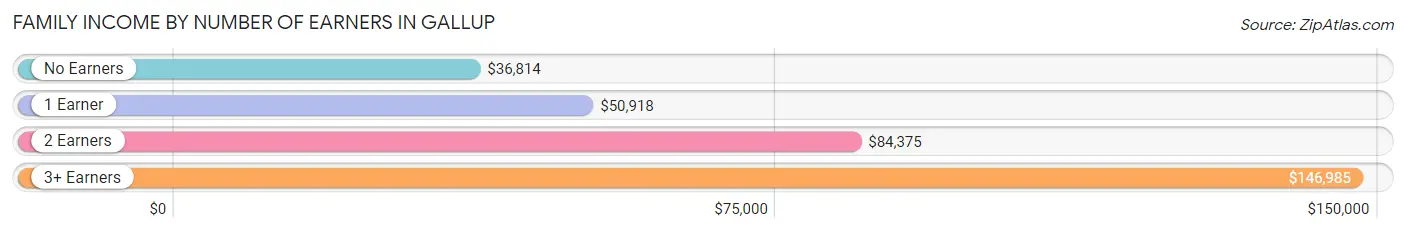
| Number of Earners | # Families | Median Income |
| No Earners | 836 (17.4%) | $36,814 |
| 1 Earner | 2,047 (42.7%) | $50,918 |
| 2 Earners | 1,519 (31.7%) | $84,375 |
| 3+ Earners | 392 (8.2%) | $146,985 |
| Total | 4,794 (100.0%) | $63,577 |
Household Income in Gallup
Household Income Brackets in Gallup
With 1,679 households falling in the category, the $50,000 to $74,999 income range is the most frequent in Gallup, accounting for 23.7% of all households. In contrast, only 312 households (4.4%) fall into the $200,000+ income bracket, making it the least populous group.
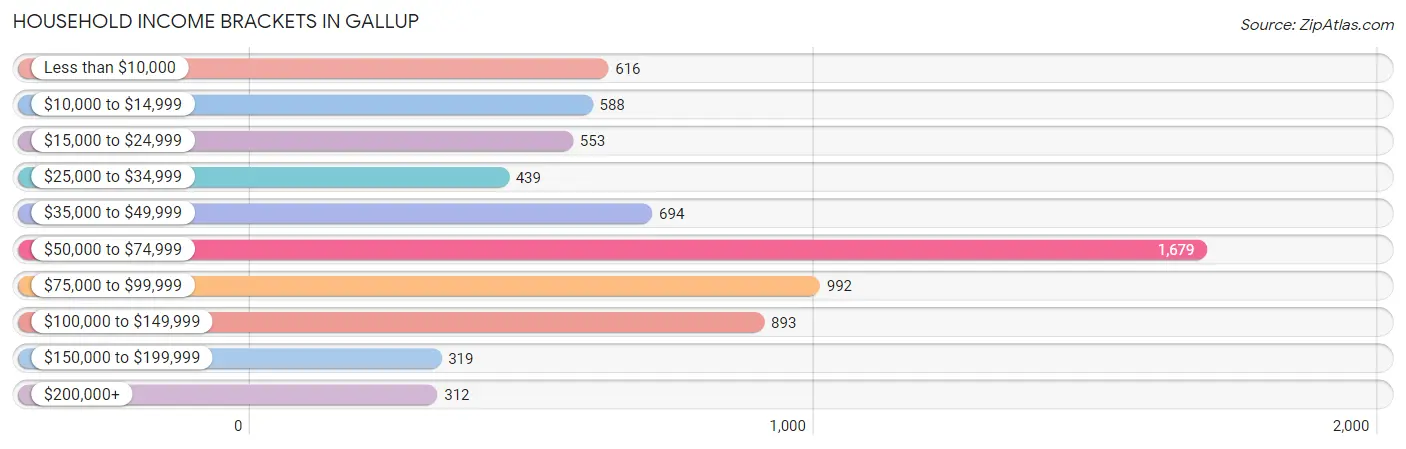
| Income Bracket | # Households | % Households |
| Less than $10,000 | 616 | 8.7% |
| $10,000 to $14,999 | 588 | 8.3% |
| $15,000 to $24,999 | 553 | 7.8% |
| $25,000 to $34,999 | 439 | 6.2% |
| $35,000 to $49,999 | 694 | 9.8% |
| $50,000 to $74,999 | 1,679 | 23.7% |
| $75,000 to $99,999 | 992 | 14.0% |
| $100,000 to $149,999 | 893 | 12.6% |
| $150,000 to $199,999 | 319 | 4.5% |
| $200,000+ | 312 | 4.4% |
Household Income by Householder Age in Gallup
The median household income in Gallup is $58,358, with the highest median household income of $63,733 found in the 45 to 64 years age bracket for the primary householder. A total of 2,096 households (29.6%) fall into this category. Meanwhile, the 15 to 24 years age bracket for the primary householder has the lowest median household income of $0, with 189 households (2.7%) in this group.
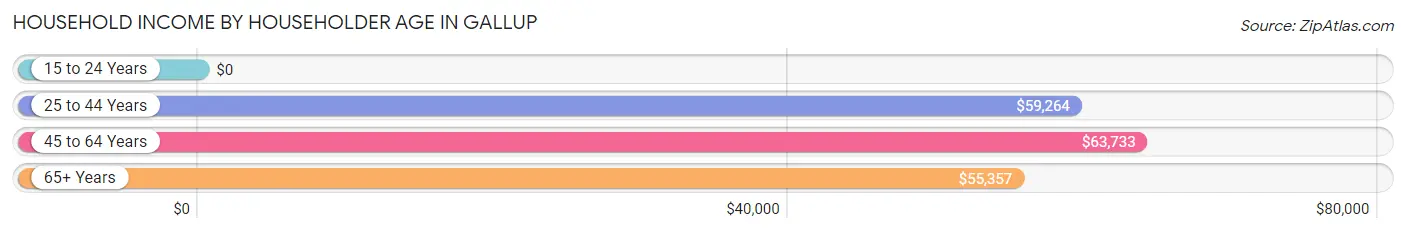
| Income Bracket | # Households | Median Income |
| 15 to 24 Years | 189 (2.7%) | $0 |
| 25 to 44 Years | 2,721 (38.4%) | $59,264 |
| 45 to 64 Years | 2,096 (29.6%) | $63,733 |
| 65+ Years | 2,080 (29.3%) | $55,357 |
| Total | 7,086 (100.0%) | $58,358 |
Poverty in Gallup
Income Below Poverty by Sex and Age in Gallup
With 21.6% poverty level for males and 28.9% for females among the residents of Gallup, 12 to 14 year old males and under 5 year old females are the most vulnerable to poverty, with 213 males (40.3%) and 297 females (47.3%) in their respective age groups living below the poverty level.
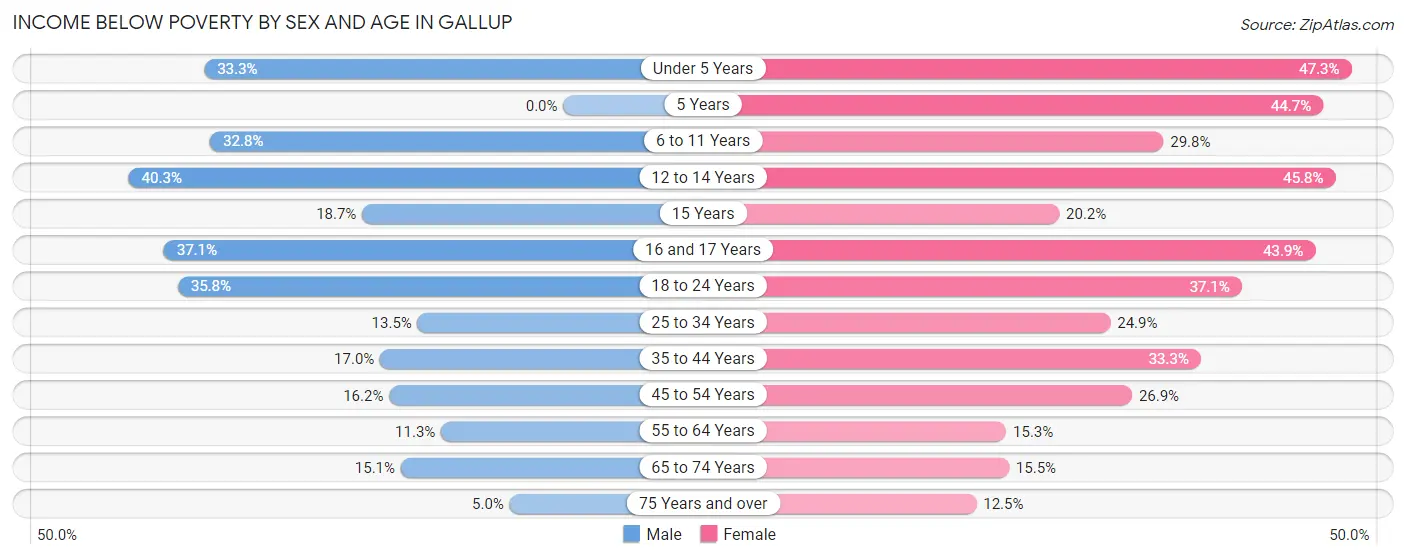
| Age Bracket | Male | Female |
| Under 5 Years | 219 (33.3%) | 297 (47.3%) |
| 5 Years | 0 (0.0%) | 163 (44.7%) |
| 6 to 11 Years | 411 (32.8%) | 279 (29.8%) |
| 12 to 14 Years | 213 (40.3%) | 300 (45.8%) |
| 15 Years | 42 (18.7%) | 24 (20.2%) |
| 16 and 17 Years | 165 (37.1%) | 188 (43.9%) |
| 18 to 24 Years | 307 (35.8%) | 288 (37.1%) |
| 25 to 34 Years | 198 (13.5%) | 369 (24.9%) |
| 35 to 44 Years | 256 (17.0%) | 500 (33.3%) |
| 45 to 54 Years | 170 (16.2%) | 296 (26.9%) |
| 55 to 64 Years | 98 (11.3%) | 179 (15.2%) |
| 65 to 74 Years | 136 (15.1%) | 167 (15.5%) |
| 75 Years and over | 24 (5.0%) | 71 (12.5%) |
| Total | 2,239 (21.6%) | 3,121 (28.9%) |
Income Above Poverty by Sex and Age in Gallup
According to the poverty statistics in Gallup, males aged 5 years and females aged 75 years and over are the age groups that are most secure financially, with 100.0% of males and 87.5% of females in these age groups living above the poverty line.
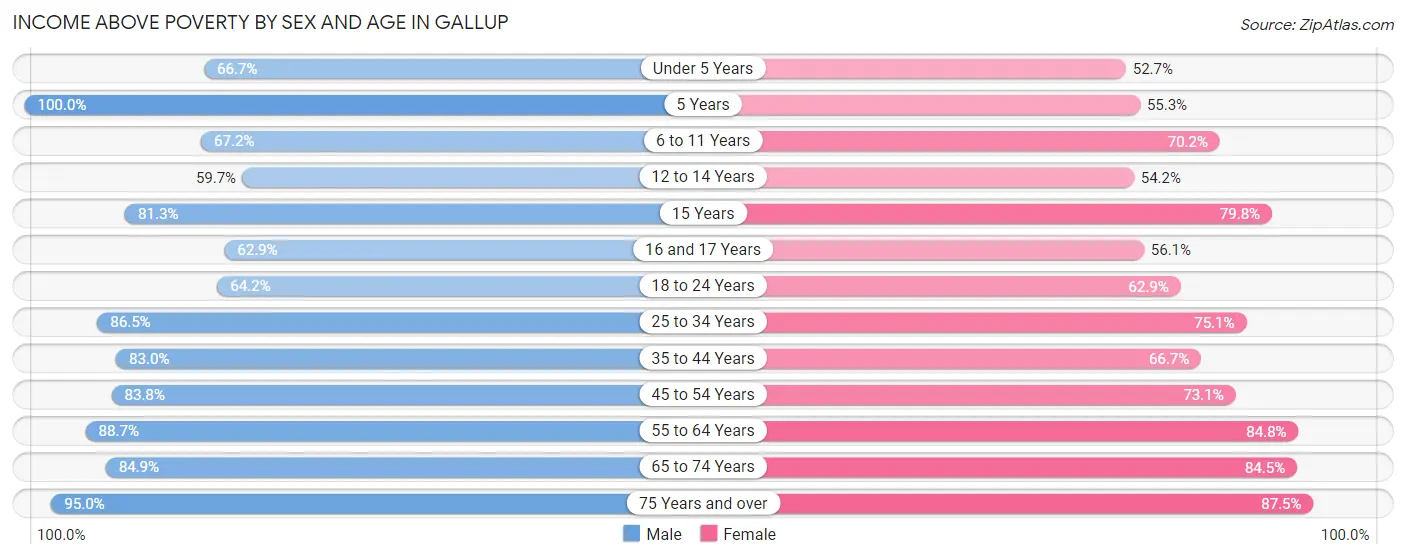
| Age Bracket | Male | Female |
| Under 5 Years | 438 (66.7%) | 331 (52.7%) |
| 5 Years | 137 (100.0%) | 202 (55.3%) |
| 6 to 11 Years | 843 (67.2%) | 656 (70.2%) |
| 12 to 14 Years | 315 (59.7%) | 355 (54.2%) |
| 15 Years | 183 (81.3%) | 95 (79.8%) |
| 16 and 17 Years | 280 (62.9%) | 240 (56.1%) |
| 18 to 24 Years | 551 (64.2%) | 488 (62.9%) |
| 25 to 34 Years | 1,266 (86.5%) | 1,112 (75.1%) |
| 35 to 44 Years | 1,250 (83.0%) | 1,001 (66.7%) |
| 45 to 54 Years | 882 (83.8%) | 803 (73.1%) |
| 55 to 64 Years | 766 (88.7%) | 995 (84.8%) |
| 65 to 74 Years | 766 (84.9%) | 910 (84.5%) |
| 75 Years and over | 458 (95.0%) | 498 (87.5%) |
| Total | 8,135 (78.4%) | 7,686 (71.1%) |
Income Below Poverty Among Married-Couple Families in Gallup
The poverty statistics for married-couple families in Gallup show that 5.9% or 146 of the total 2,492 families live below the poverty line. Families with 5 or more children have the highest poverty rate of 91.9%, comprising of 34 families. On the other hand, families with no children have the lowest poverty rate of 1.1%, which includes 16 families.
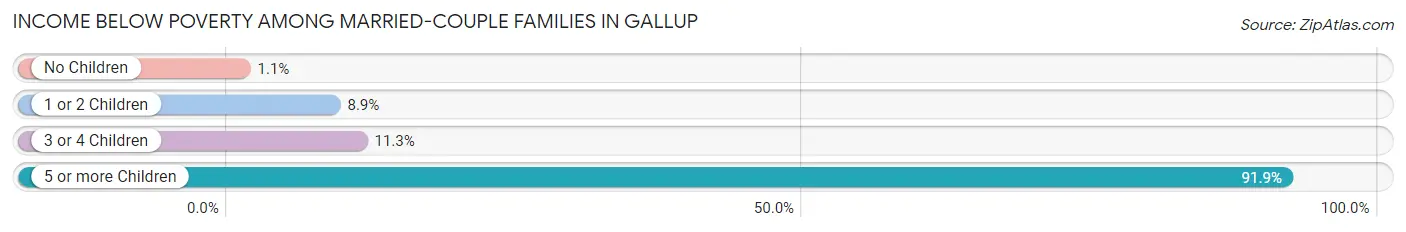
| Children | Above Poverty | Below Poverty |
| No Children | 1,456 (98.9%) | 16 (1.1%) |
| 1 or 2 Children | 572 (91.1%) | 56 (8.9%) |
| 3 or 4 Children | 315 (88.7%) | 40 (11.3%) |
| 5 or more Children | 3 (8.1%) | 34 (91.9%) |
| Total | 2,346 (94.1%) | 146 (5.9%) |
Income Below Poverty Among Single-Parent Households in Gallup
According to the poverty data in Gallup, 34.1% or 211 single-father households and 37.7% or 635 single-mother households are living below the poverty line. Among single-father households, those with 1 or 2 children have the highest poverty rate, with 172 households (53.1%) experiencing poverty. Likewise, among single-mother households, those with 5 or more children have the highest poverty rate, with 180 households (100.0%) falling below the poverty line.
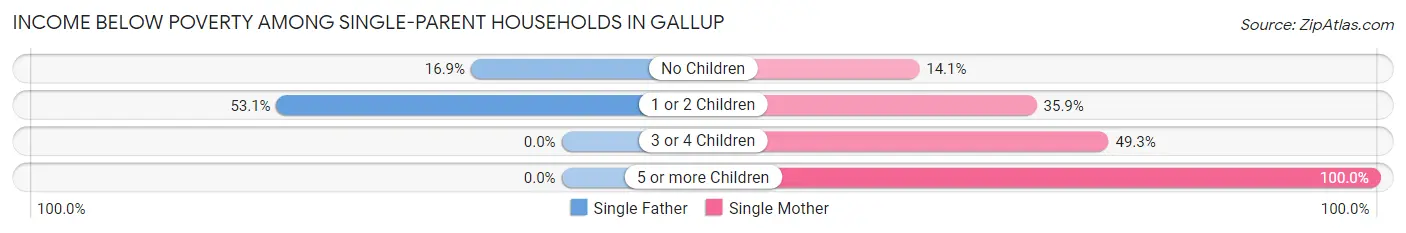
| Children | Single Father | Single Mother |
| No Children | 39 (16.9%) | 68 (14.1%) |
| 1 or 2 Children | 172 (53.1%) | 312 (35.9%) |
| 3 or 4 Children | 0 (0.0%) | 75 (49.3%) |
| 5 or more Children | 0 (0.0%) | 180 (100.0%) |
| Total | 211 (34.1%) | 635 (37.7%) |
Income Below Poverty Among Married-Couple vs Single-Parent Households in Gallup
The poverty data for Gallup shows that 146 of the married-couple family households (5.9%) and 846 of the single-parent households (36.7%) are living below the poverty level. Within the married-couple family households, those with 5 or more children have the highest poverty rate, with 34 households (91.9%) falling below the poverty line. Among the single-parent households, those with 5 or more children have the highest poverty rate, with 180 household (100.0%) living below poverty.
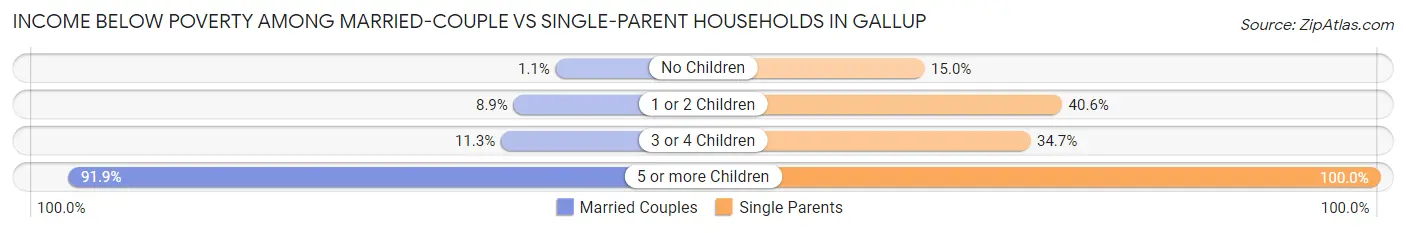
| Children | Married-Couple Families | Single-Parent Households |
| No Children | 16 (1.1%) | 107 (15.0%) |
| 1 or 2 Children | 56 (8.9%) | 484 (40.6%) |
| 3 or 4 Children | 40 (11.3%) | 75 (34.7%) |
| 5 or more Children | 34 (91.9%) | 180 (100.0%) |
| Total | 146 (5.9%) | 846 (36.7%) |
Race in Gallup
The most populous races in Gallup are Native / Alaskan (10,654 | 49.2%), Hispanic or Latino (6,808 | 31.4%), and White / Caucasian (5,258 | 24.3%).
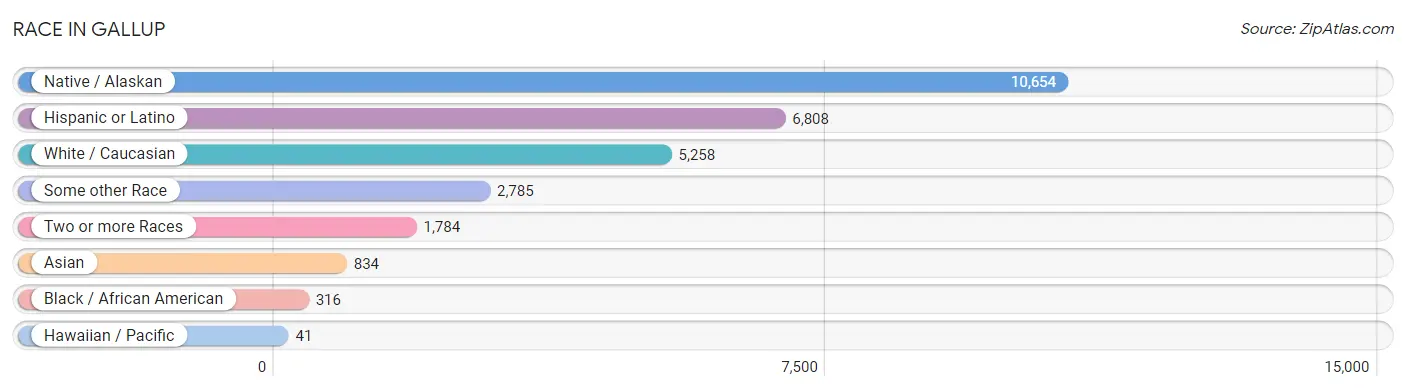
| Race | # Population | % Population |
| Asian | 834 | 3.8% |
| Black / African American | 316 | 1.5% |
| Hawaiian / Pacific | 41 | 0.2% |
| Hispanic or Latino | 6,808 | 31.4% |
| Native / Alaskan | 10,654 | 49.2% |
| White / Caucasian | 5,258 | 24.3% |
| Two or more Races | 1,784 | 8.2% |
| Some other Race | 2,785 | 12.9% |
| Total | 21,672 | 100.0% |
Ancestry in Gallup
The most populous ancestries reported in Gallup are Navajo (10,046 | 46.4%), Mexican (5,121 | 23.6%), Pueblo (934 | 4.3%), English (826 | 3.8%), and Irish (790 | 3.6%), together accounting for 81.8% of all Gallup residents.
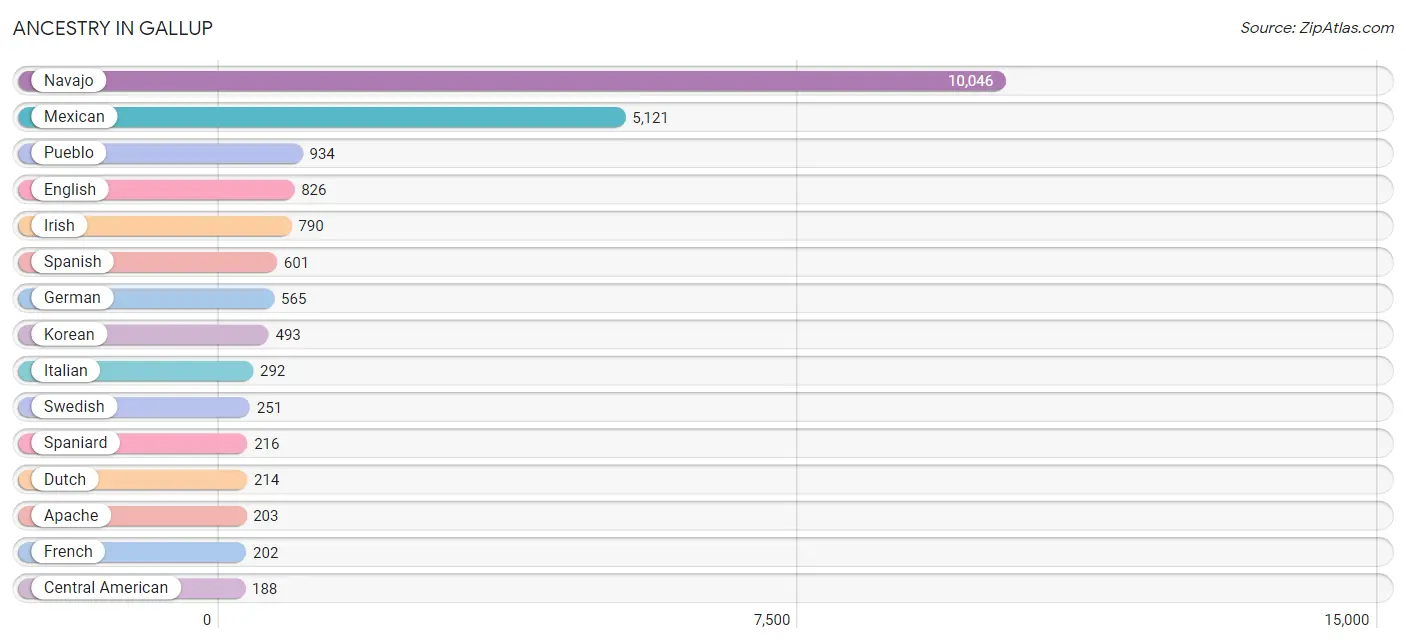
| Ancestry | # Population | % Population |
| African | 74 | 0.3% |
| American | 143 | 0.7% |
| Apache | 203 | 0.9% |
| Arab | 168 | 0.8% |
| Argentinean | 31 | 0.1% |
| Bhutanese | 49 | 0.2% |
| Brazilian | 26 | 0.1% |
| Burmese | 81 | 0.4% |
| Celtic | 18 | 0.1% |
| Central American | 188 | 0.9% |
| Cherokee | 63 | 0.3% |
| Chippewa | 12 | 0.1% |
| Choctaw | 67 | 0.3% |
| Creek | 5 | 0.0% |
| Croatian | 37 | 0.2% |
| Danish | 9 | 0.0% |
| Dutch | 214 | 1.0% |
| Egyptian | 50 | 0.2% |
| English | 826 | 3.8% |
| European | 134 | 0.6% |
| Finnish | 4 | 0.0% |
| French | 202 | 0.9% |
| German | 565 | 2.6% |
| Greek | 15 | 0.1% |
| Hopi | 34 | 0.2% |
| Hungarian | 123 | 0.6% |
| Irish | 790 | 3.6% |
| Italian | 292 | 1.3% |
| Jamaican | 82 | 0.4% |
| Korean | 493 | 2.3% |
| Lebanese | 7 | 0.0% |
| Lithuanian | 19 | 0.1% |
| Mexican | 5,121 | 23.6% |
| Mexican American Indian | 26 | 0.1% |
| Native Hawaiian | 25 | 0.1% |
| Navajo | 10,046 | 46.4% |
| Nicaraguan | 188 | 0.9% |
| Nigerian | 21 | 0.1% |
| Northern European | 25 | 0.1% |
| Norwegian | 90 | 0.4% |
| Palestinian | 73 | 0.3% |
| Polish | 48 | 0.2% |
| Portuguese | 40 | 0.2% |
| Pueblo | 934 | 4.3% |
| Puerto Rican | 15 | 0.1% |
| Romanian | 15 | 0.1% |
| Russian | 20 | 0.1% |
| Samoan | 16 | 0.1% |
| Scandinavian | 3 | 0.0% |
| Scotch-Irish | 48 | 0.2% |
| Scottish | 48 | 0.2% |
| Sioux | 45 | 0.2% |
| Slavic | 41 | 0.2% |
| Slovak | 5 | 0.0% |
| South American | 31 | 0.1% |
| Spaniard | 216 | 1.0% |
| Spanish | 601 | 2.8% |
| Spanish American | 4 | 0.0% |
| Sri Lankan | 13 | 0.1% |
| Subsaharan African | 104 | 0.5% |
| Swedish | 251 | 1.2% |
| Swiss | 54 | 0.3% |
| Thai | 63 | 0.3% |
| Ukrainian | 19 | 0.1% |
| Ute | 42 | 0.2% |
| Welsh | 4 | 0.0% |
| Yaqui | 13 | 0.1% | View All 67 Rows |
Immigrants in Gallup
The most numerous immigrant groups reported in Gallup came from Latin America (785 | 3.6%), Central America (693 | 3.2%), Mexico (693 | 3.2%), Asia (604 | 2.8%), and Philippines (389 | 1.8%), together accounting for 14.6% of all Gallup residents.
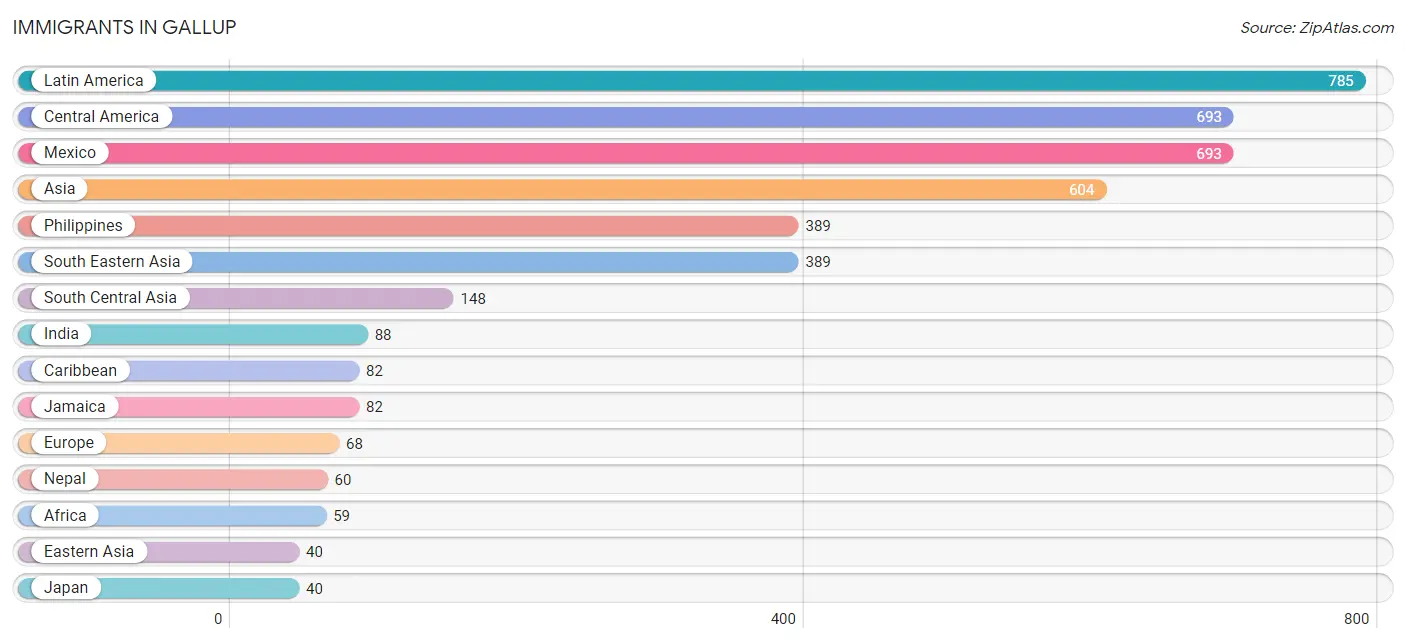
| Immigration Origin | # Population | % Population |
| Africa | 59 | 0.3% |
| Asia | 604 | 2.8% |
| Belarus | 7 | 0.0% |
| Brazil | 10 | 0.1% |
| Canada | 13 | 0.1% |
| Caribbean | 82 | 0.4% |
| Central America | 693 | 3.2% |
| Eastern Asia | 40 | 0.2% |
| Eastern Europe | 26 | 0.1% |
| Europe | 68 | 0.3% |
| Germany | 30 | 0.1% |
| India | 88 | 0.4% |
| Italy | 9 | 0.0% |
| Jamaica | 82 | 0.4% |
| Japan | 40 | 0.2% |
| Latin America | 785 | 3.6% |
| Mexico | 693 | 3.2% |
| Morocco | 4 | 0.0% |
| Nepal | 60 | 0.3% |
| Nigeria | 21 | 0.1% |
| Northern Africa | 4 | 0.0% |
| Northern Europe | 3 | 0.0% |
| Philippines | 389 | 1.8% |
| Romania | 15 | 0.1% |
| Russia | 4 | 0.0% |
| South America | 10 | 0.1% |
| South Central Asia | 148 | 0.7% |
| South Eastern Asia | 389 | 1.8% |
| Southern Europe | 9 | 0.0% |
| Western Africa | 21 | 0.1% |
| Western Europe | 30 | 0.1% | View All 31 Rows |
Sex and Age in Gallup
Sex and Age in Gallup
The most populous age groups in Gallup are 10 to 14 Years (1,066 | 10.0%) for men and 10 to 14 Years (1,069 | 9.7%) for women.
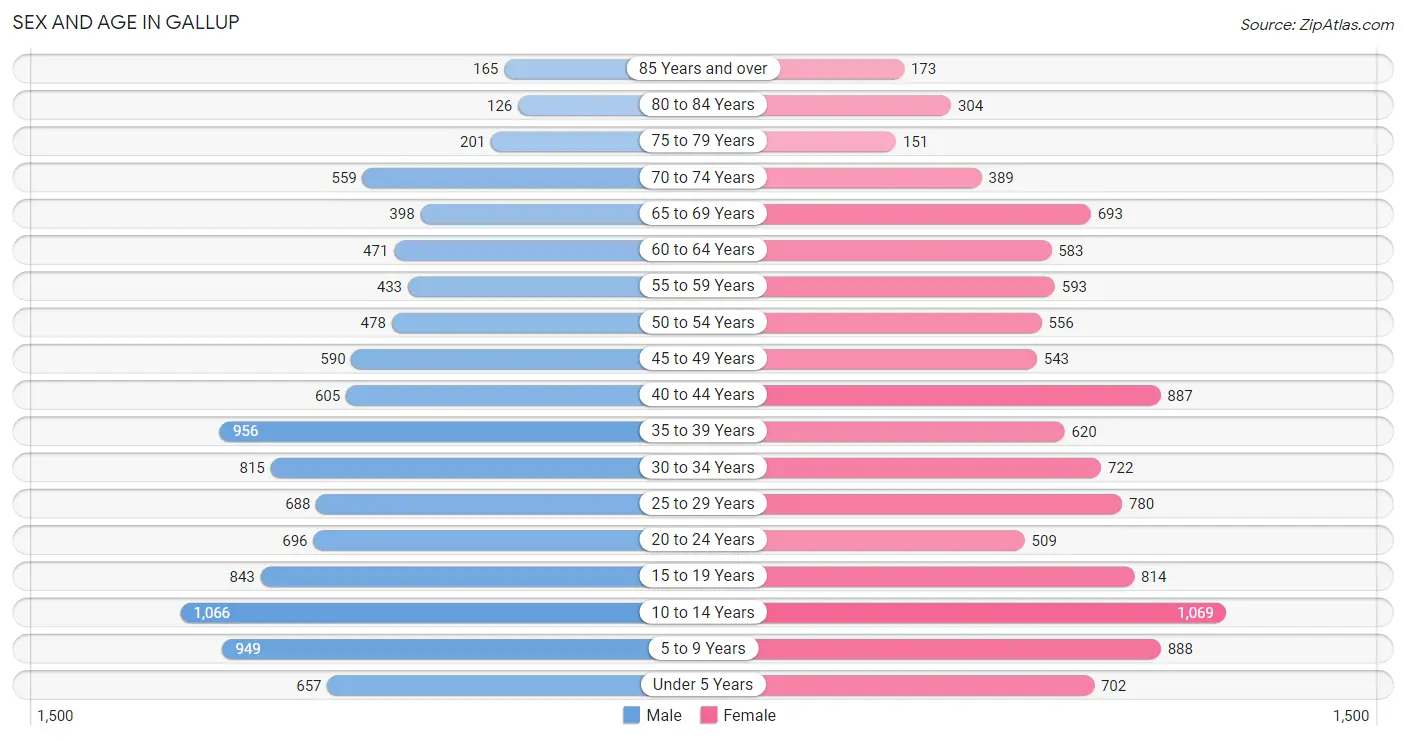
| Age Bracket | Male | Female |
| Under 5 Years | 657 (6.1%) | 702 (6.4%) |
| 5 to 9 Years | 949 (8.9%) | 888 (8.1%) |
| 10 to 14 Years | 1,066 (10.0%) | 1,069 (9.7%) |
| 15 to 19 Years | 843 (7.9%) | 814 (7.4%) |
| 20 to 24 Years | 696 (6.5%) | 509 (4.6%) |
| 25 to 29 Years | 688 (6.4%) | 780 (7.1%) |
| 30 to 34 Years | 815 (7.6%) | 722 (6.6%) |
| 35 to 39 Years | 956 (8.9%) | 620 (5.7%) |
| 40 to 44 Years | 605 (5.7%) | 887 (8.1%) |
| 45 to 49 Years | 590 (5.5%) | 543 (5.0%) |
| 50 to 54 Years | 478 (4.5%) | 556 (5.1%) |
| 55 to 59 Years | 433 (4.1%) | 593 (5.4%) |
| 60 to 64 Years | 471 (4.4%) | 583 (5.3%) |
| 65 to 69 Years | 398 (3.7%) | 693 (6.3%) |
| 70 to 74 Years | 559 (5.2%) | 389 (3.5%) |
| 75 to 79 Years | 201 (1.9%) | 151 (1.4%) |
| 80 to 84 Years | 126 (1.2%) | 304 (2.8%) |
| 85 Years and over | 165 (1.5%) | 173 (1.6%) |
| Total | 10,696 (100.0%) | 10,976 (100.0%) |
Families and Households in Gallup
Median Family Size in Gallup
The median family size in Gallup is 3.66 persons per family, with single female/mother families (1,683 | 35.1%) accounting for the largest median family size of 3.92 persons per family. On the other hand, single male/father families (619 | 12.9%) represent the smallest median family size with 3.04 persons per family.
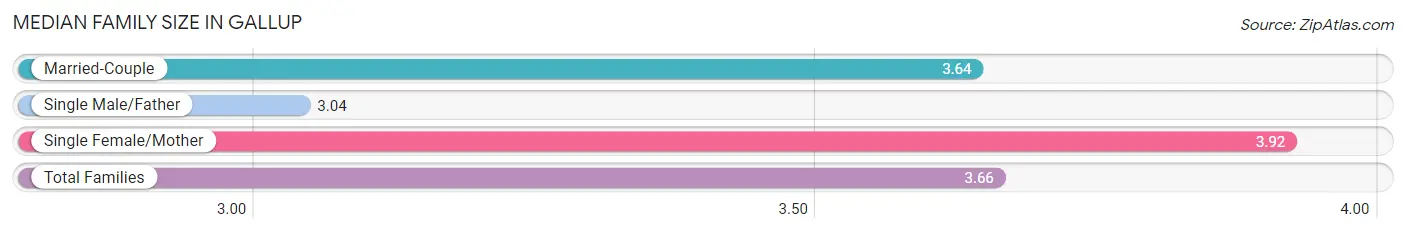
| Family Type | # Families | Family Size |
| Married-Couple | 2,492 (52.0%) | 3.64 |
| Single Male/Father | 619 (12.9%) | 3.04 |
| Single Female/Mother | 1,683 (35.1%) | 3.92 |
| Total Families | 4,794 (100.0%) | 3.66 |
Median Household Size in Gallup
The median household size in Gallup is 2.97 persons per household, with single female/mother households (1,683 | 23.7%) accounting for the largest median household size of 4.09 persons per household. non-family households (2,292 | 32.4%) represent the smallest median household size with 1.26 persons per household.
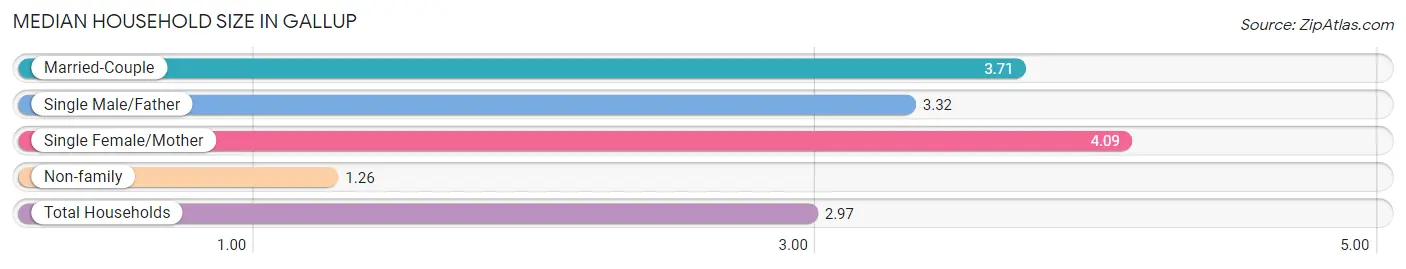
| Household Type | # Households | Household Size |
| Married-Couple | 2,492 (35.2%) | 3.71 |
| Single Male/Father | 619 (8.7%) | 3.32 |
| Single Female/Mother | 1,683 (23.7%) | 4.09 |
| Non-family | 2,292 (32.4%) | 1.26 |
| Total Households | 7,086 (100.0%) | 2.97 |
Household Size by Marriage Status in Gallup
Out of a total of 7,086 households in Gallup, 4,794 (67.6%) are family households, while 2,292 (32.4%) are nonfamily households. The most numerous type of family households are 2-person households, comprising 2,029, and the most common type of nonfamily households are 1-person households, comprising 1,823.
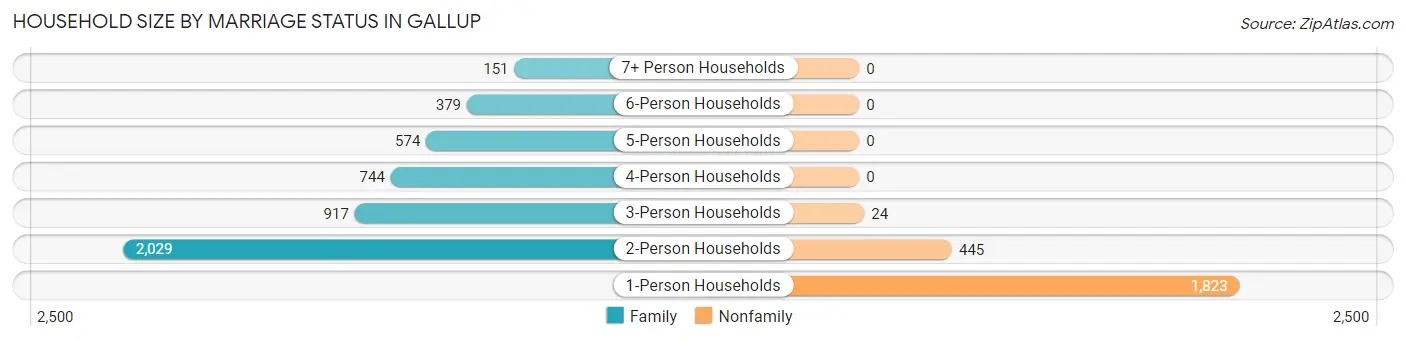
| Household Size | Family Households | Nonfamily Households |
| 1-Person Households | - | 1,823 (25.7%) |
| 2-Person Households | 2,029 (28.6%) | 445 (6.3%) |
| 3-Person Households | 917 (12.9%) | 24 (0.3%) |
| 4-Person Households | 744 (10.5%) | 0 (0.0%) |
| 5-Person Households | 574 (8.1%) | 0 (0.0%) |
| 6-Person Households | 379 (5.3%) | 0 (0.0%) |
| 7+ Person Households | 151 (2.1%) | 0 (0.0%) |
| Total | 4,794 (67.6%) | 2,292 (32.4%) |
Female Fertility in Gallup
Fertility by Age in Gallup
Average fertility rate in Gallup is 64.0 births per 1,000 women. Women in the age bracket of 15 to 19 years have the highest fertility rate with 144.0 births per 1,000 women. Women in the age bracket of 20 to 34 years acount for 59.3% of all women with births.
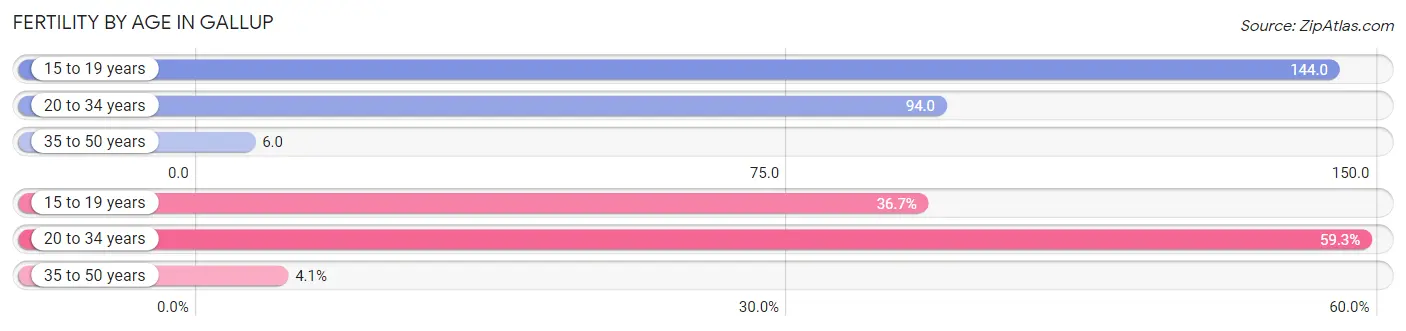
| Age Bracket | Women with Births | Births / 1,000 Women |
| 15 to 19 years | 117 (36.7%) | 144.0 |
| 20 to 34 years | 189 (59.3%) | 94.0 |
| 35 to 50 years | 13 (4.1%) | 6.0 |
| Total | 319 (100.0%) | 64.0 |
Fertility by Age by Marriage Status in Gallup
25.7% of women with births (319) in Gallup are married. The highest percentage of unmarried women with births falls into 15 to 19 years age bracket with 100.0% of them unmarried at the time of birth, while the lowest percentage of unmarried women with births belong to 35 to 50 years age bracket with 0.0% of them unmarried.
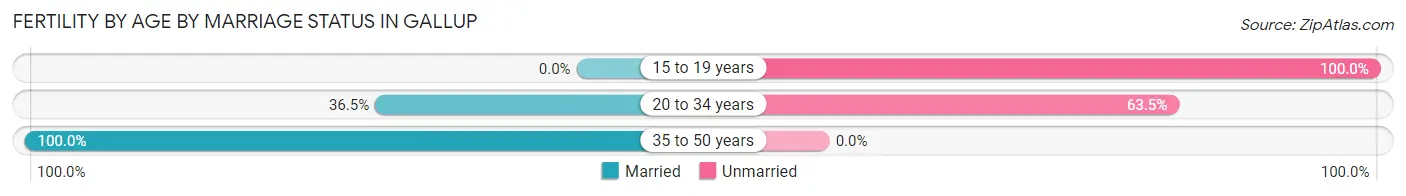
| Age Bracket | Married | Unmarried |
| 15 to 19 years | 0 (0.0%) | 117 (100.0%) |
| 20 to 34 years | 69 (36.5%) | 120 (63.5%) |
| 35 to 50 years | 13 (100.0%) | 0 (0.0%) |
| Total | 82 (25.7%) | 237 (74.3%) |
Fertility by Education in Gallup
Average fertility rate in Gallup is 64.0 births per 1,000 women. Women with the education attainment of less than high school have the highest fertility rate of 137.0 births per 1,000 women, while women with the education attainment of graduate degree have the lowest fertility at 9.0 births per 1,000 women. Women with the education attainment of less than high school represent 36.7% of all women with births.
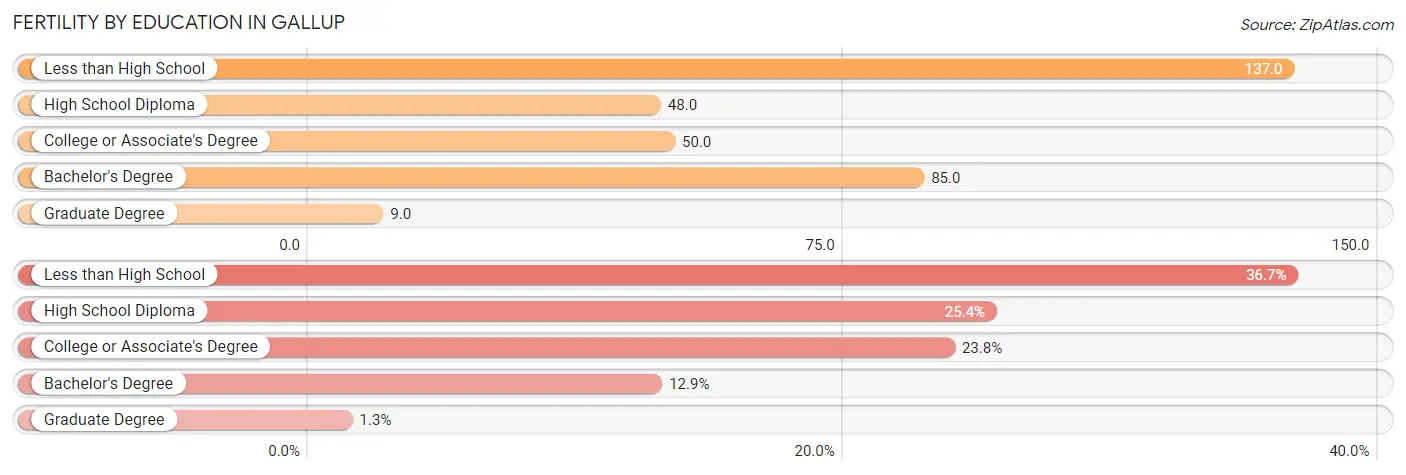
| Educational Attainment | Women with Births | Births / 1,000 Women |
| Less than High School | 117 (36.7%) | 137.0 |
| High School Diploma | 81 (25.4%) | 48.0 |
| College or Associate's Degree | 76 (23.8%) | 50.0 |
| Bachelor's Degree | 41 (12.9%) | 85.0 |
| Graduate Degree | 4 (1.3%) | 9.0 |
| Total | 319 (100.0%) | 64.0 |
Fertility by Education by Marriage Status in Gallup
74.3% of women with births in Gallup are unmarried. Women with the educational attainment of bachelor's degree are most likely to be married with 100.0% of them married at childbirth, while women with the educational attainment of less than high school are least likely to be married with 100.0% of them unmarried at childbirth.
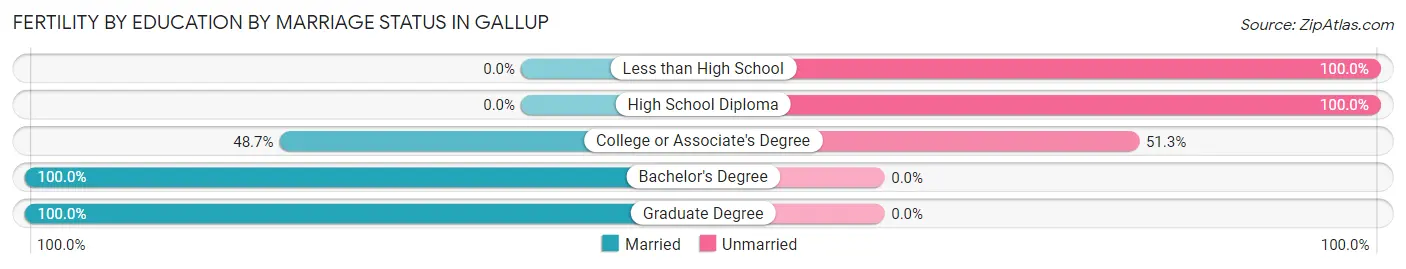
| Educational Attainment | Married | Unmarried |
| Less than High School | 0 (0.0%) | 117 (100.0%) |
| High School Diploma | 0 (0.0%) | 81 (100.0%) |
| College or Associate's Degree | 37 (48.7%) | 39 (51.3%) |
| Bachelor's Degree | 41 (100.0%) | 0 (0.0%) |
| Graduate Degree | 4 (100.0%) | 0 (0.0%) |
| Total | 82 (25.7%) | 237 (74.3%) |
Employment Characteristics in Gallup
Employment by Class of Employer in Gallup
Among the 8,358 employed individuals in Gallup, private company employees (4,776 | 57.1%), local government employees (1,081 | 12.9%), and federal government employees (723 | 8.6%) make up the most common classes of employment.
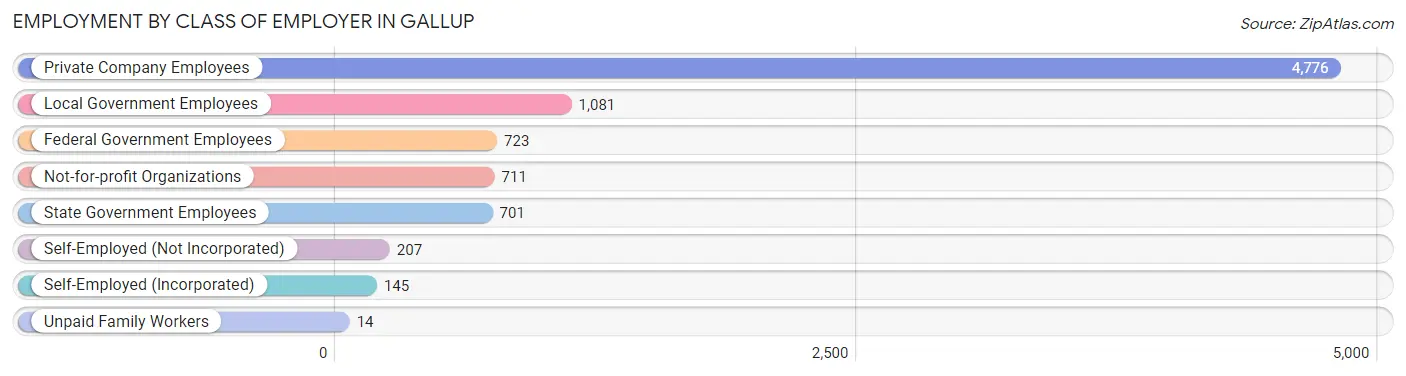
| Employer Class | # Employees | % Employees |
| Private Company Employees | 4,776 | 57.1% |
| Self-Employed (Incorporated) | 145 | 1.7% |
| Self-Employed (Not Incorporated) | 207 | 2.5% |
| Not-for-profit Organizations | 711 | 8.5% |
| Local Government Employees | 1,081 | 12.9% |
| State Government Employees | 701 | 8.4% |
| Federal Government Employees | 723 | 8.6% |
| Unpaid Family Workers | 14 | 0.2% |
| Total | 8,358 | 100.0% |
Employment Status by Age in Gallup
According to the labor force statistics for Gallup, out of the total population over 16 years of age (15,997), 54.7% or 8,750 individuals are in the labor force, with 3.9% or 341 of them unemployed. The age group with the highest labor force participation rate is 30 to 34 years, with 81.0% or 1,245 individuals in the labor force. Within the labor force, the 55 to 59 years age range has the highest percentage of unemployed individuals, with 13.6% or 111 of them being unemployed.
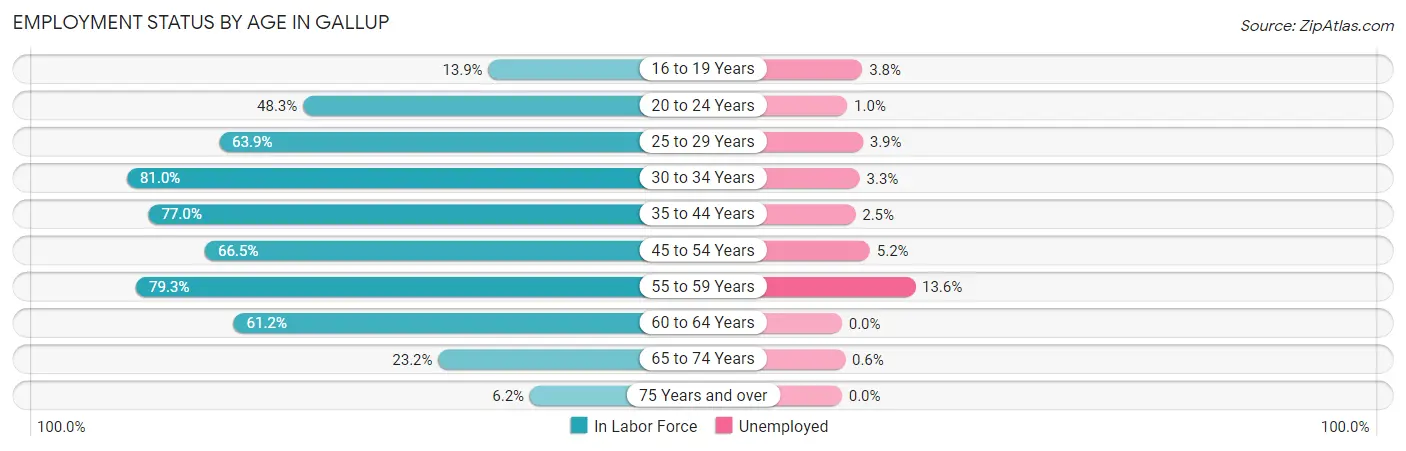
| Age Bracket | In Labor Force | Unemployed |
| 16 to 19 Years | 183 (13.9%) | 7 (3.8%) |
| 20 to 24 Years | 582 (48.3%) | 6 (1.0%) |
| 25 to 29 Years | 938 (63.9%) | 37 (3.9%) |
| 30 to 34 Years | 1,245 (81.0%) | 41 (3.3%) |
| 35 to 44 Years | 2,362 (77.0%) | 59 (2.5%) |
| 45 to 54 Years | 1,441 (66.5%) | 75 (5.2%) |
| 55 to 59 Years | 814 (79.3%) | 111 (13.6%) |
| 60 to 64 Years | 645 (61.2%) | 0 (0.0%) |
| 65 to 74 Years | 473 (23.2%) | 3 (0.6%) |
| 75 Years and over | 69 (6.2%) | 0 (0.0%) |
| Total | 8,750 (54.7%) | 341 (3.9%) |
Employment Status by Educational Attainment in Gallup
According to labor force statistics for Gallup, 72.1% of individuals (7,441) out of the total population between 25 and 64 years of age (10,320) are in the labor force, with 4.3% or 320 of them being unemployed. The group with the highest labor force participation rate are those with the educational attainment of bachelor's degree or higher, with 87.9% or 2,219 individuals in the labor force. Within the labor force, individuals with less than high school education have the highest percentage of unemployment, with 11.2% or 85 of them being unemployed.
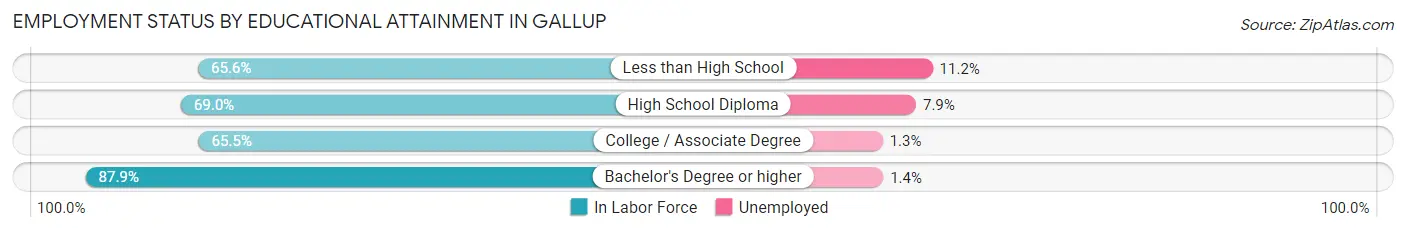
| Educational Attainment | In Labor Force | Unemployed |
| Less than High School | 757 (65.6%) | 129 (11.2%) |
| High School Diploma | 2,259 (69.0%) | 259 (7.9%) |
| College / Associate Degree | 2,205 (65.5%) | 44 (1.3%) |
| Bachelor's Degree or higher | 2,219 (87.9%) | 35 (1.4%) |
| Total | 7,441 (72.1%) | 444 (4.3%) |
Employment Occupations by Sex in Gallup
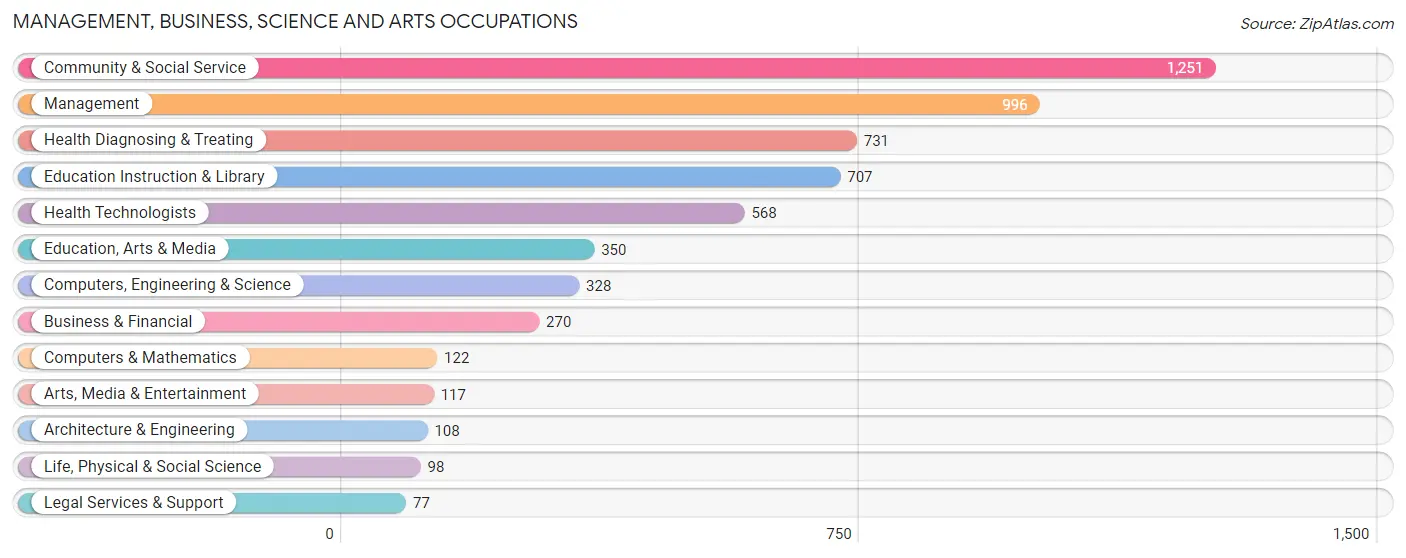
Management, Business, Science and Arts Occupations
The most common Management, Business, Science and Arts occupations in Gallup are Community & Social Service (1,251 | 14.9%), Management (996 | 11.8%), Health Diagnosing & Treating (731 | 8.7%), Education Instruction & Library (707 | 8.4%), and Health Technologists (568 | 6.8%).
Management, Business, Science and Arts Occupations by Sex
Within the Management, Business, Science and Arts occupations in Gallup, the most male-oriented occupations are Architecture & Engineering (100.0%), Computers & Mathematics (90.2%), and Computers, Engineering & Science (88.1%), while the most female-oriented occupations are Education, Arts & Media (78.3%), Education Instruction & Library (77.6%), and Health Technologists (77.5%).
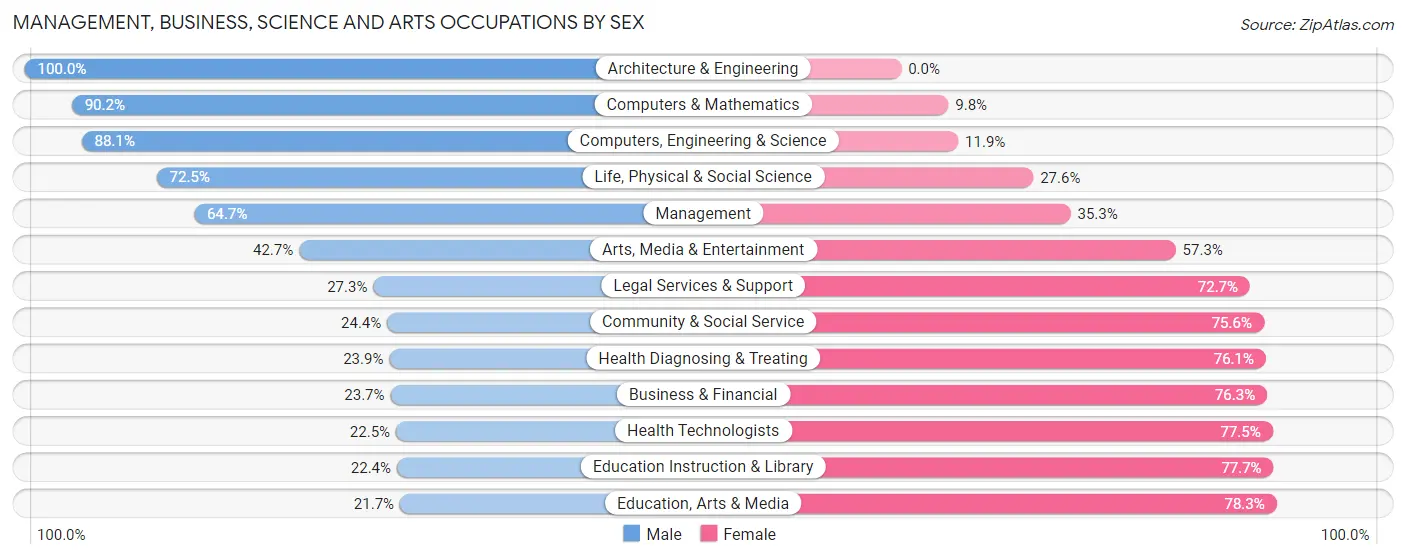
| Occupation | Male | Female |
| Management | 644 (64.7%) | 352 (35.3%) |
| Business & Financial | 64 (23.7%) | 206 (76.3%) |
| Computers, Engineering & Science | 289 (88.1%) | 39 (11.9%) |
| Computers & Mathematics | 110 (90.2%) | 12 (9.8%) |
| Architecture & Engineering | 108 (100.0%) | 0 (0.0%) |
| Life, Physical & Social Science | 71 (72.5%) | 27 (27.6%) |
| Community & Social Service | 305 (24.4%) | 946 (75.6%) |
| Education, Arts & Media | 76 (21.7%) | 274 (78.3%) |
| Legal Services & Support | 21 (27.3%) | 56 (72.7%) |
| Education Instruction & Library | 158 (22.4%) | 549 (77.6%) |
| Arts, Media & Entertainment | 50 (42.7%) | 67 (57.3%) |
| Health Diagnosing & Treating | 175 (23.9%) | 556 (76.1%) |
| Health Technologists | 128 (22.5%) | 440 (77.5%) |
| Total (Category) | 1,477 (41.3%) | 2,099 (58.7%) |
| Total (Overall) | 4,133 (49.1%) | 4,277 (50.9%) |
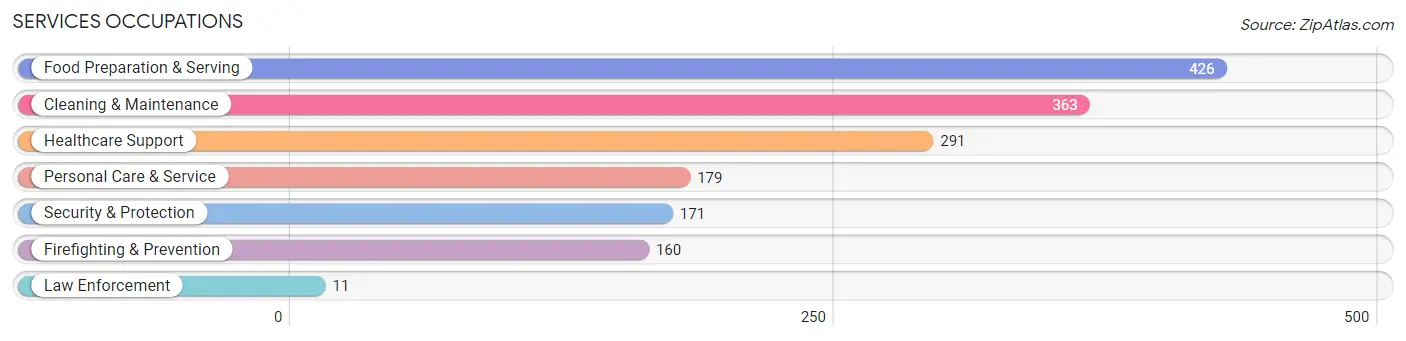
Services Occupations
The most common Services occupations in Gallup are Food Preparation & Serving (426 | 5.1%), Cleaning & Maintenance (363 | 4.3%), Healthcare Support (291 | 3.5%), Personal Care & Service (179 | 2.1%), and Security & Protection (171 | 2.0%).
Services Occupations by Sex
Within the Services occupations in Gallup, the most male-oriented occupations are Security & Protection (100.0%), Firefighting & Prevention (100.0%), and Law Enforcement (100.0%), while the most female-oriented occupations are Personal Care & Service (85.5%), Cleaning & Maintenance (62.8%), and Healthcare Support (53.6%).
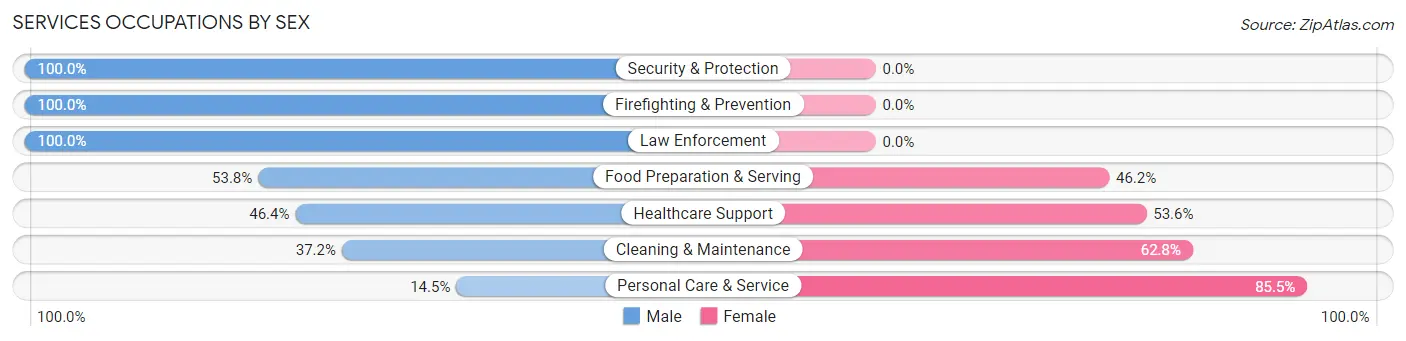
| Occupation | Male | Female |
| Healthcare Support | 135 (46.4%) | 156 (53.6%) |
| Security & Protection | 171 (100.0%) | 0 (0.0%) |
| Firefighting & Prevention | 160 (100.0%) | 0 (0.0%) |
| Law Enforcement | 11 (100.0%) | 0 (0.0%) |
| Food Preparation & Serving | 229 (53.8%) | 197 (46.2%) |
| Cleaning & Maintenance | 135 (37.2%) | 228 (62.8%) |
| Personal Care & Service | 26 (14.5%) | 153 (85.5%) |
| Total (Category) | 696 (48.7%) | 734 (51.3%) |
| Total (Overall) | 4,133 (49.1%) | 4,277 (50.9%) |
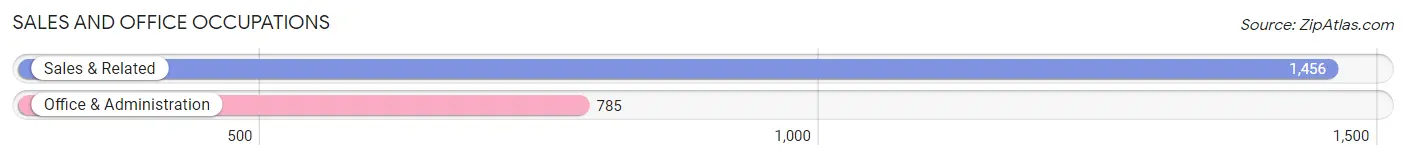
Sales and Office Occupations
The most common Sales and Office occupations in Gallup are Sales & Related (1,456 | 17.3%), and Office & Administration (785 | 9.3%).
Sales and Office Occupations by Sex
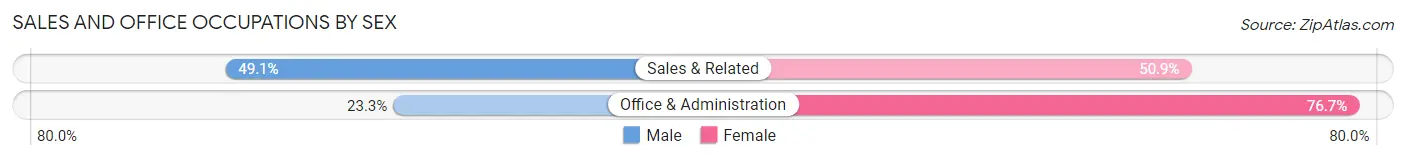
| Occupation | Male | Female |
| Sales & Related | 715 (49.1%) | 741 (50.9%) |
| Office & Administration | 183 (23.3%) | 602 (76.7%) |
| Total (Category) | 898 (40.1%) | 1,343 (59.9%) |
| Total (Overall) | 4,133 (49.1%) | 4,277 (50.9%) |
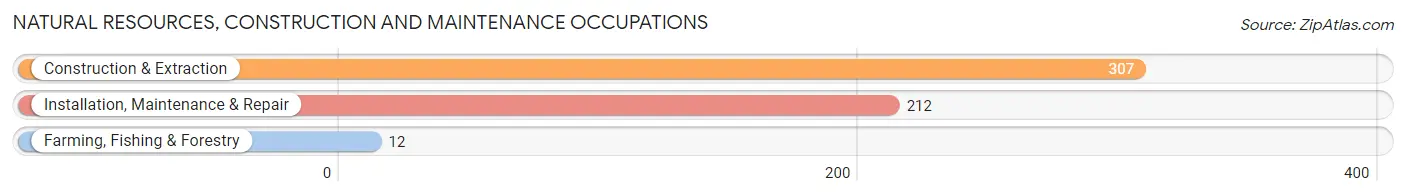
Natural Resources, Construction and Maintenance Occupations
The most common Natural Resources, Construction and Maintenance occupations in Gallup are Construction & Extraction (307 | 3.6%), Installation, Maintenance & Repair (212 | 2.5%), and Farming, Fishing & Forestry (12 | 0.1%).
Natural Resources, Construction and Maintenance Occupations by Sex
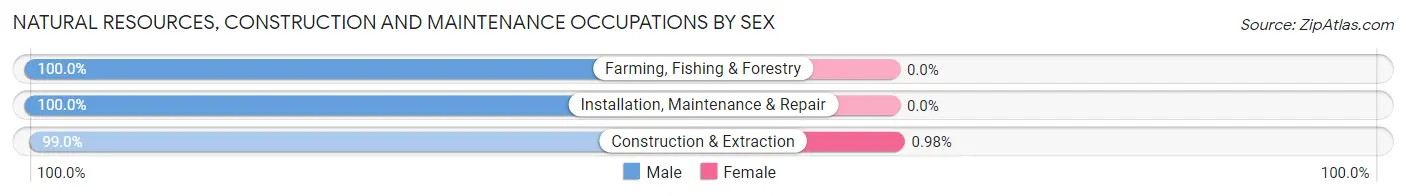
| Occupation | Male | Female |
| Farming, Fishing & Forestry | 12 (100.0%) | 0 (0.0%) |
| Construction & Extraction | 304 (99.0%) | 3 (1.0%) |
| Installation, Maintenance & Repair | 212 (100.0%) | 0 (0.0%) |
| Total (Category) | 528 (99.4%) | 3 (0.6%) |
| Total (Overall) | 4,133 (49.1%) | 4,277 (50.9%) |
Production, Transportation and Moving Occupations
The most common Production, Transportation and Moving occupations in Gallup are Material Moving (267 | 3.2%), Transportation (204 | 2.4%), and Production (161 | 1.9%).
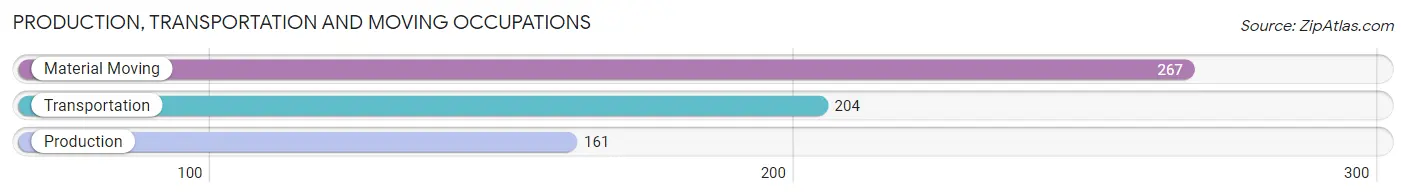
Production, Transportation and Moving Occupations by Sex
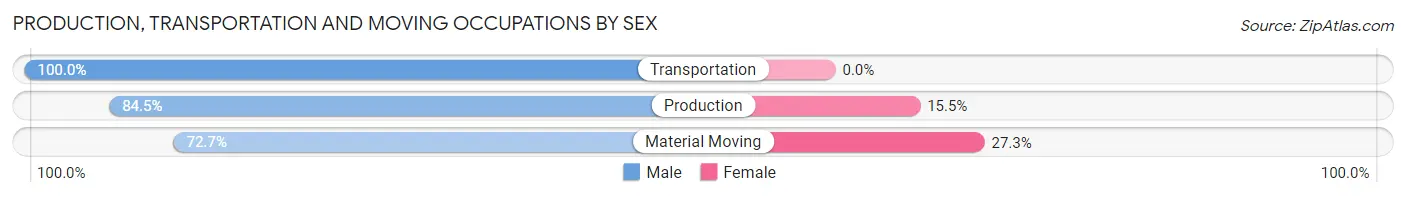
| Occupation | Male | Female |
| Production | 136 (84.5%) | 25 (15.5%) |
| Transportation | 204 (100.0%) | 0 (0.0%) |
| Material Moving | 194 (72.7%) | 73 (27.3%) |
| Total (Category) | 534 (84.5%) | 98 (15.5%) |
| Total (Overall) | 4,133 (49.1%) | 4,277 (50.9%) |
Employment Industries by Sex in Gallup
Employment Industries in Gallup
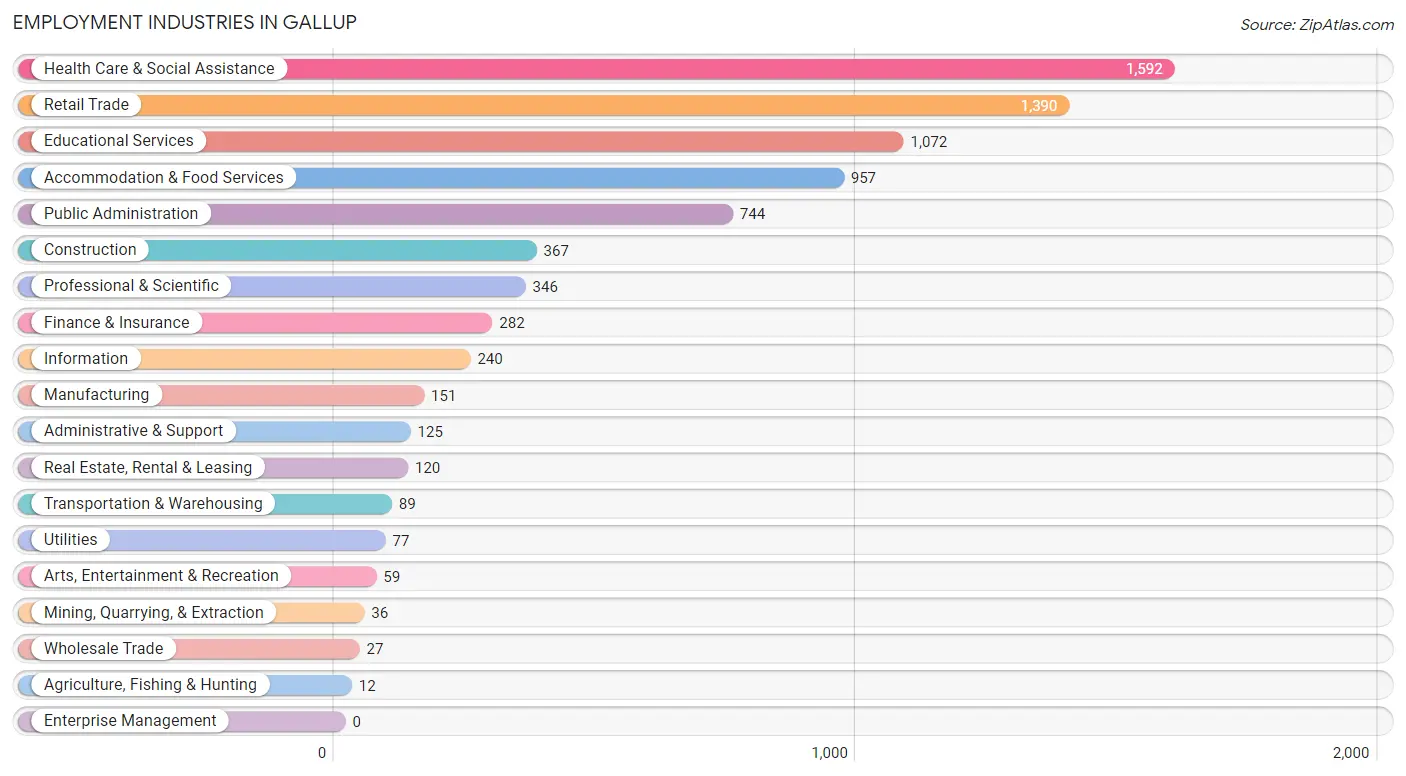
The major employment industries in Gallup include Health Care & Social Assistance (1,592 | 18.9%), Retail Trade (1,390 | 16.5%), Educational Services (1,072 | 12.8%), Accommodation & Food Services (957 | 11.4%), and Public Administration (744 | 8.8%).
Employment Industries by Sex in Gallup
The Gallup industries that see more men than women are Agriculture, Fishing & Hunting (100.0%), Transportation & Warehousing (100.0%), and Arts, Entertainment & Recreation (94.9%), whereas the industries that tend to have a higher number of women are Finance & Insurance (74.1%), Health Care & Social Assistance (69.2%), and Educational Services (68.2%).
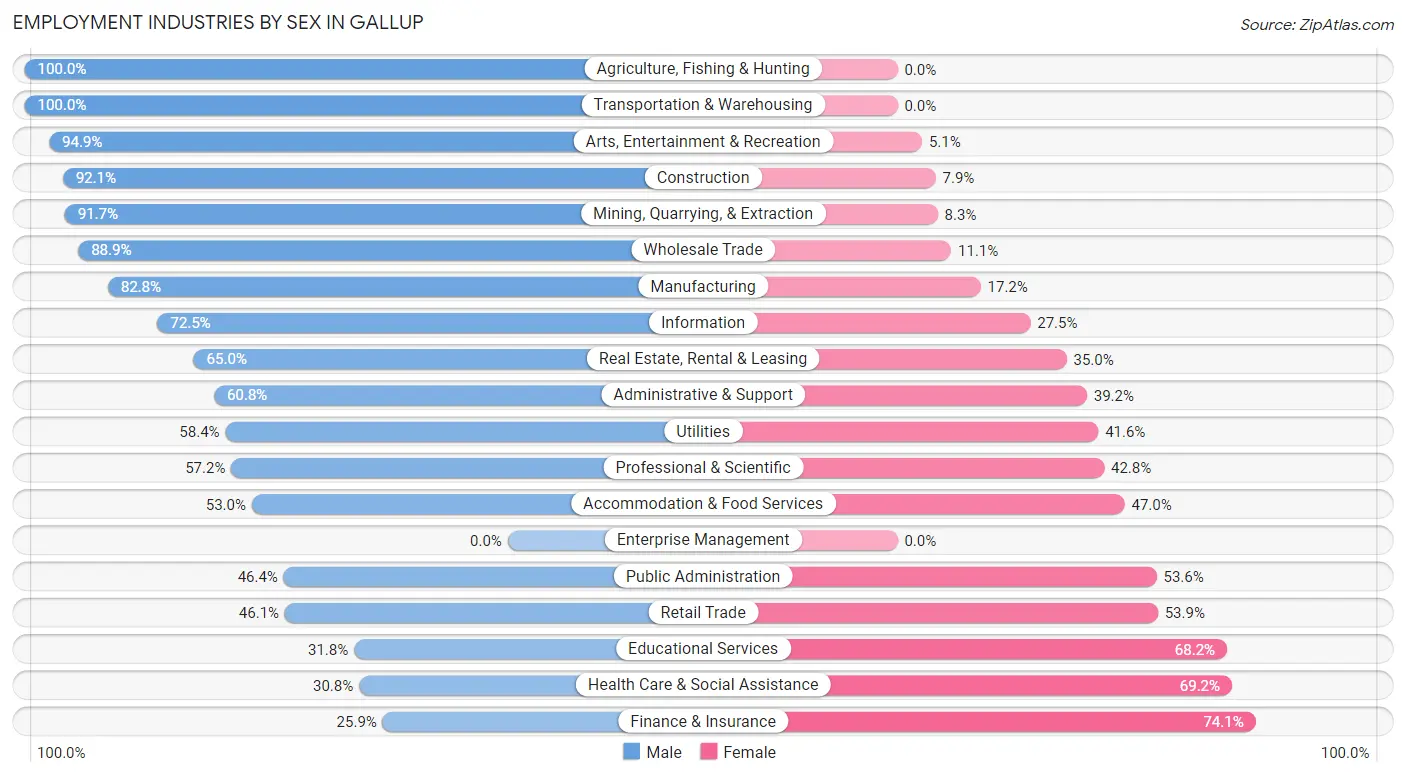
| Industry | Male | Female |
| Agriculture, Fishing & Hunting | 12 (100.0%) | 0 (0.0%) |
| Mining, Quarrying, & Extraction | 33 (91.7%) | 3 (8.3%) |
| Construction | 338 (92.1%) | 29 (7.9%) |
| Manufacturing | 125 (82.8%) | 26 (17.2%) |
| Wholesale Trade | 24 (88.9%) | 3 (11.1%) |
| Retail Trade | 641 (46.1%) | 749 (53.9%) |
| Transportation & Warehousing | 89 (100.0%) | 0 (0.0%) |
| Utilities | 45 (58.4%) | 32 (41.6%) |
| Information | 174 (72.5%) | 66 (27.5%) |
| Finance & Insurance | 73 (25.9%) | 209 (74.1%) |
| Real Estate, Rental & Leasing | 78 (65.0%) | 42 (35.0%) |
| Professional & Scientific | 198 (57.2%) | 148 (42.8%) |
| Enterprise Management | 0 (0.0%) | 0 (0.0%) |
| Administrative & Support | 76 (60.8%) | 49 (39.2%) |
| Educational Services | 341 (31.8%) | 731 (68.2%) |
| Health Care & Social Assistance | 490 (30.8%) | 1,102 (69.2%) |
| Arts, Entertainment & Recreation | 56 (94.9%) | 3 (5.1%) |
| Accommodation & Food Services | 507 (53.0%) | 450 (47.0%) |
| Public Administration | 345 (46.4%) | 399 (53.6%) |
| Total | 4,133 (49.1%) | 4,277 (50.9%) |
Education in Gallup
School Enrollment in Gallup
The most common levels of schooling among the 6,452 students in Gallup are middle school (1,960 | 30.4%), elementary school (1,406 | 21.8%), and high school (1,262 | 19.6%).
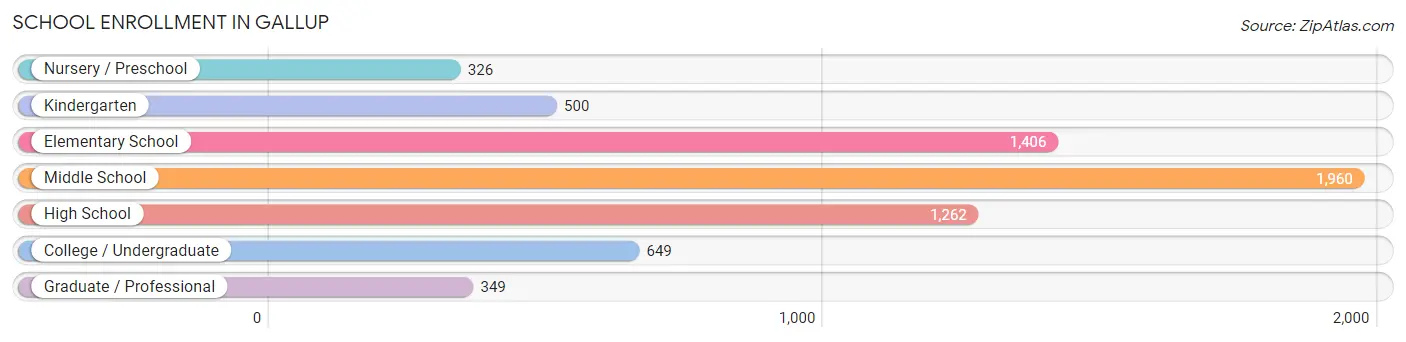
| School Level | # Students | % Students |
| Nursery / Preschool | 326 | 5.1% |
| Kindergarten | 500 | 7.7% |
| Elementary School | 1,406 | 21.8% |
| Middle School | 1,960 | 30.4% |
| High School | 1,262 | 19.6% |
| College / Undergraduate | 649 | 10.1% |
| Graduate / Professional | 349 | 5.4% |
| Total | 6,452 | 100.0% |
School Enrollment by Age by Funding Source in Gallup
Out of a total of 6,452 students who are enrolled in schools in Gallup, 348 (5.4%) attend a private institution, while the remaining 6,104 (94.6%) are enrolled in public schools. The age group of 25 to 34 year olds has the highest likelihood of being enrolled in private schools, with 80 (21.8% in the age bracket) enrolled. Conversely, the age group of 18 to 19 year olds has the lowest likelihood of being enrolled in a private school, with 159 (100.0% in the age bracket) attending a public institution.
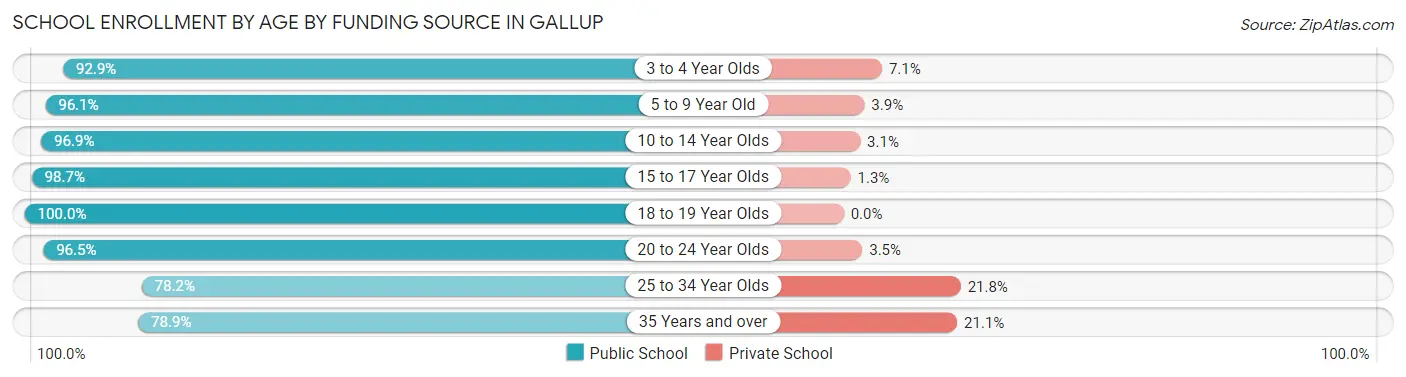
| Age Bracket | Public School | Private School |
| 3 to 4 Year Olds | 247 (92.9%) | 19 (7.1%) |
| 5 to 9 Year Old | 1,695 (96.1%) | 68 (3.9%) |
| 10 to 14 Year Olds | 2,054 (96.9%) | 65 (3.1%) |
| 15 to 17 Year Olds | 1,150 (98.7%) | 15 (1.3%) |
| 18 to 19 Year Olds | 159 (100.0%) | 0 (0.0%) |
| 20 to 24 Year Olds | 167 (96.5%) | 6 (3.5%) |
| 25 to 34 Year Olds | 287 (78.2%) | 80 (21.8%) |
| 35 Years and over | 347 (78.9%) | 93 (21.1%) |
| Total | 6,104 (94.6%) | 348 (5.4%) |
Educational Attainment by Field of Study in Gallup
Business (732 | 21.7%), education (480 | 14.2%), science & technology (469 | 13.9%), bio, nature & agricultural (286 | 8.5%), and psychology (284 | 8.4%) are the most common fields of study among 3,373 individuals in Gallup who have obtained a bachelor's degree or higher.
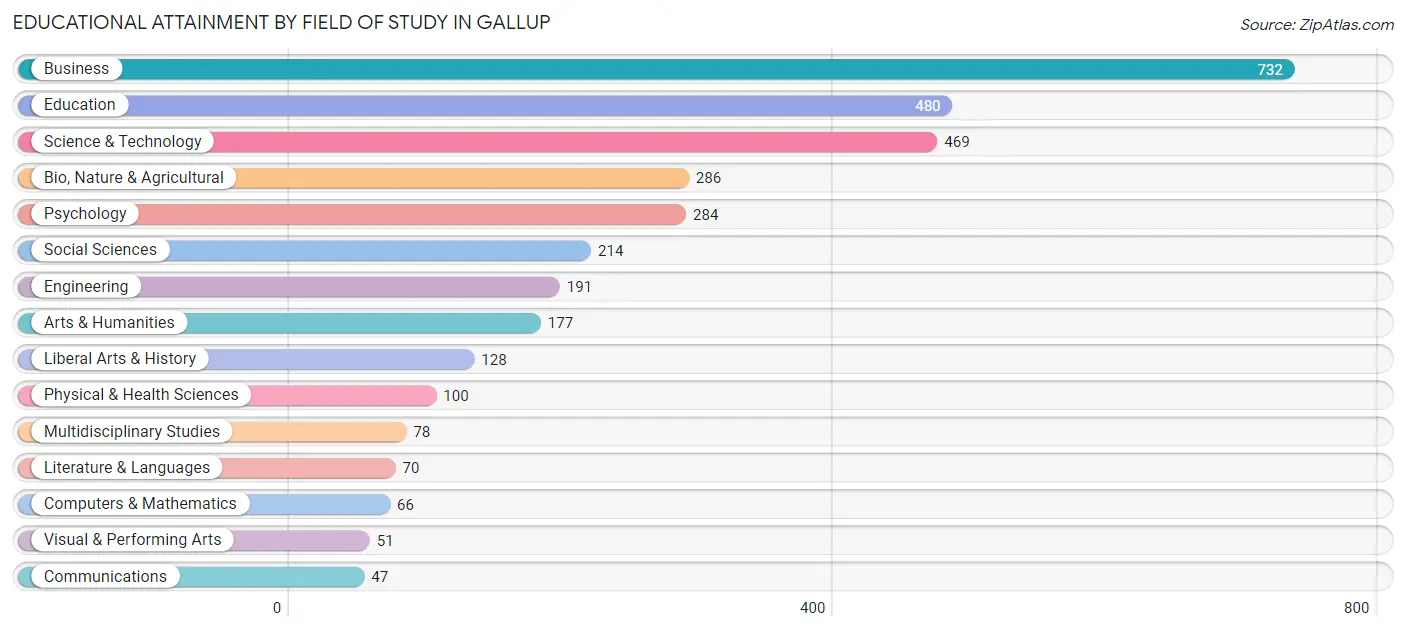
| Field of Study | # Graduates | % Graduates |
| Computers & Mathematics | 66 | 2.0% |
| Bio, Nature & Agricultural | 286 | 8.5% |
| Physical & Health Sciences | 100 | 3.0% |
| Psychology | 284 | 8.4% |
| Social Sciences | 214 | 6.3% |
| Engineering | 191 | 5.7% |
| Multidisciplinary Studies | 78 | 2.3% |
| Science & Technology | 469 | 13.9% |
| Business | 732 | 21.7% |
| Education | 480 | 14.2% |
| Literature & Languages | 70 | 2.1% |
| Liberal Arts & History | 128 | 3.8% |
| Visual & Performing Arts | 51 | 1.5% |
| Communications | 47 | 1.4% |
| Arts & Humanities | 177 | 5.2% |
| Total | 3,373 | 100.0% |
Transportation & Commute in Gallup
Vehicle Availability by Sex in Gallup
The most prevalent vehicle ownership categories in Gallup are males with 2 vehicles (1,515, accounting for 37.2%) and females with 2 vehicles (1,499, making up 36.0%).
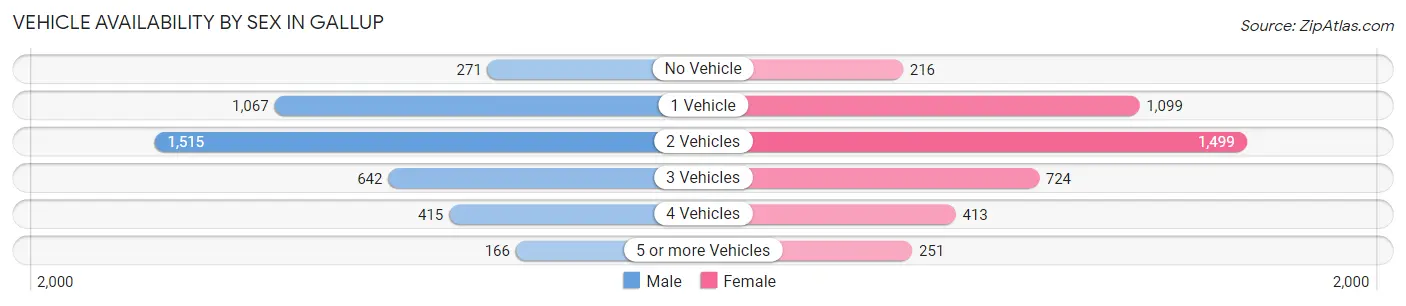
| Vehicles Available | Male | Female |
| No Vehicle | 271 (6.7%) | 216 (5.1%) |
| 1 Vehicle | 1,067 (26.2%) | 1,099 (26.2%) |
| 2 Vehicles | 1,515 (37.2%) | 1,499 (35.7%) |
| 3 Vehicles | 642 (15.8%) | 724 (17.2%) |
| 4 Vehicles | 415 (10.2%) | 413 (9.8%) |
| 5 or more Vehicles | 166 (4.1%) | 251 (6.0%) |
| Total | 4,076 (100.0%) | 4,202 (100.0%) |
Commute Time in Gallup
The most frequently occuring commute durations in Gallup are 5 to 9 minutes (1,965 commuters, 25.1%), 10 to 14 minutes (1,880 commuters, 24.0%), and 15 to 19 minutes (1,504 commuters, 19.2%).
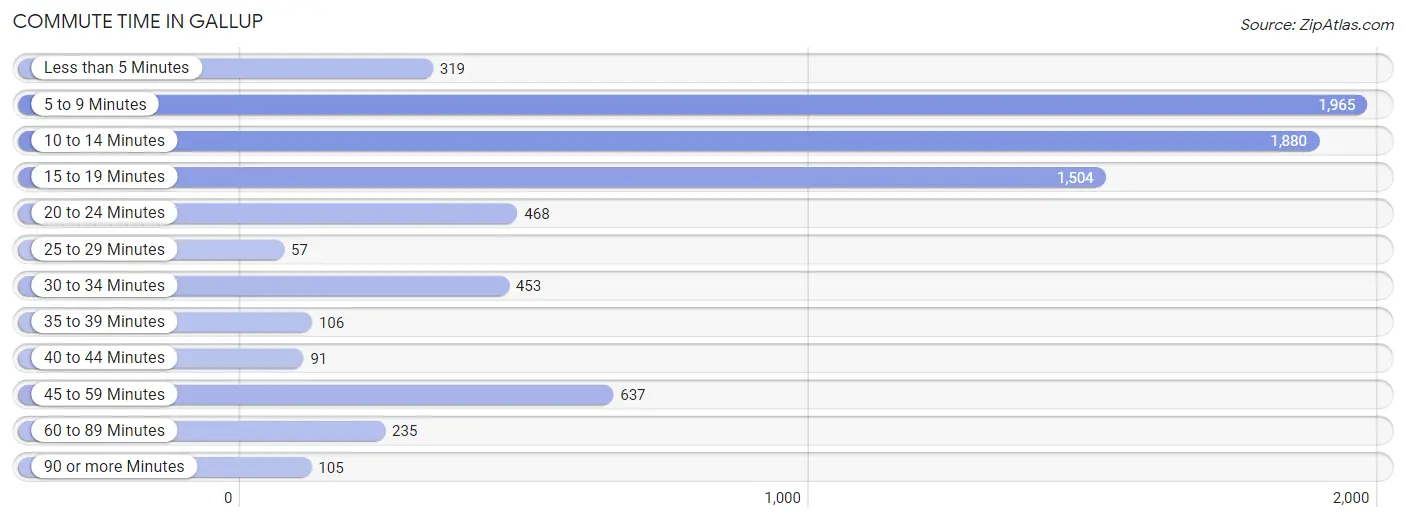
| Commute Time | # Commuters | % Commuters |
| Less than 5 Minutes | 319 | 4.1% |
| 5 to 9 Minutes | 1,965 | 25.1% |
| 10 to 14 Minutes | 1,880 | 24.0% |
| 15 to 19 Minutes | 1,504 | 19.2% |
| 20 to 24 Minutes | 468 | 6.0% |
| 25 to 29 Minutes | 57 | 0.7% |
| 30 to 34 Minutes | 453 | 5.8% |
| 35 to 39 Minutes | 106 | 1.4% |
| 40 to 44 Minutes | 91 | 1.2% |
| 45 to 59 Minutes | 637 | 8.2% |
| 60 to 89 Minutes | 235 | 3.0% |
| 90 or more Minutes | 105 | 1.3% |
Commute Time by Sex in Gallup
The most common commute times in Gallup are 10 to 14 minutes (1,015 commuters, 25.8%) for males and 5 to 9 minutes (1,031 commuters, 26.5%) for females.
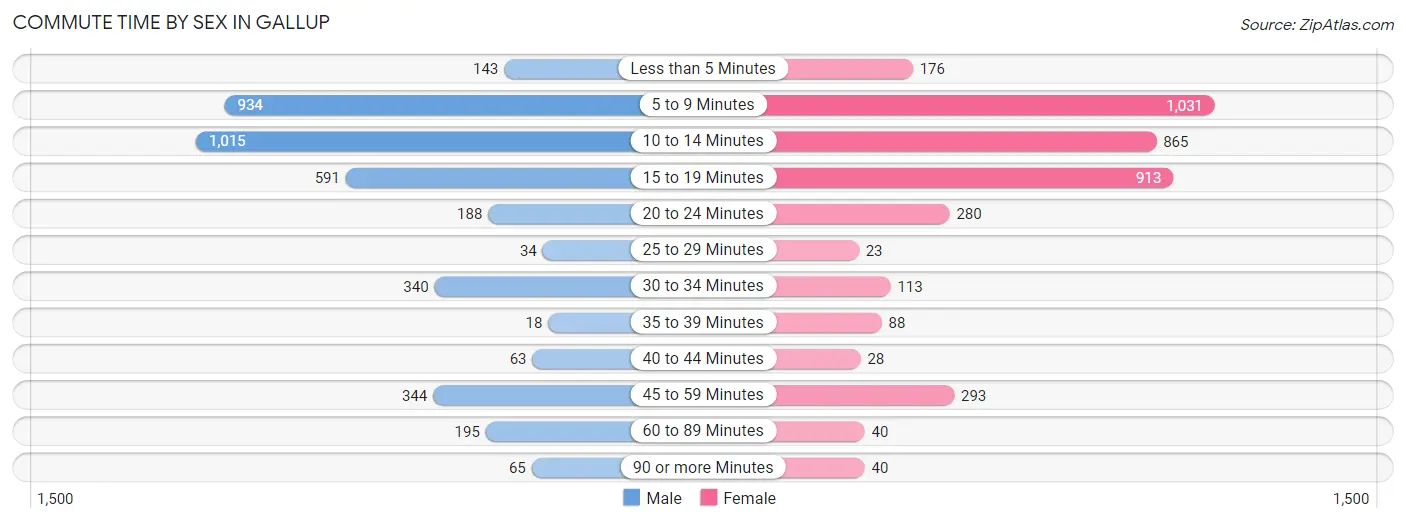
| Commute Time | Male | Female |
| Less than 5 Minutes | 143 (3.6%) | 176 (4.5%) |
| 5 to 9 Minutes | 934 (23.8%) | 1,031 (26.5%) |
| 10 to 14 Minutes | 1,015 (25.8%) | 865 (22.2%) |
| 15 to 19 Minutes | 591 (15.0%) | 913 (23.5%) |
| 20 to 24 Minutes | 188 (4.8%) | 280 (7.2%) |
| 25 to 29 Minutes | 34 (0.9%) | 23 (0.6%) |
| 30 to 34 Minutes | 340 (8.6%) | 113 (2.9%) |
| 35 to 39 Minutes | 18 (0.5%) | 88 (2.3%) |
| 40 to 44 Minutes | 63 (1.6%) | 28 (0.7%) |
| 45 to 59 Minutes | 344 (8.7%) | 293 (7.5%) |
| 60 to 89 Minutes | 195 (5.0%) | 40 (1.0%) |
| 90 or more Minutes | 65 (1.7%) | 40 (1.0%) |
Time of Departure to Work by Sex in Gallup
The most frequent times of departure to work in Gallup are 8:00 AM to 8:29 AM (593, 15.1%) for males and 7:30 AM to 7:59 AM (737, 19.0%) for females.
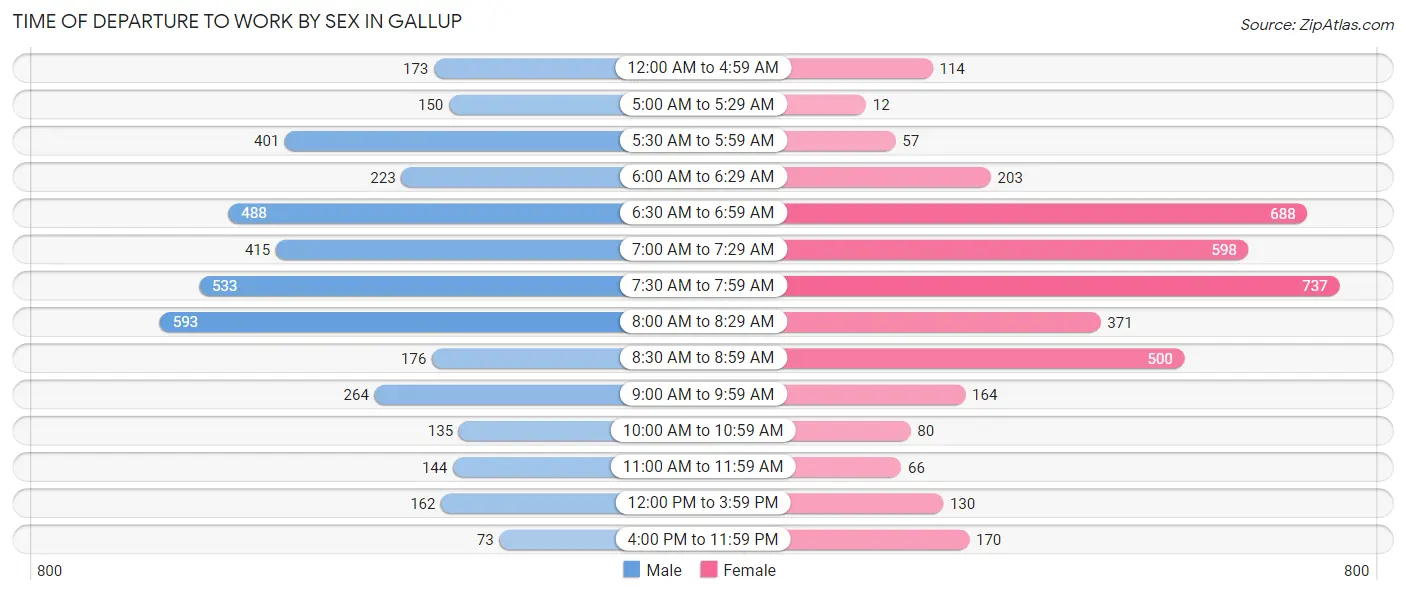
| Time of Departure | Male | Female |
| 12:00 AM to 4:59 AM | 173 (4.4%) | 114 (2.9%) |
| 5:00 AM to 5:29 AM | 150 (3.8%) | 12 (0.3%) |
| 5:30 AM to 5:59 AM | 401 (10.2%) | 57 (1.5%) |
| 6:00 AM to 6:29 AM | 223 (5.7%) | 203 (5.2%) |
| 6:30 AM to 6:59 AM | 488 (12.4%) | 688 (17.7%) |
| 7:00 AM to 7:29 AM | 415 (10.6%) | 598 (15.4%) |
| 7:30 AM to 7:59 AM | 533 (13.6%) | 737 (19.0%) |
| 8:00 AM to 8:29 AM | 593 (15.1%) | 371 (9.5%) |
| 8:30 AM to 8:59 AM | 176 (4.5%) | 500 (12.9%) |
| 9:00 AM to 9:59 AM | 264 (6.7%) | 164 (4.2%) |
| 10:00 AM to 10:59 AM | 135 (3.4%) | 80 (2.1%) |
| 11:00 AM to 11:59 AM | 144 (3.7%) | 66 (1.7%) |
| 12:00 PM to 3:59 PM | 162 (4.1%) | 130 (3.3%) |
| 4:00 PM to 11:59 PM | 73 (1.9%) | 170 (4.4%) |
| Total | 3,930 (100.0%) | 3,890 (100.0%) |
Housing Occupancy in Gallup
Occupancy by Ownership in Gallup
Of the total 7,086 dwellings in Gallup, owner-occupied units account for 3,869 (54.6%), while renter-occupied units make up 3,217 (45.4%).
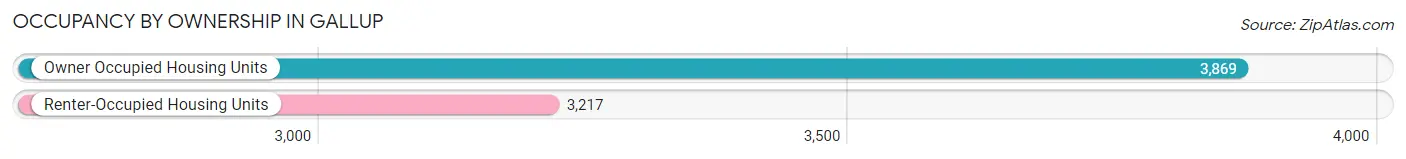
| Occupancy | # Housing Units | % Housing Units |
| Owner Occupied Housing Units | 3,869 | 54.6% |
| Renter-Occupied Housing Units | 3,217 | 45.4% |
| Total Occupied Housing Units | 7,086 | 100.0% |
Occupancy by Household Size in Gallup
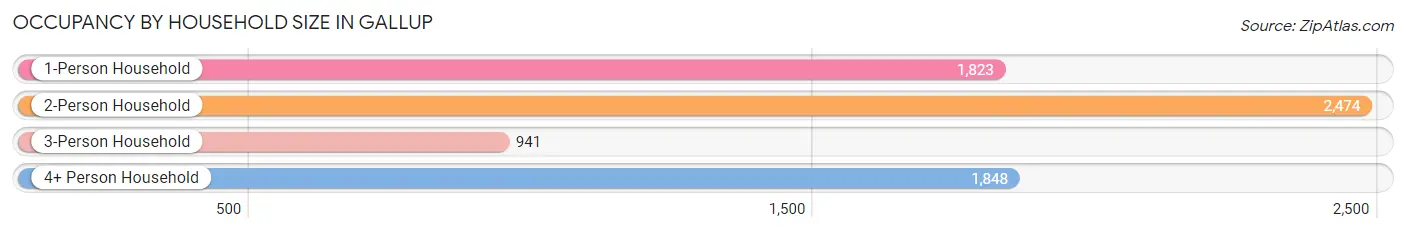
| Household Size | # Housing Units | % Housing Units |
| 1-Person Household | 1,823 | 25.7% |
| 2-Person Household | 2,474 | 34.9% |
| 3-Person Household | 941 | 13.3% |
| 4+ Person Household | 1,848 | 26.1% |
| Total Housing Units | 7,086 | 100.0% |
Occupancy by Ownership by Household Size in Gallup
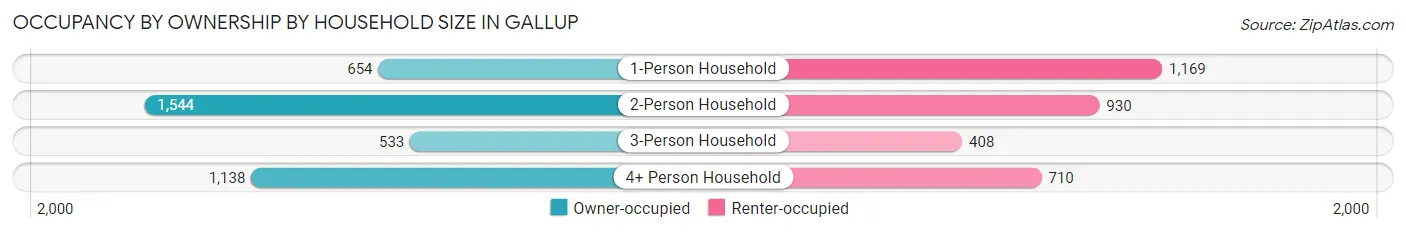
| Household Size | Owner-occupied | Renter-occupied |
| 1-Person Household | 654 (35.9%) | 1,169 (64.1%) |
| 2-Person Household | 1,544 (62.4%) | 930 (37.6%) |
| 3-Person Household | 533 (56.6%) | 408 (43.4%) |
| 4+ Person Household | 1,138 (61.6%) | 710 (38.4%) |
| Total Housing Units | 3,869 (54.6%) | 3,217 (45.4%) |
Occupancy by Educational Attainment in Gallup
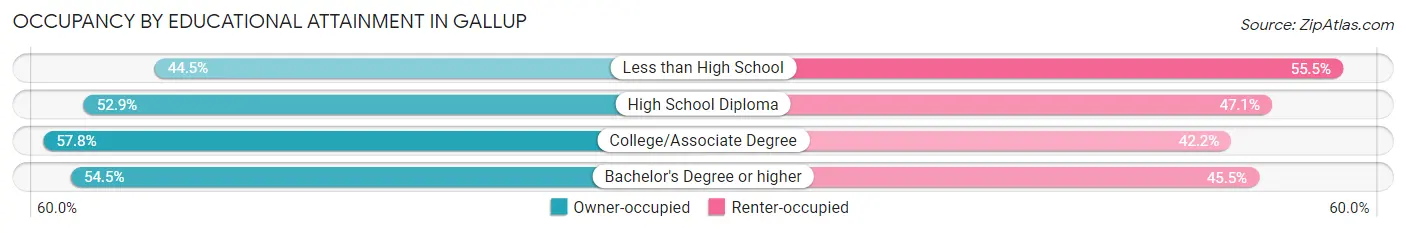
| Household Size | Owner-occupied | Renter-occupied |
| Less than High School | 166 (44.5%) | 207 (55.5%) |
| High School Diploma | 1,286 (52.9%) | 1,143 (47.1%) |
| College/Associate Degree | 1,455 (57.8%) | 1,063 (42.2%) |
| Bachelor's Degree or higher | 962 (54.5%) | 804 (45.5%) |
Occupancy by Age of Householder in Gallup
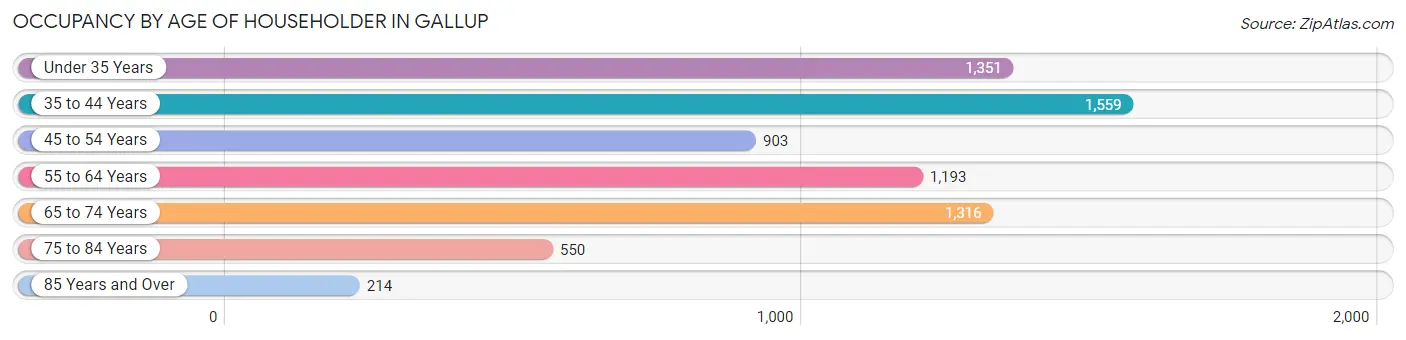
| Age Bracket | # Households | % Households |
| Under 35 Years | 1,351 | 19.1% |
| 35 to 44 Years | 1,559 | 22.0% |
| 45 to 54 Years | 903 | 12.7% |
| 55 to 64 Years | 1,193 | 16.8% |
| 65 to 74 Years | 1,316 | 18.6% |
| 75 to 84 Years | 550 | 7.8% |
| 85 Years and Over | 214 | 3.0% |
| Total | 7,086 | 100.0% |
Housing Finances in Gallup
Median Income by Occupancy in Gallup
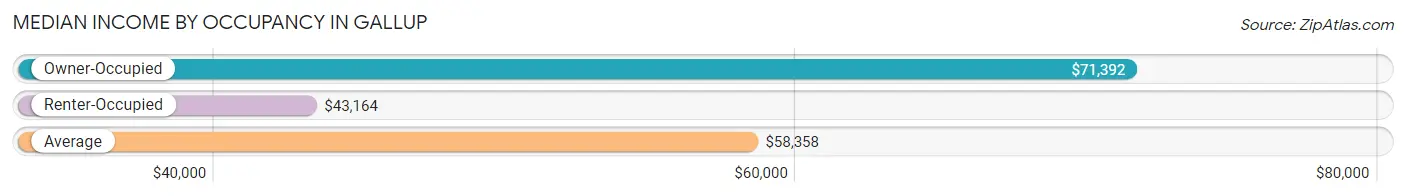
| Occupancy Type | # Households | Median Income |
| Owner-Occupied | 3,869 (54.6%) | $71,392 |
| Renter-Occupied | 3,217 (45.4%) | $43,164 |
| Average | 7,086 (100.0%) | $58,358 |
Occupancy by Householder Income Bracket in Gallup
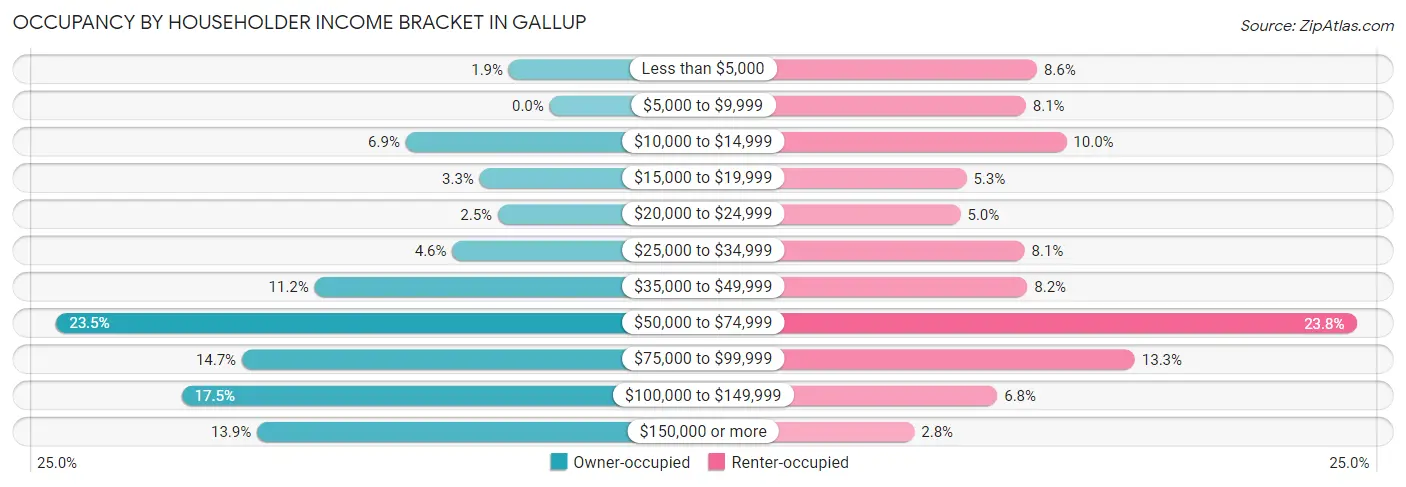
| Income Bracket | Owner-occupied | Renter-occupied |
| Less than $5,000 | 75 (1.9%) | 278 (8.6%) |
| $5,000 to $9,999 | 0 (0.0%) | 261 (8.1%) |
| $10,000 to $14,999 | 265 (6.9%) | 323 (10.0%) |
| $15,000 to $19,999 | 129 (3.3%) | 170 (5.3%) |
| $20,000 to $24,999 | 95 (2.5%) | 161 (5.0%) |
| $25,000 to $34,999 | 179 (4.6%) | 259 (8.1%) |
| $35,000 to $49,999 | 433 (11.2%) | 263 (8.2%) |
| $50,000 to $74,999 | 909 (23.5%) | 767 (23.8%) |
| $75,000 to $99,999 | 567 (14.6%) | 428 (13.3%) |
| $100,000 to $149,999 | 678 (17.5%) | 217 (6.8%) |
| $150,000 or more | 539 (13.9%) | 90 (2.8%) |
| Total | 3,869 (100.0%) | 3,217 (100.0%) |
Monthly Housing Cost Tiers in Gallup
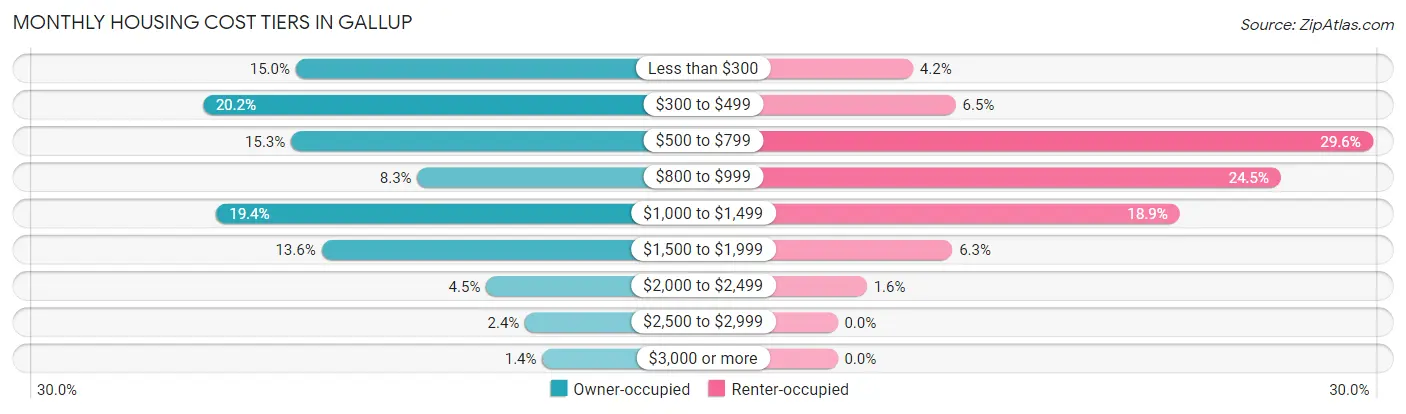
| Monthly Cost | Owner-occupied | Renter-occupied |
| Less than $300 | 581 (15.0%) | 134 (4.2%) |
| $300 to $499 | 780 (20.2%) | 210 (6.5%) |
| $500 to $799 | 591 (15.3%) | 951 (29.6%) |
| $800 to $999 | 321 (8.3%) | 788 (24.5%) |
| $1,000 to $1,499 | 751 (19.4%) | 608 (18.9%) |
| $1,500 to $1,999 | 526 (13.6%) | 204 (6.3%) |
| $2,000 to $2,499 | 174 (4.5%) | 52 (1.6%) |
| $2,500 to $2,999 | 91 (2.4%) | 0 (0.0%) |
| $3,000 or more | 54 (1.4%) | 0 (0.0%) |
| Total | 3,869 (100.0%) | 3,217 (100.0%) |
Physical Housing Characteristics in Gallup
Housing Structures in Gallup
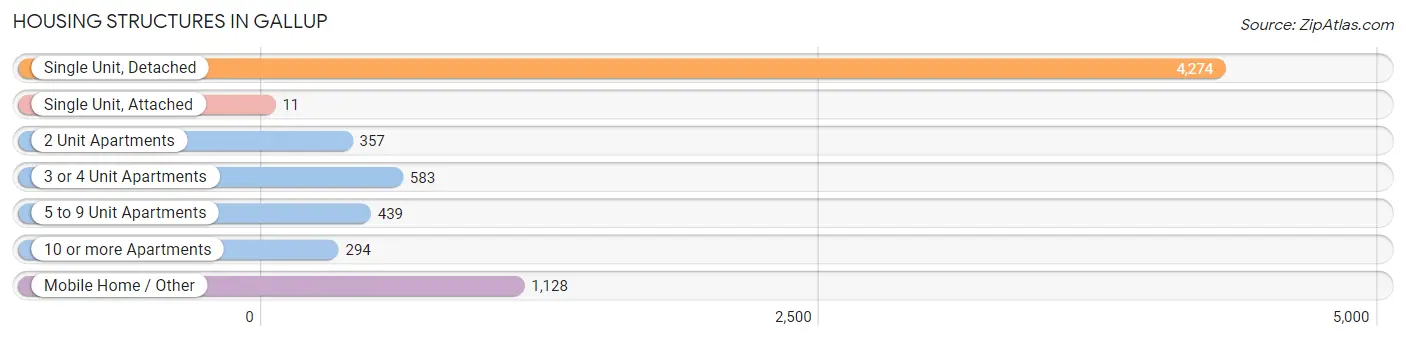
| Structure Type | # Housing Units | % Housing Units |
| Single Unit, Detached | 4,274 | 60.3% |
| Single Unit, Attached | 11 | 0.2% |
| 2 Unit Apartments | 357 | 5.0% |
| 3 or 4 Unit Apartments | 583 | 8.2% |
| 5 to 9 Unit Apartments | 439 | 6.2% |
| 10 or more Apartments | 294 | 4.2% |
| Mobile Home / Other | 1,128 | 15.9% |
| Total | 7,086 | 100.0% |
Housing Structures by Occupancy in Gallup
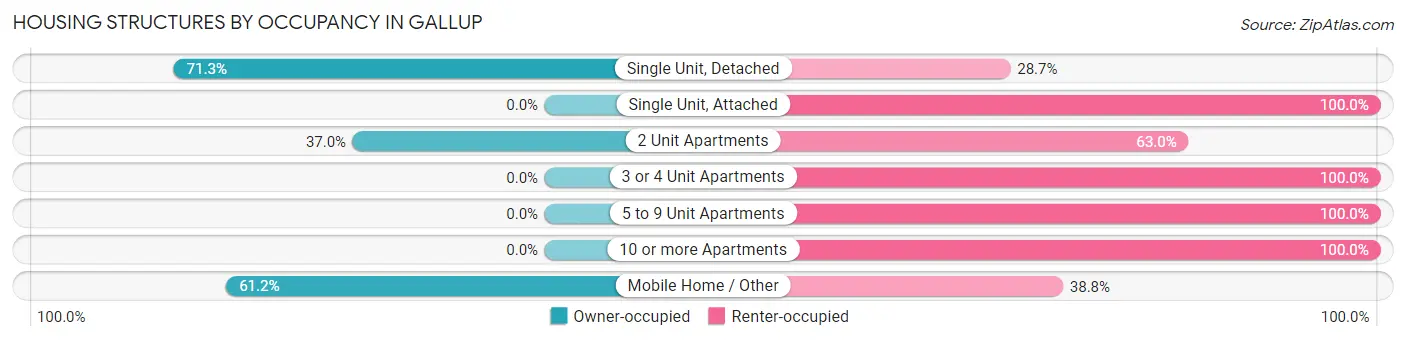
| Structure Type | Owner-occupied | Renter-occupied |
| Single Unit, Detached | 3,047 (71.3%) | 1,227 (28.7%) |
| Single Unit, Attached | 0 (0.0%) | 11 (100.0%) |
| 2 Unit Apartments | 132 (37.0%) | 225 (63.0%) |
| 3 or 4 Unit Apartments | 0 (0.0%) | 583 (100.0%) |
| 5 to 9 Unit Apartments | 0 (0.0%) | 439 (100.0%) |
| 10 or more Apartments | 0 (0.0%) | 294 (100.0%) |
| Mobile Home / Other | 690 (61.2%) | 438 (38.8%) |
| Total | 3,869 (54.6%) | 3,217 (45.4%) |
Housing Structures by Number of Rooms in Gallup
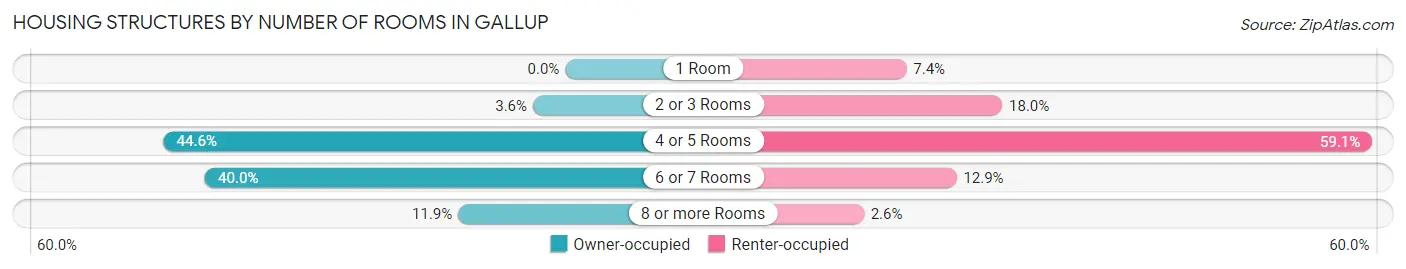
| Number of Rooms | Owner-occupied | Renter-occupied |
| 1 Room | 0 (0.0%) | 237 (7.4%) |
| 2 or 3 Rooms | 139 (3.6%) | 579 (18.0%) |
| 4 or 5 Rooms | 1,724 (44.6%) | 1,900 (59.1%) |
| 6 or 7 Rooms | 1,546 (40.0%) | 416 (12.9%) |
| 8 or more Rooms | 460 (11.9%) | 85 (2.6%) |
| Total | 3,869 (100.0%) | 3,217 (100.0%) |
Housing Structure by Heating Type in Gallup
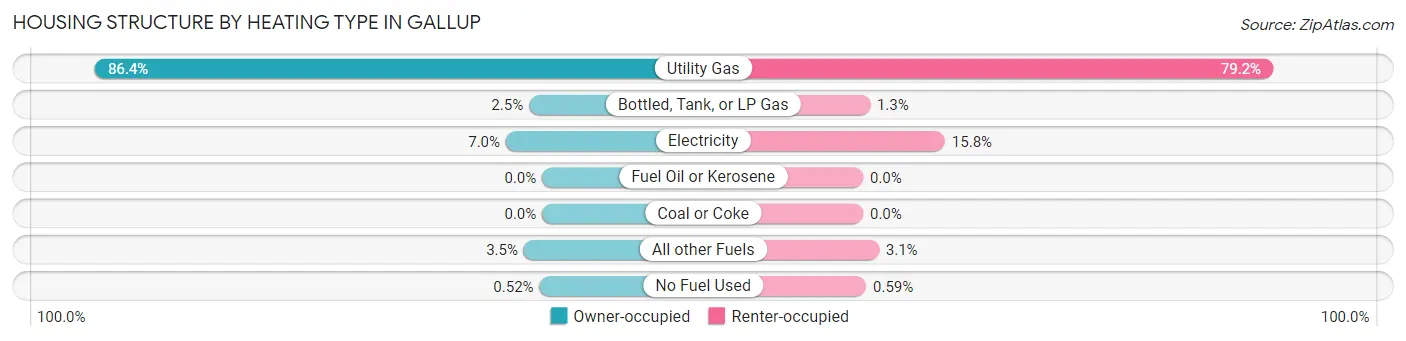
| Heating Type | Owner-occupied | Renter-occupied |
| Utility Gas | 3,343 (86.4%) | 2,548 (79.2%) |
| Bottled, Tank, or LP Gas | 98 (2.5%) | 43 (1.3%) |
| Electricity | 271 (7.0%) | 509 (15.8%) |
| Fuel Oil or Kerosene | 0 (0.0%) | 0 (0.0%) |
| Coal or Coke | 0 (0.0%) | 0 (0.0%) |
| All other Fuels | 137 (3.5%) | 98 (3.0%) |
| No Fuel Used | 20 (0.5%) | 19 (0.6%) |
| Total | 3,869 (100.0%) | 3,217 (100.0%) |
Household Vehicle Usage in Gallup
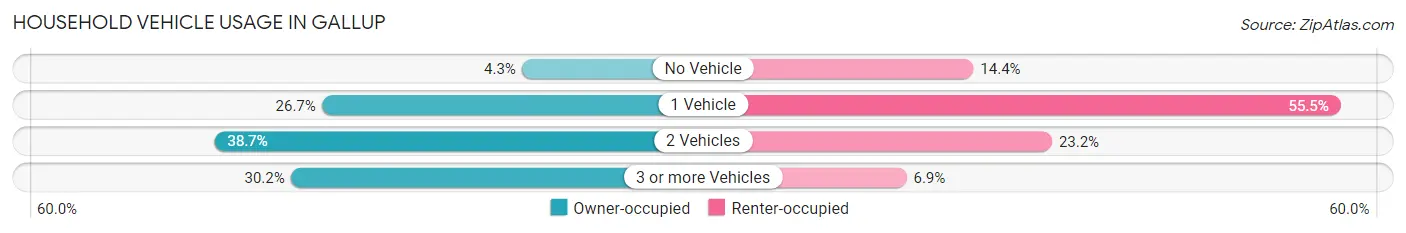
| Vehicles per Household | Owner-occupied | Renter-occupied |
| No Vehicle | 167 (4.3%) | 463 (14.4%) |
| 1 Vehicle | 1,034 (26.7%) | 1,786 (55.5%) |
| 2 Vehicles | 1,499 (38.7%) | 746 (23.2%) |
| 3 or more Vehicles | 1,169 (30.2%) | 222 (6.9%) |
| Total | 3,869 (100.0%) | 3,217 (100.0%) |
Real Estate & Mortgages in Gallup
Real Estate and Mortgage Overview in Gallup
| Characteristic | Without Mortgage | With Mortgage |
| Housing Units | 1,807 | 2,062 |
| Median Property Value | $119,100 | $164,100 |
| Median Household Income | $54,402 | $298 |
| Monthly Housing Costs | $388 | $54 |
| Real Estate Taxes | $1,328 | $326 |
Property Value by Mortgage Status in Gallup
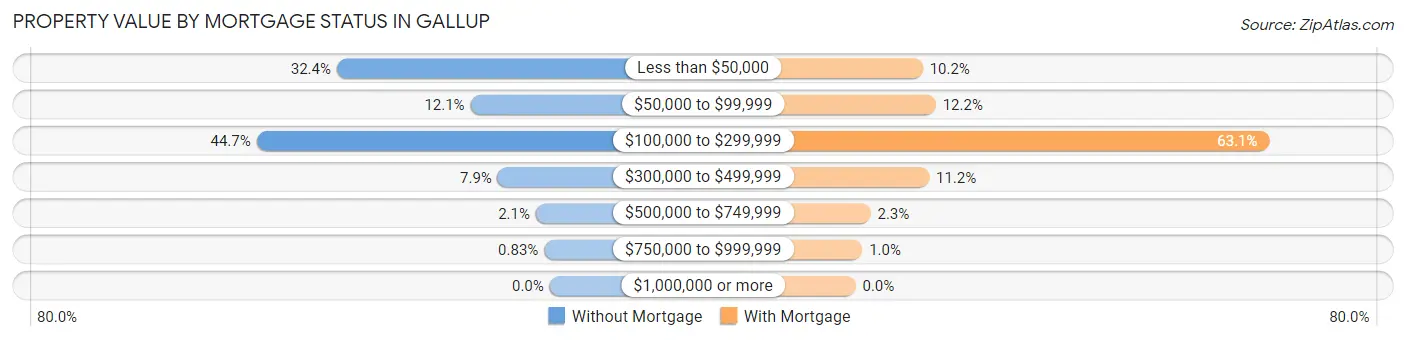
| Property Value | Without Mortgage | With Mortgage |
| Less than $50,000 | 586 (32.4%) | 211 (10.2%) |
| $50,000 to $99,999 | 218 (12.1%) | 252 (12.2%) |
| $100,000 to $299,999 | 807 (44.7%) | 1,300 (63.0%) |
| $300,000 to $499,999 | 143 (7.9%) | 231 (11.2%) |
| $500,000 to $749,999 | 38 (2.1%) | 47 (2.3%) |
| $750,000 to $999,999 | 15 (0.8%) | 21 (1.0%) |
| $1,000,000 or more | 0 (0.0%) | 0 (0.0%) |
| Total | 1,807 (100.0%) | 2,062 (100.0%) |
Household Income by Mortgage Status in Gallup
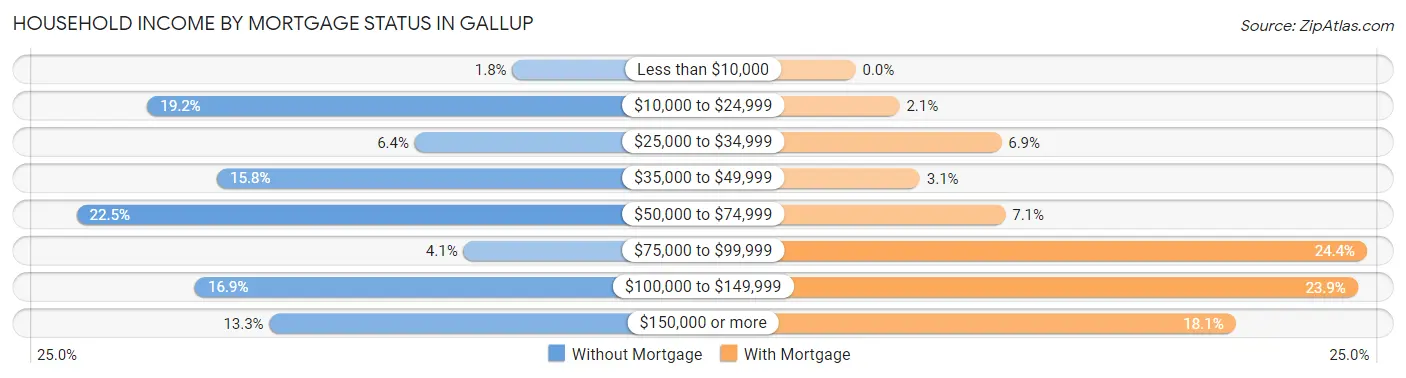
| Household Income | Without Mortgage | With Mortgage |
| Less than $10,000 | 32 (1.8%) | 0 (0.0%) |
| $10,000 to $24,999 | 346 (19.2%) | 43 (2.1%) |
| $25,000 to $34,999 | 116 (6.4%) | 143 (6.9%) |
| $35,000 to $49,999 | 286 (15.8%) | 63 (3.1%) |
| $50,000 to $74,999 | 407 (22.5%) | 147 (7.1%) |
| $75,000 to $99,999 | 74 (4.1%) | 502 (24.3%) |
| $100,000 to $149,999 | 305 (16.9%) | 493 (23.9%) |
| $150,000 or more | 241 (13.3%) | 373 (18.1%) |
| Total | 1,807 (100.0%) | 2,062 (100.0%) |
Property Value to Household Income Ratio in Gallup
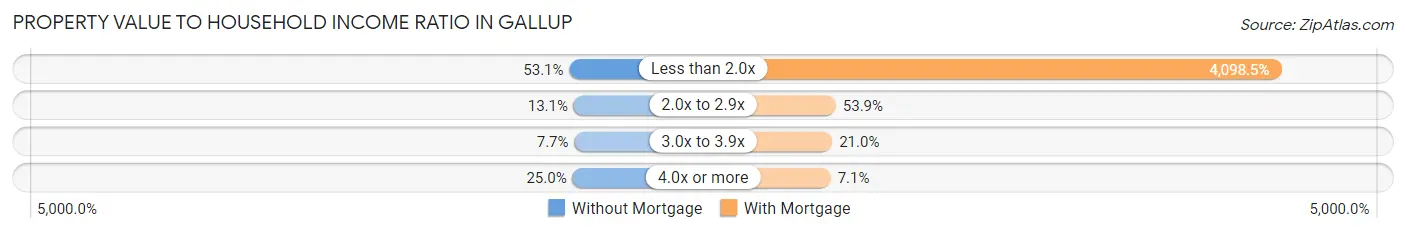
| Value-to-Income Ratio | Without Mortgage | With Mortgage |
| Less than 2.0x | 960 (53.1%) | 84,511 (4,098.5%) |
| 2.0x to 2.9x | 237 (13.1%) | 1,111 (53.9%) |
| 3.0x to 3.9x | 139 (7.7%) | 432 (20.9%) |
| 4.0x or more | 451 (25.0%) | 147 (7.1%) |
| Total | 1,807 (100.0%) | 2,062 (100.0%) |
Real Estate Taxes by Mortgage Status in Gallup
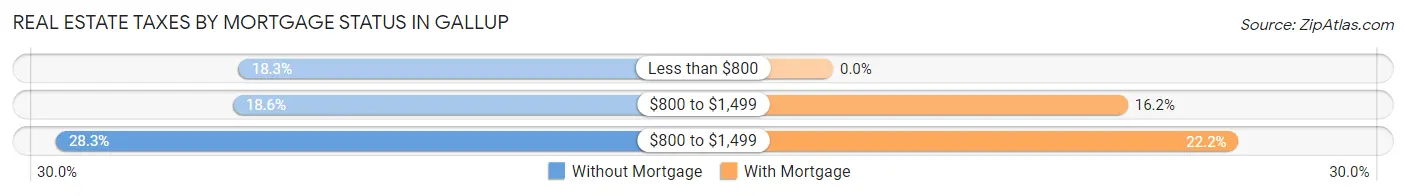
| Property Taxes | Without Mortgage | With Mortgage |
| Less than $800 | 330 (18.3%) | 0 (0.0%) |
| $800 to $1,499 | 336 (18.6%) | 333 (16.2%) |
| $800 to $1,499 | 511 (28.3%) | 458 (22.2%) |
| Total | 1,807 (100.0%) | 2,062 (100.0%) |
Health & Disability in Gallup
Health Insurance Coverage by Age in Gallup
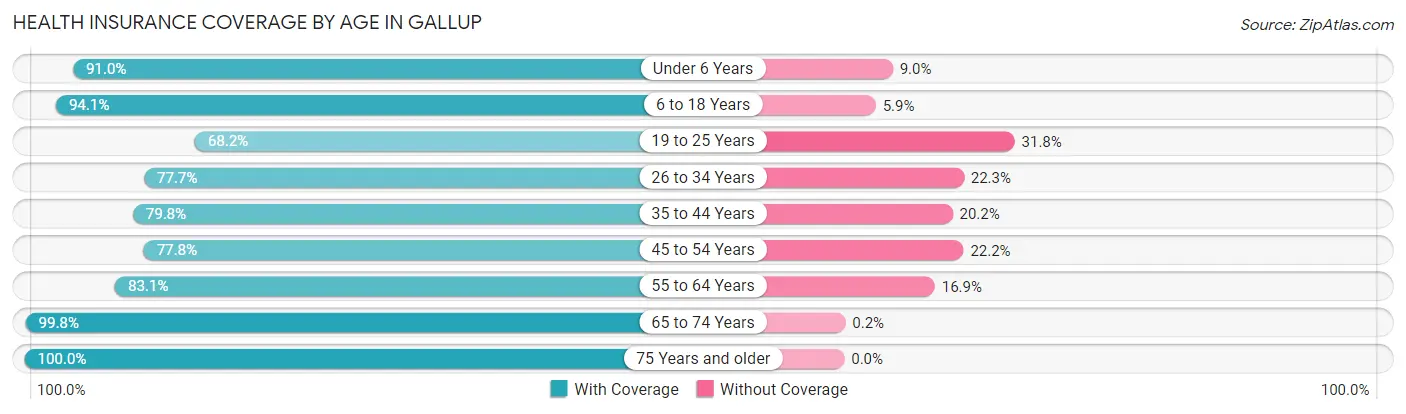
| Age Bracket | With Coverage | Without Coverage |
| Under 6 Years | 1,693 (91.0%) | 168 (9.0%) |
| 6 to 18 Years | 4,671 (94.1%) | 291 (5.9%) |
| 19 to 25 Years | 1,141 (68.2%) | 531 (31.8%) |
| 26 to 34 Years | 2,044 (77.7%) | 586 (22.3%) |
| 35 to 44 Years | 2,400 (79.8%) | 607 (20.2%) |
| 45 to 54 Years | 1,673 (77.8%) | 478 (22.2%) |
| 55 to 64 Years | 1,694 (83.1%) | 344 (16.9%) |
| 65 to 74 Years | 1,975 (99.8%) | 4 (0.2%) |
| 75 Years and older | 1,051 (100.0%) | 0 (0.0%) |
| Total | 18,342 (85.9%) | 3,009 (14.1%) |
Health Insurance Coverage by Citizenship Status in Gallup
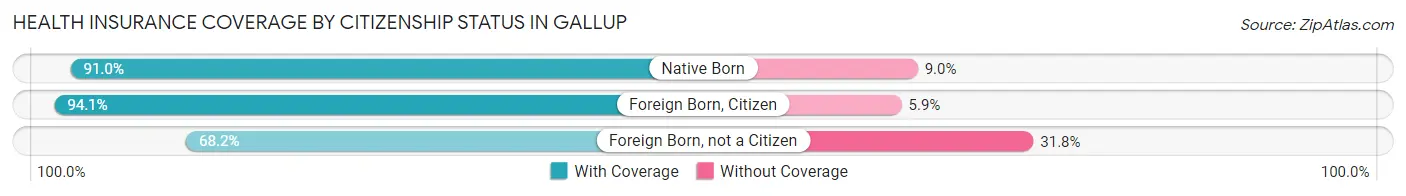
| Citizenship Status | With Coverage | Without Coverage |
| Native Born | 1,693 (91.0%) | 168 (9.0%) |
| Foreign Born, Citizen | 4,671 (94.1%) | 291 (5.9%) |
| Foreign Born, not a Citizen | 1,141 (68.2%) | 531 (31.8%) |
Health Insurance Coverage by Household Income in Gallup
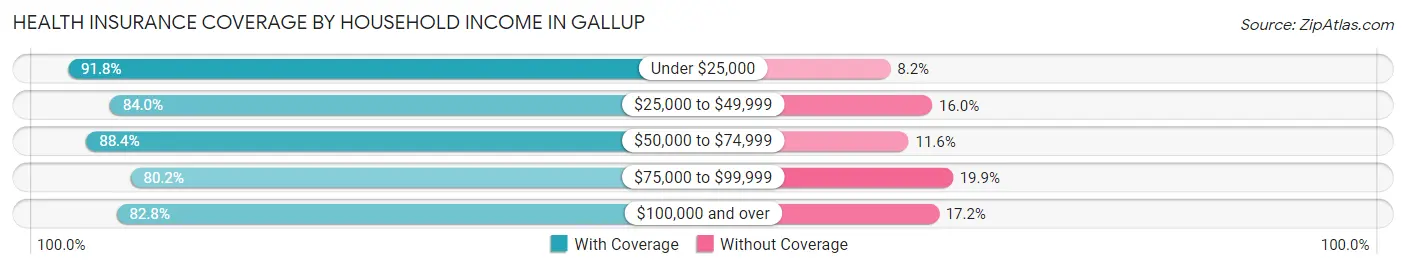
| Household Income | With Coverage | Without Coverage |
| Under $25,000 | 4,061 (91.8%) | 361 (8.2%) |
| $25,000 to $49,999 | 2,909 (84.0%) | 553 (16.0%) |
| $50,000 to $74,999 | 4,150 (88.4%) | 543 (11.6%) |
| $75,000 to $99,999 | 2,164 (80.1%) | 536 (19.9%) |
| $100,000 and over | 4,796 (82.8%) | 998 (17.2%) |
Public vs Private Health Insurance Coverage by Age in Gallup
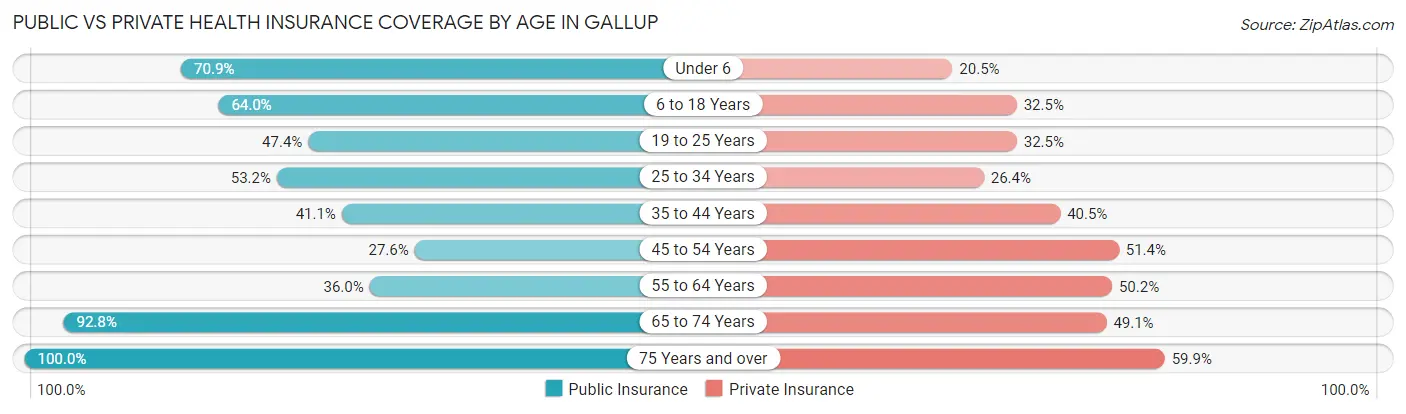
| Age Bracket | Public Insurance | Private Insurance |
| Under 6 | 1,320 (70.9%) | 382 (20.5%) |
| 6 to 18 Years | 3,176 (64.0%) | 1,611 (32.5%) |
| 19 to 25 Years | 792 (47.4%) | 543 (32.5%) |
| 25 to 34 Years | 1,399 (53.2%) | 693 (26.4%) |
| 35 to 44 Years | 1,237 (41.1%) | 1,219 (40.5%) |
| 45 to 54 Years | 594 (27.6%) | 1,106 (51.4%) |
| 55 to 64 Years | 733 (36.0%) | 1,022 (50.1%) |
| 65 to 74 Years | 1,836 (92.8%) | 972 (49.1%) |
| 75 Years and over | 1,051 (100.0%) | 630 (59.9%) |
| Total | 12,138 (56.9%) | 8,178 (38.3%) |
Disability Status by Sex by Age in Gallup
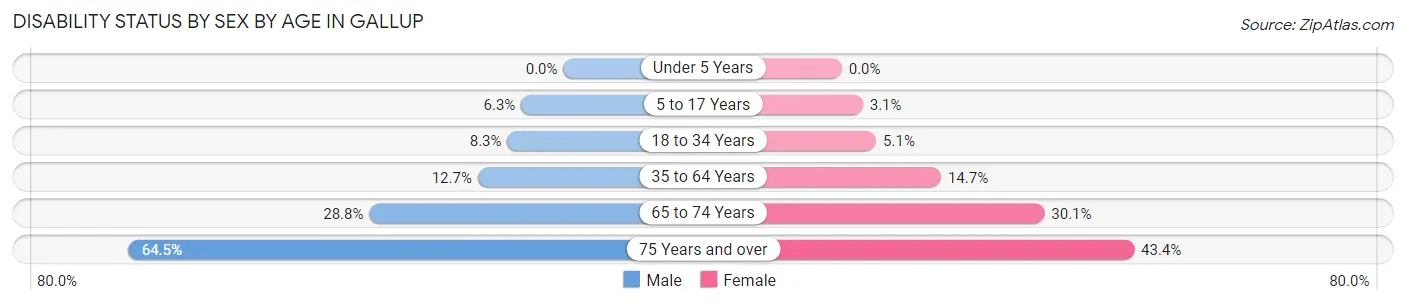
| Age Bracket | Male | Female |
| Under 5 Years | 0 (0.0%) | 0 (0.0%) |
| 5 to 17 Years | 168 (6.3%) | 78 (3.1%) |
| 18 to 34 Years | 193 (8.3%) | 115 (5.1%) |
| 35 to 64 Years | 435 (12.7%) | 556 (14.7%) |
| 65 to 74 Years | 260 (28.8%) | 324 (30.1%) |
| 75 Years and over | 311 (64.5%) | 247 (43.4%) |
Disability Class by Sex by Age in Gallup
Disability Class: Hearing Difficulty
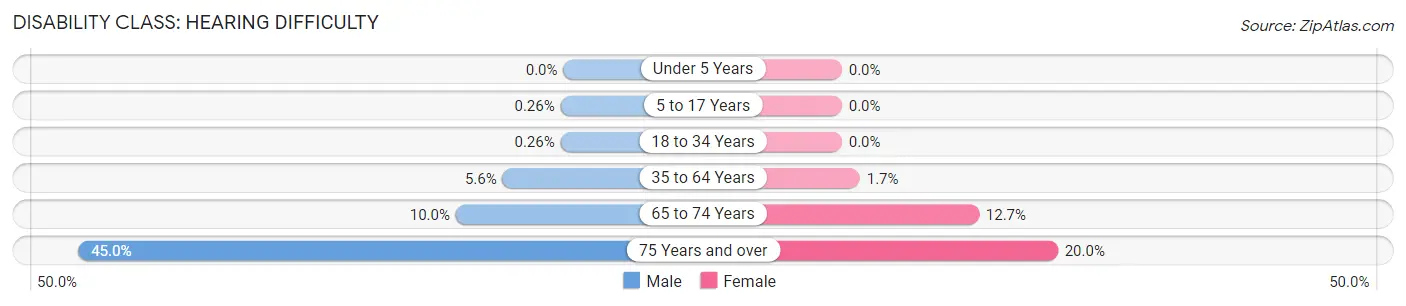
| Age Bracket | Male | Female |
| Under 5 Years | 0 (0.0%) | 0 (0.0%) |
| 5 to 17 Years | 7 (0.3%) | 0 (0.0%) |
| 18 to 34 Years | 6 (0.3%) | 0 (0.0%) |
| 35 to 64 Years | 193 (5.6%) | 63 (1.7%) |
| 65 to 74 Years | 90 (10.0%) | 137 (12.7%) |
| 75 Years and over | 217 (45.0%) | 114 (20.0%) |
Disability Class: Vision Difficulty
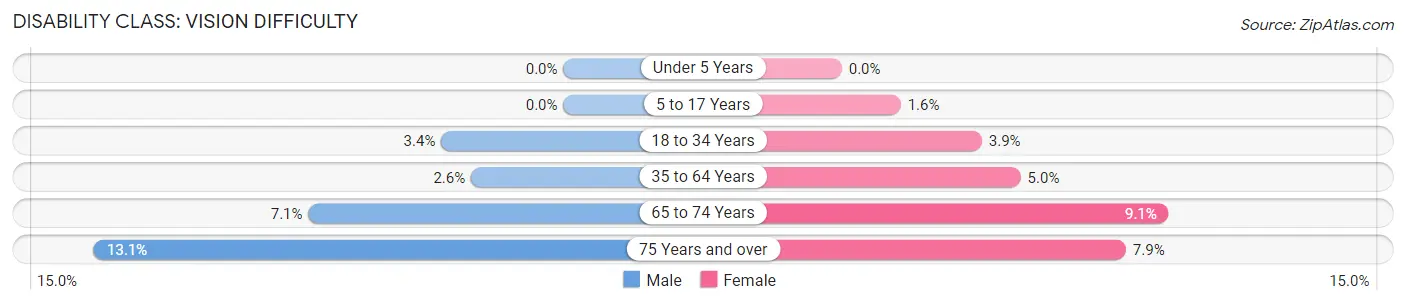
| Age Bracket | Male | Female |
| Under 5 Years | 0 (0.0%) | 0 (0.0%) |
| 5 to 17 Years | 0 (0.0%) | 41 (1.6%) |
| 18 to 34 Years | 79 (3.4%) | 88 (3.9%) |
| 35 to 64 Years | 88 (2.6%) | 188 (5.0%) |
| 65 to 74 Years | 64 (7.1%) | 98 (9.1%) |
| 75 Years and over | 63 (13.1%) | 45 (7.9%) |
Disability Class: Cognitive Difficulty
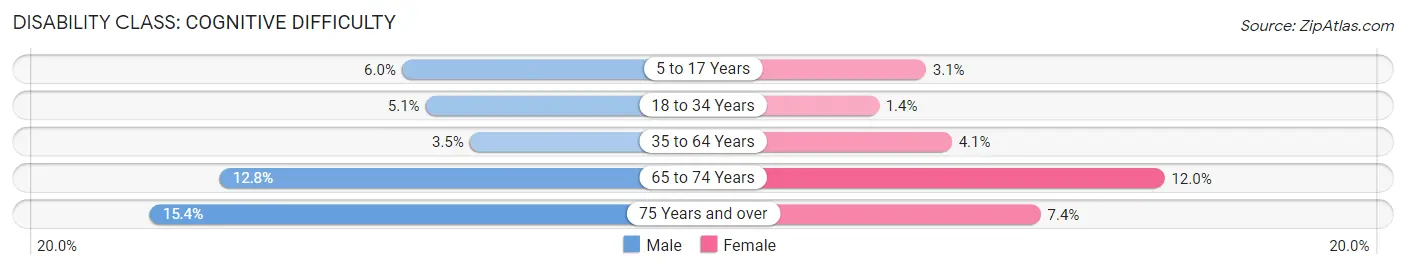
| Age Bracket | Male | Female |
| 5 to 17 Years | 161 (6.0%) | 78 (3.1%) |
| 18 to 34 Years | 119 (5.1%) | 31 (1.4%) |
| 35 to 64 Years | 119 (3.5%) | 154 (4.1%) |
| 65 to 74 Years | 115 (12.8%) | 129 (12.0%) |
| 75 Years and over | 74 (15.3%) | 42 (7.4%) |
Disability Class: Ambulatory Difficulty
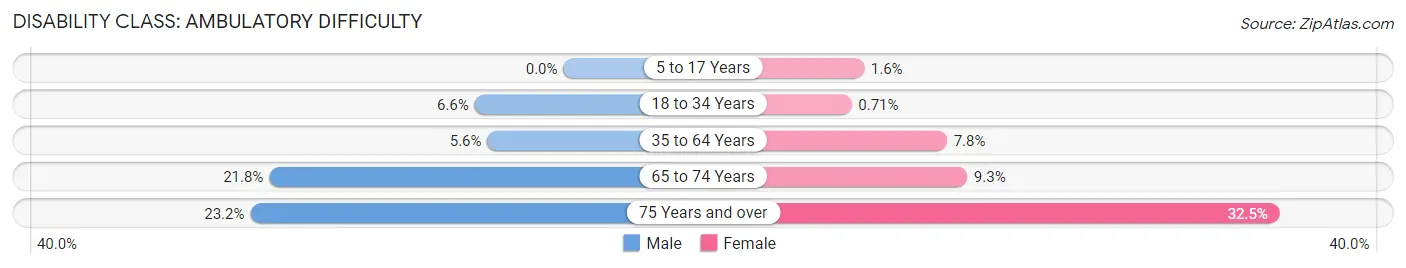
| Age Bracket | Male | Female |
| 5 to 17 Years | 0 (0.0%) | 41 (1.6%) |
| 18 to 34 Years | 153 (6.6%) | 16 (0.7%) |
| 35 to 64 Years | 193 (5.6%) | 294 (7.8%) |
| 65 to 74 Years | 197 (21.8%) | 100 (9.3%) |
| 75 Years and over | 112 (23.2%) | 185 (32.5%) |
Disability Class: Self-Care Difficulty
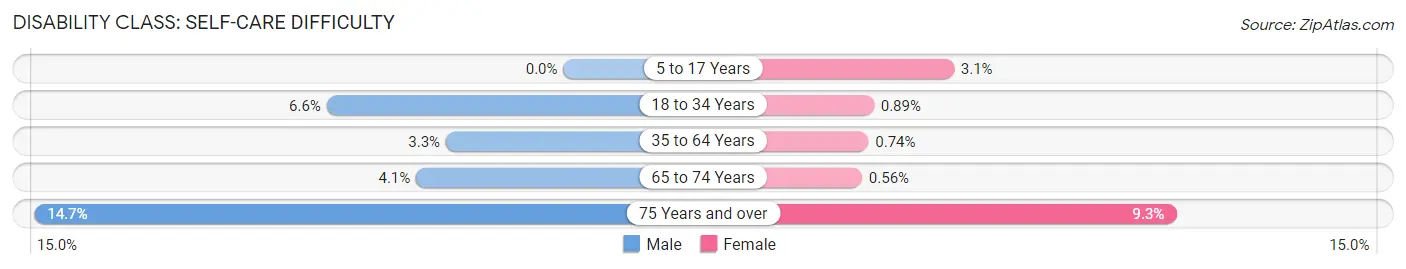
| Age Bracket | Male | Female |
| 5 to 17 Years | 0 (0.0%) | 78 (3.1%) |
| 18 to 34 Years | 153 (6.6%) | 20 (0.9%) |
| 35 to 64 Years | 112 (3.3%) | 28 (0.7%) |
| 65 to 74 Years | 37 (4.1%) | 6 (0.6%) |
| 75 Years and over | 71 (14.7%) | 53 (9.3%) |
Technology Access in Gallup
Computing Device Access in Gallup
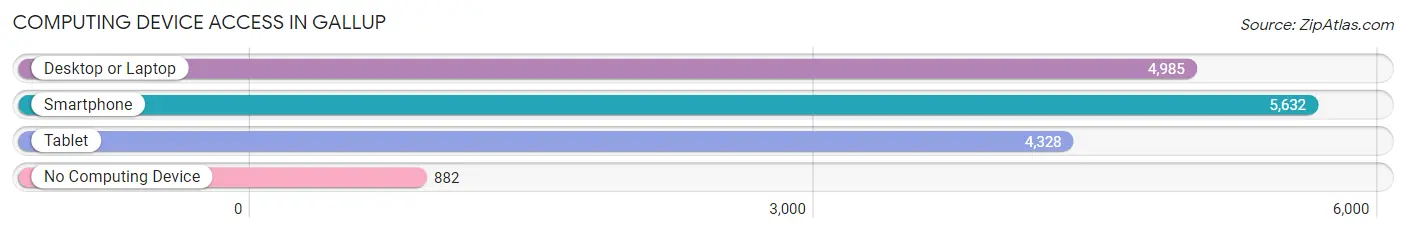
| Device Type | # Households | % Households |
| Desktop or Laptop | 4,985 | 70.4% |
| Smartphone | 5,632 | 79.5% |
| Tablet | 4,328 | 61.1% |
| No Computing Device | 882 | 12.4% |
| Total | 7,086 | 100.0% |
Internet Access in Gallup
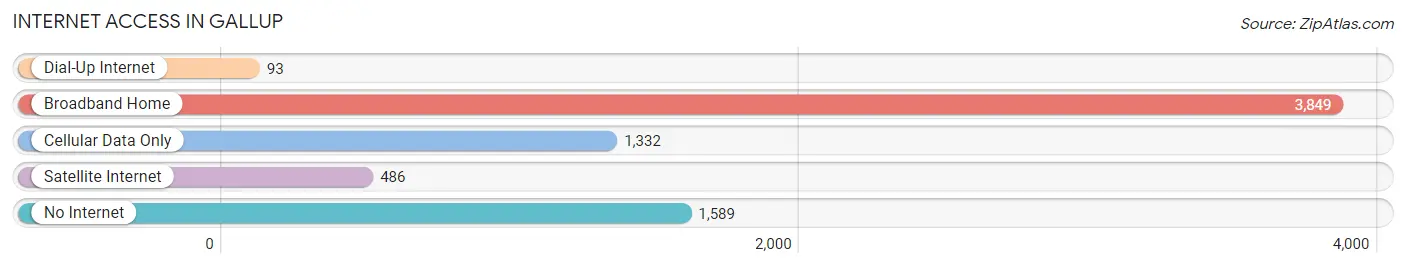
| Internet Type | # Households | % Households |
| Dial-Up Internet | 93 | 1.3% |
| Broadband Home | 3,849 | 54.3% |
| Cellular Data Only | 1,332 | 18.8% |
| Satellite Internet | 486 | 6.9% |
| No Internet | 1,589 | 22.4% |
| Total | 7,086 | 100.0% |
Gallup Summary
Gallup, New Mexico is a city located in McKinley County in the northwestern part of the state. It is the county seat and the most populous city in the county. The city is situated on the historic Route 66 and is known as the “Heart of Indian Country” due to its proximity to the Navajo Nation and other Native American tribes. The city has a population of 21,678 as of the 2010 census, making it the eighth-largest city in New Mexico.
History
Gallup was founded in 1881 as a railroad town by brothers David and Louis Gallup, who were railroad surveyors. The city was named after David Gallup, who was the first postmaster of the town. The city quickly grew as a trading post for the Navajo and other Native American tribes in the area. In the early 1900s, Gallup became a major stop on the famous Route 66, which ran from Chicago to Los Angeles. The city was also a major stop for the Santa Fe Railroad.
Geography
Gallup is located in the northwestern part of New Mexico, in McKinley County. It is situated at an elevation of 6,400 feet above sea level. The city is located on the historic Route 66 and is surrounded by the Navajo Nation and other Native American tribes. The city is located near the Chuska Mountains and the Zuni Mountains. The city is also located near the Continental Divide and the Rio Grande.
Economy
Gallup’s economy is largely based on tourism, as the city is a major stop on the historic Route 66. The city is also home to several large businesses, including the Gallup-McKinley County Schools, the Gallup-McKinley County Hospital, and the Gallup-McKinley County Airport. The city is also home to several large retail stores, including Walmart, Kmart, and Target.
Demographics
As of the 2010 census, Gallup had a population of 21,678. The racial makeup of the city was 57.3% White, 37.2% Native American, 1.2% Asian, 0.7% African American, 0.2% Pacific Islander, and 3.4% from other races. The median household income was $30,912, and the median family income was $35,912. The per capita income was $15,912.
Conclusion
Gallup, New Mexico is a city located in McKinley County in the northwestern part of the state. It is the county seat and the most populous city in the county. The city is situated on the historic Route 66 and is known as the “Heart of Indian Country” due to its proximity to the Navajo Nation and other Native American tribes. The city has a population of 21,678 as of the 2010 census, making it the eighth-largest city in New Mexico. The city’s economy is largely based on tourism, as it is a major stop on the historic Route 66. The city is also home to several large businesses, including the Gallup-McKinley County Schools, the Gallup-McKinley County Hospital, and the Gallup-McKinley County Airport. The racial makeup of the city was 57.3% White, 37.2% Native American, 1.2% Asian, 0.7% African American, 0.2% Pacific Islander, and 3.4% from other races. The median household income was $30,912, and the median family income was $35,912. The per capita income was $15,912.
Common Questions
What is Per Capita Income in Gallup?
Per Capita income in Gallup is $25,241.
What is the Median Family Income in Gallup?
Median Family Income in Gallup is $63,577.
What is the Median Household income in Gallup?
Median Household Income in Gallup is $58,358.
What is Income or Wage Gap in Gallup?
Income or Wage Gap in Gallup is 11.9%.
Women in Gallup earn 88.1 cents for every dollar earned by a man.
What is Family Income Deficit in Gallup?
Family Income Deficit in Gallup is $15,720.
Families that are below poverty line in Gallup earn $15,720 less on average than the poverty threshold level.
What is Inequality or Gini Index in Gallup?
Inequality or Gini Index in Gallup is 0.47.
What is the Total Population of Gallup?
Total Population of Gallup is 21,672.
What is the Total Male Population of Gallup?
Total Male Population of Gallup is 10,696.
What is the Total Female Population of Gallup?
Total Female Population of Gallup is 10,976.
What is the Ratio of Males per 100 Females in Gallup?
There are 97.45 Males per 100 Females in Gallup.
What is the Ratio of Females per 100 Males in Gallup?
There are 102.62 Females per 100 Males in Gallup.
What is the Median Population Age in Gallup?
Median Population Age in Gallup is 34.1 Years.
What is the Average Family Size in Gallup
Average Family Size in Gallup is 3.7 People.
What is the Average Household Size in Gallup
Average Household Size in Gallup is 3.0 People.
How Large is the Labor Force in Gallup?
There are 8,750 People in the Labor Forcein in Gallup.
What is the Percentage of People in the Labor Force in Gallup?
54.7% of People are in the Labor Force in Gallup.
What is the Unemployment Rate in Gallup?
Unemployment Rate in Gallup is 3.9%.