Hobbs, NM Map & Demographics
Hobbs Map
Hobbs Overview
$30,660
PER CAPITA INCOME
$76,593
AVG FAMILY INCOME
$63,804
AVG HOUSEHOLD INCOME
46.7%
WAGE / INCOME GAP [ % ]
53.3¢/ $1
WAGE / INCOME GAP [ $ ]
$12,173
FAMILY INCOME DEFICIT
0.49
INEQUALITY / GINI INDEX
39,782
TOTAL POPULATION
20,898
MALE POPULATION
18,884
FEMALE POPULATION
110.67
MALES / 100 FEMALES
90.36
FEMALES / 100 MALES
30.8
MEDIAN AGE
3.4
AVG FAMILY SIZE
2.8
AVG HOUSEHOLD SIZE
18,729
LABOR FORCE [ PEOPLE ]
63.8%
PERCENT IN LABOR FORCE
7.4%
UNEMPLOYMENT RATE
Income in Hobbs
Income Overview in Hobbs
Per Capita Income in Hobbs is $30,660, while median incomes of families and households are $76,593 and $63,804 respectively.
| Characteristic | Number | Measure |
| Per Capita Income | 39,782 | $30,660 |
| Median Family Income | 8,957 | $76,593 |
| Mean Family Income | 8,957 | $102,784 |
| Median Household Income | 13,533 | $63,804 |
| Mean Household Income | 13,533 | $88,552 |
| Income Deficit | 8,957 | $12,173 |
| Wage / Income Gap (%) | 39,782 | 46.67% |
| Wage / Income Gap ($) | 39,782 | 53.33¢ per $1 |
| Gini / Inequality Index | 39,782 | 0.49 |
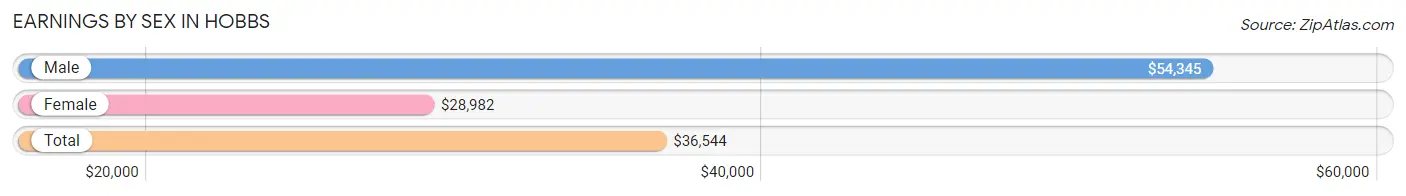
Earnings by Sex in Hobbs
Average Earnings in Hobbs are $36,544, $54,345 for men and $28,982 for women, a difference of 46.7%.
| Sex | Number | Average Earnings |
| Male | 11,196 (57.3%) | $54,345 |
| Female | 8,339 (42.7%) | $28,982 |
| Total | 19,535 (100.0%) | $36,544 |
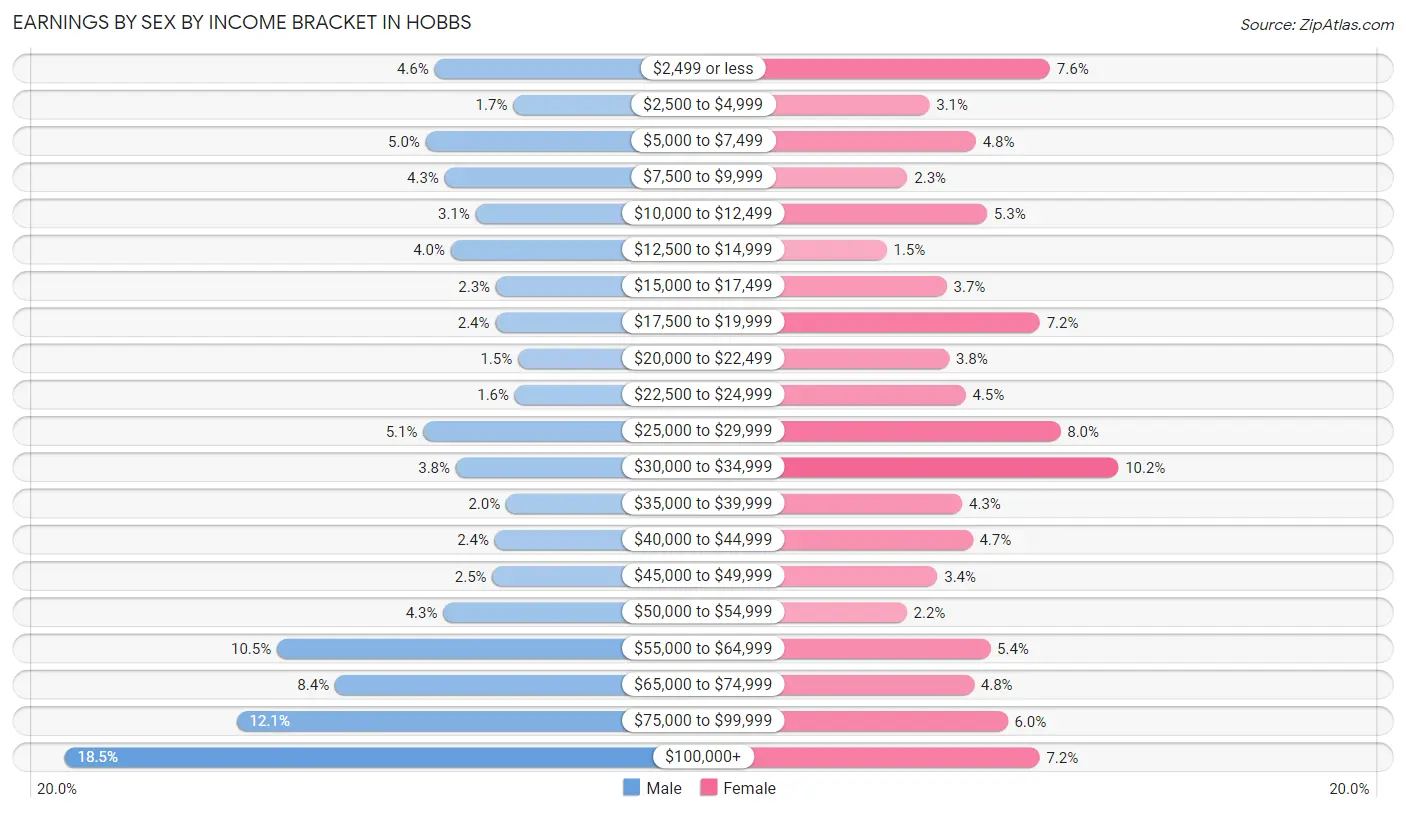
Earnings by Sex by Income Bracket in Hobbs
The most common earnings brackets in Hobbs are $100,000+ for men (2,071 | 18.5%) and $30,000 to $34,999 for women (848 | 10.2%).
| Income | Male | Female |
| $2,499 or less | 519 (4.6%) | 635 (7.6%) |
| $2,500 to $4,999 | 189 (1.7%) | 258 (3.1%) |
| $5,000 to $7,499 | 557 (5.0%) | 403 (4.8%) |
| $7,500 to $9,999 | 477 (4.3%) | 189 (2.3%) |
| $10,000 to $12,499 | 347 (3.1%) | 438 (5.2%) |
| $12,500 to $14,999 | 451 (4.0%) | 124 (1.5%) |
| $15,000 to $17,499 | 262 (2.3%) | 312 (3.7%) |
| $17,500 to $19,999 | 264 (2.4%) | 603 (7.2%) |
| $20,000 to $22,499 | 169 (1.5%) | 319 (3.8%) |
| $22,500 to $24,999 | 182 (1.6%) | 371 (4.4%) |
| $25,000 to $29,999 | 567 (5.1%) | 667 (8.0%) |
| $30,000 to $34,999 | 430 (3.8%) | 848 (10.2%) |
| $35,000 to $39,999 | 219 (2.0%) | 360 (4.3%) |
| $40,000 to $44,999 | 267 (2.4%) | 393 (4.7%) |
| $45,000 to $49,999 | 276 (2.5%) | 283 (3.4%) |
| $50,000 to $54,999 | 482 (4.3%) | 187 (2.2%) |
| $55,000 to $64,999 | 1,180 (10.5%) | 448 (5.4%) |
| $65,000 to $74,999 | 937 (8.4%) | 397 (4.8%) |
| $75,000 to $99,999 | 1,350 (12.1%) | 502 (6.0%) |
| $100,000+ | 2,071 (18.5%) | 602 (7.2%) |
| Total | 11,196 (100.0%) | 8,339 (100.0%) |
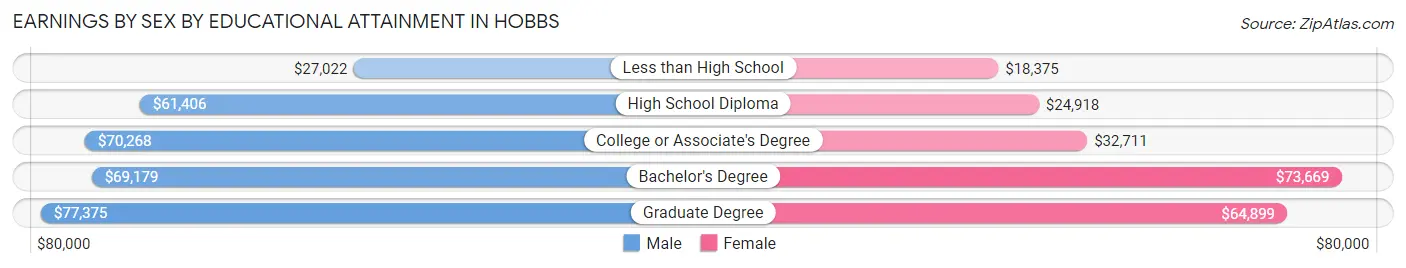
Earnings by Sex by Educational Attainment in Hobbs
Average earnings in Hobbs are $61,672 for men and $33,809 for women, a difference of 45.2%. Men with an educational attainment of graduate degree enjoy the highest average annual earnings of $77,375, while those with less than high school education earn the least with $27,022. Women with an educational attainment of bachelor's degree earn the most with the average annual earnings of $73,669, while those with less than high school education have the smallest earnings of $18,375.
| Educational Attainment | Male Income | Female Income |
| Less than High School | $27,022 | $18,375 |
| High School Diploma | $61,406 | $24,918 |
| College or Associate's Degree | $70,268 | $32,711 |
| Bachelor's Degree | $69,179 | $73,669 |
| Graduate Degree | $77,375 | $64,899 |
| Total | $61,672 | $33,809 |
Family Income in Hobbs
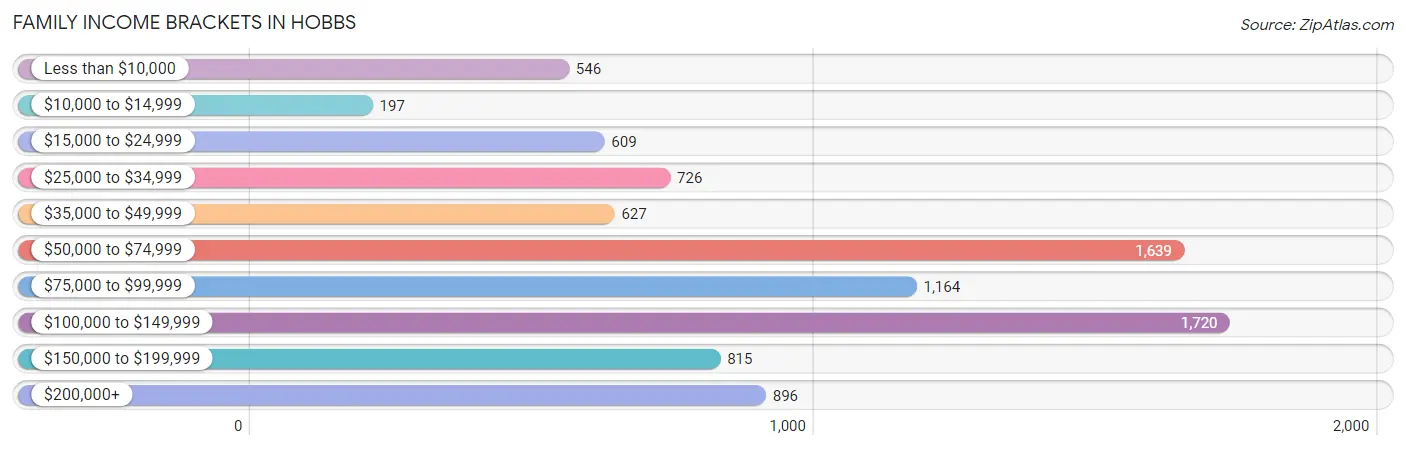
Family Income Brackets in Hobbs
According to the Hobbs family income data, there are 1,720 families falling into the $100,000 to $149,999 income range, which is the most common income bracket and makes up 19.2% of all families. Conversely, the $10,000 to $14,999 income bracket is the least frequent group with only 197 families (2.2%) belonging to this category.
| Income Bracket | # Families | % Families |
| Less than $10,000 | 546 | 6.1% |
| $10,000 to $14,999 | 197 | 2.2% |
| $15,000 to $24,999 | 609 | 6.8% |
| $25,000 to $34,999 | 726 | 8.1% |
| $35,000 to $49,999 | 627 | 7.0% |
| $50,000 to $74,999 | 1,639 | 18.3% |
| $75,000 to $99,999 | 1,164 | 13.0% |
| $100,000 to $149,999 | 1,720 | 19.2% |
| $150,000 to $199,999 | 815 | 9.1% |
| $200,000+ | 896 | 10.0% |
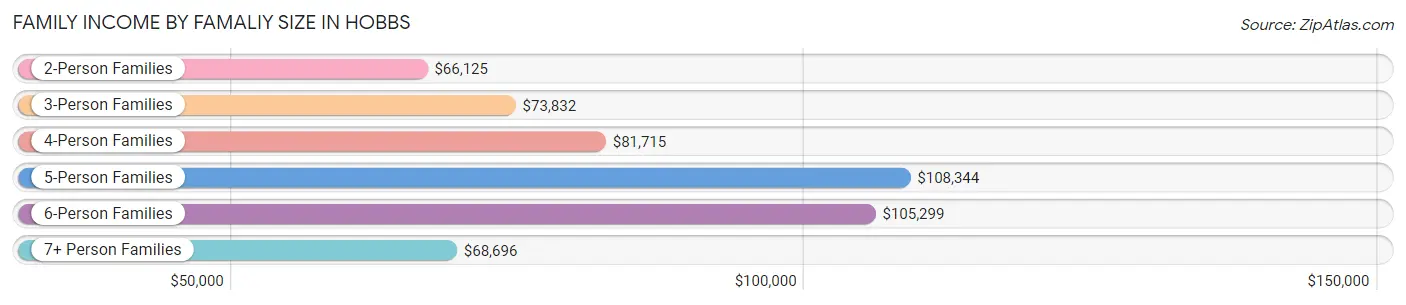
Family Income by Famaliy Size in Hobbs
5-person families (1,059 | 11.8%) account for the highest median family income in Hobbs with $108,344 per family, while 2-person families (3,611 | 40.3%) have the highest median income of $33,062 per family member.
| Income Bracket | # Families | Median Income |
| 2-Person Families | 3,611 (40.3%) | $66,125 |
| 3-Person Families | 1,593 (17.8%) | $73,832 |
| 4-Person Families | 2,095 (23.4%) | $81,715 |
| 5-Person Families | 1,059 (11.8%) | $108,344 |
| 6-Person Families | 399 (4.4%) | $105,299 |
| 7+ Person Families | 200 (2.2%) | $68,696 |
| Total | 8,957 (100.0%) | $76,593 |
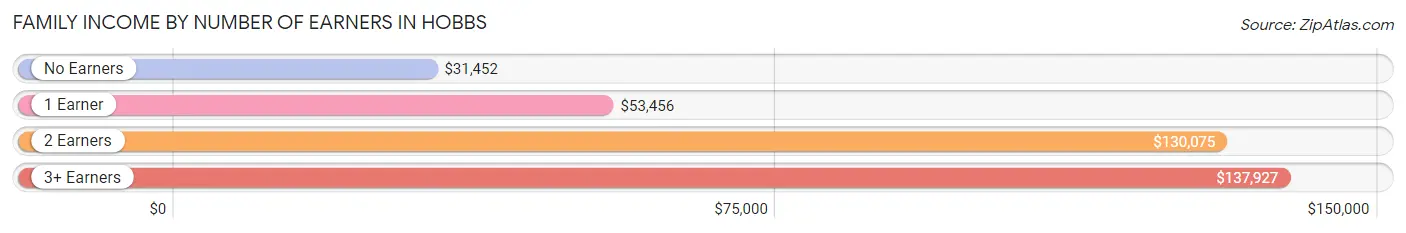
Family Income by Number of Earners in Hobbs
The median family income in Hobbs is $76,593, with families comprising 3+ earners (1,132) having the highest median family income of $137,927, while families with no earners (916) have the lowest median family income of $31,452, accounting for 12.6% and 10.2% of families, respectively.
| Number of Earners | # Families | Median Income |
| No Earners | 916 (10.2%) | $31,452 |
| 1 Earner | 3,839 (42.9%) | $53,456 |
| 2 Earners | 3,070 (34.3%) | $130,075 |
| 3+ Earners | 1,132 (12.6%) | $137,927 |
| Total | 8,957 (100.0%) | $76,593 |
Household Income in Hobbs
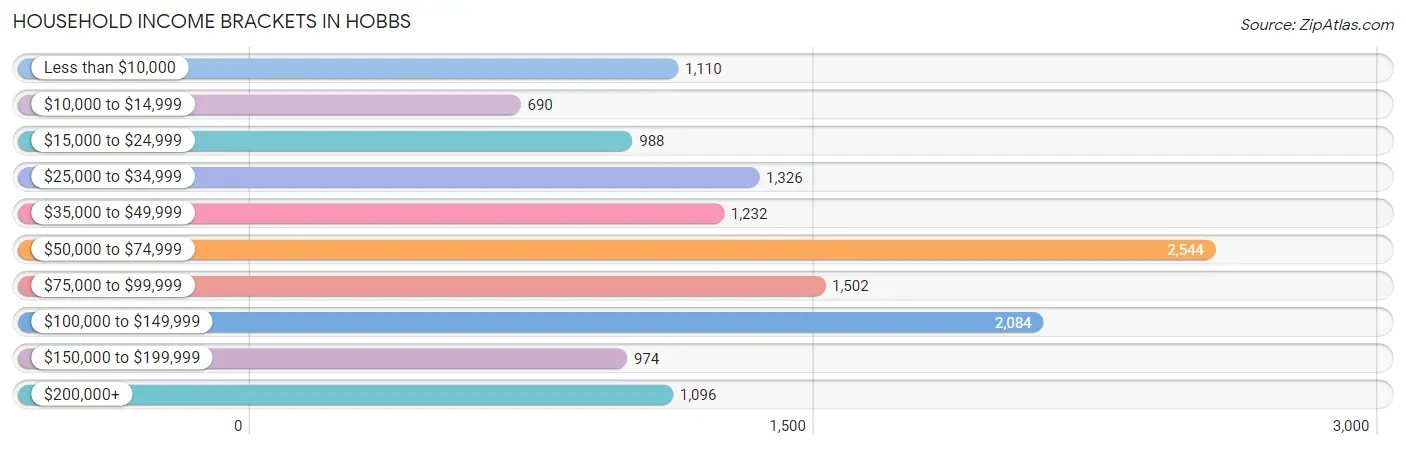
Household Income Brackets in Hobbs
With 2,544 households falling in the category, the $50,000 to $74,999 income range is the most frequent in Hobbs, accounting for 18.8% of all households. In contrast, only 690 households (5.1%) fall into the $10,000 to $14,999 income bracket, making it the least populous group.
| Income Bracket | # Households | % Households |
| Less than $10,000 | 1,110 | 8.2% |
| $10,000 to $14,999 | 690 | 5.1% |
| $15,000 to $24,999 | 988 | 7.3% |
| $25,000 to $34,999 | 1,326 | 9.8% |
| $35,000 to $49,999 | 1,232 | 9.1% |
| $50,000 to $74,999 | 2,544 | 18.8% |
| $75,000 to $99,999 | 1,502 | 11.1% |
| $100,000 to $149,999 | 2,084 | 15.4% |
| $150,000 to $199,999 | 974 | 7.2% |
| $200,000+ | 1,096 | 8.1% |
Household Income by Householder Age in Hobbs
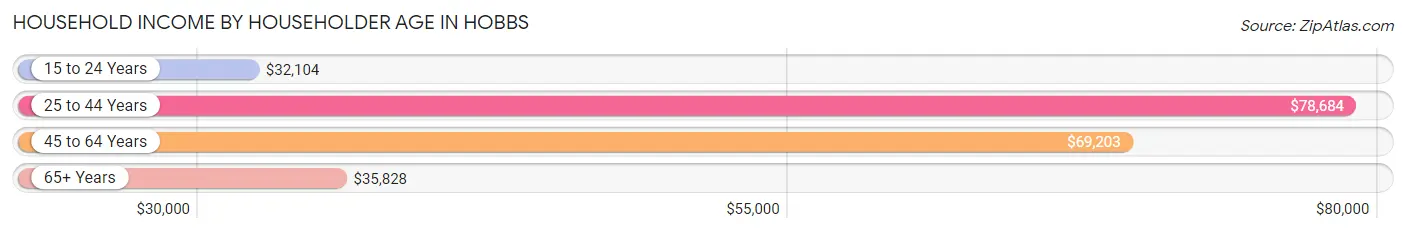
The median household income in Hobbs is $63,804, with the highest median household income of $78,684 found in the 25 to 44 years age bracket for the primary householder. A total of 4,874 households (36.0%) fall into this category. Meanwhile, the 15 to 24 years age bracket for the primary householder has the lowest median household income of $32,104, with 1,251 households (9.2%) in this group.
| Income Bracket | # Households | Median Income |
| 15 to 24 Years | 1,251 (9.2%) | $32,104 |
| 25 to 44 Years | 4,874 (36.0%) | $78,684 |
| 45 to 64 Years | 5,047 (37.3%) | $69,203 |
| 65+ Years | 2,361 (17.4%) | $35,828 |
| Total | 13,533 (100.0%) | $63,804 |
Poverty in Hobbs
Income Below Poverty by Sex and Age in Hobbs
With 17.4% poverty level for males and 20.5% for females among the residents of Hobbs, 5 year old males and 5 year old females are the most vulnerable to poverty, with 247 males (56.0%) and 176 females (62.6%) in their respective age groups living below the poverty level.
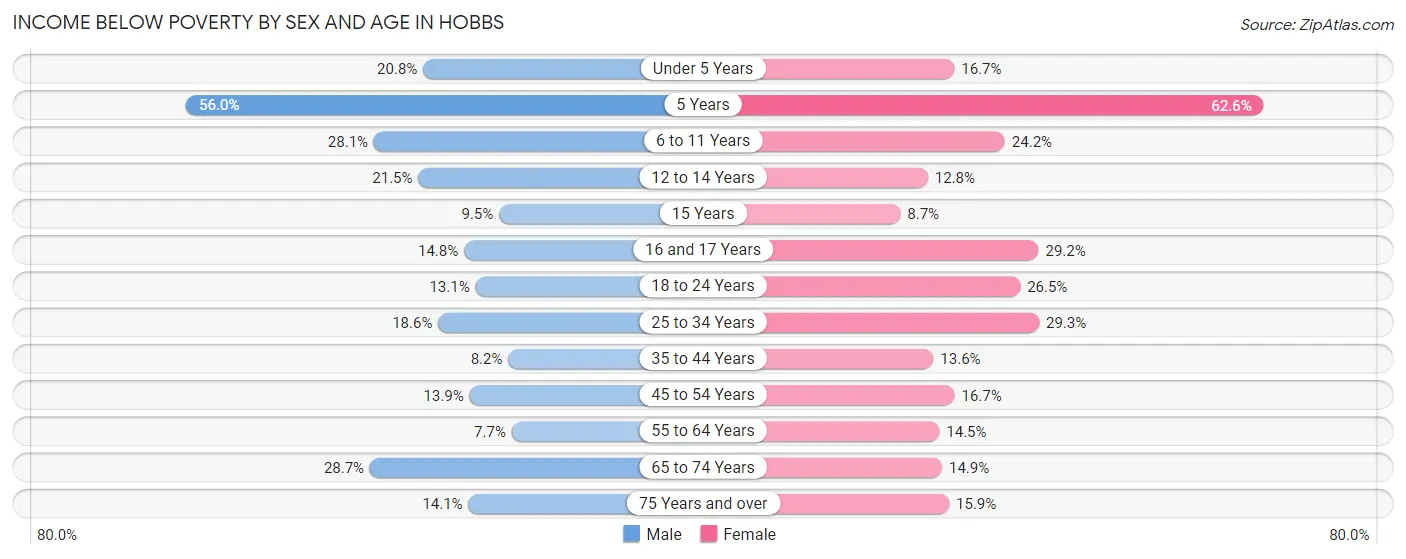
| Age Bracket | Male | Female |
| Under 5 Years | 365 (20.8%) | 238 (16.7%) |
| 5 Years | 247 (56.0%) | 176 (62.6%) |
| 6 to 11 Years | 564 (28.1%) | 489 (24.2%) |
| 12 to 14 Years | 174 (21.5%) | 96 (12.8%) |
| 15 Years | 37 (9.5%) | 32 (8.7%) |
| 16 and 17 Years | 99 (14.7%) | 187 (29.2%) |
| 18 to 24 Years | 305 (13.1%) | 538 (26.5%) |
| 25 to 34 Years | 537 (18.6%) | 790 (29.3%) |
| 35 to 44 Years | 204 (8.2%) | 273 (13.6%) |
| 45 to 54 Years | 286 (13.9%) | 356 (16.7%) |
| 55 to 64 Years | 134 (7.7%) | 304 (14.5%) |
| 65 to 74 Years | 349 (28.7%) | 204 (14.9%) |
| 75 Years and over | 92 (14.1%) | 113 (15.9%) |
| Total | 3,393 (17.4%) | 3,796 (20.5%) |
Income Above Poverty by Sex and Age in Hobbs
According to the poverty statistics in Hobbs, males aged 55 to 64 years and females aged 15 years are the age groups that are most secure financially, with 92.3% of males and 91.3% of females in these age groups living above the poverty line.
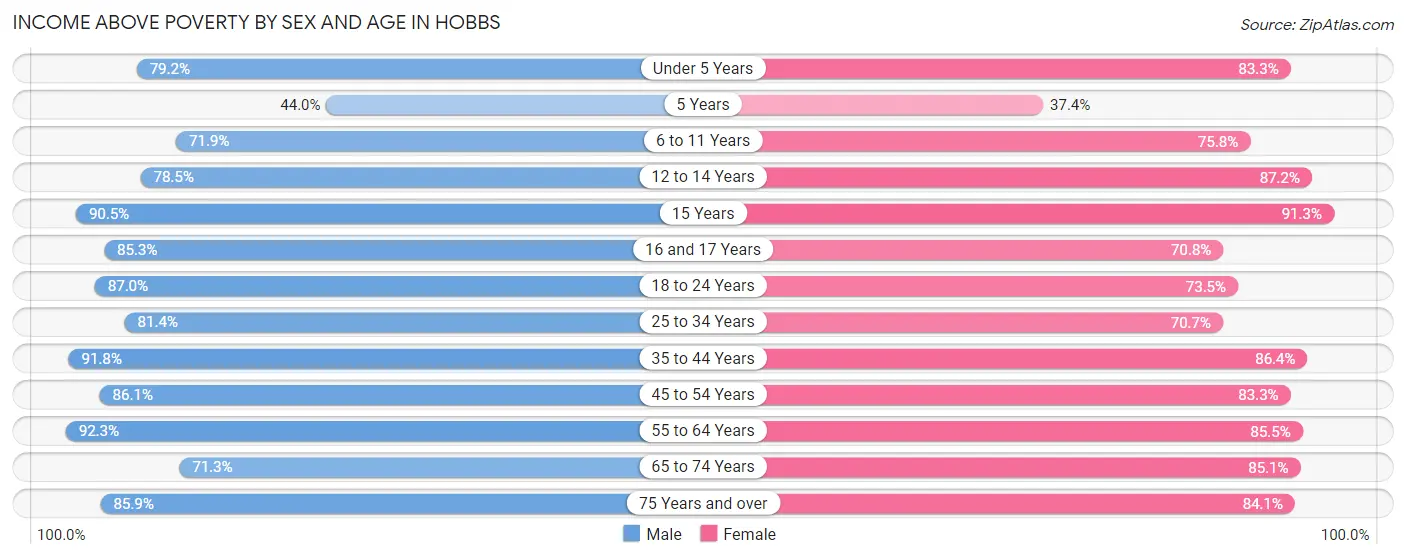
| Age Bracket | Male | Female |
| Under 5 Years | 1,388 (79.2%) | 1,186 (83.3%) |
| 5 Years | 194 (44.0%) | 105 (37.4%) |
| 6 to 11 Years | 1,441 (71.9%) | 1,530 (75.8%) |
| 12 to 14 Years | 634 (78.5%) | 656 (87.2%) |
| 15 Years | 351 (90.5%) | 336 (91.3%) |
| 16 and 17 Years | 572 (85.3%) | 453 (70.8%) |
| 18 to 24 Years | 2,032 (87.0%) | 1,493 (73.5%) |
| 25 to 34 Years | 2,353 (81.4%) | 1,907 (70.7%) |
| 35 to 44 Years | 2,293 (91.8%) | 1,735 (86.4%) |
| 45 to 54 Years | 1,766 (86.1%) | 1,771 (83.3%) |
| 55 to 64 Years | 1,616 (92.3%) | 1,794 (85.5%) |
| 65 to 74 Years | 866 (71.3%) | 1,166 (85.1%) |
| 75 Years and over | 561 (85.9%) | 597 (84.1%) |
| Total | 16,067 (82.6%) | 14,729 (79.5%) |
Income Below Poverty Among Married-Couple Families in Hobbs
The poverty statistics for married-couple families in Hobbs show that 4.8% or 276 of the total 5,702 families live below the poverty line. Families with no children have the highest poverty rate of 5.6%, comprising of 165 families. On the other hand, families with 5 or more children have the lowest poverty rate of 0.0%, which includes 0 families.
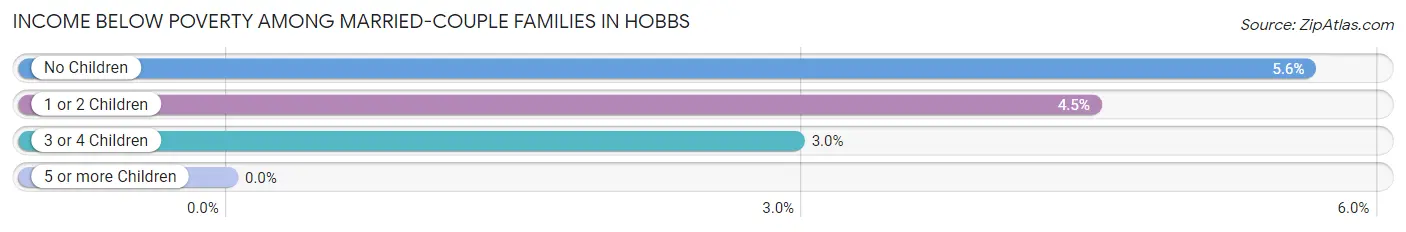
| Children | Above Poverty | Below Poverty |
| No Children | 2,764 (94.4%) | 165 (5.6%) |
| 1 or 2 Children | 1,885 (95.5%) | 89 (4.5%) |
| 3 or 4 Children | 722 (97.0%) | 22 (3.0%) |
| 5 or more Children | 55 (100.0%) | 0 (0.0%) |
| Total | 5,426 (95.2%) | 276 (4.8%) |
Income Below Poverty Among Single-Parent Households in Hobbs
According to the poverty data in Hobbs, 23.7% or 308 single-father households and 37.6% or 736 single-mother households are living below the poverty line. Among single-father households, those with 3 or 4 children have the highest poverty rate, with 198 households (50.6%) experiencing poverty. Likewise, among single-mother households, those with 5 or more children have the highest poverty rate, with 14 households (100.0%) falling below the poverty line.
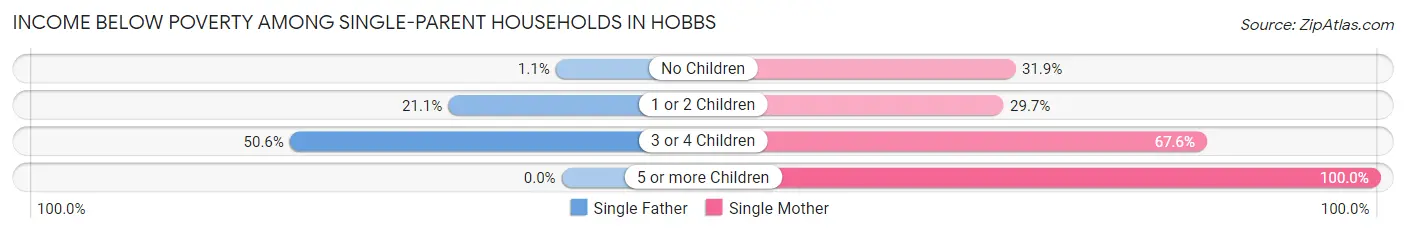
| Children | Single Father | Single Mother |
| No Children | 4 (1.1%) | 196 (31.9%) |
| 1 or 2 Children | 106 (21.1%) | 292 (29.7%) |
| 3 or 4 Children | 198 (50.6%) | 234 (67.6%) |
| 5 or more Children | 0 (0.0%) | 14 (100.0%) |
| Total | 308 (23.7%) | 736 (37.6%) |
Income Below Poverty Among Married-Couple vs Single-Parent Households in Hobbs
The poverty data for Hobbs shows that 276 of the married-couple family households (4.8%) and 1,044 of the single-parent households (32.1%) are living below the poverty level. Within the married-couple family households, those with no children have the highest poverty rate, with 165 households (5.6%) falling below the poverty line. Among the single-parent households, those with 3 or 4 children have the highest poverty rate, with 432 household (58.6%) living below poverty.
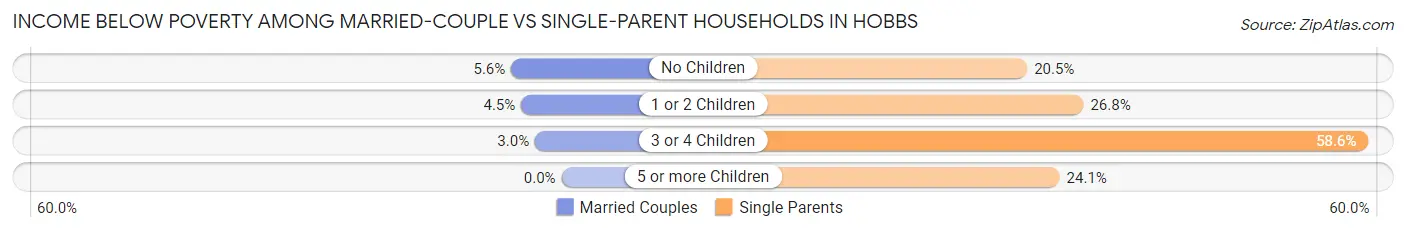
| Children | Married-Couple Families | Single-Parent Households |
| No Children | 165 (5.6%) | 200 (20.5%) |
| 1 or 2 Children | 89 (4.5%) | 398 (26.8%) |
| 3 or 4 Children | 22 (3.0%) | 432 (58.6%) |
| 5 or more Children | 0 (0.0%) | 14 (24.1%) |
| Total | 276 (4.8%) | 1,044 (32.1%) |
Race in Hobbs
The most populous races in Hobbs are Hispanic or Latino (24,983 | 62.8%), White / Caucasian (22,935 | 57.7%), and Two or more Races (10,081 | 25.3%).
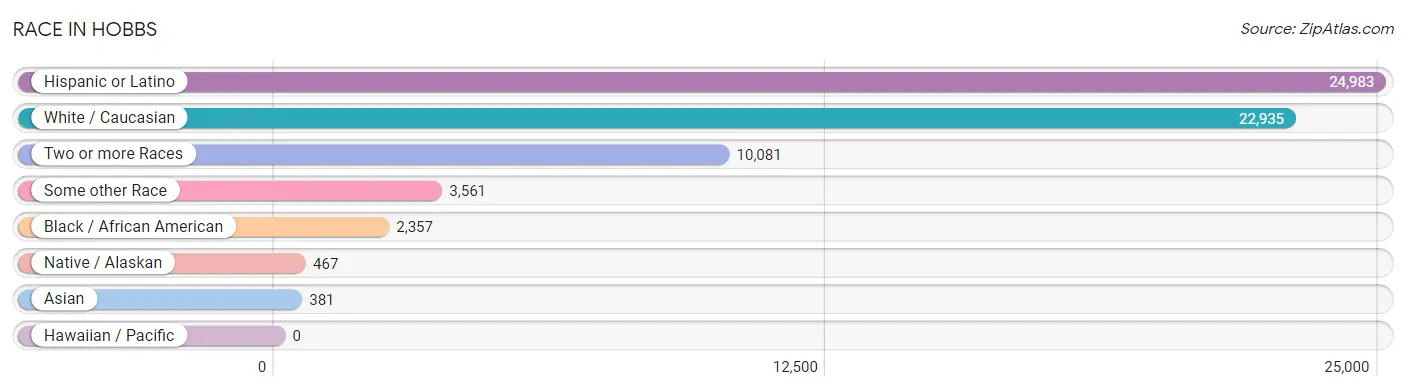
| Race | # Population | % Population |
| Asian | 381 | 1.0% |
| Black / African American | 2,357 | 5.9% |
| Hawaiian / Pacific | 0 | 0.0% |
| Hispanic or Latino | 24,983 | 62.8% |
| Native / Alaskan | 467 | 1.2% |
| White / Caucasian | 22,935 | 57.7% |
| Two or more Races | 10,081 | 25.3% |
| Some other Race | 3,561 | 8.9% |
| Total | 39,782 | 100.0% |
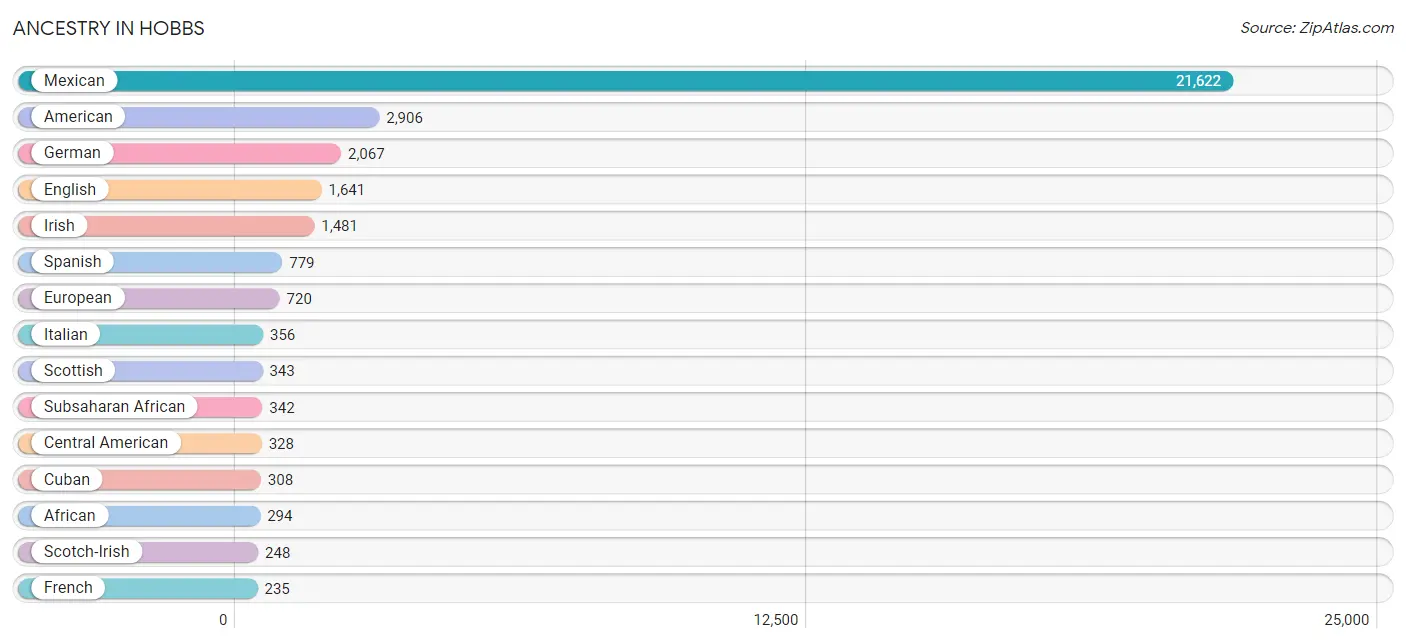
Ancestry in Hobbs
The most populous ancestries reported in Hobbs are Mexican (21,622 | 54.3%), American (2,906 | 7.3%), German (2,067 | 5.2%), English (1,641 | 4.1%), and Irish (1,481 | 3.7%), together accounting for 74.7% of all Hobbs residents.
| Ancestry | # Population | % Population |
| African | 294 | 0.7% |
| American | 2,906 | 7.3% |
| Apache | 10 | 0.0% |
| Arab | 38 | 0.1% |
| Belgian | 7 | 0.0% |
| British | 80 | 0.2% |
| Canadian | 29 | 0.1% |
| Celtic | 3 | 0.0% |
| Central American | 328 | 0.8% |
| Central American Indian | 7 | 0.0% |
| Cherokee | 147 | 0.4% |
| Chickasaw | 19 | 0.1% |
| Choctaw | 20 | 0.1% |
| Colombian | 54 | 0.1% |
| Creek | 8 | 0.0% |
| Cuban | 308 | 0.8% |
| Czech | 53 | 0.1% |
| Danish | 82 | 0.2% |
| Delaware | 21 | 0.1% |
| Dominican | 5 | 0.0% |
| Dutch | 100 | 0.3% |
| English | 1,641 | 4.1% |
| Ethiopian | 4 | 0.0% |
| European | 720 | 1.8% |
| Finnish | 16 | 0.0% |
| French | 235 | 0.6% |
| French Canadian | 51 | 0.1% |
| German | 2,067 | 5.2% |
| Greek | 15 | 0.0% |
| Guatemalan | 22 | 0.1% |
| Haitian | 21 | 0.1% |
| Honduran | 198 | 0.5% |
| Indian (Asian) | 1 | 0.0% |
| Irish | 1,481 | 3.7% |
| Italian | 356 | 0.9% |
| Kenyan | 8 | 0.0% |
| Kiowa | 8 | 0.0% |
| Korean | 133 | 0.3% |
| Lebanese | 38 | 0.1% |
| Mexican | 21,622 | 54.3% |
| Mexican American Indian | 42 | 0.1% |
| Navajo | 209 | 0.5% |
| Nicaraguan | 4 | 0.0% |
| Nigerian | 44 | 0.1% |
| Norwegian | 77 | 0.2% |
| Pakistani | 6 | 0.0% |
| Polish | 54 | 0.1% |
| Portuguese | 133 | 0.3% |
| Pueblo | 108 | 0.3% |
| Puerto Rican | 159 | 0.4% |
| Russian | 8 | 0.0% |
| Salvadoran | 104 | 0.3% |
| Scotch-Irish | 248 | 0.6% |
| Scottish | 343 | 0.9% |
| Sioux | 8 | 0.0% |
| South American | 54 | 0.1% |
| Spaniard | 37 | 0.1% |
| Spanish | 779 | 2.0% |
| Sri Lankan | 4 | 0.0% |
| Subsaharan African | 342 | 0.9% |
| Swedish | 32 | 0.1% |
| Swiss | 27 | 0.1% |
| Thai | 73 | 0.2% |
| Welsh | 53 | 0.1% | View All 64 Rows |
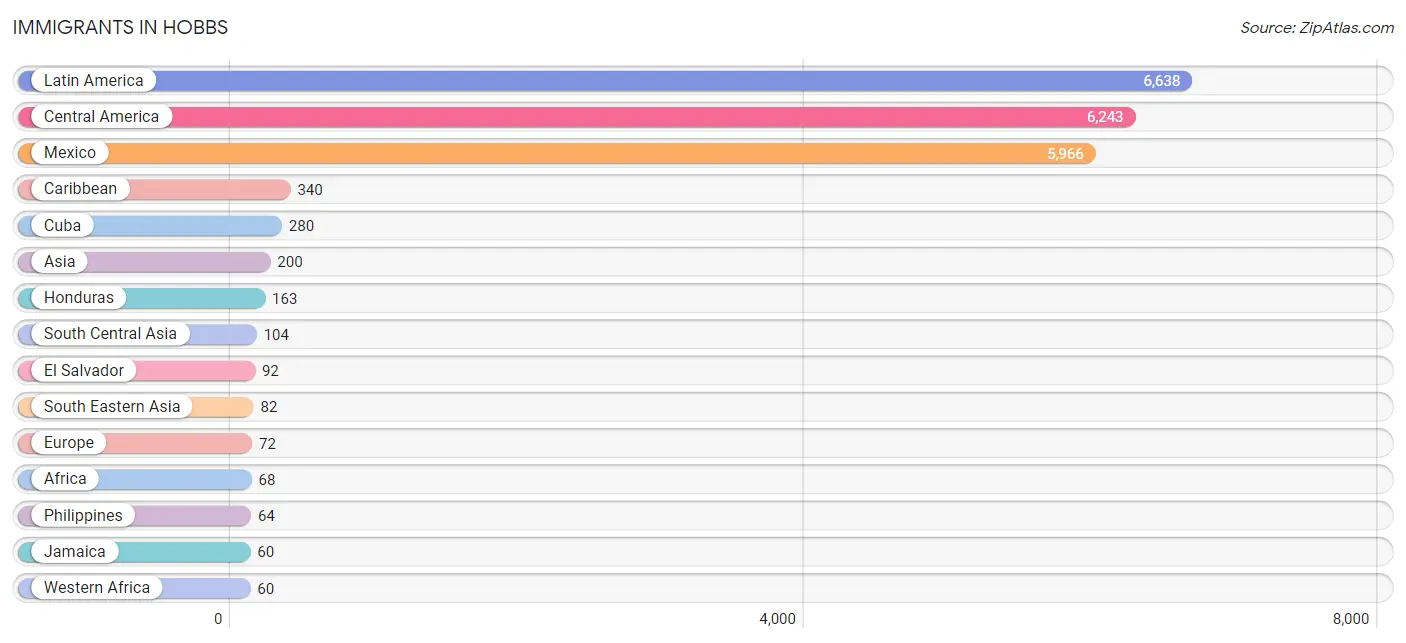
Immigrants in Hobbs
The most numerous immigrant groups reported in Hobbs came from Latin America (6,638 | 16.7%), Central America (6,243 | 15.7%), Mexico (5,966 | 15.0%), Caribbean (340 | 0.9%), and Cuba (280 | 0.7%), together accounting for 48.9% of all Hobbs residents.
| Immigration Origin | # Population | % Population |
| Africa | 68 | 0.2% |
| Asia | 200 | 0.5% |
| Brazil | 35 | 0.1% |
| Canada | 26 | 0.1% |
| Caribbean | 340 | 0.9% |
| Central America | 6,243 | 15.7% |
| China | 1 | 0.0% |
| Colombia | 20 | 0.1% |
| Cuba | 280 | 0.7% |
| Eastern Africa | 8 | 0.0% |
| Eastern Asia | 1 | 0.0% |
| El Salvador | 92 | 0.2% |
| Europe | 72 | 0.2% |
| France | 16 | 0.0% |
| Germany | 17 | 0.0% |
| Guatemala | 22 | 0.1% |
| Honduras | 163 | 0.4% |
| India | 31 | 0.1% |
| Jamaica | 60 | 0.2% |
| Kenya | 8 | 0.0% |
| Latin America | 6,638 | 16.7% |
| Lebanon | 13 | 0.0% |
| Mexico | 5,966 | 15.0% |
| Nepal | 43 | 0.1% |
| Nigeria | 44 | 0.1% |
| Northern Europe | 39 | 0.1% |
| Pakistan | 30 | 0.1% |
| Philippines | 64 | 0.2% |
| South America | 55 | 0.1% |
| South Central Asia | 104 | 0.3% |
| South Eastern Asia | 82 | 0.2% |
| Taiwan | 1 | 0.0% |
| Vietnam | 4 | 0.0% |
| Western Africa | 60 | 0.2% |
| Western Asia | 13 | 0.0% |
| Western Europe | 33 | 0.1% | View All 36 Rows |
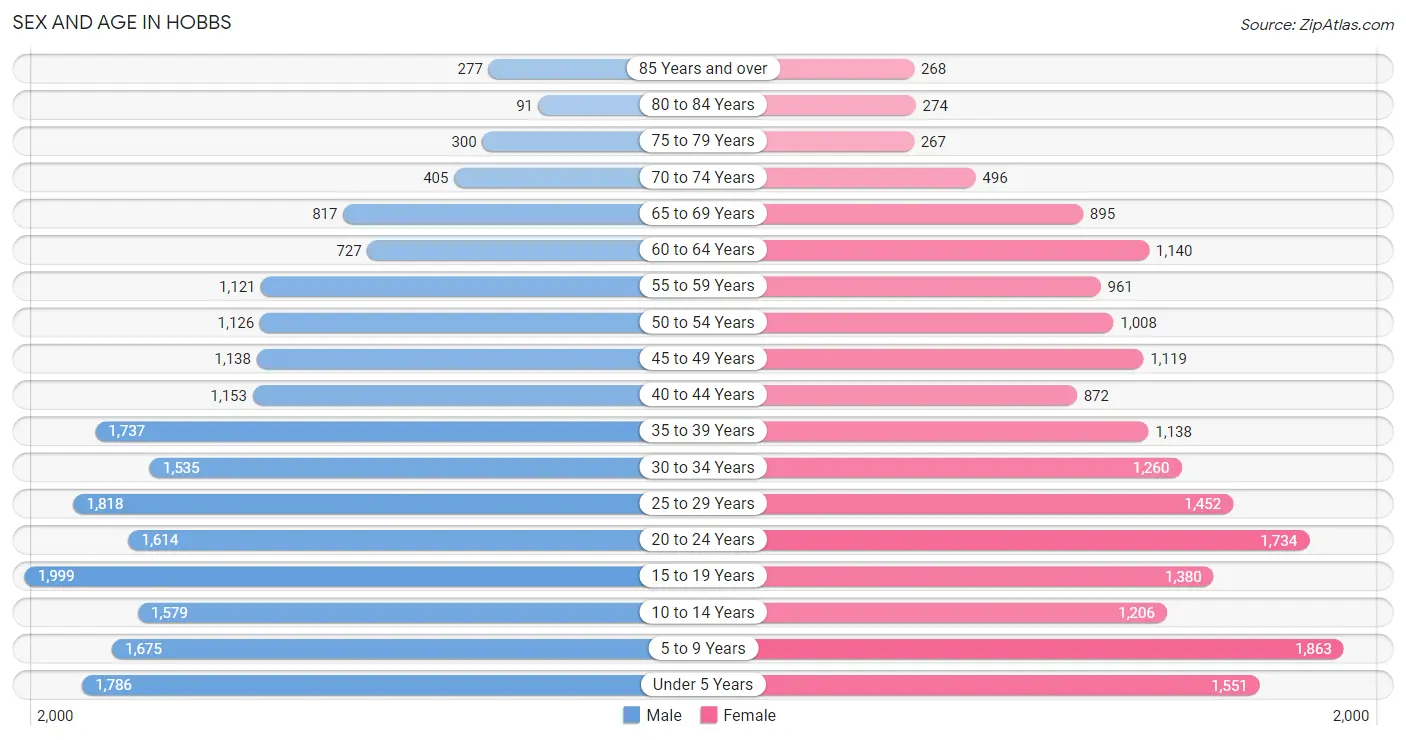
Sex and Age in Hobbs
Sex and Age in Hobbs
The most populous age groups in Hobbs are 15 to 19 Years (1,999 | 9.6%) for men and 5 to 9 Years (1,863 | 9.9%) for women.
| Age Bracket | Male | Female |
| Under 5 Years | 1,786 (8.6%) | 1,551 (8.2%) |
| 5 to 9 Years | 1,675 (8.0%) | 1,863 (9.9%) |
| 10 to 14 Years | 1,579 (7.6%) | 1,206 (6.4%) |
| 15 to 19 Years | 1,999 (9.6%) | 1,380 (7.3%) |
| 20 to 24 Years | 1,614 (7.7%) | 1,734 (9.2%) |
| 25 to 29 Years | 1,818 (8.7%) | 1,452 (7.7%) |
| 30 to 34 Years | 1,535 (7.3%) | 1,260 (6.7%) |
| 35 to 39 Years | 1,737 (8.3%) | 1,138 (6.0%) |
| 40 to 44 Years | 1,153 (5.5%) | 872 (4.6%) |
| 45 to 49 Years | 1,138 (5.4%) | 1,119 (5.9%) |
| 50 to 54 Years | 1,126 (5.4%) | 1,008 (5.3%) |
| 55 to 59 Years | 1,121 (5.4%) | 961 (5.1%) |
| 60 to 64 Years | 727 (3.5%) | 1,140 (6.0%) |
| 65 to 69 Years | 817 (3.9%) | 895 (4.7%) |
| 70 to 74 Years | 405 (1.9%) | 496 (2.6%) |
| 75 to 79 Years | 300 (1.4%) | 267 (1.4%) |
| 80 to 84 Years | 91 (0.4%) | 274 (1.5%) |
| 85 Years and over | 277 (1.3%) | 268 (1.4%) |
| Total | 20,898 (100.0%) | 18,884 (100.0%) |
Families and Households in Hobbs
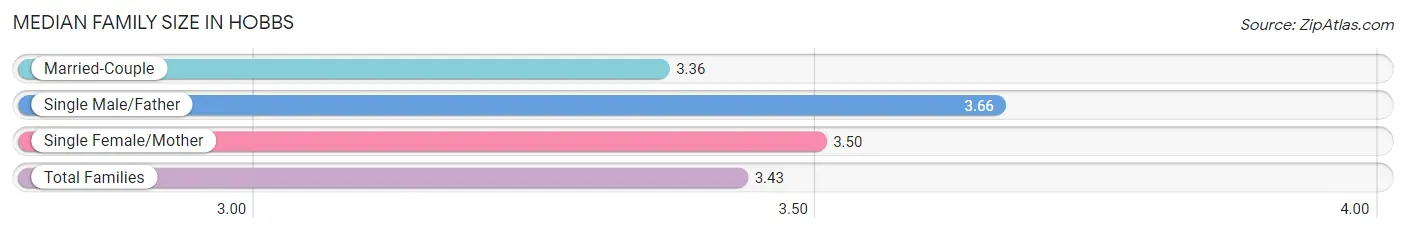
Median Family Size in Hobbs
The median family size in Hobbs is 3.43 persons per family, with single male/father families (1,298 | 14.5%) accounting for the largest median family size of 3.66 persons per family. On the other hand, married-couple families (5,702 | 63.7%) represent the smallest median family size with 3.36 persons per family.
| Family Type | # Families | Family Size |
| Married-Couple | 5,702 (63.7%) | 3.36 |
| Single Male/Father | 1,298 (14.5%) | 3.66 |
| Single Female/Mother | 1,957 (21.8%) | 3.50 |
| Total Families | 8,957 (100.0%) | 3.43 |
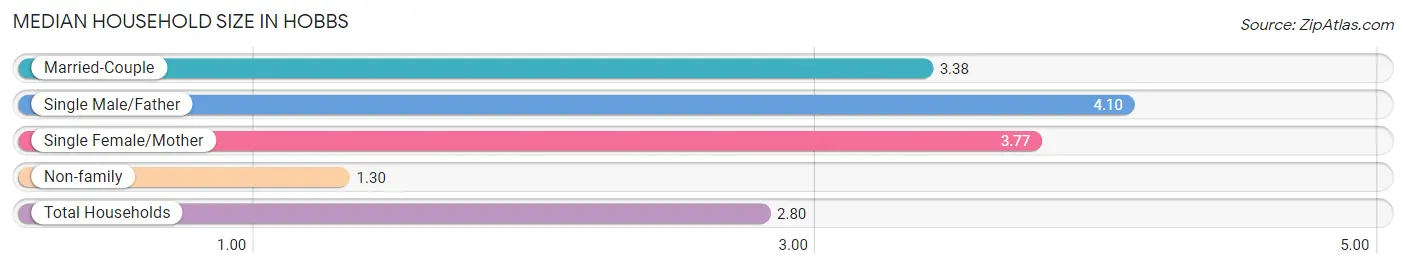
Median Household Size in Hobbs
The median household size in Hobbs is 2.80 persons per household, with single male/father households (1,298 | 9.6%) accounting for the largest median household size of 4.1 persons per household. non-family households (4,576 | 33.8%) represent the smallest median household size with 1.30 persons per household.
| Household Type | # Households | Household Size |
| Married-Couple | 5,702 (42.1%) | 3.38 |
| Single Male/Father | 1,298 (9.6%) | 4.10 |
| Single Female/Mother | 1,957 (14.5%) | 3.77 |
| Non-family | 4,576 (33.8%) | 1.30 |
| Total Households | 13,533 (100.0%) | 2.80 |
Household Size by Marriage Status in Hobbs
Out of a total of 13,533 households in Hobbs, 8,957 (66.2%) are family households, while 4,576 (33.8%) are nonfamily households. The most numerous type of family households are 2-person households, comprising 3,263, and the most common type of nonfamily households are 1-person households, comprising 3,758.
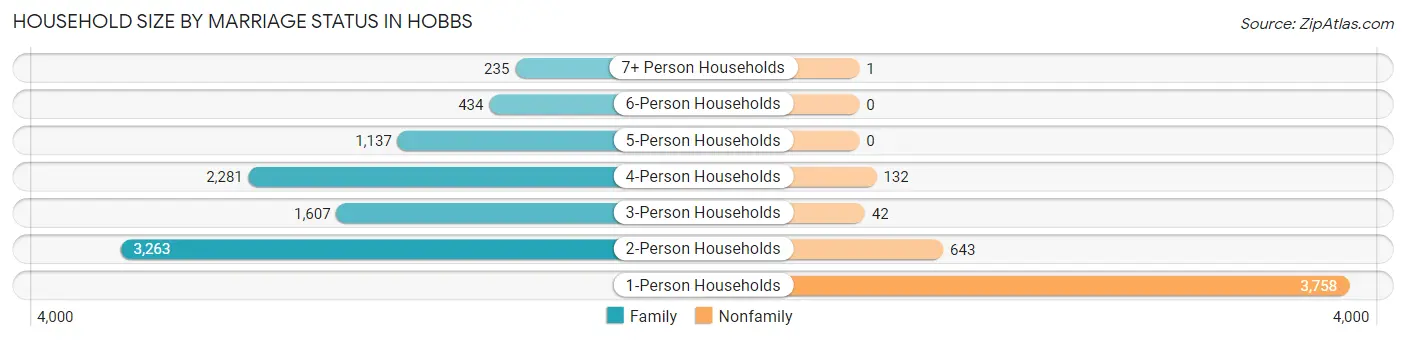
| Household Size | Family Households | Nonfamily Households |
| 1-Person Households | - | 3,758 (27.8%) |
| 2-Person Households | 3,263 (24.1%) | 643 (4.8%) |
| 3-Person Households | 1,607 (11.9%) | 42 (0.3%) |
| 4-Person Households | 2,281 (16.9%) | 132 (1.0%) |
| 5-Person Households | 1,137 (8.4%) | 0 (0.0%) |
| 6-Person Households | 434 (3.2%) | 0 (0.0%) |
| 7+ Person Households | 235 (1.7%) | 1 (0.0%) |
| Total | 8,957 (66.2%) | 4,576 (33.8%) |
Female Fertility in Hobbs
Fertility by Age in Hobbs
Average fertility rate in Hobbs is 83.0 births per 1,000 women. Women in the age bracket of 20 to 34 years have the highest fertility rate with 139.0 births per 1,000 women. Women in the age bracket of 20 to 34 years acount for 81.0% of all women with births.
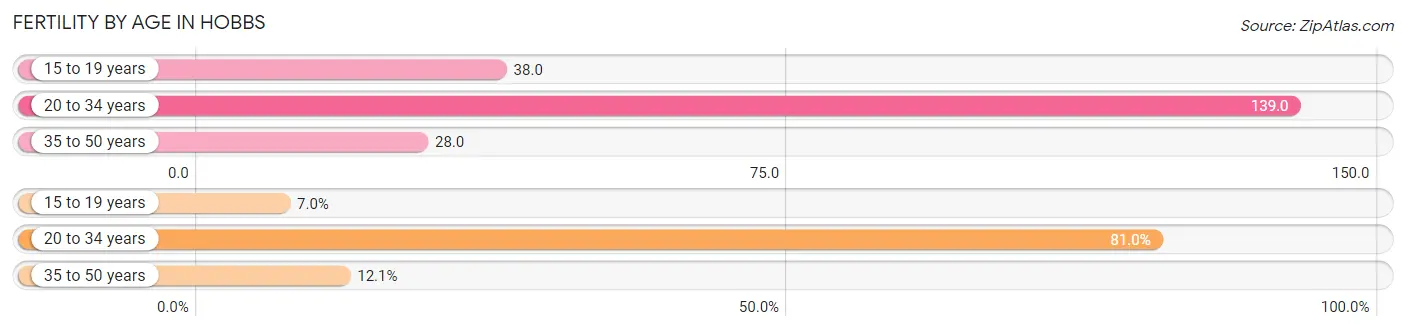
| Age Bracket | Women with Births | Births / 1,000 Women |
| 15 to 19 years | 53 (7.0%) | 38.0 |
| 20 to 34 years | 617 (81.0%) | 139.0 |
| 35 to 50 years | 92 (12.1%) | 28.0 |
| Total | 762 (100.0%) | 83.0 |
Fertility by Age by Marriage Status in Hobbs
46.2% of women with births (762) in Hobbs are married. The highest percentage of unmarried women with births falls into 15 to 19 years age bracket with 100.0% of them unmarried at the time of birth, while the lowest percentage of unmarried women with births belong to 35 to 50 years age bracket with 0.0% of them unmarried.
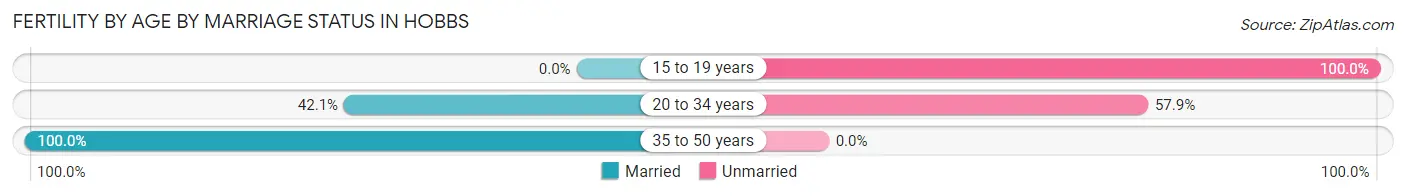
| Age Bracket | Married | Unmarried |
| 15 to 19 years | 0 (0.0%) | 53 (100.0%) |
| 20 to 34 years | 260 (42.1%) | 357 (57.9%) |
| 35 to 50 years | 92 (100.0%) | 0 (0.0%) |
| Total | 352 (46.2%) | 410 (53.8%) |
Fertility by Education in Hobbs
Average fertility rate in Hobbs is 83.0 births per 1,000 women. Women with the education attainment of less than high school have the highest fertility rate of 110.0 births per 1,000 women, while women with the education attainment of bachelor's degree have the lowest fertility at 26.0 births per 1,000 women. Women with the education attainment of high school diploma represent 34.0% of all women with births.
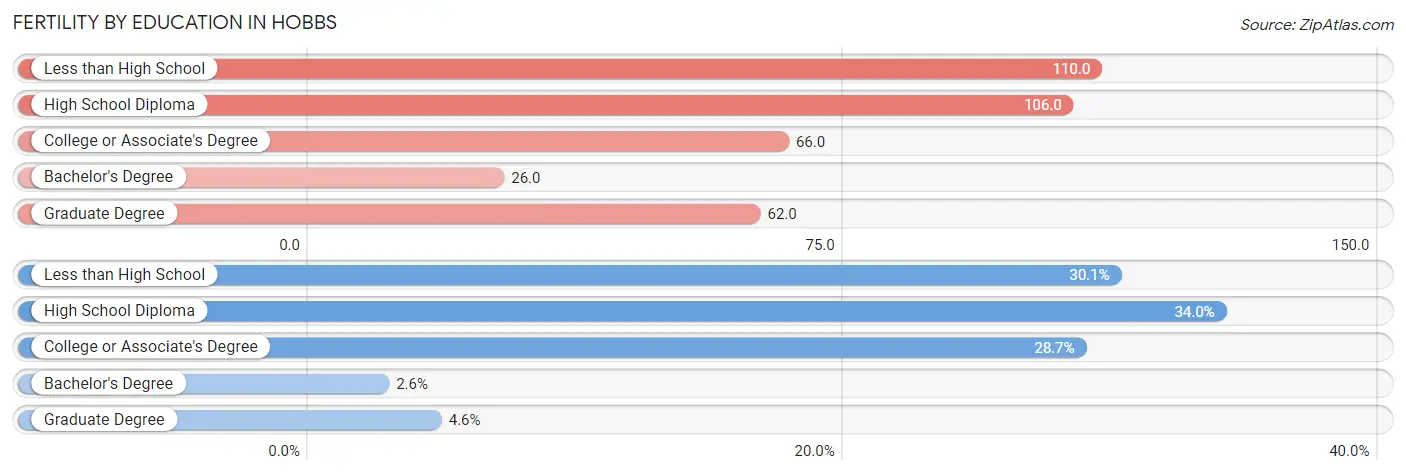
| Educational Attainment | Women with Births | Births / 1,000 Women |
| Less than High School | 229 (30.0%) | 110.0 |
| High School Diploma | 259 (34.0%) | 106.0 |
| College or Associate's Degree | 219 (28.7%) | 66.0 |
| Bachelor's Degree | 20 (2.6%) | 26.0 |
| Graduate Degree | 35 (4.6%) | 62.0 |
| Total | 762 (100.0%) | 83.0 |
Fertility by Education by Marriage Status in Hobbs
53.8% of women with births in Hobbs are unmarried. Women with the educational attainment of bachelor's degree are most likely to be married with 100.0% of them married at childbirth, while women with the educational attainment of high school diploma are least likely to be married with 82.6% of them unmarried at childbirth.
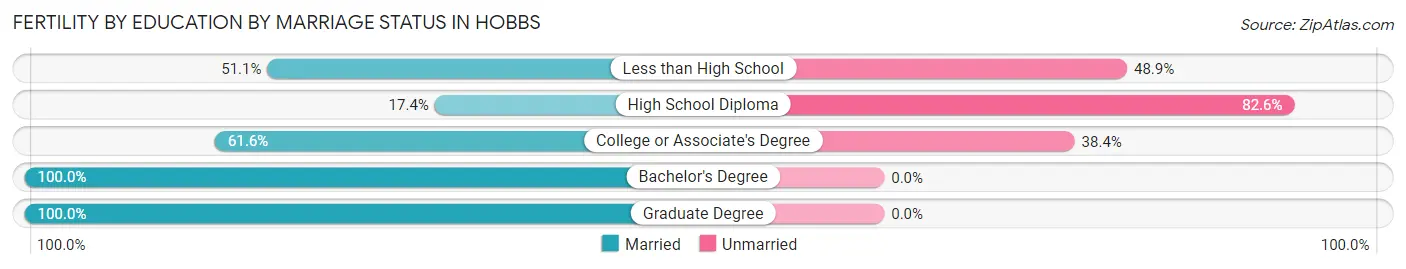
| Educational Attainment | Married | Unmarried |
| Less than High School | 117 (51.1%) | 112 (48.9%) |
| High School Diploma | 45 (17.4%) | 214 (82.6%) |
| College or Associate's Degree | 135 (61.6%) | 84 (38.4%) |
| Bachelor's Degree | 20 (100.0%) | 0 (0.0%) |
| Graduate Degree | 35 (100.0%) | 0 (0.0%) |
| Total | 352 (46.2%) | 410 (53.8%) |
Employment Characteristics in Hobbs
Employment by Class of Employer in Hobbs
Among the 16,844 employed individuals in Hobbs, private company employees (12,412 | 73.7%), local government employees (1,110 | 6.6%), and state government employees (1,107 | 6.6%) make up the most common classes of employment.
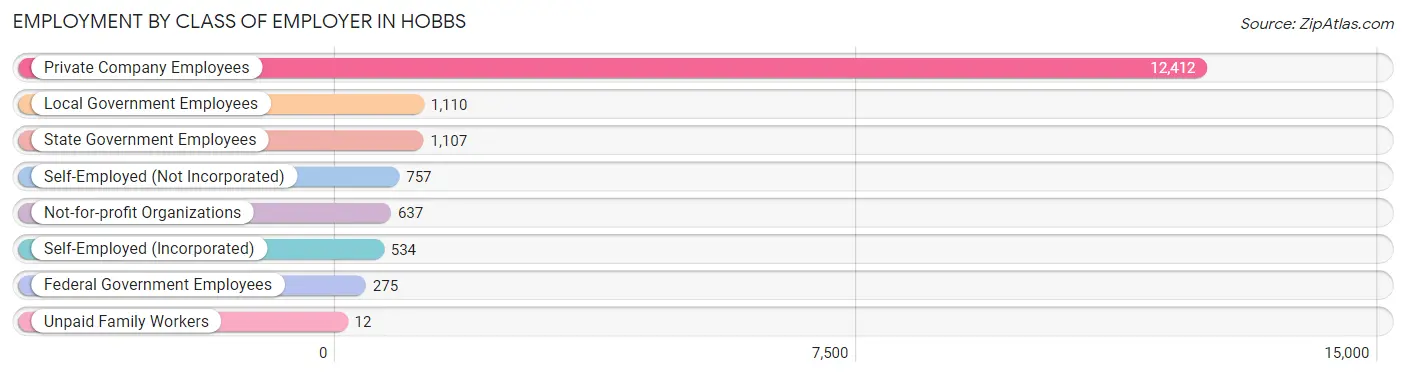
| Employer Class | # Employees | % Employees |
| Private Company Employees | 12,412 | 73.7% |
| Self-Employed (Incorporated) | 534 | 3.2% |
| Self-Employed (Not Incorporated) | 757 | 4.5% |
| Not-for-profit Organizations | 637 | 3.8% |
| Local Government Employees | 1,110 | 6.6% |
| State Government Employees | 1,107 | 6.6% |
| Federal Government Employees | 275 | 1.6% |
| Unpaid Family Workers | 12 | 0.1% |
| Total | 16,844 | 100.0% |
Employment Status by Age in Hobbs
According to the labor force statistics for Hobbs, out of the total population over 16 years of age (29,356), 63.8% or 18,729 individuals are in the labor force, with 7.4% or 1,386 of them unemployed. The age group with the highest labor force participation rate is 35 to 44 years, with 75.8% or 3,714 individuals in the labor force. Within the labor force, the 65 to 74 years age range has the highest percentage of unemployed individuals, with 31.9% or 285 of them being unemployed.
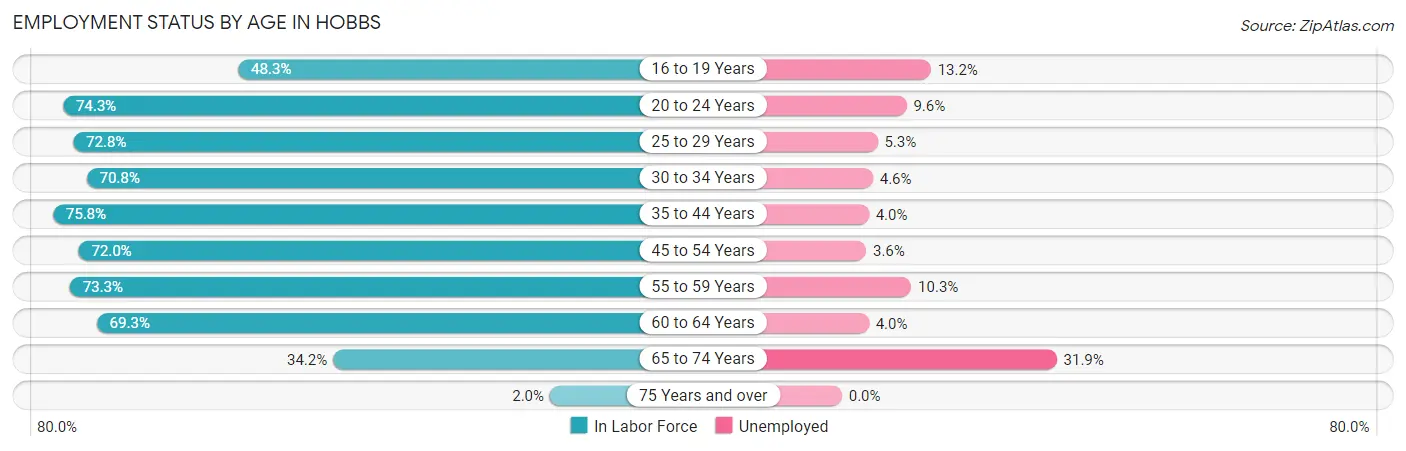
| Age Bracket | In Labor Force | Unemployed |
| 16 to 19 Years | 1,262 (48.3%) | 167 (13.2%) |
| 20 to 24 Years | 2,488 (74.3%) | 239 (9.6%) |
| 25 to 29 Years | 2,381 (72.8%) | 126 (5.3%) |
| 30 to 34 Years | 1,979 (70.8%) | 91 (4.6%) |
| 35 to 44 Years | 3,714 (75.8%) | 149 (4.0%) |
| 45 to 54 Years | 3,162 (72.0%) | 114 (3.6%) |
| 55 to 59 Years | 1,526 (73.3%) | 157 (10.3%) |
| 60 to 64 Years | 1,294 (69.3%) | 52 (4.0%) |
| 65 to 74 Years | 894 (34.2%) | 285 (31.9%) |
| 75 Years and over | 30 (2.0%) | 0 (0.0%) |
| Total | 18,729 (63.8%) | 1,386 (7.4%) |
Employment Status by Educational Attainment in Hobbs
According to labor force statistics for Hobbs, 72.8% of individuals (14,054) out of the total population between 25 and 64 years of age (19,305) are in the labor force, with 4.9% or 689 of them being unemployed. The group with the highest labor force participation rate are those with the educational attainment of bachelor's degree or higher, with 88.7% or 2,581 individuals in the labor force. Within the labor force, individuals with high school diploma education have the highest percentage of unemployment, with 9.9% or 455 of them being unemployed.
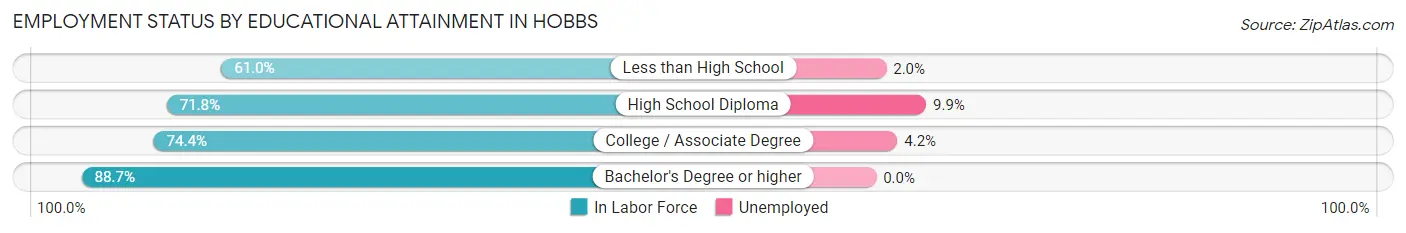
| Educational Attainment | In Labor Force | Unemployed |
| Less than High School | 2,537 (61.0%) | 83 (2.0%) |
| High School Diploma | 4,601 (71.8%) | 634 (9.9%) |
| College / Associate Degree | 4,336 (74.4%) | 245 (4.2%) |
| Bachelor's Degree or higher | 2,581 (88.7%) | 0 (0.0%) |
| Total | 14,054 (72.8%) | 946 (4.9%) |
Employment Occupations by Sex in Hobbs
Management, Business, Science and Arts Occupations
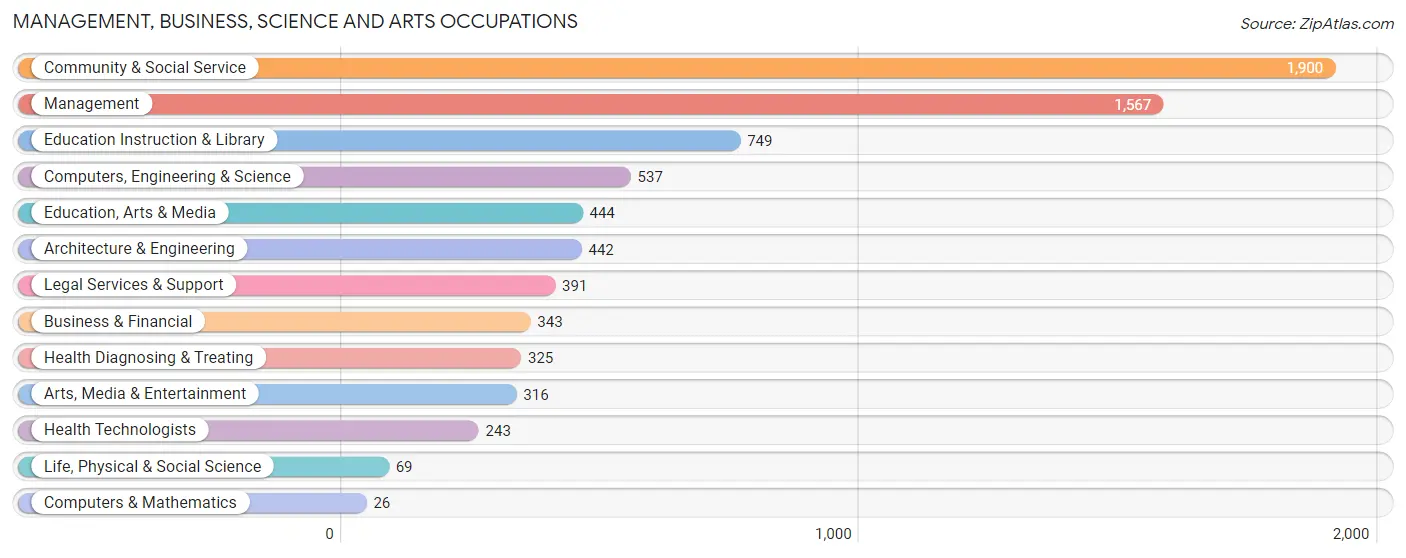
The most common Management, Business, Science and Arts occupations in Hobbs are Community & Social Service (1,900 | 11.0%), Management (1,567 | 9.0%), Education Instruction & Library (749 | 4.3%), Computers, Engineering & Science (537 | 3.1%), and Education, Arts & Media (444 | 2.6%).
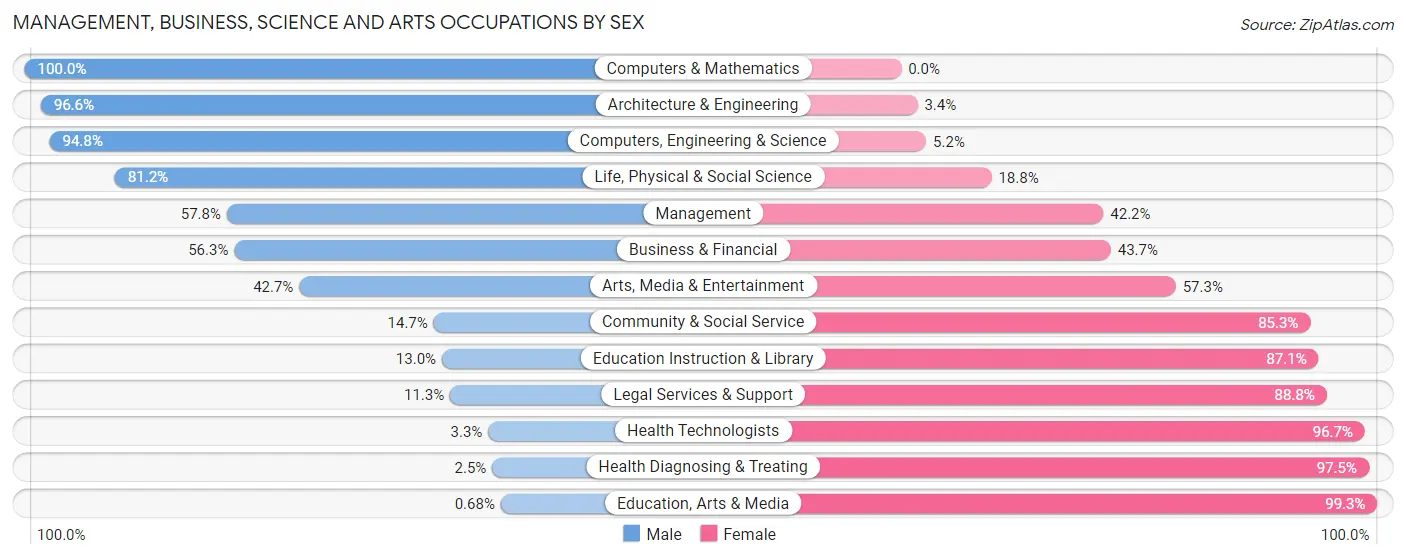
Management, Business, Science and Arts Occupations by Sex
Within the Management, Business, Science and Arts occupations in Hobbs, the most male-oriented occupations are Computers & Mathematics (100.0%), Architecture & Engineering (96.6%), and Computers, Engineering & Science (94.8%), while the most female-oriented occupations are Education, Arts & Media (99.3%), Health Diagnosing & Treating (97.5%), and Health Technologists (96.7%).
| Occupation | Male | Female |
| Management | 906 (57.8%) | 661 (42.2%) |
| Business & Financial | 193 (56.3%) | 150 (43.7%) |
| Computers, Engineering & Science | 509 (94.8%) | 28 (5.2%) |
| Computers & Mathematics | 26 (100.0%) | 0 (0.0%) |
| Architecture & Engineering | 427 (96.6%) | 15 (3.4%) |
| Life, Physical & Social Science | 56 (81.2%) | 13 (18.8%) |
| Community & Social Service | 279 (14.7%) | 1,621 (85.3%) |
| Education, Arts & Media | 3 (0.7%) | 441 (99.3%) |
| Legal Services & Support | 44 (11.3%) | 347 (88.7%) |
| Education Instruction & Library | 97 (13.0%) | 652 (87.1%) |
| Arts, Media & Entertainment | 135 (42.7%) | 181 (57.3%) |
| Health Diagnosing & Treating | 8 (2.5%) | 317 (97.5%) |
| Health Technologists | 8 (3.3%) | 235 (96.7%) |
| Total (Category) | 1,895 (40.6%) | 2,777 (59.4%) |
| Total (Overall) | 9,985 (57.6%) | 7,352 (42.4%) |
Services Occupations
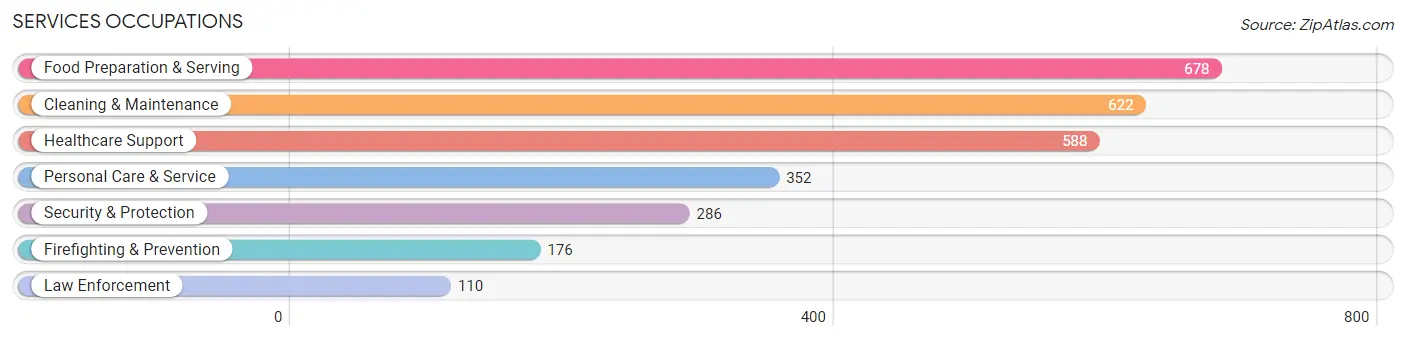
The most common Services occupations in Hobbs are Food Preparation & Serving (678 | 3.9%), Cleaning & Maintenance (622 | 3.6%), Healthcare Support (588 | 3.4%), Personal Care & Service (352 | 2.0%), and Security & Protection (286 | 1.7%).
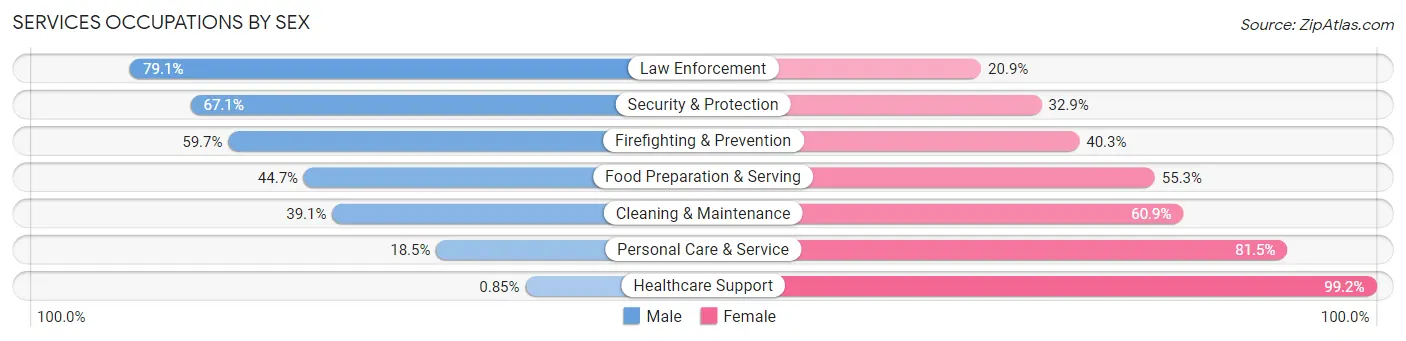
Services Occupations by Sex
Within the Services occupations in Hobbs, the most male-oriented occupations are Law Enforcement (79.1%), Security & Protection (67.1%), and Firefighting & Prevention (59.7%), while the most female-oriented occupations are Healthcare Support (99.2%), Personal Care & Service (81.5%), and Cleaning & Maintenance (60.9%).
| Occupation | Male | Female |
| Healthcare Support | 5 (0.9%) | 583 (99.2%) |
| Security & Protection | 192 (67.1%) | 94 (32.9%) |
| Firefighting & Prevention | 105 (59.7%) | 71 (40.3%) |
| Law Enforcement | 87 (79.1%) | 23 (20.9%) |
| Food Preparation & Serving | 303 (44.7%) | 375 (55.3%) |
| Cleaning & Maintenance | 243 (39.1%) | 379 (60.9%) |
| Personal Care & Service | 65 (18.5%) | 287 (81.5%) |
| Total (Category) | 808 (32.0%) | 1,718 (68.0%) |
| Total (Overall) | 9,985 (57.6%) | 7,352 (42.4%) |
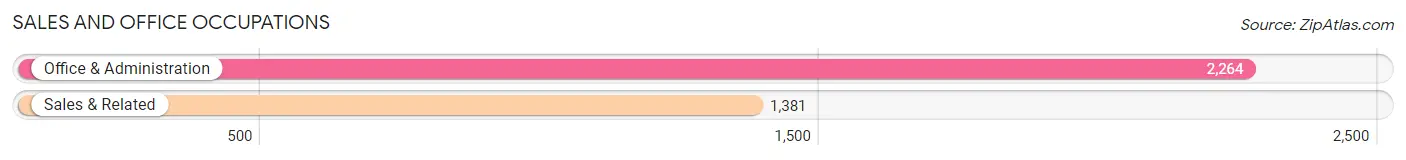
Sales and Office Occupations
The most common Sales and Office occupations in Hobbs are Office & Administration (2,264 | 13.1%), and Sales & Related (1,381 | 8.0%).
Sales and Office Occupations by Sex
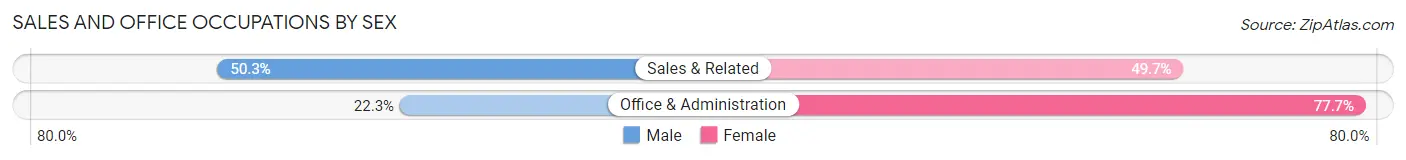
| Occupation | Male | Female |
| Sales & Related | 695 (50.3%) | 686 (49.7%) |
| Office & Administration | 504 (22.3%) | 1,760 (77.7%) |
| Total (Category) | 1,199 (32.9%) | 2,446 (67.1%) |
| Total (Overall) | 9,985 (57.6%) | 7,352 (42.4%) |
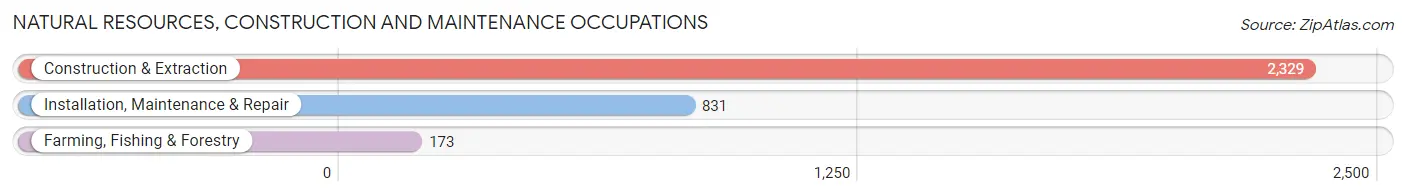
Natural Resources, Construction and Maintenance Occupations
The most common Natural Resources, Construction and Maintenance occupations in Hobbs are Construction & Extraction (2,329 | 13.4%), Installation, Maintenance & Repair (831 | 4.8%), and Farming, Fishing & Forestry (173 | 1.0%).
Natural Resources, Construction and Maintenance Occupations by Sex
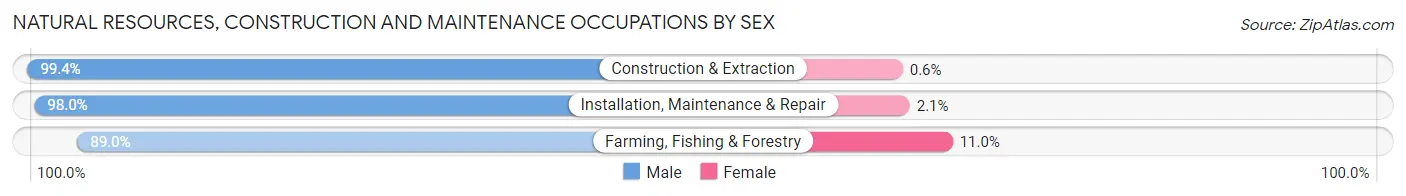
| Occupation | Male | Female |
| Farming, Fishing & Forestry | 154 (89.0%) | 19 (11.0%) |
| Construction & Extraction | 2,315 (99.4%) | 14 (0.6%) |
| Installation, Maintenance & Repair | 814 (98.0%) | 17 (2.1%) |
| Total (Category) | 3,283 (98.5%) | 50 (1.5%) |
| Total (Overall) | 9,985 (57.6%) | 7,352 (42.4%) |
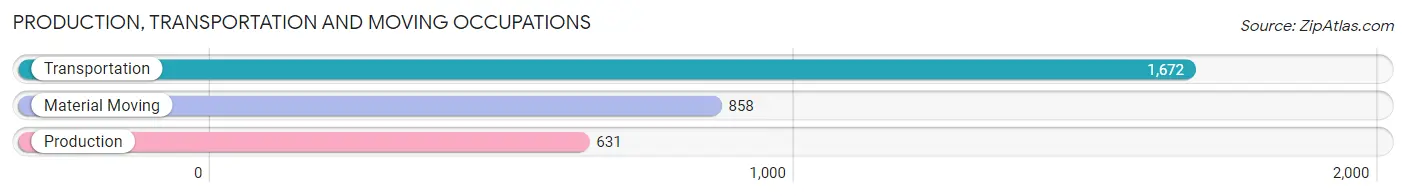
Production, Transportation and Moving Occupations
The most common Production, Transportation and Moving occupations in Hobbs are Transportation (1,672 | 9.6%), Material Moving (858 | 5.0%), and Production (631 | 3.6%).
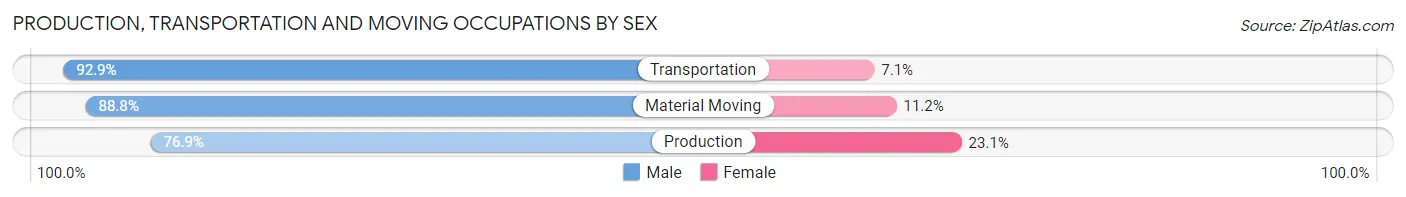
Production, Transportation and Moving Occupations by Sex
| Occupation | Male | Female |
| Production | 485 (76.9%) | 146 (23.1%) |
| Transportation | 1,553 (92.9%) | 119 (7.1%) |
| Material Moving | 762 (88.8%) | 96 (11.2%) |
| Total (Category) | 2,800 (88.6%) | 361 (11.4%) |
| Total (Overall) | 9,985 (57.6%) | 7,352 (42.4%) |
Employment Industries by Sex in Hobbs
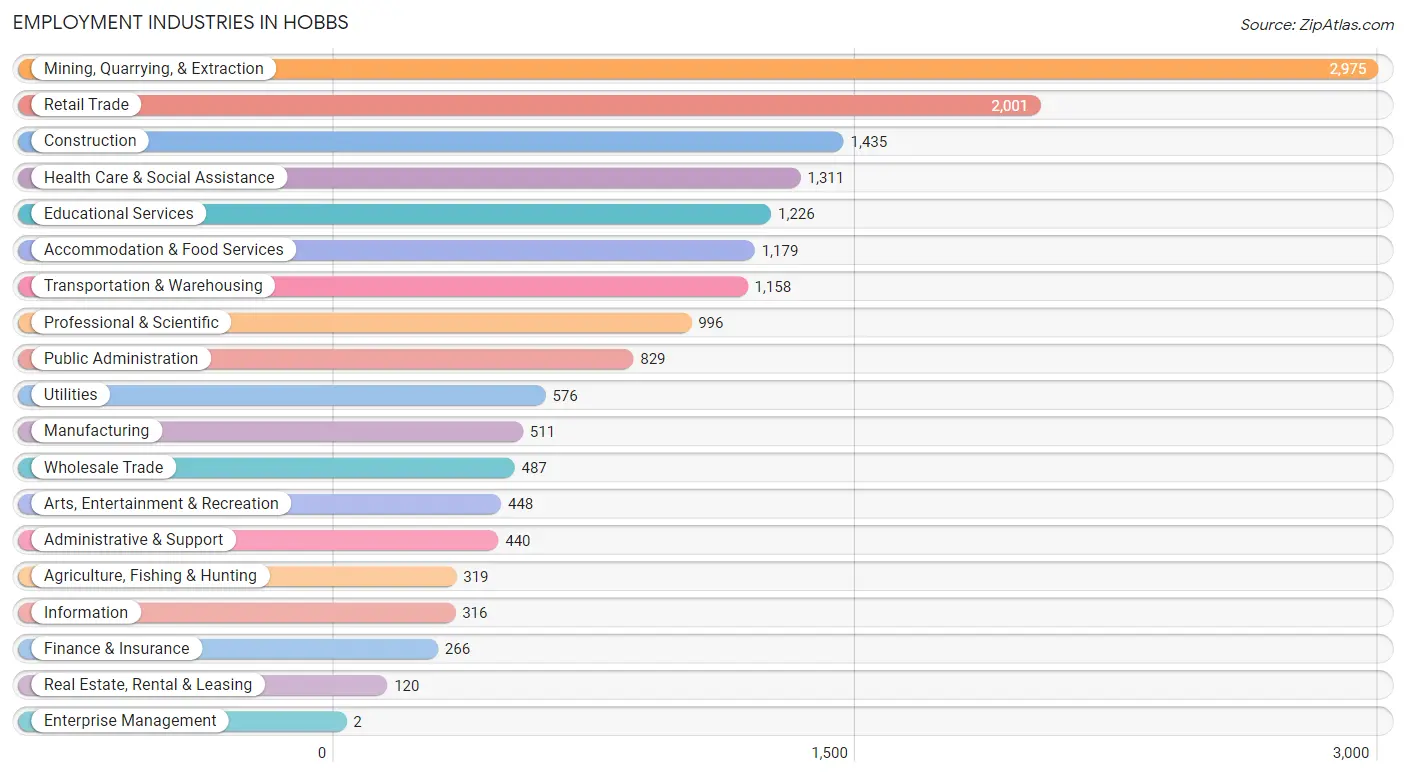
Employment Industries in Hobbs
The major employment industries in Hobbs include Mining, Quarrying, & Extraction (2,975 | 17.2%), Retail Trade (2,001 | 11.5%), Construction (1,435 | 8.3%), Health Care & Social Assistance (1,311 | 7.6%), and Educational Services (1,226 | 7.1%).
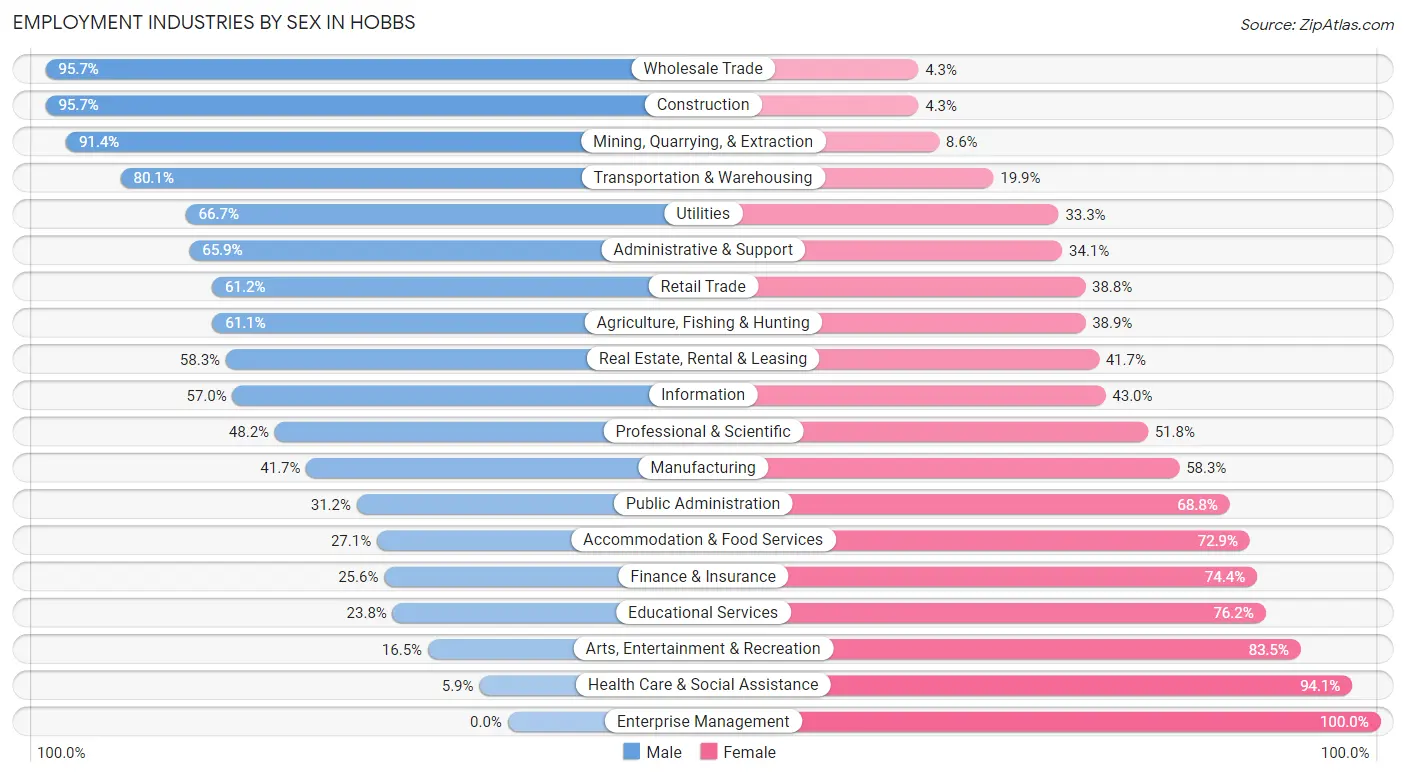
Employment Industries by Sex in Hobbs
The Hobbs industries that see more men than women are Wholesale Trade (95.7%), Construction (95.7%), and Mining, Quarrying, & Extraction (91.4%), whereas the industries that tend to have a higher number of women are Enterprise Management (100.0%), Health Care & Social Assistance (94.1%), and Arts, Entertainment & Recreation (83.5%).
| Industry | Male | Female |
| Agriculture, Fishing & Hunting | 195 (61.1%) | 124 (38.9%) |
| Mining, Quarrying, & Extraction | 2,720 (91.4%) | 255 (8.6%) |
| Construction | 1,373 (95.7%) | 62 (4.3%) |
| Manufacturing | 213 (41.7%) | 298 (58.3%) |
| Wholesale Trade | 466 (95.7%) | 21 (4.3%) |
| Retail Trade | 1,224 (61.2%) | 777 (38.8%) |
| Transportation & Warehousing | 928 (80.1%) | 230 (19.9%) |
| Utilities | 384 (66.7%) | 192 (33.3%) |
| Information | 180 (57.0%) | 136 (43.0%) |
| Finance & Insurance | 68 (25.6%) | 198 (74.4%) |
| Real Estate, Rental & Leasing | 70 (58.3%) | 50 (41.7%) |
| Professional & Scientific | 480 (48.2%) | 516 (51.8%) |
| Enterprise Management | 0 (0.0%) | 2 (100.0%) |
| Administrative & Support | 290 (65.9%) | 150 (34.1%) |
| Educational Services | 292 (23.8%) | 934 (76.2%) |
| Health Care & Social Assistance | 77 (5.9%) | 1,234 (94.1%) |
| Arts, Entertainment & Recreation | 74 (16.5%) | 374 (83.5%) |
| Accommodation & Food Services | 319 (27.1%) | 860 (72.9%) |
| Public Administration | 259 (31.2%) | 570 (68.8%) |
| Total | 9,985 (57.6%) | 7,352 (42.4%) |
Education in Hobbs
School Enrollment in Hobbs
The most common levels of schooling among the 10,897 students in Hobbs are elementary school (2,893 | 26.6%), high school (2,374 | 21.8%), and middle school (2,252 | 20.7%).
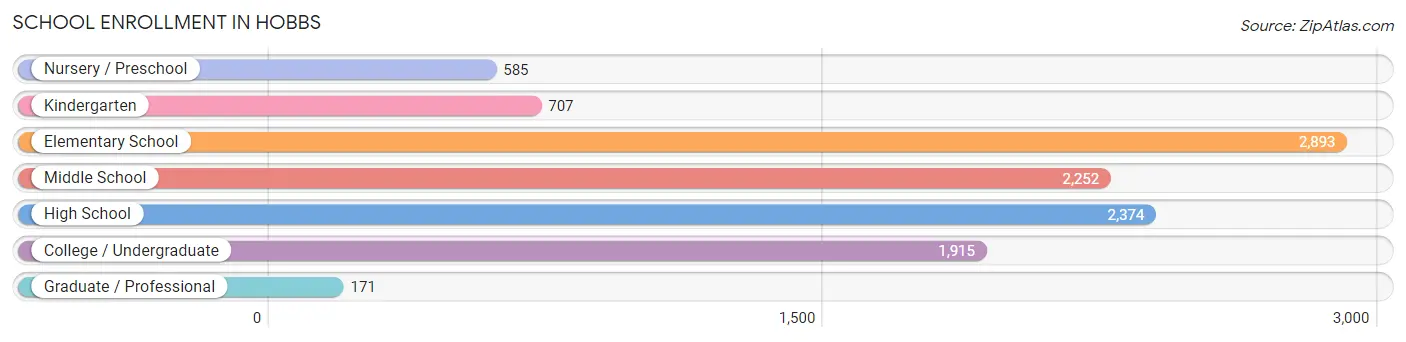
| School Level | # Students | % Students |
| Nursery / Preschool | 585 | 5.4% |
| Kindergarten | 707 | 6.5% |
| Elementary School | 2,893 | 26.6% |
| Middle School | 2,252 | 20.7% |
| High School | 2,374 | 21.8% |
| College / Undergraduate | 1,915 | 17.6% |
| Graduate / Professional | 171 | 1.6% |
| Total | 10,897 | 100.0% |
School Enrollment by Age by Funding Source in Hobbs
Out of a total of 10,897 students who are enrolled in schools in Hobbs, 904 (8.3%) attend a private institution, while the remaining 9,993 (91.7%) are enrolled in public schools. The age group of 35 years and over has the highest likelihood of being enrolled in private schools, with 118 (35.8% in the age bracket) enrolled. Conversely, the age group of 15 to 17 year olds has the lowest likelihood of being enrolled in a private school, with 2,006 (97.5% in the age bracket) attending a public institution.
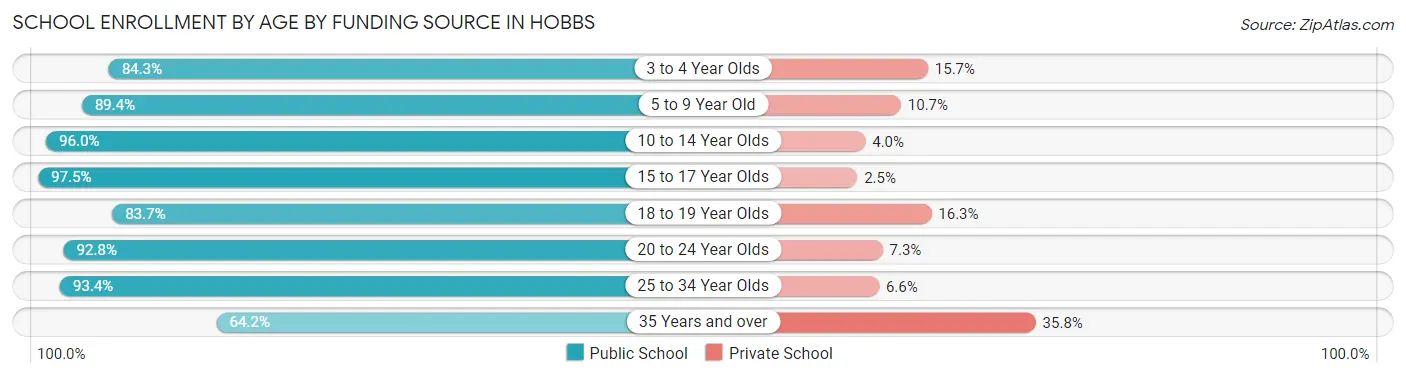
| Age Bracket | Public School | Private School |
| 3 to 4 Year Olds | 328 (84.3%) | 61 (15.7%) |
| 5 to 9 Year Old | 3,087 (89.3%) | 368 (10.6%) |
| 10 to 14 Year Olds | 2,673 (96.0%) | 112 (4.0%) |
| 15 to 17 Year Olds | 2,006 (97.5%) | 52 (2.5%) |
| 18 to 19 Year Olds | 543 (83.7%) | 106 (16.3%) |
| 20 to 24 Year Olds | 691 (92.7%) | 54 (7.2%) |
| 25 to 34 Year Olds | 454 (93.4%) | 32 (6.6%) |
| 35 Years and over | 212 (64.2%) | 118 (35.8%) |
| Total | 9,993 (91.7%) | 904 (8.3%) |
Educational Attainment by Field of Study in Hobbs
Education (968 | 25.2%), business (836 | 21.7%), arts & humanities (428 | 11.1%), psychology (380 | 9.9%), and bio, nature & agricultural (280 | 7.3%) are the most common fields of study among 3,843 individuals in Hobbs who have obtained a bachelor's degree or higher.
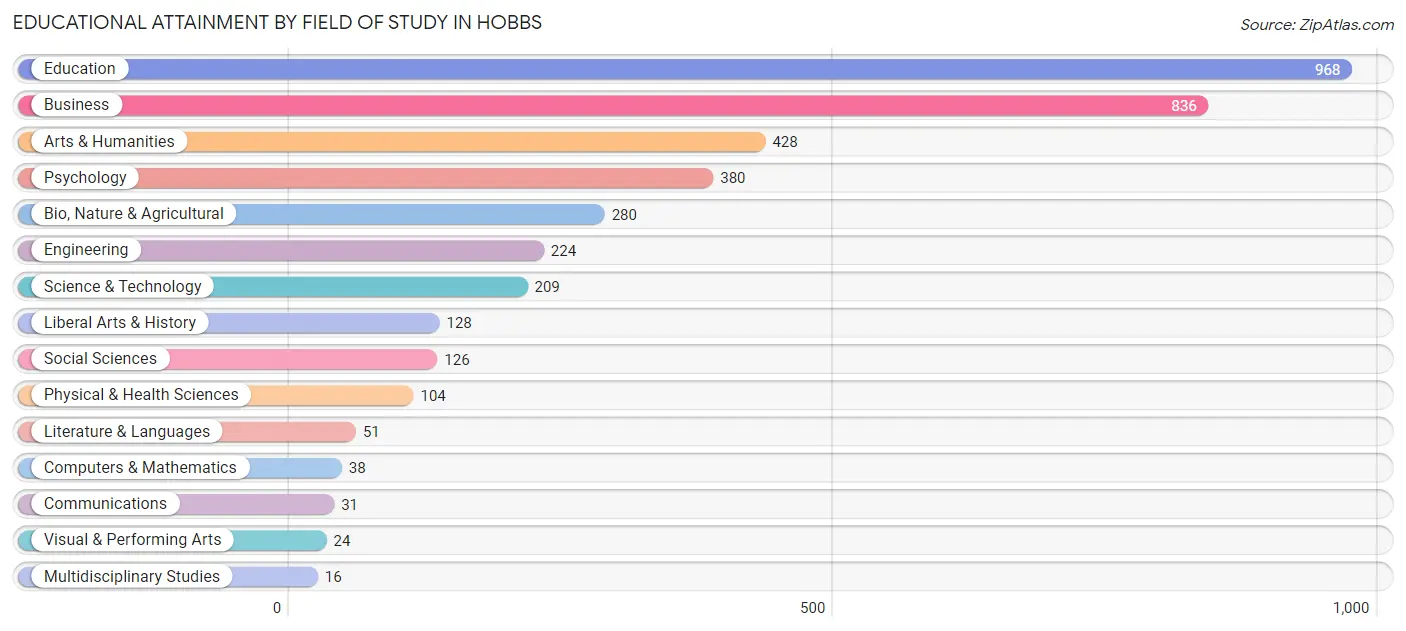
| Field of Study | # Graduates | % Graduates |
| Computers & Mathematics | 38 | 1.0% |
| Bio, Nature & Agricultural | 280 | 7.3% |
| Physical & Health Sciences | 104 | 2.7% |
| Psychology | 380 | 9.9% |
| Social Sciences | 126 | 3.3% |
| Engineering | 224 | 5.8% |
| Multidisciplinary Studies | 16 | 0.4% |
| Science & Technology | 209 | 5.4% |
| Business | 836 | 21.7% |
| Education | 968 | 25.2% |
| Literature & Languages | 51 | 1.3% |
| Liberal Arts & History | 128 | 3.3% |
| Visual & Performing Arts | 24 | 0.6% |
| Communications | 31 | 0.8% |
| Arts & Humanities | 428 | 11.1% |
| Total | 3,843 | 100.0% |
Transportation & Commute in Hobbs
Vehicle Availability by Sex in Hobbs
The most prevalent vehicle ownership categories in Hobbs are males with 2 vehicles (4,028, accounting for 41.6%) and females with 2 vehicles (1,889, making up 57.6%).
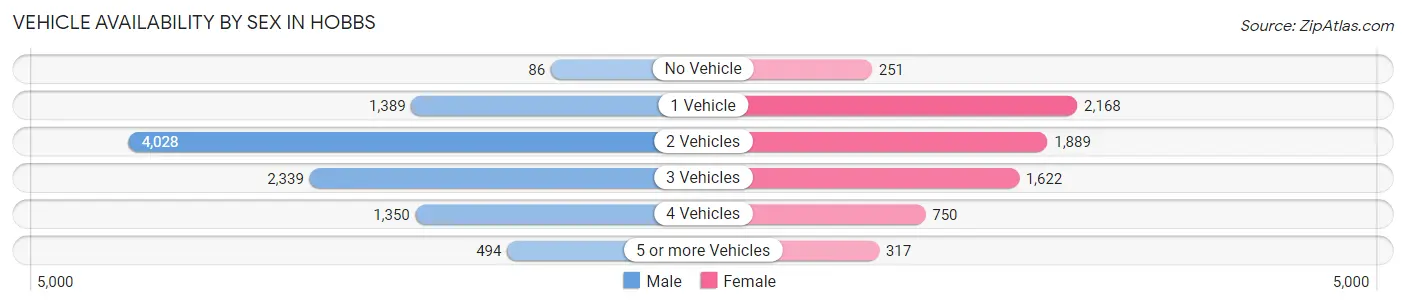
| Vehicles Available | Male | Female |
| No Vehicle | 86 (0.9%) | 251 (3.6%) |
| 1 Vehicle | 1,389 (14.3%) | 2,168 (31.0%) |
| 2 Vehicles | 4,028 (41.6%) | 1,889 (27.0%) |
| 3 Vehicles | 2,339 (24.1%) | 1,622 (23.2%) |
| 4 Vehicles | 1,350 (13.9%) | 750 (10.7%) |
| 5 or more Vehicles | 494 (5.1%) | 317 (4.5%) |
| Total | 9,686 (100.0%) | 6,997 (100.0%) |
Commute Time in Hobbs
The most frequently occuring commute durations in Hobbs are 10 to 14 minutes (4,151 commuters, 25.1%), 5 to 9 minutes (3,008 commuters, 18.2%), and 15 to 19 minutes (2,772 commuters, 16.8%).
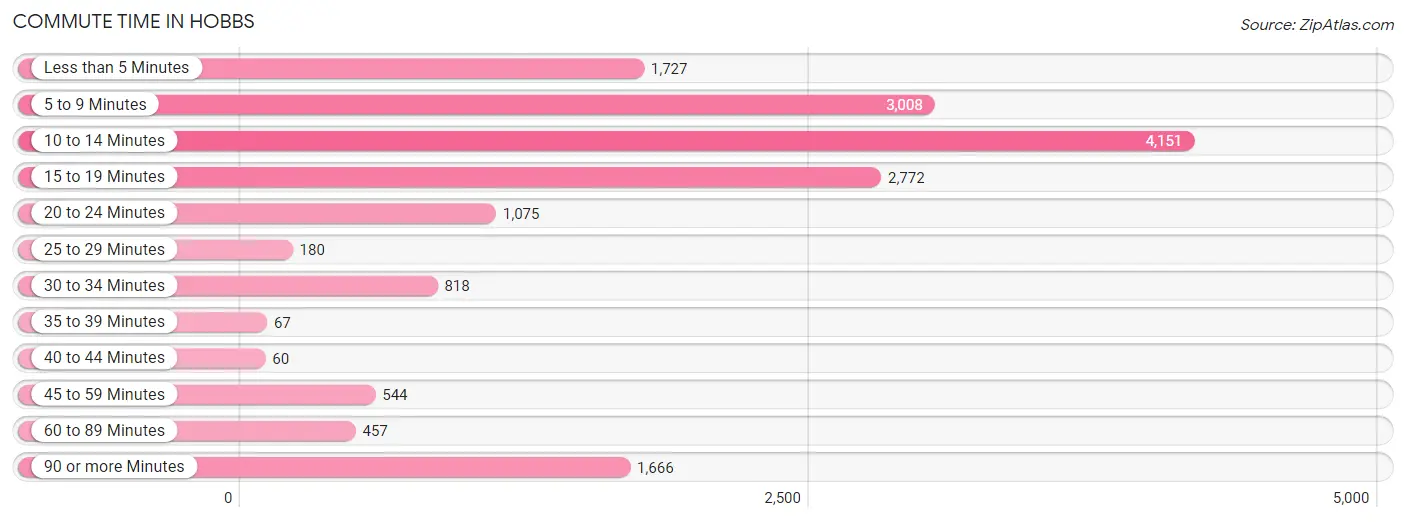
| Commute Time | # Commuters | % Commuters |
| Less than 5 Minutes | 1,727 | 10.4% |
| 5 to 9 Minutes | 3,008 | 18.2% |
| 10 to 14 Minutes | 4,151 | 25.1% |
| 15 to 19 Minutes | 2,772 | 16.8% |
| 20 to 24 Minutes | 1,075 | 6.5% |
| 25 to 29 Minutes | 180 | 1.1% |
| 30 to 34 Minutes | 818 | 5.0% |
| 35 to 39 Minutes | 67 | 0.4% |
| 40 to 44 Minutes | 60 | 0.4% |
| 45 to 59 Minutes | 544 | 3.3% |
| 60 to 89 Minutes | 457 | 2.8% |
| 90 or more Minutes | 1,666 | 10.1% |
Commute Time by Sex in Hobbs
The most common commute times in Hobbs are 10 to 14 minutes (2,007 commuters, 20.8%) for males and 10 to 14 minutes (2,144 commuters, 31.1%) for females.
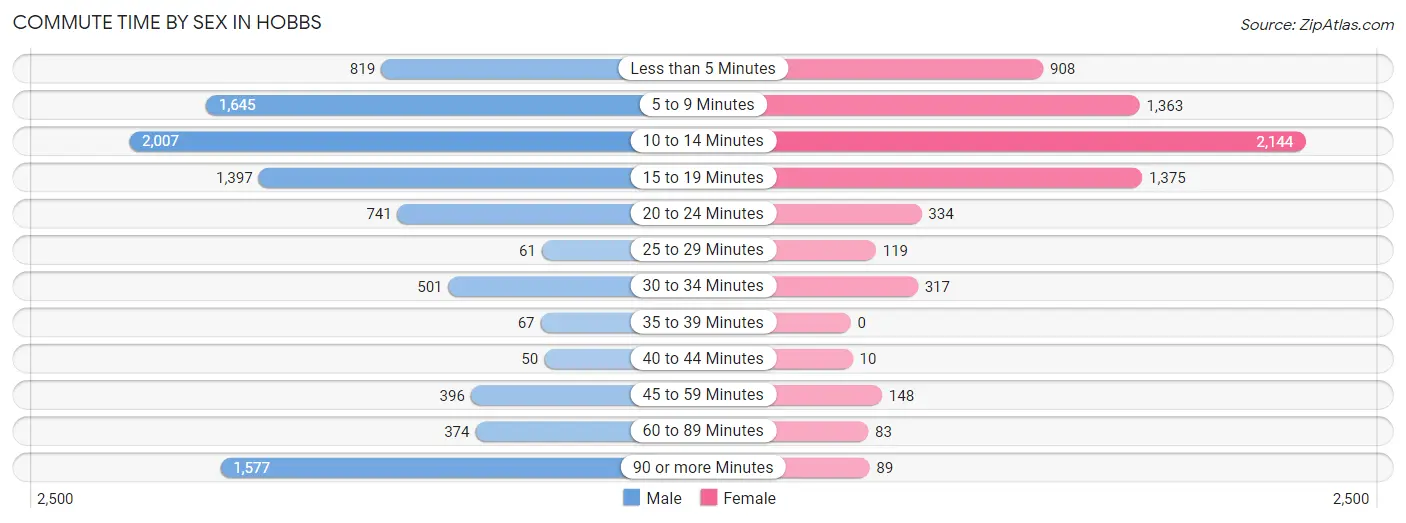
| Commute Time | Male | Female |
| Less than 5 Minutes | 819 (8.5%) | 908 (13.2%) |
| 5 to 9 Minutes | 1,645 (17.1%) | 1,363 (19.8%) |
| 10 to 14 Minutes | 2,007 (20.8%) | 2,144 (31.1%) |
| 15 to 19 Minutes | 1,397 (14.5%) | 1,375 (20.0%) |
| 20 to 24 Minutes | 741 (7.7%) | 334 (4.9%) |
| 25 to 29 Minutes | 61 (0.6%) | 119 (1.7%) |
| 30 to 34 Minutes | 501 (5.2%) | 317 (4.6%) |
| 35 to 39 Minutes | 67 (0.7%) | 0 (0.0%) |
| 40 to 44 Minutes | 50 (0.5%) | 10 (0.2%) |
| 45 to 59 Minutes | 396 (4.1%) | 148 (2.1%) |
| 60 to 89 Minutes | 374 (3.9%) | 83 (1.2%) |
| 90 or more Minutes | 1,577 (16.4%) | 89 (1.3%) |
Time of Departure to Work by Sex in Hobbs
The most frequent times of departure to work in Hobbs are 12:00 AM to 4:59 AM (1,626, 16.9%) for males and 7:30 AM to 7:59 AM (1,979, 28.7%) for females.
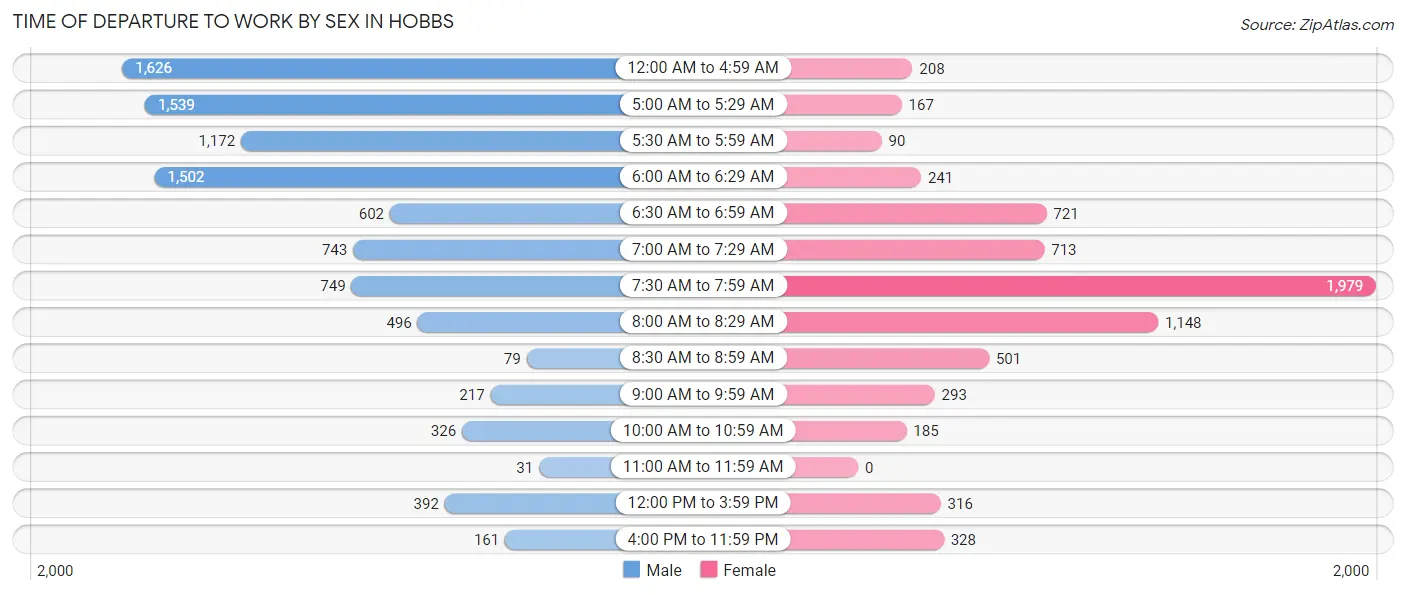
| Time of Departure | Male | Female |
| 12:00 AM to 4:59 AM | 1,626 (16.9%) | 208 (3.0%) |
| 5:00 AM to 5:29 AM | 1,539 (16.0%) | 167 (2.4%) |
| 5:30 AM to 5:59 AM | 1,172 (12.2%) | 90 (1.3%) |
| 6:00 AM to 6:29 AM | 1,502 (15.6%) | 241 (3.5%) |
| 6:30 AM to 6:59 AM | 602 (6.2%) | 721 (10.5%) |
| 7:00 AM to 7:29 AM | 743 (7.7%) | 713 (10.3%) |
| 7:30 AM to 7:59 AM | 749 (7.8%) | 1,979 (28.7%) |
| 8:00 AM to 8:29 AM | 496 (5.1%) | 1,148 (16.7%) |
| 8:30 AM to 8:59 AM | 79 (0.8%) | 501 (7.3%) |
| 9:00 AM to 9:59 AM | 217 (2.2%) | 293 (4.3%) |
| 10:00 AM to 10:59 AM | 326 (3.4%) | 185 (2.7%) |
| 11:00 AM to 11:59 AM | 31 (0.3%) | 0 (0.0%) |
| 12:00 PM to 3:59 PM | 392 (4.1%) | 316 (4.6%) |
| 4:00 PM to 11:59 PM | 161 (1.7%) | 328 (4.8%) |
| Total | 9,635 (100.0%) | 6,890 (100.0%) |
Housing Occupancy in Hobbs
Occupancy by Ownership in Hobbs
Of the total 13,533 dwellings in Hobbs, owner-occupied units account for 8,314 (61.4%), while renter-occupied units make up 5,219 (38.6%).
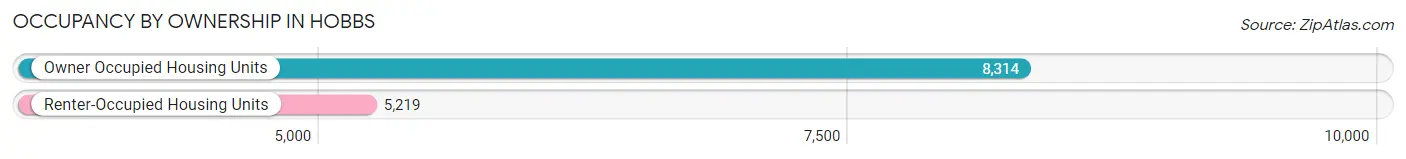
| Occupancy | # Housing Units | % Housing Units |
| Owner Occupied Housing Units | 8,314 | 61.4% |
| Renter-Occupied Housing Units | 5,219 | 38.6% |
| Total Occupied Housing Units | 13,533 | 100.0% |
Occupancy by Household Size in Hobbs
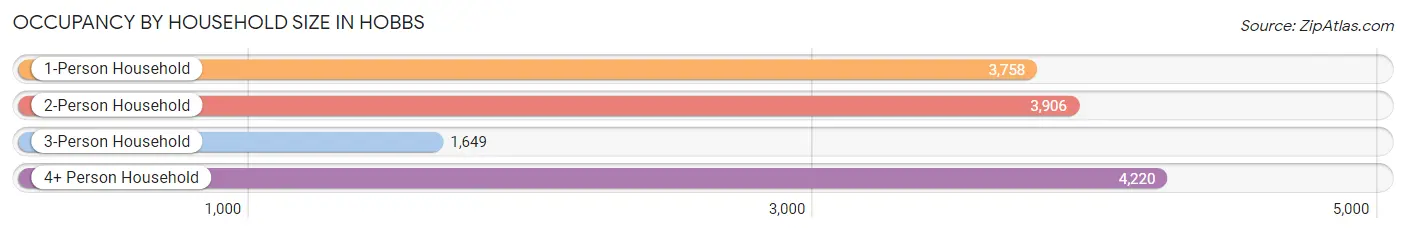
| Household Size | # Housing Units | % Housing Units |
| 1-Person Household | 3,758 | 27.8% |
| 2-Person Household | 3,906 | 28.9% |
| 3-Person Household | 1,649 | 12.2% |
| 4+ Person Household | 4,220 | 31.2% |
| Total Housing Units | 13,533 | 100.0% |
Occupancy by Ownership by Household Size in Hobbs
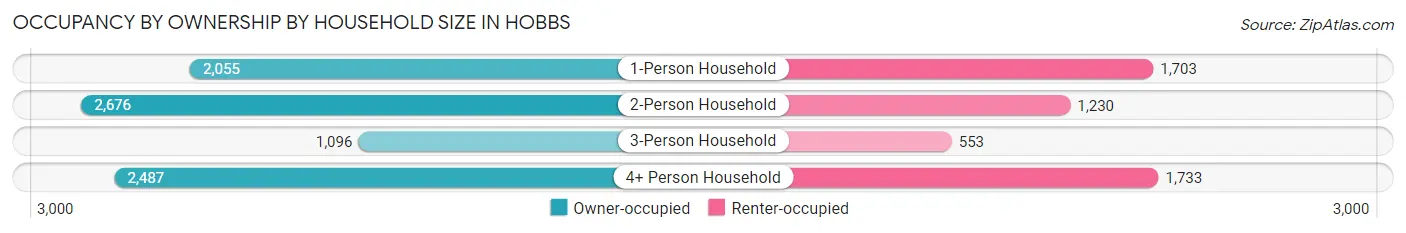
| Household Size | Owner-occupied | Renter-occupied |
| 1-Person Household | 2,055 (54.7%) | 1,703 (45.3%) |
| 2-Person Household | 2,676 (68.5%) | 1,230 (31.5%) |
| 3-Person Household | 1,096 (66.5%) | 553 (33.5%) |
| 4+ Person Household | 2,487 (58.9%) | 1,733 (41.1%) |
| Total Housing Units | 8,314 (61.4%) | 5,219 (38.6%) |
Occupancy by Educational Attainment in Hobbs
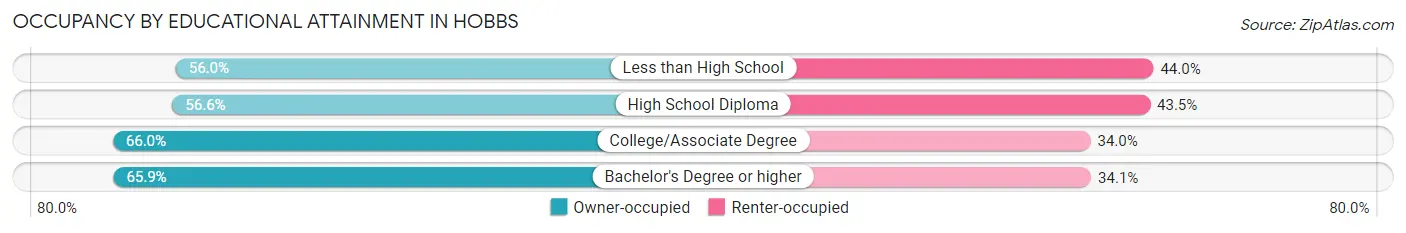
| Household Size | Owner-occupied | Renter-occupied |
| Less than High School | 1,472 (56.0%) | 1,156 (44.0%) |
| High School Diploma | 2,111 (56.6%) | 1,622 (43.4%) |
| College/Associate Degree | 3,102 (66.0%) | 1,598 (34.0%) |
| Bachelor's Degree or higher | 1,629 (65.9%) | 843 (34.1%) |
Occupancy by Age of Householder in Hobbs
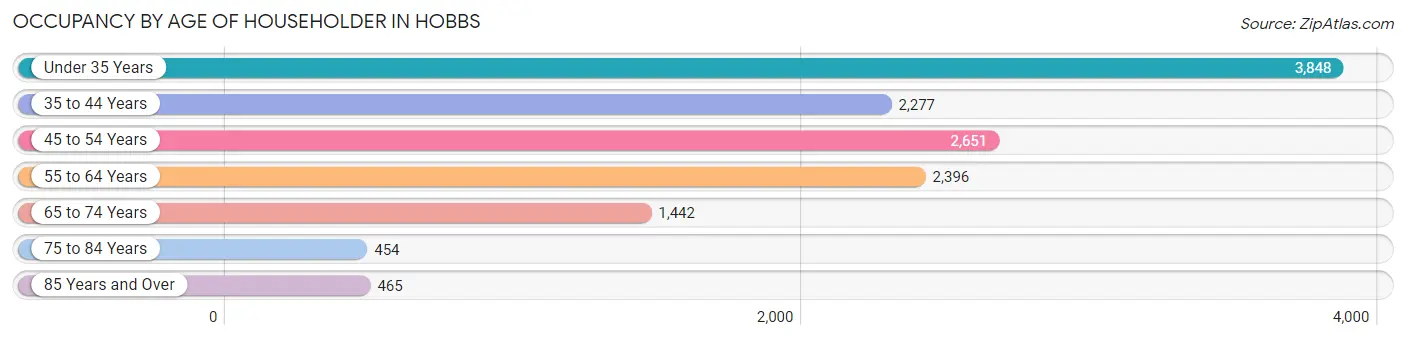
| Age Bracket | # Households | % Households |
| Under 35 Years | 3,848 | 28.4% |
| 35 to 44 Years | 2,277 | 16.8% |
| 45 to 54 Years | 2,651 | 19.6% |
| 55 to 64 Years | 2,396 | 17.7% |
| 65 to 74 Years | 1,442 | 10.7% |
| 75 to 84 Years | 454 | 3.4% |
| 85 Years and Over | 465 | 3.4% |
| Total | 13,533 | 100.0% |
Housing Finances in Hobbs
Median Income by Occupancy in Hobbs
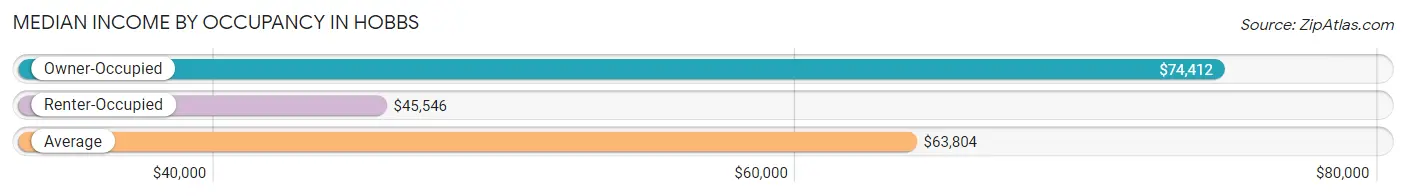
| Occupancy Type | # Households | Median Income |
| Owner-Occupied | 8,314 (61.4%) | $74,412 |
| Renter-Occupied | 5,219 (38.6%) | $45,546 |
| Average | 13,533 (100.0%) | $63,804 |
Occupancy by Householder Income Bracket in Hobbs
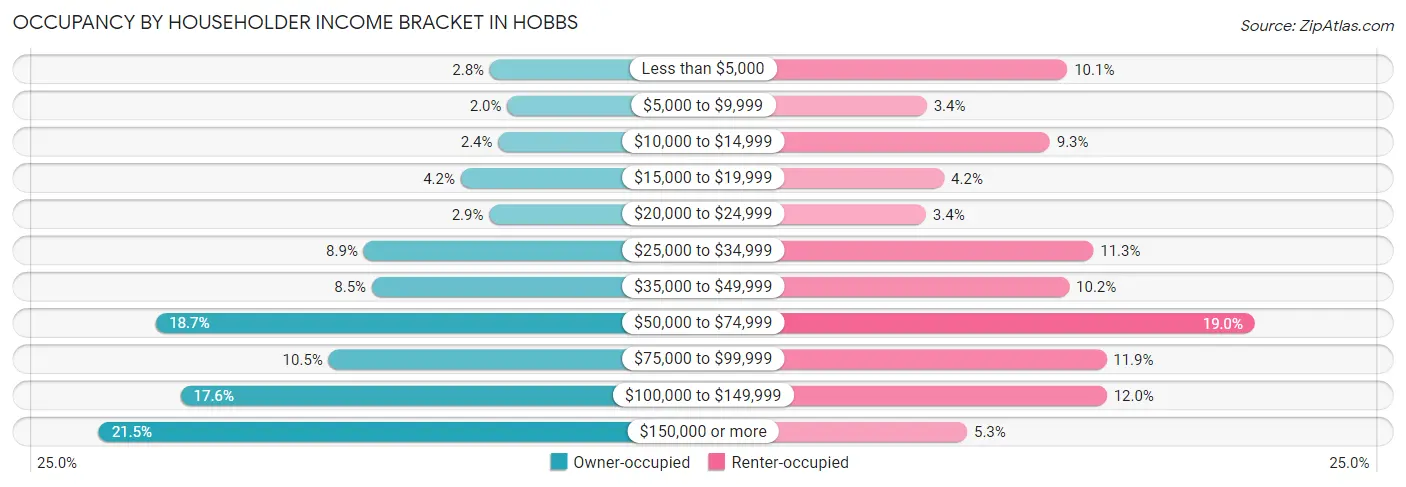
| Income Bracket | Owner-occupied | Renter-occupied |
| Less than $5,000 | 236 (2.8%) | 526 (10.1%) |
| $5,000 to $9,999 | 167 (2.0%) | 177 (3.4%) |
| $10,000 to $14,999 | 203 (2.4%) | 483 (9.2%) |
| $15,000 to $19,999 | 352 (4.2%) | 220 (4.2%) |
| $20,000 to $24,999 | 239 (2.9%) | 175 (3.4%) |
| $25,000 to $34,999 | 736 (8.8%) | 591 (11.3%) |
| $35,000 to $49,999 | 703 (8.5%) | 531 (10.2%) |
| $50,000 to $74,999 | 1,557 (18.7%) | 992 (19.0%) |
| $75,000 to $99,999 | 875 (10.5%) | 623 (11.9%) |
| $100,000 to $149,999 | 1,461 (17.6%) | 624 (12.0%) |
| $150,000 or more | 1,785 (21.5%) | 277 (5.3%) |
| Total | 8,314 (100.0%) | 5,219 (100.0%) |
Monthly Housing Cost Tiers in Hobbs
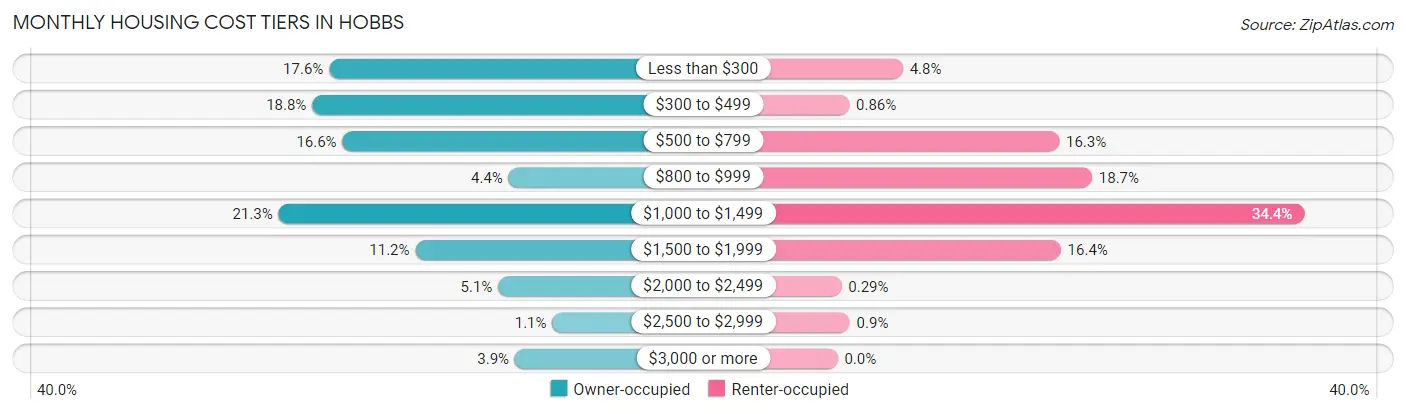
| Monthly Cost | Owner-occupied | Renter-occupied |
| Less than $300 | 1,461 (17.6%) | 251 (4.8%) |
| $300 to $499 | 1,565 (18.8%) | 45 (0.9%) |
| $500 to $799 | 1,379 (16.6%) | 852 (16.3%) |
| $800 to $999 | 362 (4.3%) | 978 (18.7%) |
| $1,000 to $1,499 | 1,771 (21.3%) | 1,794 (34.4%) |
| $1,500 to $1,999 | 933 (11.2%) | 858 (16.4%) |
| $2,000 to $2,499 | 426 (5.1%) | 15 (0.3%) |
| $2,500 to $2,999 | 94 (1.1%) | 47 (0.9%) |
| $3,000 or more | 323 (3.9%) | 0 (0.0%) |
| Total | 8,314 (100.0%) | 5,219 (100.0%) |
Physical Housing Characteristics in Hobbs
Housing Structures in Hobbs
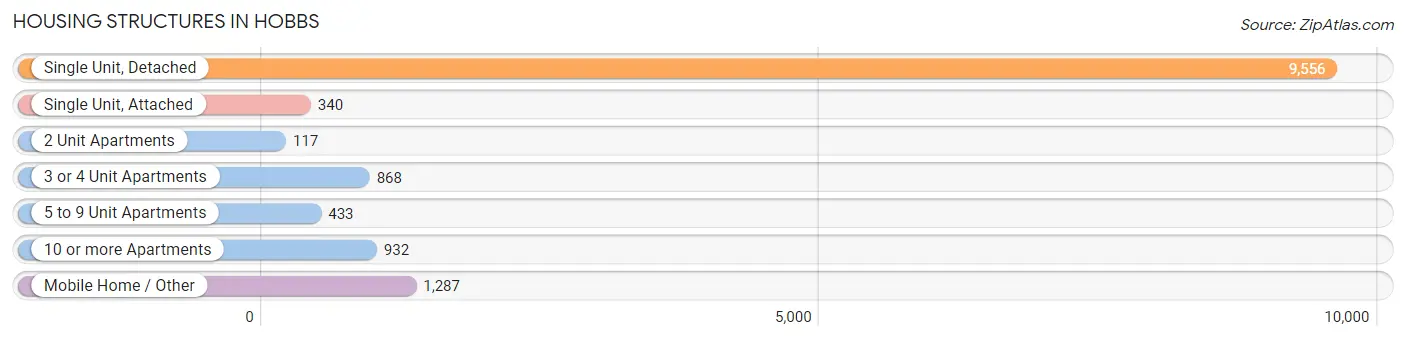
| Structure Type | # Housing Units | % Housing Units |
| Single Unit, Detached | 9,556 | 70.6% |
| Single Unit, Attached | 340 | 2.5% |
| 2 Unit Apartments | 117 | 0.9% |
| 3 or 4 Unit Apartments | 868 | 6.4% |
| 5 to 9 Unit Apartments | 433 | 3.2% |
| 10 or more Apartments | 932 | 6.9% |
| Mobile Home / Other | 1,287 | 9.5% |
| Total | 13,533 | 100.0% |
Housing Structures by Occupancy in Hobbs
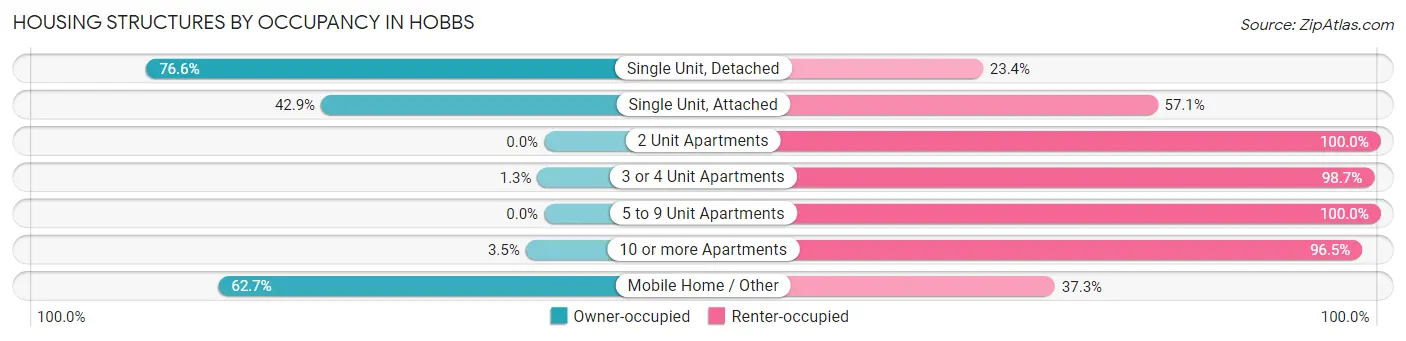
| Structure Type | Owner-occupied | Renter-occupied |
| Single Unit, Detached | 7,317 (76.6%) | 2,239 (23.4%) |
| Single Unit, Attached | 146 (42.9%) | 194 (57.1%) |
| 2 Unit Apartments | 0 (0.0%) | 117 (100.0%) |
| 3 or 4 Unit Apartments | 11 (1.3%) | 857 (98.7%) |
| 5 to 9 Unit Apartments | 0 (0.0%) | 433 (100.0%) |
| 10 or more Apartments | 33 (3.5%) | 899 (96.5%) |
| Mobile Home / Other | 807 (62.7%) | 480 (37.3%) |
| Total | 8,314 (61.4%) | 5,219 (38.6%) |
Housing Structures by Number of Rooms in Hobbs
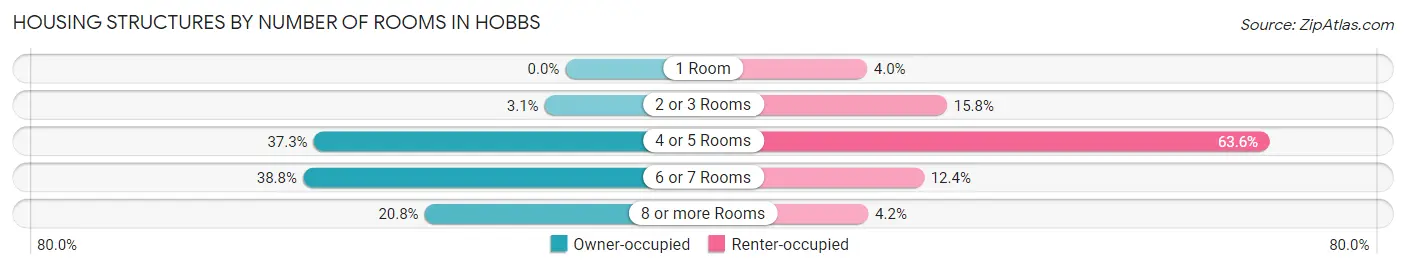
| Number of Rooms | Owner-occupied | Renter-occupied |
| 1 Room | 0 (0.0%) | 208 (4.0%) |
| 2 or 3 Rooms | 256 (3.1%) | 825 (15.8%) |
| 4 or 5 Rooms | 3,098 (37.3%) | 3,321 (63.6%) |
| 6 or 7 Rooms | 3,228 (38.8%) | 647 (12.4%) |
| 8 or more Rooms | 1,732 (20.8%) | 218 (4.2%) |
| Total | 8,314 (100.0%) | 5,219 (100.0%) |
Housing Structure by Heating Type in Hobbs
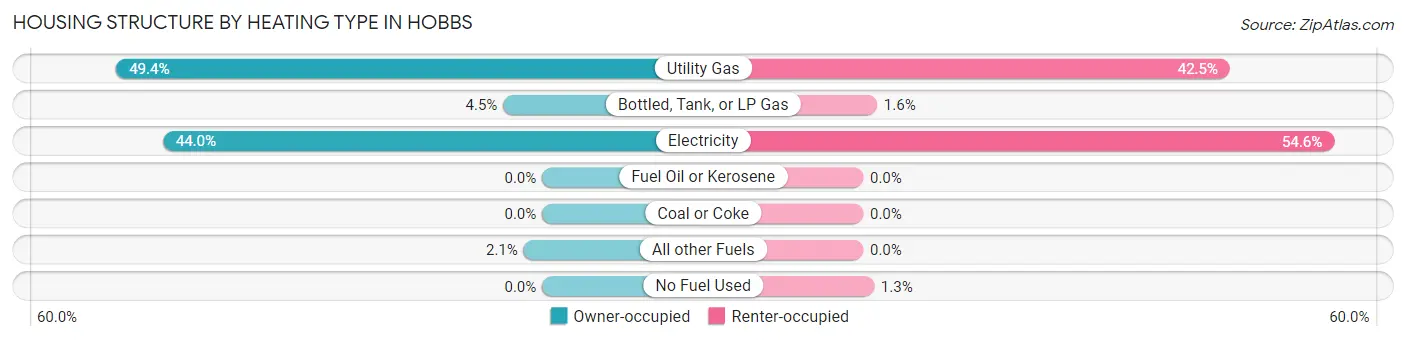
| Heating Type | Owner-occupied | Renter-occupied |
| Utility Gas | 4,105 (49.4%) | 2,219 (42.5%) |
| Bottled, Tank, or LP Gas | 375 (4.5%) | 84 (1.6%) |
| Electricity | 3,656 (44.0%) | 2,850 (54.6%) |
| Fuel Oil or Kerosene | 0 (0.0%) | 0 (0.0%) |
| Coal or Coke | 0 (0.0%) | 0 (0.0%) |
| All other Fuels | 178 (2.1%) | 0 (0.0%) |
| No Fuel Used | 0 (0.0%) | 66 (1.3%) |
| Total | 8,314 (100.0%) | 5,219 (100.0%) |
Household Vehicle Usage in Hobbs
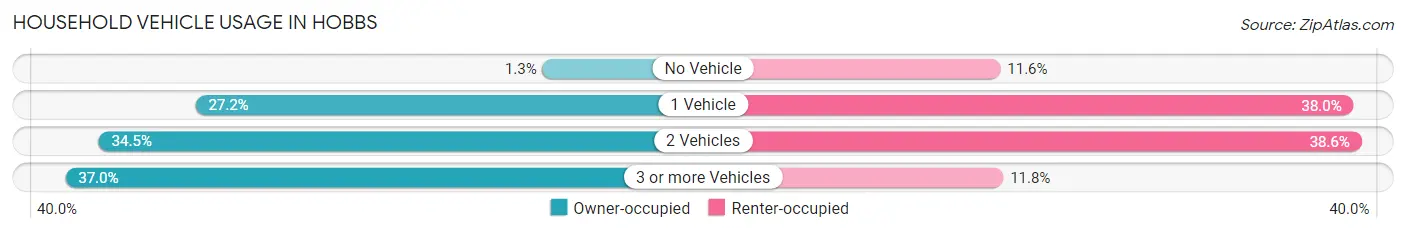
| Vehicles per Household | Owner-occupied | Renter-occupied |
| No Vehicle | 110 (1.3%) | 606 (11.6%) |
| 1 Vehicle | 2,265 (27.2%) | 1,982 (38.0%) |
| 2 Vehicles | 2,866 (34.5%) | 2,014 (38.6%) |
| 3 or more Vehicles | 3,073 (37.0%) | 617 (11.8%) |
| Total | 8,314 (100.0%) | 5,219 (100.0%) |
Real Estate & Mortgages in Hobbs
Real Estate and Mortgage Overview in Hobbs
| Characteristic | Without Mortgage | With Mortgage |
| Housing Units | 4,239 | 4,075 |
| Median Property Value | $150,600 | $195,200 |
| Median Household Income | $59,858 | $1,164 |
| Monthly Housing Costs | $363 | $323 |
| Real Estate Taxes | $545 | $232 |
Property Value by Mortgage Status in Hobbs
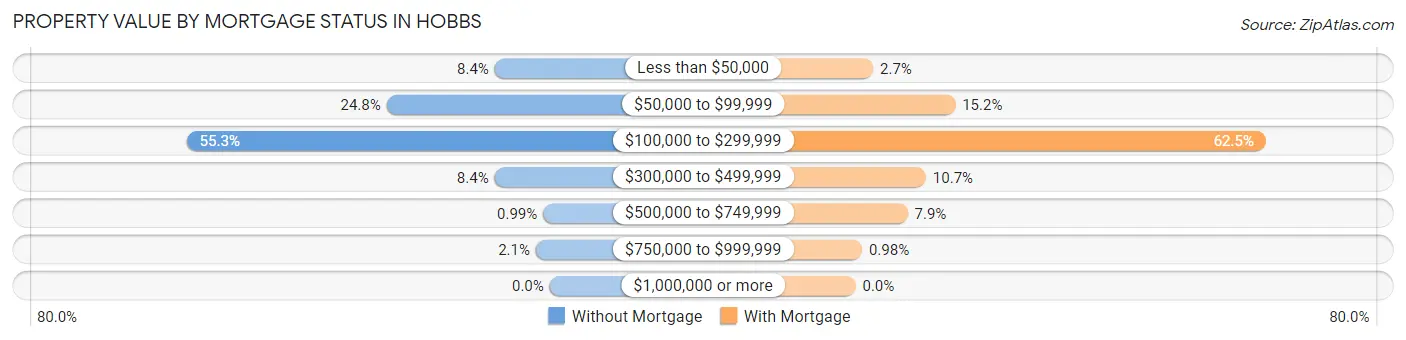
| Property Value | Without Mortgage | With Mortgage |
| Less than $50,000 | 355 (8.4%) | 109 (2.7%) |
| $50,000 to $99,999 | 1,053 (24.8%) | 619 (15.2%) |
| $100,000 to $299,999 | 2,344 (55.3%) | 2,547 (62.5%) |
| $300,000 to $499,999 | 356 (8.4%) | 437 (10.7%) |
| $500,000 to $749,999 | 42 (1.0%) | 323 (7.9%) |
| $750,000 to $999,999 | 89 (2.1%) | 40 (1.0%) |
| $1,000,000 or more | 0 (0.0%) | 0 (0.0%) |
| Total | 4,239 (100.0%) | 4,075 (100.0%) |
Household Income by Mortgage Status in Hobbs
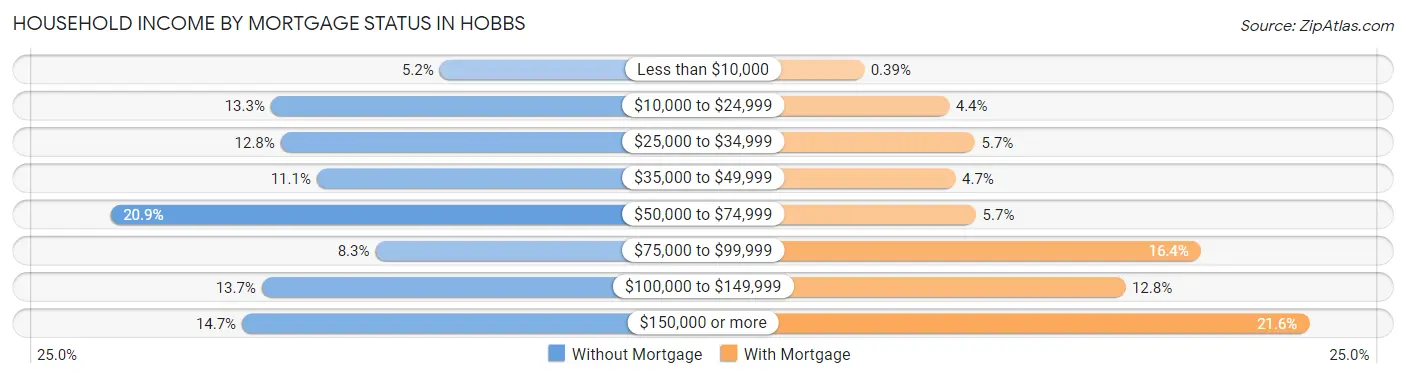
| Household Income | Without Mortgage | With Mortgage |
| Less than $10,000 | 222 (5.2%) | 16 (0.4%) |
| $10,000 to $24,999 | 563 (13.3%) | 181 (4.4%) |
| $25,000 to $34,999 | 543 (12.8%) | 231 (5.7%) |
| $35,000 to $49,999 | 470 (11.1%) | 193 (4.7%) |
| $50,000 to $74,999 | 887 (20.9%) | 233 (5.7%) |
| $75,000 to $99,999 | 352 (8.3%) | 670 (16.4%) |
| $100,000 to $149,999 | 581 (13.7%) | 523 (12.8%) |
| $150,000 or more | 621 (14.6%) | 880 (21.6%) |
| Total | 4,239 (100.0%) | 4,075 (100.0%) |
Property Value to Household Income Ratio in Hobbs
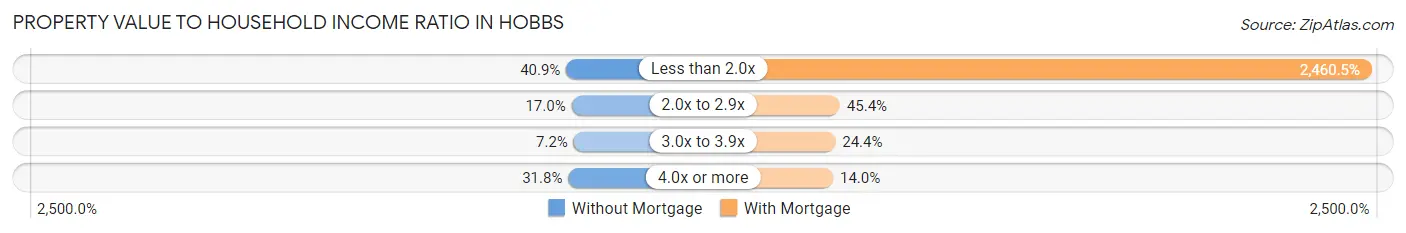
| Value-to-Income Ratio | Without Mortgage | With Mortgage |
| Less than 2.0x | 1,735 (40.9%) | 100,266 (2,460.5%) |
| 2.0x to 2.9x | 722 (17.0%) | 1,848 (45.4%) |
| 3.0x to 3.9x | 304 (7.2%) | 993 (24.4%) |
| 4.0x or more | 1,347 (31.8%) | 572 (14.0%) |
| Total | 4,239 (100.0%) | 4,075 (100.0%) |
Real Estate Taxes by Mortgage Status in Hobbs
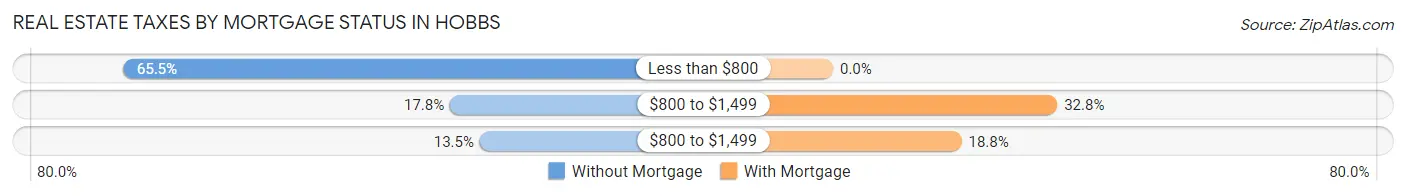
| Property Taxes | Without Mortgage | With Mortgage |
| Less than $800 | 2,776 (65.5%) | 0 (0.0%) |
| $800 to $1,499 | 756 (17.8%) | 1,335 (32.8%) |
| $800 to $1,499 | 572 (13.5%) | 765 (18.8%) |
| Total | 4,239 (100.0%) | 4,075 (100.0%) |
Health & Disability in Hobbs
Health Insurance Coverage by Age in Hobbs
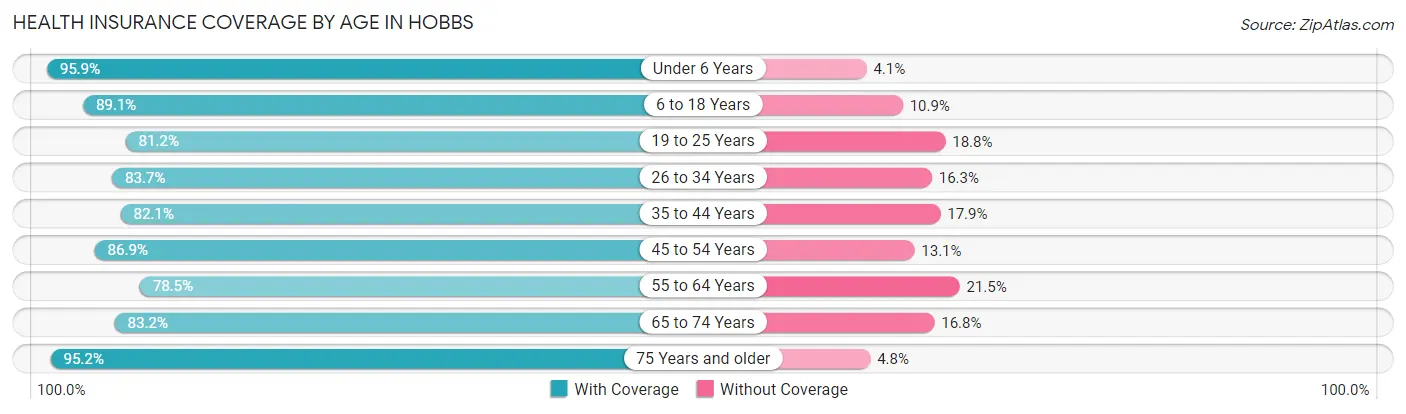
| Age Bracket | With Coverage | Without Coverage |
| Under 6 Years | 3,891 (95.9%) | 168 (4.1%) |
| 6 to 18 Years | 7,480 (89.1%) | 914 (10.9%) |
| 19 to 25 Years | 3,784 (81.2%) | 878 (18.8%) |
| 26 to 34 Years | 4,019 (83.7%) | 783 (16.3%) |
| 35 to 44 Years | 3,705 (82.1%) | 808 (17.9%) |
| 45 to 54 Years | 3,633 (86.9%) | 546 (13.1%) |
| 55 to 64 Years | 3,021 (78.5%) | 827 (21.5%) |
| 65 to 74 Years | 2,151 (83.2%) | 434 (16.8%) |
| 75 Years and older | 1,297 (95.2%) | 66 (4.8%) |
| Total | 32,981 (85.9%) | 5,424 (14.1%) |
Health Insurance Coverage by Citizenship Status in Hobbs
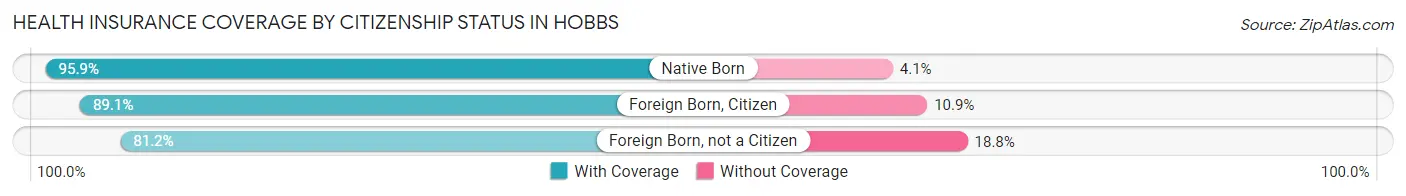
| Citizenship Status | With Coverage | Without Coverage |
| Native Born | 3,891 (95.9%) | 168 (4.1%) |
| Foreign Born, Citizen | 7,480 (89.1%) | 914 (10.9%) |
| Foreign Born, not a Citizen | 3,784 (81.2%) | 878 (18.8%) |
Health Insurance Coverage by Household Income in Hobbs
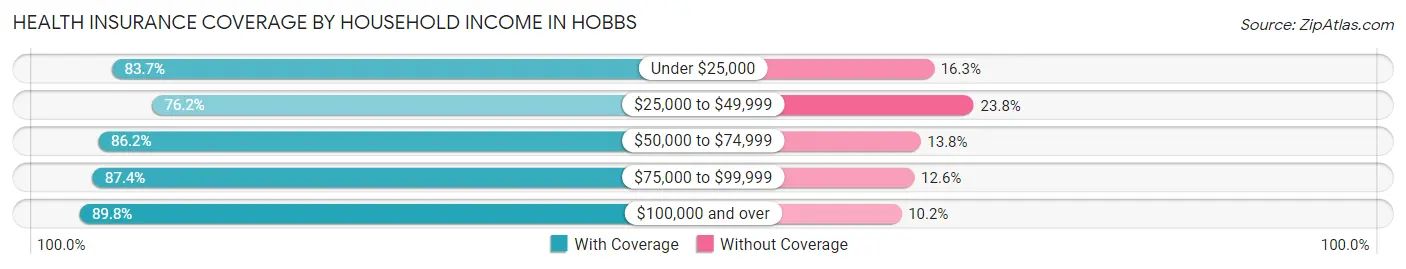
| Household Income | With Coverage | Without Coverage |
| Under $25,000 | 4,719 (83.7%) | 918 (16.3%) |
| $25,000 to $49,999 | 4,322 (76.2%) | 1,348 (23.8%) |
| $50,000 to $74,999 | 6,408 (86.2%) | 1,024 (13.8%) |
| $75,000 to $99,999 | 4,409 (87.4%) | 637 (12.6%) |
| $100,000 and over | 12,696 (89.8%) | 1,441 (10.2%) |
Public vs Private Health Insurance Coverage by Age in Hobbs
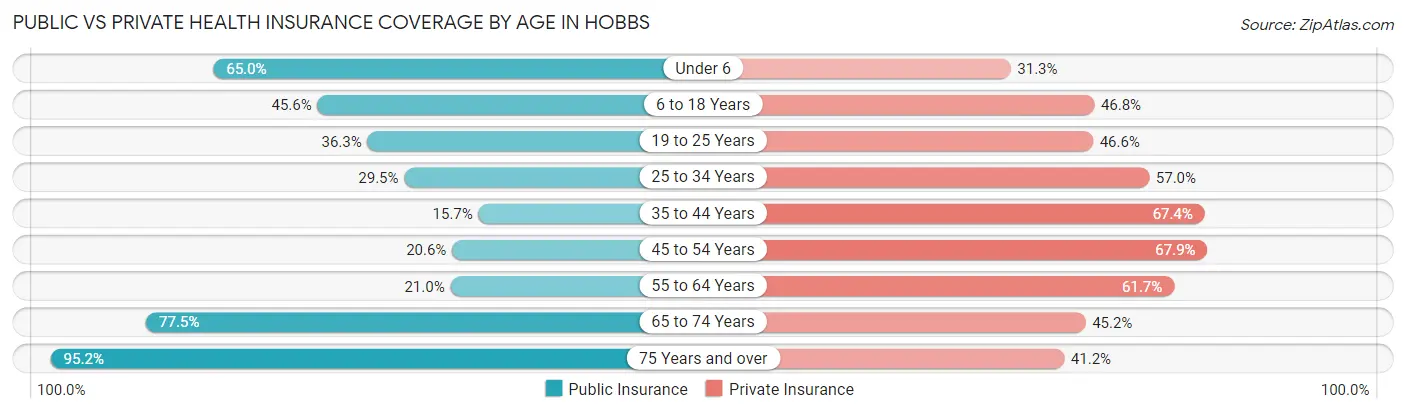
| Age Bracket | Public Insurance | Private Insurance |
| Under 6 | 2,637 (65.0%) | 1,270 (31.3%) |
| 6 to 18 Years | 3,829 (45.6%) | 3,928 (46.8%) |
| 19 to 25 Years | 1,694 (36.3%) | 2,171 (46.6%) |
| 25 to 34 Years | 1,417 (29.5%) | 2,737 (57.0%) |
| 35 to 44 Years | 710 (15.7%) | 3,040 (67.4%) |
| 45 to 54 Years | 862 (20.6%) | 2,836 (67.9%) |
| 55 to 64 Years | 806 (20.9%) | 2,373 (61.7%) |
| 65 to 74 Years | 2,002 (77.4%) | 1,168 (45.2%) |
| 75 Years and over | 1,297 (95.2%) | 562 (41.2%) |
| Total | 15,254 (39.7%) | 20,085 (52.3%) |
Disability Status by Sex by Age in Hobbs
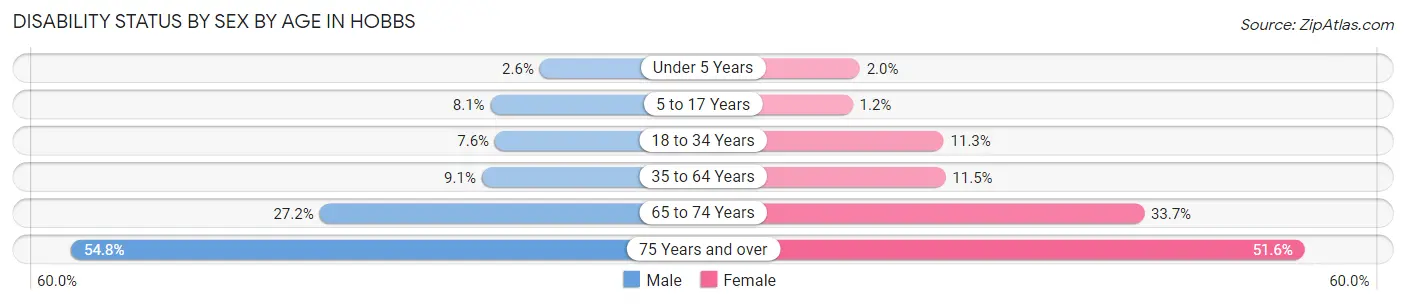
| Age Bracket | Male | Female |
| Under 5 Years | 47 (2.6%) | 31 (2.0%) |
| 5 to 17 Years | 350 (8.1%) | 49 (1.2%) |
| 18 to 34 Years | 410 (7.6%) | 545 (11.3%) |
| 35 to 64 Years | 573 (9.1%) | 719 (11.5%) |
| 65 to 74 Years | 330 (27.2%) | 461 (33.7%) |
| 75 Years and over | 358 (54.8%) | 366 (51.5%) |
Disability Class by Sex by Age in Hobbs
Disability Class: Hearing Difficulty
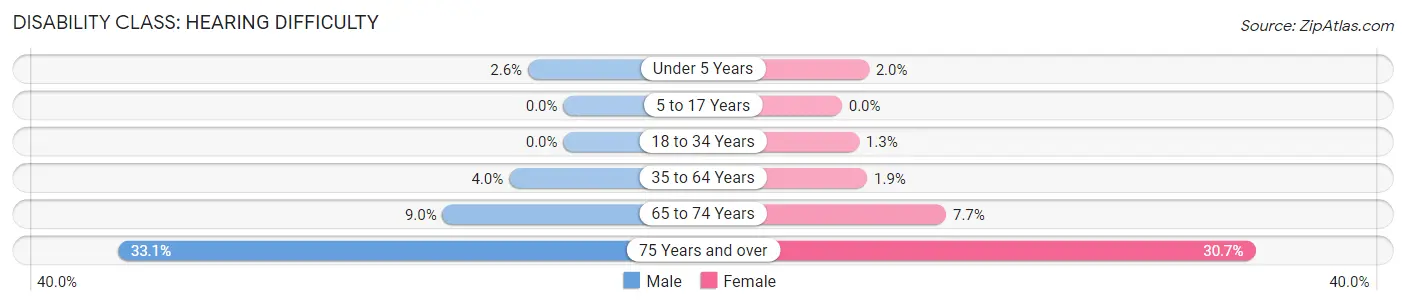
| Age Bracket | Male | Female |
| Under 5 Years | 47 (2.6%) | 31 (2.0%) |
| 5 to 17 Years | 0 (0.0%) | 0 (0.0%) |
| 18 to 34 Years | 0 (0.0%) | 61 (1.3%) |
| 35 to 64 Years | 254 (4.0%) | 117 (1.9%) |
| 65 to 74 Years | 109 (9.0%) | 106 (7.7%) |
| 75 Years and over | 216 (33.1%) | 218 (30.7%) |
Disability Class: Vision Difficulty
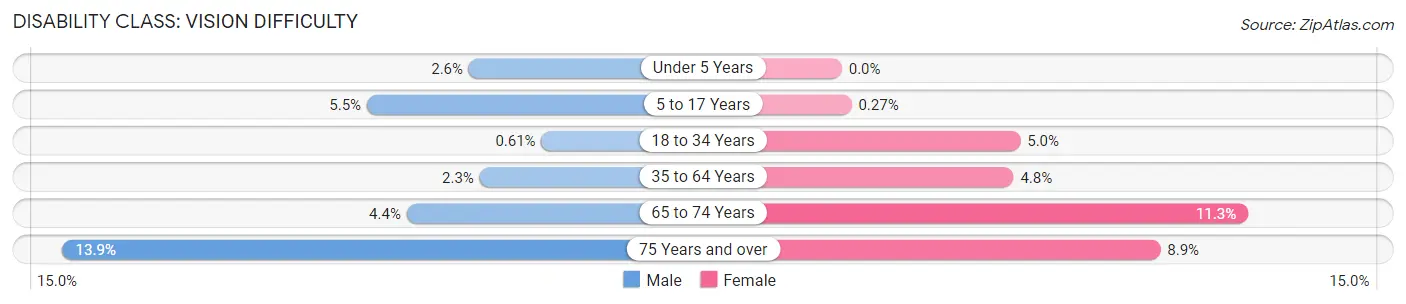
| Age Bracket | Male | Female |
| Under 5 Years | 47 (2.6%) | 0 (0.0%) |
| 5 to 17 Years | 236 (5.5%) | 11 (0.3%) |
| 18 to 34 Years | 33 (0.6%) | 239 (5.0%) |
| 35 to 64 Years | 147 (2.3%) | 298 (4.8%) |
| 65 to 74 Years | 53 (4.4%) | 155 (11.3%) |
| 75 Years and over | 91 (13.9%) | 63 (8.9%) |
Disability Class: Cognitive Difficulty
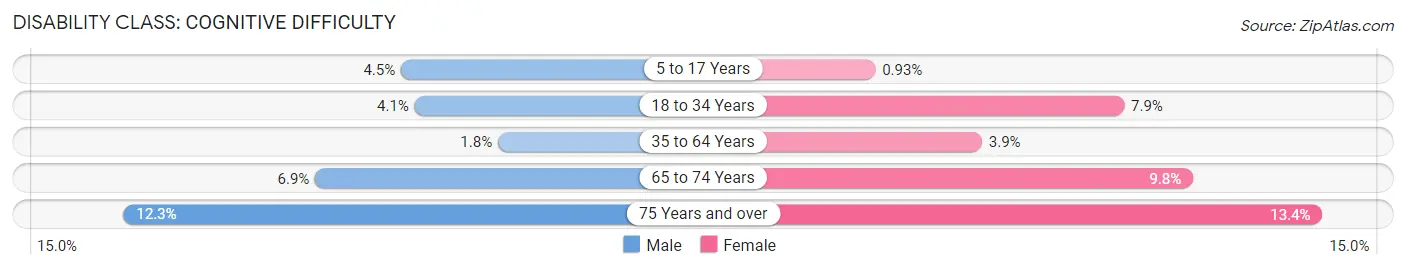
| Age Bracket | Male | Female |
| 5 to 17 Years | 195 (4.5%) | 38 (0.9%) |
| 18 to 34 Years | 223 (4.1%) | 378 (7.9%) |
| 35 to 64 Years | 115 (1.8%) | 243 (3.9%) |
| 65 to 74 Years | 84 (6.9%) | 134 (9.8%) |
| 75 Years and over | 80 (12.2%) | 95 (13.4%) |
Disability Class: Ambulatory Difficulty
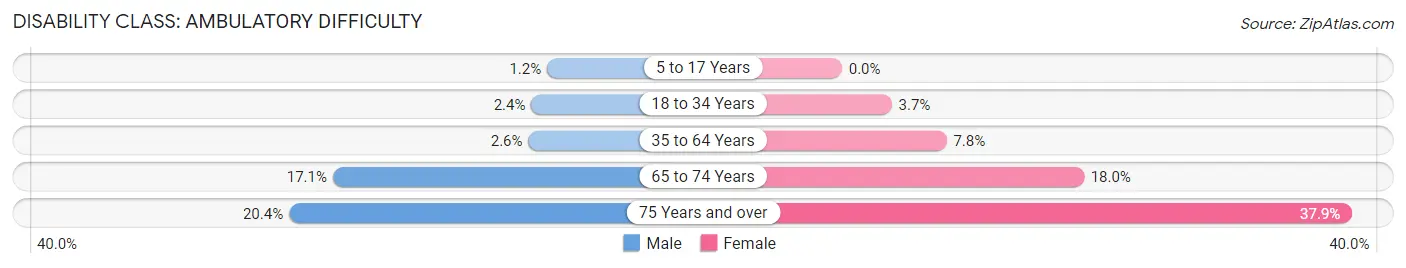
| Age Bracket | Male | Female |
| 5 to 17 Years | 52 (1.2%) | 0 (0.0%) |
| 18 to 34 Years | 128 (2.4%) | 178 (3.7%) |
| 35 to 64 Years | 164 (2.6%) | 484 (7.8%) |
| 65 to 74 Years | 208 (17.1%) | 246 (18.0%) |
| 75 Years and over | 133 (20.4%) | 269 (37.9%) |
Disability Class: Self-Care Difficulty
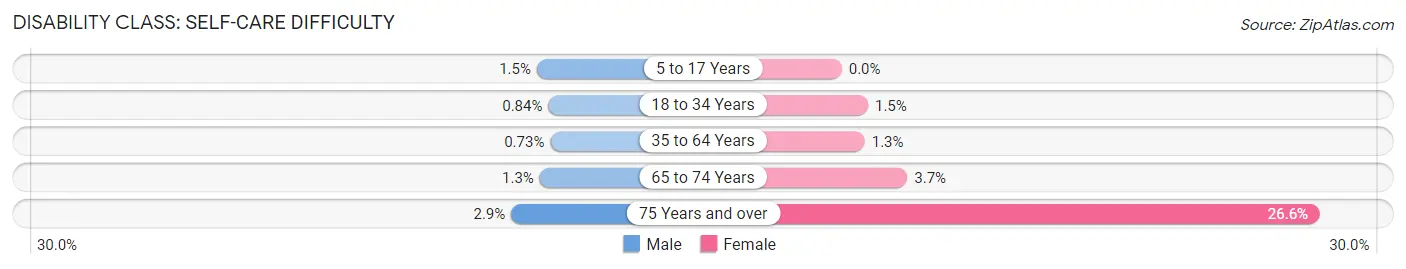
| Age Bracket | Male | Female |
| 5 to 17 Years | 64 (1.5%) | 0 (0.0%) |
| 18 to 34 Years | 45 (0.8%) | 70 (1.5%) |
| 35 to 64 Years | 46 (0.7%) | 80 (1.3%) |
| 65 to 74 Years | 16 (1.3%) | 50 (3.6%) |
| 75 Years and over | 19 (2.9%) | 189 (26.6%) |
Technology Access in Hobbs
Computing Device Access in Hobbs
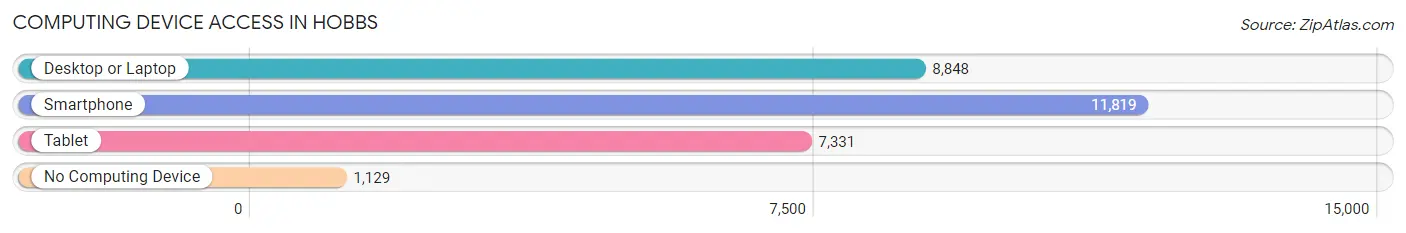
| Device Type | # Households | % Households |
| Desktop or Laptop | 8,848 | 65.4% |
| Smartphone | 11,819 | 87.3% |
| Tablet | 7,331 | 54.2% |
| No Computing Device | 1,129 | 8.3% |
| Total | 13,533 | 100.0% |
Internet Access in Hobbs
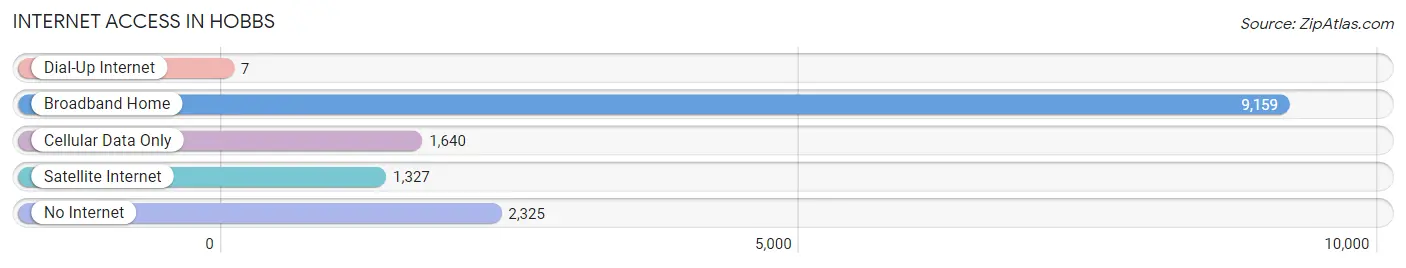
| Internet Type | # Households | % Households |
| Dial-Up Internet | 7 | 0.1% |
| Broadband Home | 9,159 | 67.7% |
| Cellular Data Only | 1,640 | 12.1% |
| Satellite Internet | 1,327 | 9.8% |
| No Internet | 2,325 | 17.2% |
| Total | 13,533 | 100.0% |
Hobbs Summary
Hobbs is a city located in Lea County, New Mexico, United States. It is the county seat of Lea County and is located in the southeastern corner of the state. The city is named after James Hobbs, a former mayor of El Paso, Texas. As of the 2010 census, the city had a population of 34,122, making it the tenth-largest city in New Mexico.
Geography
Hobbs is located at 32°45′N 103°12′W (32.75, -103.20). According to the United States Census Bureau, the city has a total area of 24.2 square miles (62.7 km2), of which 24.1 square miles (62.4 km2) is land and 0.1 square miles (0.3 km2) (0.41%) is water.
Hobbs is located in the southeastern corner of New Mexico, near the Texas border. It is approximately 30 miles (48 km) west of the Texas city of Lubbock and approximately 50 miles (80 km) south of the Texas city of Midland.
Economy
Hobbs is the economic center of Lea County and the surrounding region. The city is home to a variety of industries, including oil and gas production, manufacturing, agriculture, and retail.
The city is home to several major employers, including the University of the Southwest, Lea Regional Medical Center, and the Lea County Correctional Facility. The city is also home to several oil and gas production companies, including Chevron, ConocoPhillips, and Occidental Petroleum.
The city is also home to several retail stores including Walmart Lowe s and Target
Demographics
As of the 2010 census, there were 34,122 people, 11,945 households, and 8,717 families residing in the city. The population density was 1,417.3 people per square mile (546.7/km2). There were 13,072 housing units at an average density of 541.2 per square mile (209.2/km2). The racial makeup of the city was 68.2% White, 2.2% African American, 1.2% Native American, 0.7% Asian, 0.1% Pacific Islander, 25.2% from other races, and 2.6% from two or more races. Hispanic or Latino of any race were 51.2% of the population.
There were 11,945 households, out of which 37.2% had children under the age of 18 living with them, 48.2% were married couples living together, 16.7% had a female householder with no husband present, and 29.2% were non-families. 24.2% of all households were made up of individuals, and 9.2% had someone living alone who was 65 years of age or older. The average household size was 2.78 and the average family size was 3.31.
In the city, the population was spread out, with 30.2% under the age of 18, 10.3% from 18 to 24, 27.2% from 25 to 44, 20.2% from 45 to 64, and 12.1% who were 65 years of age or older. The median age was 32 years. For every 100 females, there were 95.2 males. For every 100 females age 18 and over, there were 91.2 males.
The median income for a household in the city was $30,945, and the median income for a family was $35,945. Males had a median income of $30,945 versus $21,945 for females. The per capita income for the city was $15,945. About 16.2% of families and 19.2% of the population were below the poverty line, including 25.2% of those under age 18 and 11.2% of those age 65 or over.
Common Questions
What is Per Capita Income in Hobbs?
Per Capita income in Hobbs is $30,660.
What is the Median Family Income in Hobbs?
Median Family Income in Hobbs is $76,593.
What is the Median Household income in Hobbs?
Median Household Income in Hobbs is $63,804.
What is Income or Wage Gap in Hobbs?
Income or Wage Gap in Hobbs is 46.7%.
Women in Hobbs earn 53.3 cents for every dollar earned by a man.
What is Family Income Deficit in Hobbs?
Family Income Deficit in Hobbs is $12,173.
Families that are below poverty line in Hobbs earn $12,173 less on average than the poverty threshold level.
What is Inequality or Gini Index in Hobbs?
Inequality or Gini Index in Hobbs is 0.49.
What is the Total Population of Hobbs?
Total Population of Hobbs is 39,782.
What is the Total Male Population of Hobbs?
Total Male Population of Hobbs is 20,898.
What is the Total Female Population of Hobbs?
Total Female Population of Hobbs is 18,884.
What is the Ratio of Males per 100 Females in Hobbs?
There are 110.67 Males per 100 Females in Hobbs.
What is the Ratio of Females per 100 Males in Hobbs?
There are 90.36 Females per 100 Males in Hobbs.
What is the Median Population Age in Hobbs?
Median Population Age in Hobbs is 30.8 Years.
What is the Average Family Size in Hobbs
Average Family Size in Hobbs is 3.4 People.
What is the Average Household Size in Hobbs
Average Household Size in Hobbs is 2.8 People.
How Large is the Labor Force in Hobbs?
There are 18,729 People in the Labor Forcein in Hobbs.
What is the Percentage of People in the Labor Force in Hobbs?
63.8% of People are in the Labor Force in Hobbs.
What is the Unemployment Rate in Hobbs?
Unemployment Rate in Hobbs is 7.4%.