Socorro, NM Map & Demographics
Socorro Map
Socorro Overview
$24,929
PER CAPITA INCOME
$60,769
AVG FAMILY INCOME
$42,622
AVG HOUSEHOLD INCOME
14.1%
WAGE / INCOME GAP [ % ]
85.9¢/ $1
WAGE / INCOME GAP [ $ ]
$7,486
FAMILY INCOME DEFICIT
0.49
INEQUALITY / GINI INDEX
8,605
TOTAL POPULATION
4,317
MALE POPULATION
4,288
FEMALE POPULATION
100.68
MALES / 100 FEMALES
99.33
FEMALES / 100 MALES
36.4
MEDIAN AGE
4.0
AVG FAMILY SIZE
3.0
AVG HOUSEHOLD SIZE
3,293
LABOR FORCE [ PEOPLE ]
45.4%
PERCENT IN LABOR FORCE
3.0%
UNEMPLOYMENT RATE
Socorro Zip Codes
Socorro Area Codes
Income in Socorro
Income Overview in Socorro
Per Capita Income in Socorro is $24,929, while median incomes of families and households are $60,769 and $42,622 respectively.
| Characteristic | Number | Measure |
| Per Capita Income | 8,605 | $24,929 |
| Median Family Income | 1,536 | $60,769 |
| Mean Family Income | 1,536 | $84,467 |
| Median Household Income | 2,694 | $42,622 |
| Mean Household Income | 2,694 | $65,649 |
| Income Deficit | 1,536 | $7,486 |
| Wage / Income Gap (%) | 8,605 | 14.14% |
| Wage / Income Gap ($) | 8,605 | 85.86¢ per $1 |
| Gini / Inequality Index | 8,605 | 0.49 |
Earnings by Sex in Socorro
Average Earnings in Socorro are $29,149, $26,480 for men and $30,841 for women, a difference of 14.1%.
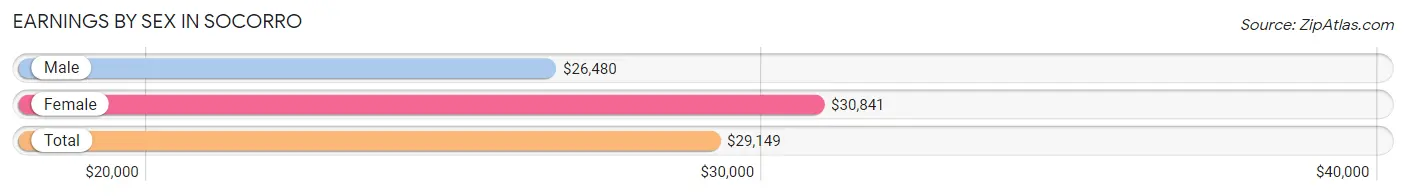
| Sex | Number | Average Earnings |
| Male | 1,971 (52.3%) | $26,480 |
| Female | 1,795 (47.7%) | $30,841 |
| Total | 3,766 (100.0%) | $29,149 |
Earnings by Sex by Income Bracket in Socorro
The most common earnings brackets in Socorro are $2,499 or less for men (281 | 14.3%) and $55,000 to $64,999 for women (163 | 9.1%).
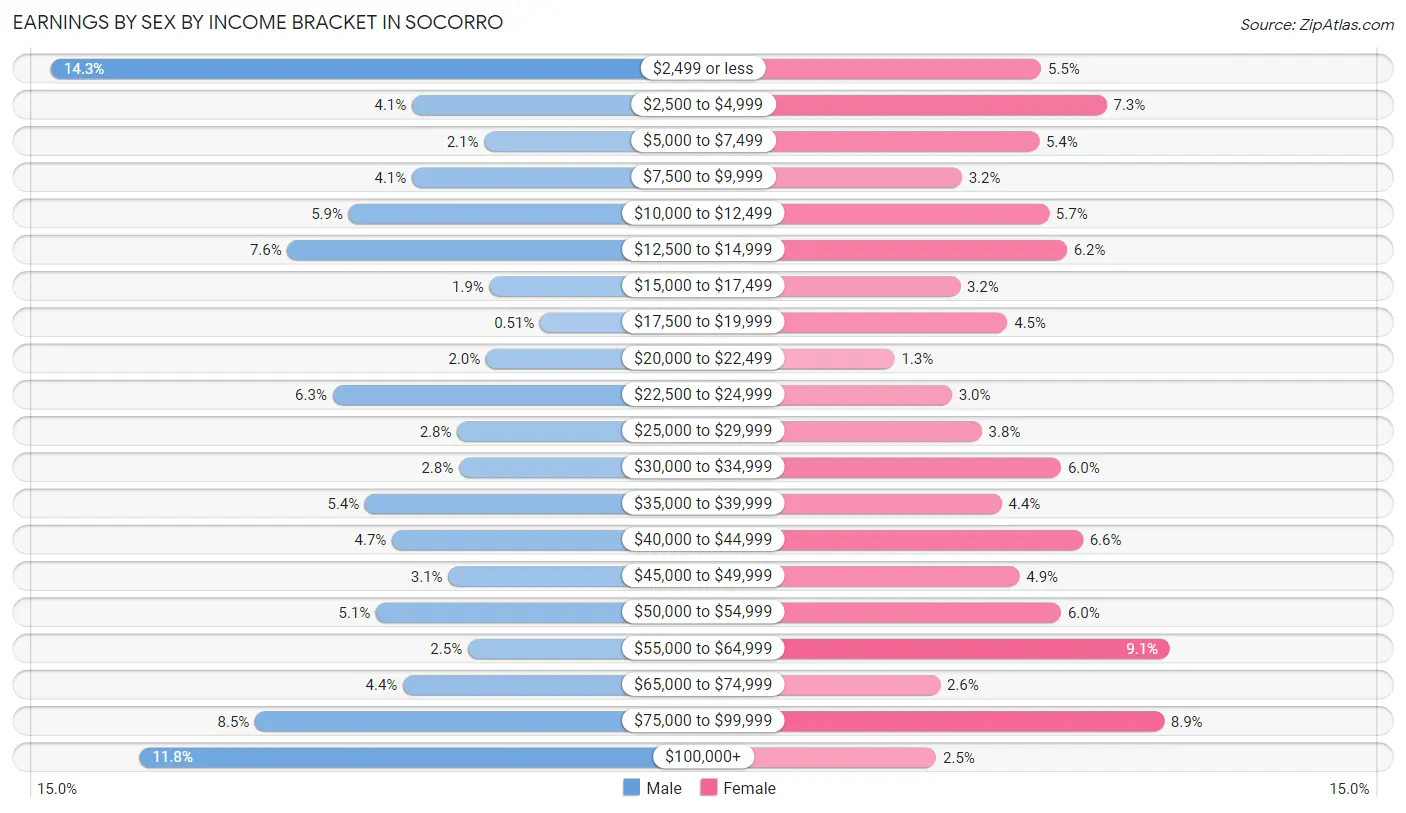
| Income | Male | Female |
| $2,499 or less | 281 (14.3%) | 98 (5.5%) |
| $2,500 to $4,999 | 81 (4.1%) | 131 (7.3%) |
| $5,000 to $7,499 | 41 (2.1%) | 97 (5.4%) |
| $7,500 to $9,999 | 81 (4.1%) | 58 (3.2%) |
| $10,000 to $12,499 | 116 (5.9%) | 102 (5.7%) |
| $12,500 to $14,999 | 150 (7.6%) | 111 (6.2%) |
| $15,000 to $17,499 | 38 (1.9%) | 57 (3.2%) |
| $17,500 to $19,999 | 10 (0.5%) | 81 (4.5%) |
| $20,000 to $22,499 | 40 (2.0%) | 24 (1.3%) |
| $22,500 to $24,999 | 125 (6.3%) | 53 (2.9%) |
| $25,000 to $29,999 | 56 (2.8%) | 68 (3.8%) |
| $30,000 to $34,999 | 55 (2.8%) | 108 (6.0%) |
| $35,000 to $39,999 | 107 (5.4%) | 78 (4.3%) |
| $40,000 to $44,999 | 92 (4.7%) | 119 (6.6%) |
| $45,000 to $49,999 | 61 (3.1%) | 87 (4.9%) |
| $50,000 to $54,999 | 101 (5.1%) | 108 (6.0%) |
| $55,000 to $64,999 | 50 (2.5%) | 163 (9.1%) |
| $65,000 to $74,999 | 86 (4.4%) | 47 (2.6%) |
| $75,000 to $99,999 | 168 (8.5%) | 160 (8.9%) |
| $100,000+ | 232 (11.8%) | 45 (2.5%) |
| Total | 1,971 (100.0%) | 1,795 (100.0%) |
Earnings by Sex by Educational Attainment in Socorro
Average earnings in Socorro are $49,548 for men and $43,384 for women, a difference of 12.4%. Men with an educational attainment of graduate degree enjoy the highest average annual earnings of $101,544, while those with college or associate's degree education earn the least with $31,979. Women with an educational attainment of graduate degree earn the most with the average annual earnings of $67,105, while those with less than high school education have the smallest earnings of $15,066.
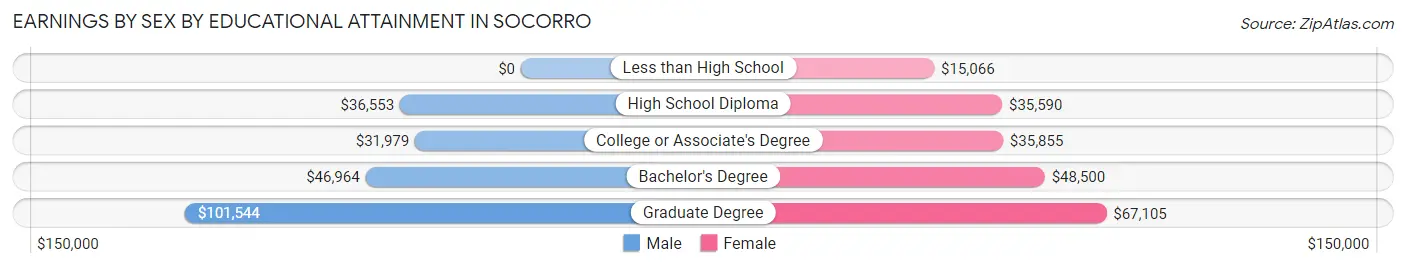
| Educational Attainment | Male Income | Female Income |
| Less than High School | - | - |
| High School Diploma | $36,553 | $35,590 |
| College or Associate's Degree | $31,979 | $35,855 |
| Bachelor's Degree | $46,964 | $48,500 |
| Graduate Degree | $101,544 | $67,105 |
| Total | $49,548 | $43,384 |
Family Income in Socorro
Family Income Brackets in Socorro
According to the Socorro family income data, there are 235 families falling into the $25,000 to $34,999 income range, which is the most common income bracket and makes up 15.3% of all families. Conversely, the less than $10,000 income bracket is the least frequent group with only 8 families (0.5%) belonging to this category.
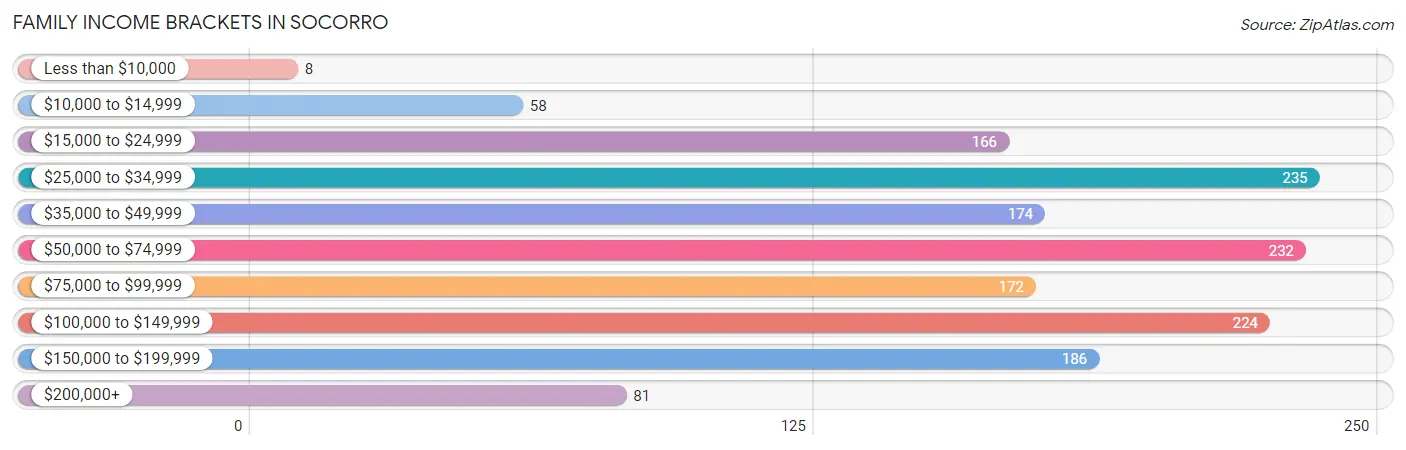
| Income Bracket | # Families | % Families |
| Less than $10,000 | 8 | 0.5% |
| $10,000 to $14,999 | 58 | 3.8% |
| $15,000 to $24,999 | 166 | 10.8% |
| $25,000 to $34,999 | 235 | 15.3% |
| $35,000 to $49,999 | 174 | 11.3% |
| $50,000 to $74,999 | 232 | 15.1% |
| $75,000 to $99,999 | 172 | 11.2% |
| $100,000 to $149,999 | 224 | 14.6% |
| $150,000 to $199,999 | 186 | 12.1% |
| $200,000+ | 81 | 5.3% |
Family Income by Famaliy Size in Socorro
4-person families (291 | 19.0%) account for the highest median family income in Socorro with $91,250 per family, while 2-person families (732 | 47.7%) have the highest median income of $29,716 per family member.
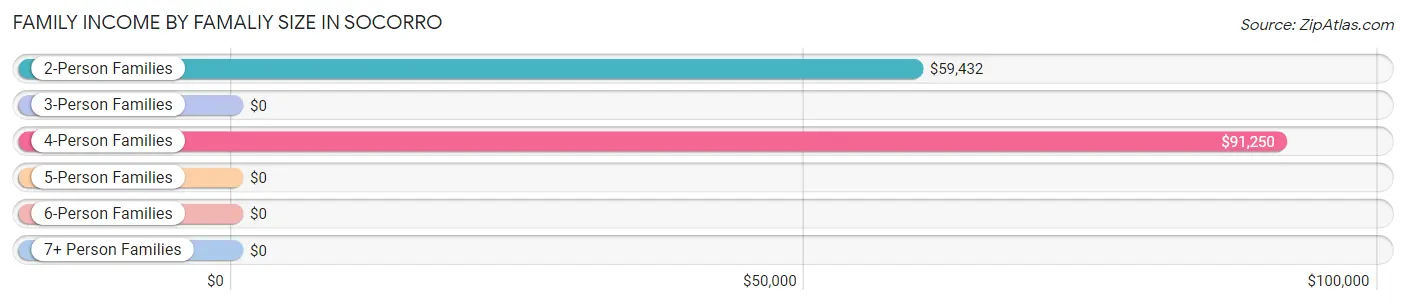
| Income Bracket | # Families | Median Income |
| 2-Person Families | 732 (47.7%) | $59,432 |
| 3-Person Families | 429 (27.9%) | $0 |
| 4-Person Families | 291 (19.0%) | $91,250 |
| 5-Person Families | 73 (4.8%) | $0 |
| 6-Person Families | 5 (0.3%) | $0 |
| 7+ Person Families | 6 (0.4%) | $0 |
| Total | 1,536 (100.0%) | $60,769 |
Family Income by Number of Earners in Socorro
The median family income in Socorro is $60,769, with families comprising 3+ earners (91) having the highest median family income of $136,250, while families with no earners (363) have the lowest median family income of $24,542, accounting for 5.9% and 23.6% of families, respectively.
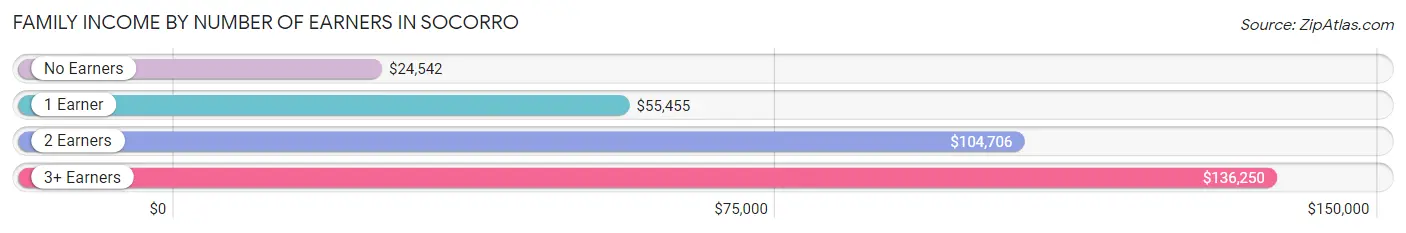
| Number of Earners | # Families | Median Income |
| No Earners | 363 (23.6%) | $24,542 |
| 1 Earner | 536 (34.9%) | $55,455 |
| 2 Earners | 546 (35.5%) | $104,706 |
| 3+ Earners | 91 (5.9%) | $136,250 |
| Total | 1,536 (100.0%) | $60,769 |
Household Income in Socorro
Household Income Brackets in Socorro
With 396 households falling in the category, the $15,000 to $24,999 income range is the most frequent in Socorro, accounting for 14.7% of all households. In contrast, only 108 households (4.0%) fall into the $200,000+ income bracket, making it the least populous group.
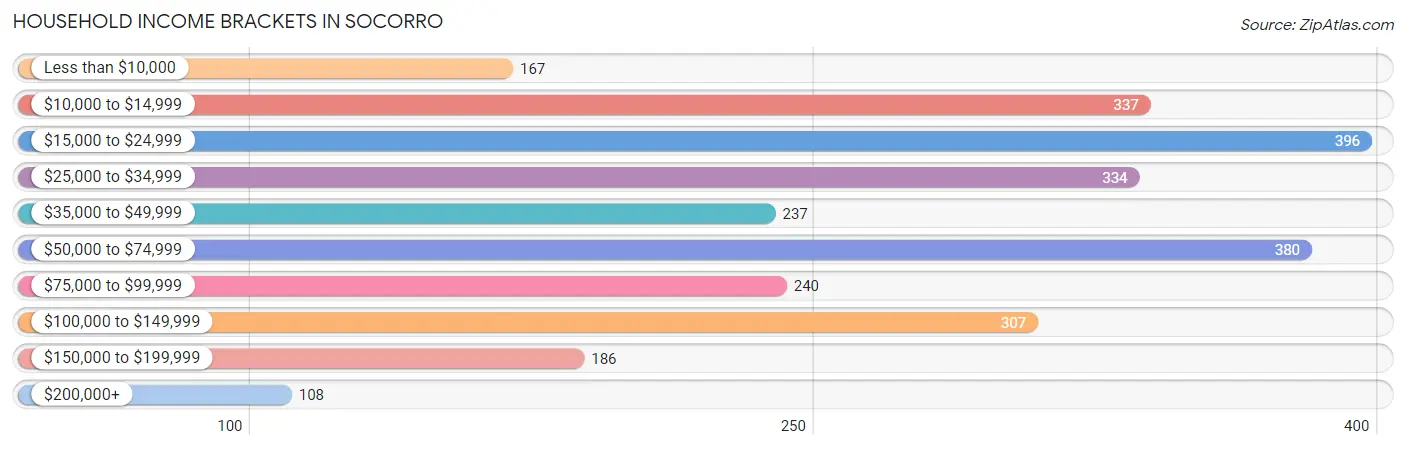
| Income Bracket | # Households | % Households |
| Less than $10,000 | 167 | 6.2% |
| $10,000 to $14,999 | 337 | 12.5% |
| $15,000 to $24,999 | 396 | 14.7% |
| $25,000 to $34,999 | 334 | 12.4% |
| $35,000 to $49,999 | 237 | 8.8% |
| $50,000 to $74,999 | 380 | 14.1% |
| $75,000 to $99,999 | 240 | 8.9% |
| $100,000 to $149,999 | 307 | 11.4% |
| $150,000 to $199,999 | 186 | 6.9% |
| $200,000+ | 108 | 4.0% |
Household Income by Householder Age in Socorro
The median household income in Socorro is $42,622, with the highest median household income of $77,115 found in the 25 to 44 years age bracket for the primary householder. A total of 622 households (23.1%) fall into this category. Meanwhile, the 15 to 24 years age bracket for the primary householder has the lowest median household income of $27,228, with 113 households (4.2%) in this group.
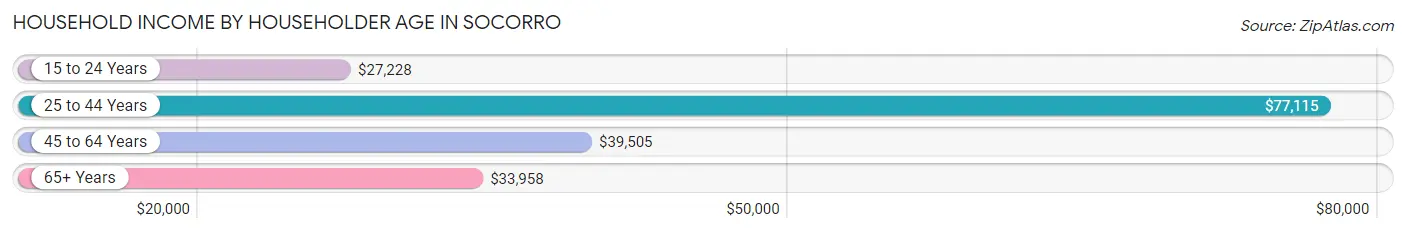
| Income Bracket | # Households | Median Income |
| 15 to 24 Years | 113 (4.2%) | $27,228 |
| 25 to 44 Years | 622 (23.1%) | $77,115 |
| 45 to 64 Years | 1,001 (37.2%) | $39,505 |
| 65+ Years | 958 (35.6%) | $33,958 |
| Total | 2,694 (100.0%) | $42,622 |
Poverty in Socorro
Income Below Poverty by Sex and Age in Socorro
With 26.1% poverty level for males and 18.9% for females among the residents of Socorro, 25 to 34 year old males and 18 to 24 year old females are the most vulnerable to poverty, with 217 males (56.5%) and 180 females (36.4%) in their respective age groups living below the poverty level.
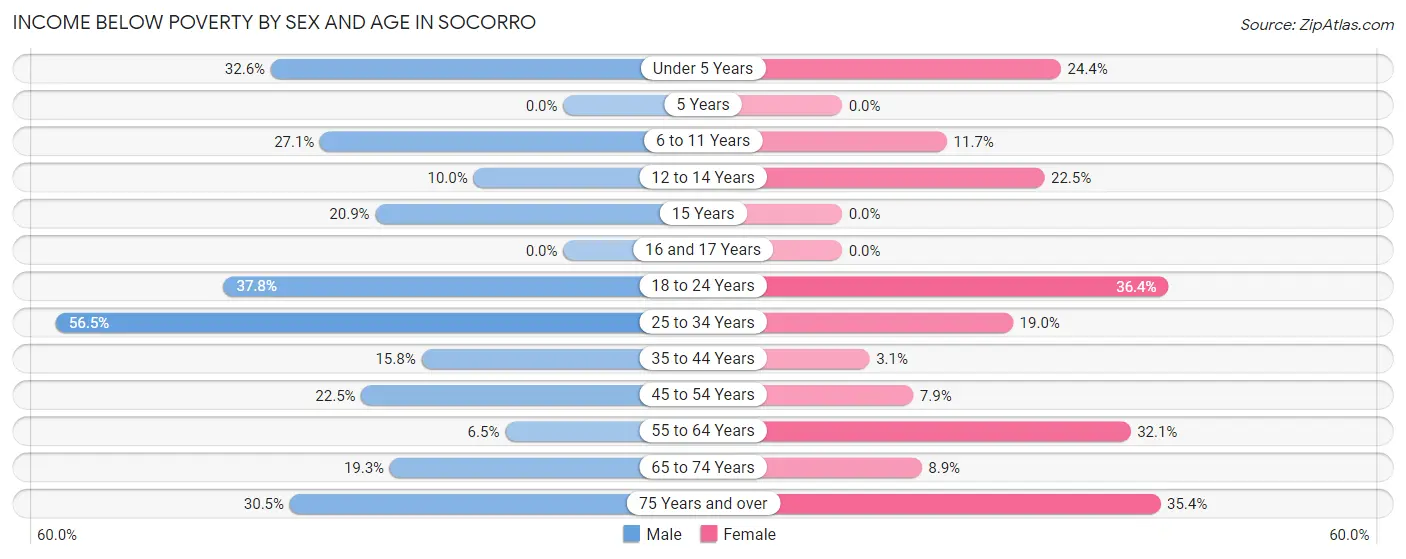
| Age Bracket | Male | Female |
| Under 5 Years | 99 (32.6%) | 29 (24.4%) |
| 5 Years | 0 (0.0%) | 0 (0.0%) |
| 6 to 11 Years | 52 (27.1%) | 48 (11.7%) |
| 12 to 14 Years | 7 (10.0%) | 34 (22.5%) |
| 15 Years | 9 (20.9%) | 0 (0.0%) |
| 16 and 17 Years | 0 (0.0%) | 0 (0.0%) |
| 18 to 24 Years | 280 (37.8%) | 180 (36.4%) |
| 25 to 34 Years | 217 (56.5%) | 110 (19.0%) |
| 35 to 44 Years | 85 (15.8%) | 13 (3.0%) |
| 45 to 54 Years | 112 (22.5%) | 29 (7.9%) |
| 55 to 64 Years | 28 (6.5%) | 159 (32.1%) |
| 65 to 74 Years | 100 (19.3%) | 52 (8.9%) |
| 75 Years and over | 60 (30.5%) | 112 (35.4%) |
| Total | 1,049 (26.1%) | 766 (18.9%) |
Income Above Poverty by Sex and Age in Socorro
According to the poverty statistics in Socorro, males aged 5 years and females aged 5 years are the age groups that are most secure financially, with 100.0% of males and 100.0% of females in these age groups living above the poverty line.
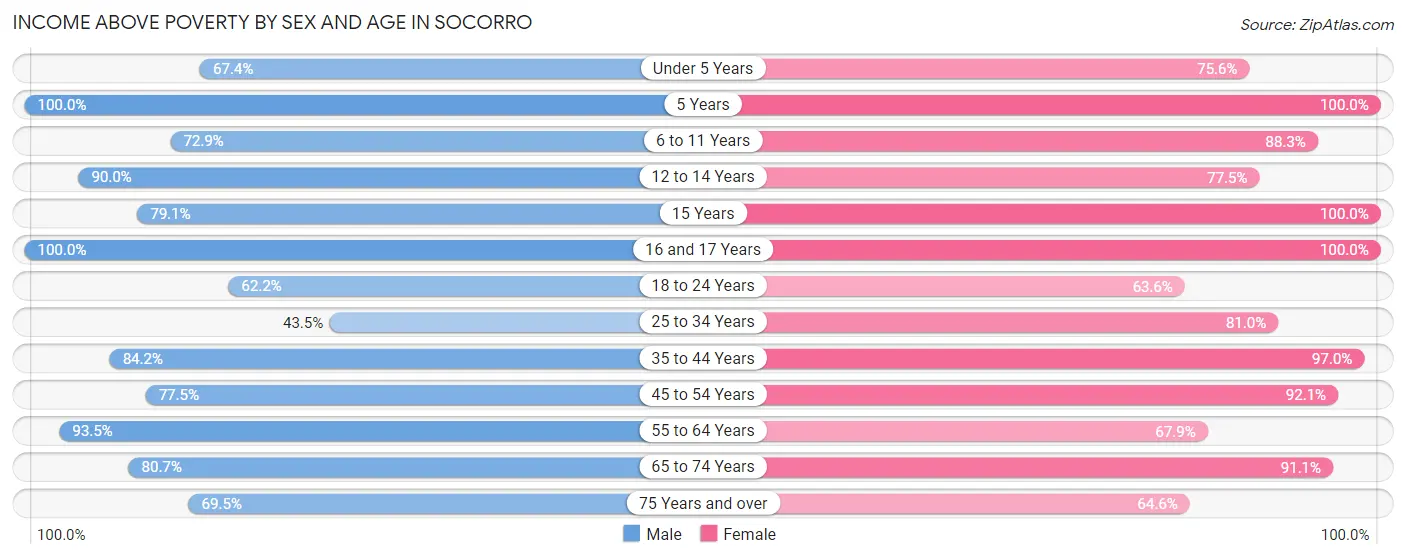
| Age Bracket | Male | Female |
| Under 5 Years | 205 (67.4%) | 90 (75.6%) |
| 5 Years | 26 (100.0%) | 7 (100.0%) |
| 6 to 11 Years | 140 (72.9%) | 363 (88.3%) |
| 12 to 14 Years | 63 (90.0%) | 117 (77.5%) |
| 15 Years | 34 (79.1%) | 29 (100.0%) |
| 16 and 17 Years | 83 (100.0%) | 70 (100.0%) |
| 18 to 24 Years | 460 (62.2%) | 315 (63.6%) |
| 25 to 34 Years | 167 (43.5%) | 468 (81.0%) |
| 35 to 44 Years | 453 (84.2%) | 413 (97.0%) |
| 45 to 54 Years | 386 (77.5%) | 337 (92.1%) |
| 55 to 64 Years | 405 (93.5%) | 336 (67.9%) |
| 65 to 74 Years | 418 (80.7%) | 535 (91.1%) |
| 75 Years and over | 137 (69.5%) | 204 (64.6%) |
| Total | 2,977 (73.9%) | 3,284 (81.1%) |
Income Below Poverty Among Married-Couple Families in Socorro
The poverty statistics for married-couple families in Socorro show that 7.9% or 87 of the total 1,102 families live below the poverty line. Families with 3 or 4 children have the highest poverty rate of 100.0%, comprising of 10 families. On the other hand, families with 1 or 2 children have the lowest poverty rate of 2.7%, which includes 13 families.
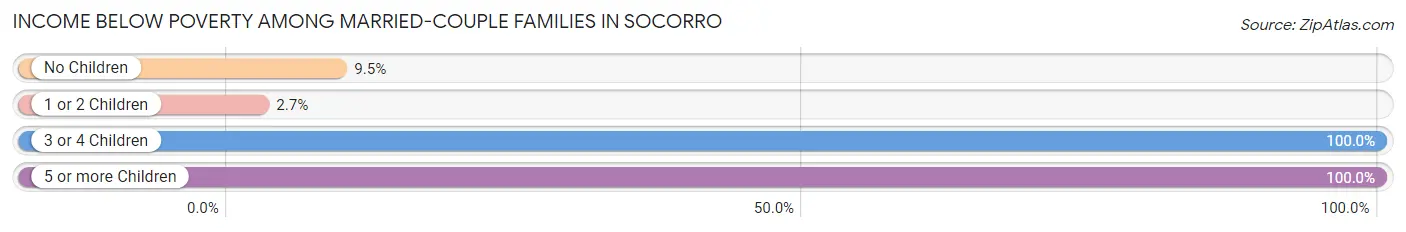
| Children | Above Poverty | Below Poverty |
| No Children | 551 (90.5%) | 58 (9.5%) |
| 1 or 2 Children | 464 (97.3%) | 13 (2.7%) |
| 3 or 4 Children | 0 (0.0%) | 10 (100.0%) |
| 5 or more Children | 0 (0.0%) | 6 (100.0%) |
| Total | 1,015 (92.1%) | 87 (7.9%) |
Income Below Poverty Among Single-Parent Households in Socorro
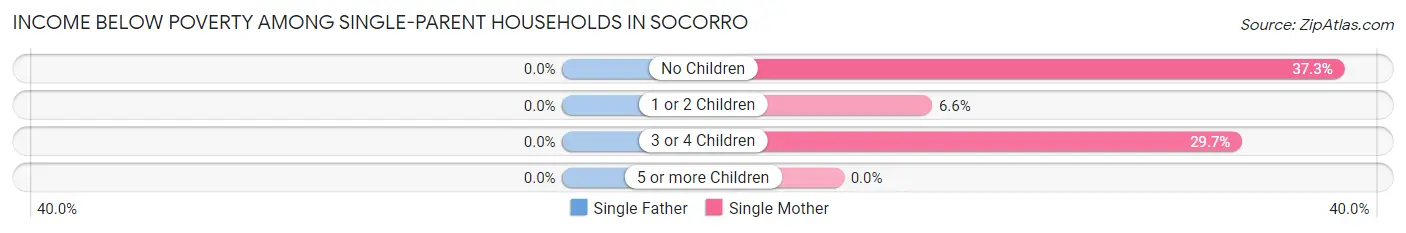
| Children | Single Father | Single Mother |
| No Children | 0 (0.0%) | 50 (37.3%) |
| 1 or 2 Children | 0 (0.0%) | 5 (6.6%) |
| 3 or 4 Children | 0 (0.0%) | 19 (29.7%) |
| 5 or more Children | 0 (0.0%) | 0 (0.0%) |
| Total | 0 (0.0%) | 74 (27.0%) |
Income Below Poverty Among Married-Couple vs Single-Parent Households in Socorro
The poverty data for Socorro shows that 87 of the married-couple family households (7.9%) and 74 of the single-parent households (17.1%) are living below the poverty level. Within the married-couple family households, those with 3 or 4 children have the highest poverty rate, with 10 households (100.0%) falling below the poverty line. Among the single-parent households, those with 3 or 4 children have the highest poverty rate, with 19 household (29.7%) living below poverty.
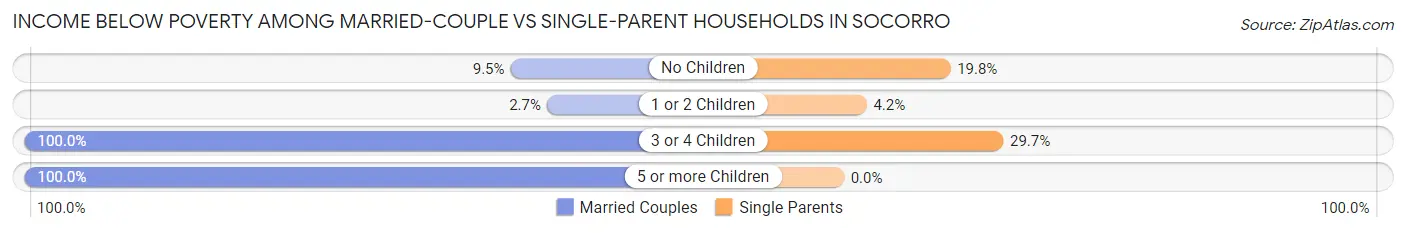
| Children | Married-Couple Families | Single-Parent Households |
| No Children | 58 (9.5%) | 50 (19.8%) |
| 1 or 2 Children | 13 (2.7%) | 5 (4.2%) |
| 3 or 4 Children | 10 (100.0%) | 19 (29.7%) |
| 5 or more Children | 6 (100.0%) | 0 (0.0%) |
| Total | 87 (7.9%) | 74 (17.1%) |
Race in Socorro
The most populous races in Socorro are White / Caucasian (5,651 | 65.7%), Hispanic or Latino (4,052 | 47.1%), and Two or more Races (1,550 | 18.0%).
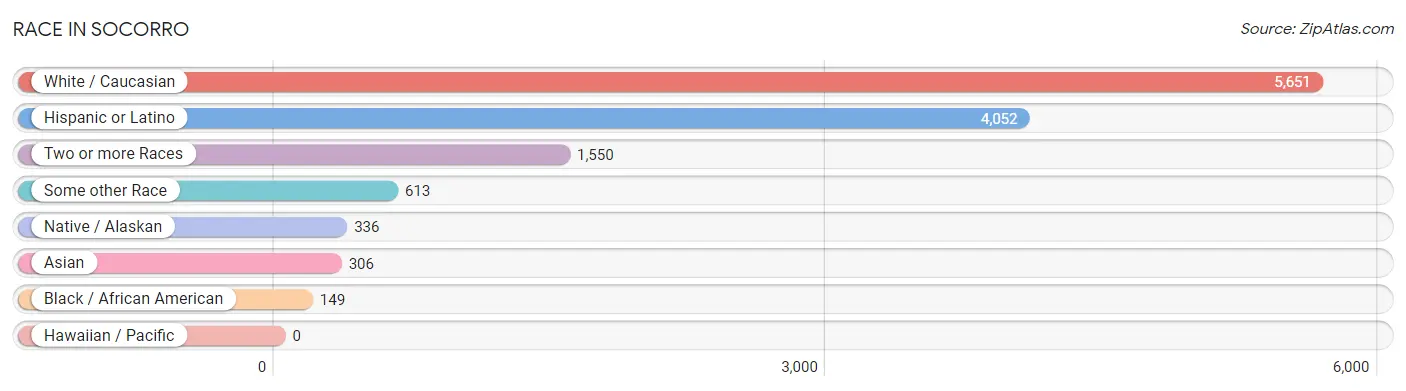
| Race | # Population | % Population |
| Asian | 306 | 3.6% |
| Black / African American | 149 | 1.7% |
| Hawaiian / Pacific | 0 | 0.0% |
| Hispanic or Latino | 4,052 | 47.1% |
| Native / Alaskan | 336 | 3.9% |
| White / Caucasian | 5,651 | 65.7% |
| Two or more Races | 1,550 | 18.0% |
| Some other Race | 613 | 7.1% |
| Total | 8,605 | 100.0% |
Ancestry in Socorro
The most populous ancestries reported in Socorro are Mexican (1,810 | 21.0%), American (843 | 9.8%), German (761 | 8.8%), English (656 | 7.6%), and Irish (441 | 5.1%), together accounting for 52.4% of all Socorro residents.
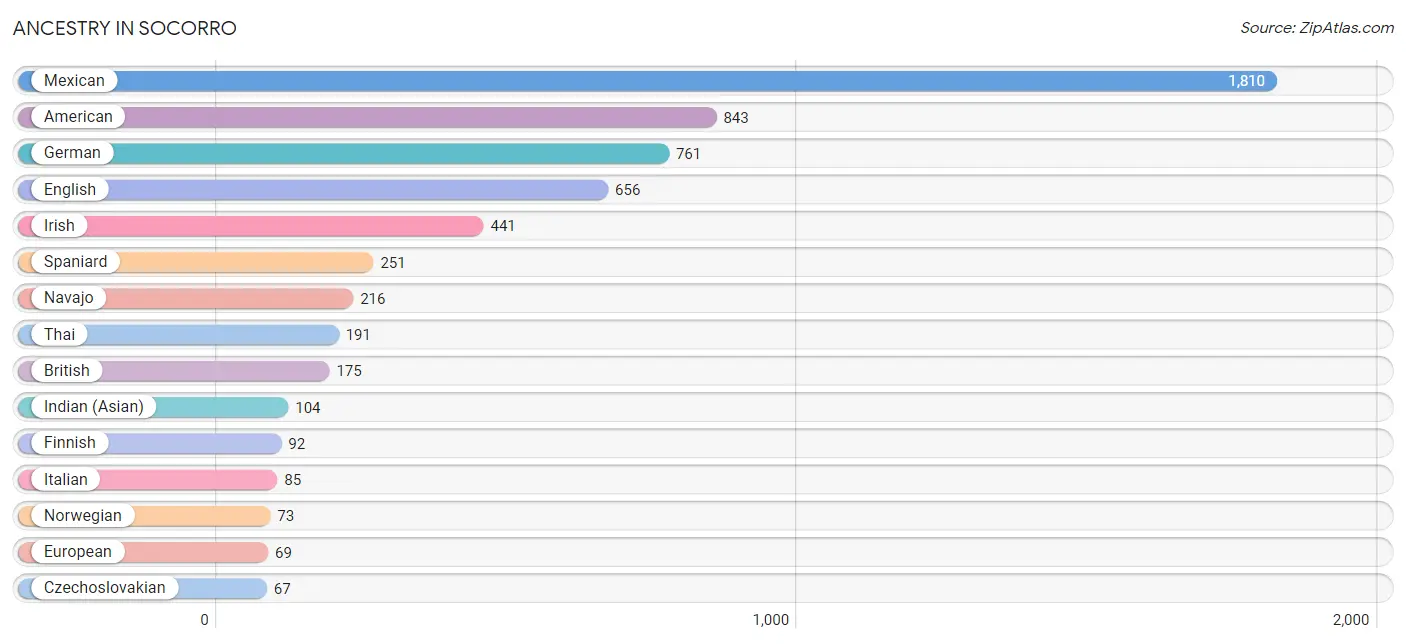
| Ancestry | # Population | % Population |
| American | 843 | 9.8% |
| Arab | 11 | 0.1% |
| Basque | 6 | 0.1% |
| Bhutanese | 11 | 0.1% |
| Brazilian | 23 | 0.3% |
| British | 175 | 2.0% |
| Burmese | 11 | 0.1% |
| Canadian | 23 | 0.3% |
| Cherokee | 7 | 0.1% |
| Choctaw | 64 | 0.7% |
| Colombian | 35 | 0.4% |
| Croatian | 6 | 0.1% |
| Cuban | 6 | 0.1% |
| Czechoslovakian | 67 | 0.8% |
| Danish | 18 | 0.2% |
| Dutch | 13 | 0.2% |
| Eastern European | 49 | 0.6% |
| English | 656 | 7.6% |
| European | 69 | 0.8% |
| Finnish | 92 | 1.1% |
| French | 13 | 0.2% |
| French Canadian | 1 | 0.0% |
| German | 761 | 8.8% |
| Hungarian | 6 | 0.1% |
| Indian (Asian) | 104 | 1.2% |
| Iranian | 7 | 0.1% |
| Irish | 441 | 5.1% |
| Italian | 85 | 1.0% |
| Lithuanian | 2 | 0.0% |
| Mexican | 1,810 | 21.0% |
| Moroccan | 11 | 0.1% |
| Navajo | 216 | 2.5% |
| Northern European | 36 | 0.4% |
| Norwegian | 73 | 0.9% |
| Polish | 27 | 0.3% |
| Pueblo | 53 | 0.6% |
| Puerto Rican | 67 | 0.8% |
| Romanian | 29 | 0.3% |
| Russian | 38 | 0.4% |
| Scandinavian | 7 | 0.1% |
| Scotch-Irish | 25 | 0.3% |
| Scottish | 60 | 0.7% |
| Slovak | 5 | 0.1% |
| South American | 35 | 0.4% |
| Spaniard | 251 | 2.9% |
| Spanish | 47 | 0.5% |
| Sri Lankan | 53 | 0.6% |
| Swedish | 45 | 0.5% |
| Swiss | 14 | 0.2% |
| Thai | 191 | 2.2% |
| Welsh | 50 | 0.6% | View All 51 Rows |
Immigrants in Socorro
The most numerous immigrant groups reported in Socorro came from Latin America (379 | 4.4%), Central America (339 | 3.9%), Mexico (339 | 3.9%), Asia (228 | 2.6%), and South Central Asia (147 | 1.7%), together accounting for 16.6% of all Socorro residents.
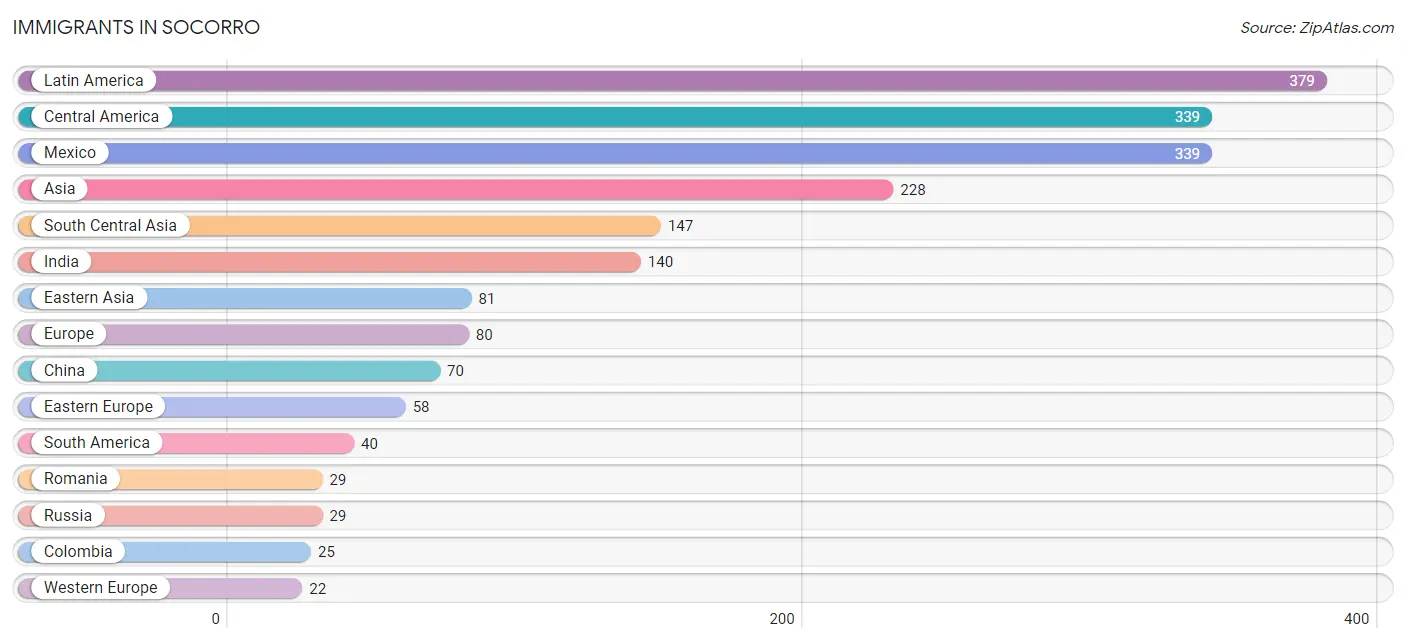
| Immigration Origin | # Population | % Population |
| Africa | 11 | 0.1% |
| Asia | 228 | 2.6% |
| Brazil | 15 | 0.2% |
| Canada | 16 | 0.2% |
| Central America | 339 | 3.9% |
| China | 70 | 0.8% |
| Colombia | 25 | 0.3% |
| Eastern Asia | 81 | 0.9% |
| Eastern Europe | 58 | 0.7% |
| Europe | 80 | 0.9% |
| France | 14 | 0.2% |
| Germany | 8 | 0.1% |
| India | 140 | 1.6% |
| Iran | 7 | 0.1% |
| Korea | 11 | 0.1% |
| Latin America | 379 | 4.4% |
| Mexico | 339 | 3.9% |
| Morocco | 11 | 0.1% |
| Northern Africa | 11 | 0.1% |
| Romania | 29 | 0.3% |
| Russia | 29 | 0.3% |
| South America | 40 | 0.5% |
| South Central Asia | 147 | 1.7% |
| Taiwan | 6 | 0.1% |
| Western Europe | 22 | 0.3% | View All 25 Rows |
Sex and Age in Socorro
Sex and Age in Socorro
The most populous age groups in Socorro are 15 to 19 Years (616 | 14.3%) for men and 20 to 24 Years (427 | 10.0%) for women.
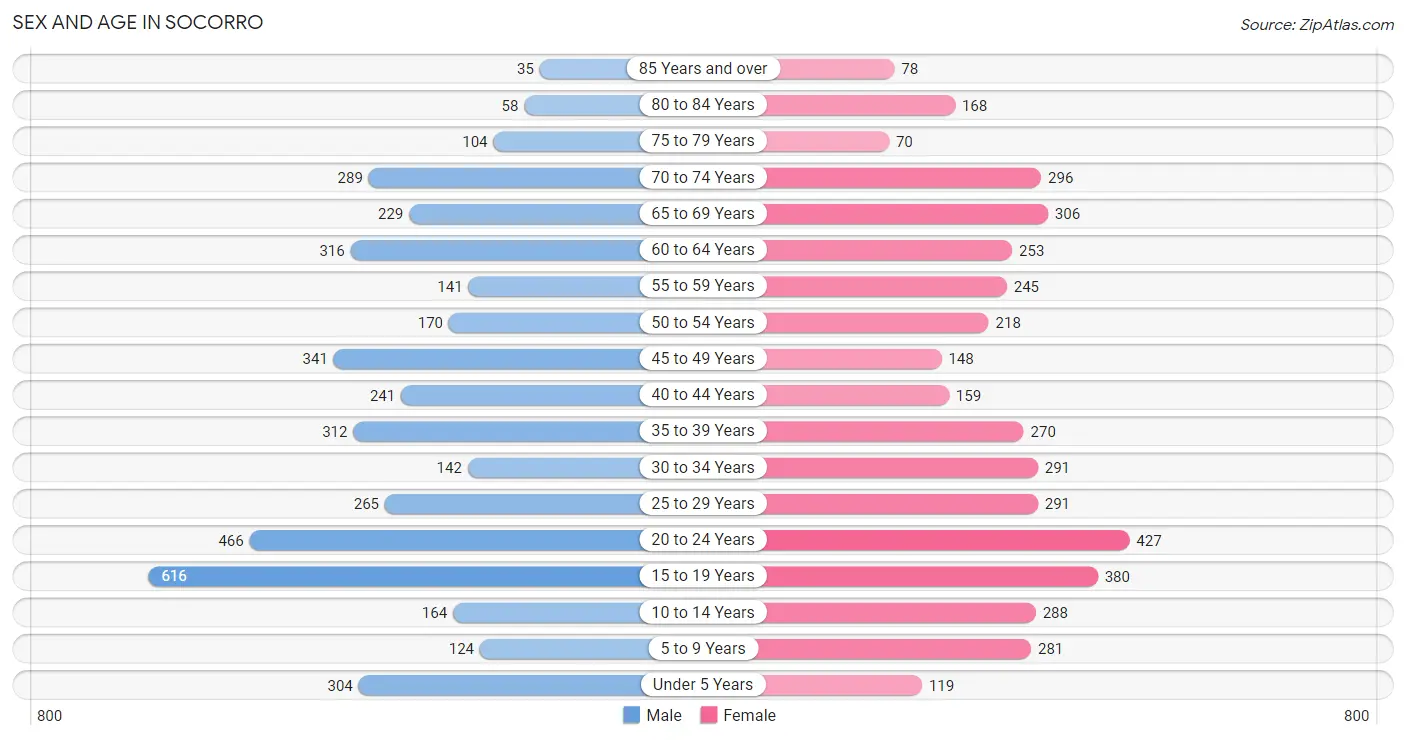
| Age Bracket | Male | Female |
| Under 5 Years | 304 (7.0%) | 119 (2.8%) |
| 5 to 9 Years | 124 (2.9%) | 281 (6.6%) |
| 10 to 14 Years | 164 (3.8%) | 288 (6.7%) |
| 15 to 19 Years | 616 (14.3%) | 380 (8.9%) |
| 20 to 24 Years | 466 (10.8%) | 427 (10.0%) |
| 25 to 29 Years | 265 (6.1%) | 291 (6.8%) |
| 30 to 34 Years | 142 (3.3%) | 291 (6.8%) |
| 35 to 39 Years | 312 (7.2%) | 270 (6.3%) |
| 40 to 44 Years | 241 (5.6%) | 159 (3.7%) |
| 45 to 49 Years | 341 (7.9%) | 148 (3.5%) |
| 50 to 54 Years | 170 (3.9%) | 218 (5.1%) |
| 55 to 59 Years | 141 (3.3%) | 245 (5.7%) |
| 60 to 64 Years | 316 (7.3%) | 253 (5.9%) |
| 65 to 69 Years | 229 (5.3%) | 306 (7.1%) |
| 70 to 74 Years | 289 (6.7%) | 296 (6.9%) |
| 75 to 79 Years | 104 (2.4%) | 70 (1.6%) |
| 80 to 84 Years | 58 (1.3%) | 168 (3.9%) |
| 85 Years and over | 35 (0.8%) | 78 (1.8%) |
| Total | 4,317 (100.0%) | 4,288 (100.0%) |
Families and Households in Socorro
Median Family Size in Socorro
The median family size in Socorro is 4.04 persons per family, with single female/mother families (274 | 17.8%) accounting for the largest median family size of 5.42 persons per family. On the other hand, married-couple families (1,102 | 71.7%) represent the smallest median family size with 3.73 persons per family.
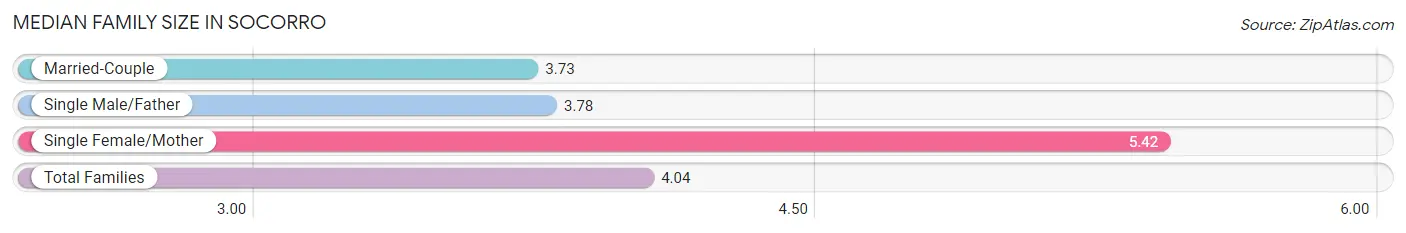
| Family Type | # Families | Family Size |
| Married-Couple | 1,102 (71.7%) | 3.73 |
| Single Male/Father | 160 (10.4%) | 3.78 |
| Single Female/Mother | 274 (17.8%) | 5.42 |
| Total Families | 1,536 (100.0%) | 4.04 |
Median Household Size in Socorro
The median household size in Socorro is 2.99 persons per household, with single female/mother households (274 | 10.2%) accounting for the largest median household size of 5.58 persons per household. non-family households (1,158 | 43.0%) represent the smallest median household size with 1.47 persons per household.
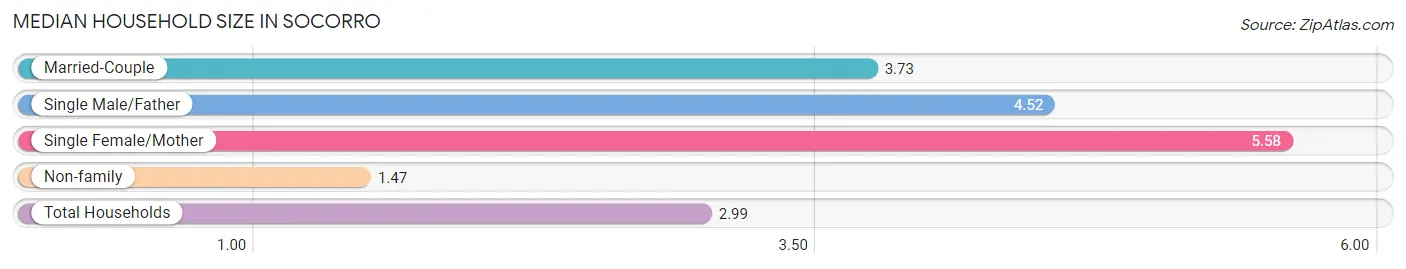
| Household Type | # Households | Household Size |
| Married-Couple | 1,102 (40.9%) | 3.73 |
| Single Male/Father | 160 (5.9%) | 4.52 |
| Single Female/Mother | 274 (10.2%) | 5.58 |
| Non-family | 1,158 (43.0%) | 1.47 |
| Total Households | 2,694 (100.0%) | 2.99 |
Household Size by Marriage Status in Socorro
Out of a total of 2,694 households in Socorro, 1,536 (57.0%) are family households, while 1,158 (43.0%) are nonfamily households. The most numerous type of family households are 2-person households, comprising 710, and the most common type of nonfamily households are 1-person households, comprising 1,021.
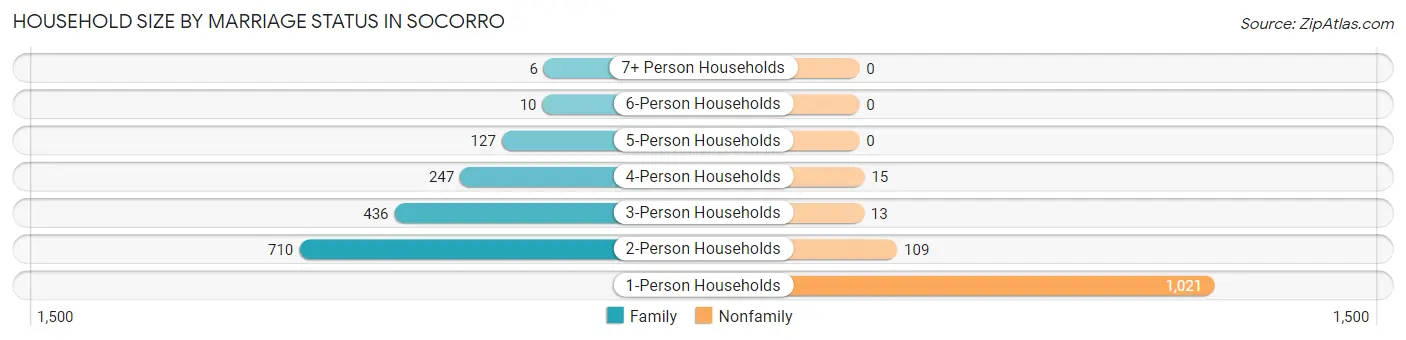
| Household Size | Family Households | Nonfamily Households |
| 1-Person Households | - | 1,021 (37.9%) |
| 2-Person Households | 710 (26.4%) | 109 (4.1%) |
| 3-Person Households | 436 (16.2%) | 13 (0.5%) |
| 4-Person Households | 247 (9.2%) | 15 (0.6%) |
| 5-Person Households | 127 (4.7%) | 0 (0.0%) |
| 6-Person Households | 10 (0.4%) | 0 (0.0%) |
| 7+ Person Households | 6 (0.2%) | 0 (0.0%) |
| Total | 1,536 (57.0%) | 1,158 (43.0%) |
Female Fertility in Socorro
Fertility by Age in Socorro
Average fertility rate in Socorro is 72.0 births per 1,000 women. Women in the age bracket of 35 to 50 years have the highest fertility rate with 128.0 births per 1,000 women. Women in the age bracket of 35 to 50 years acount for 56.8% of all women with births.
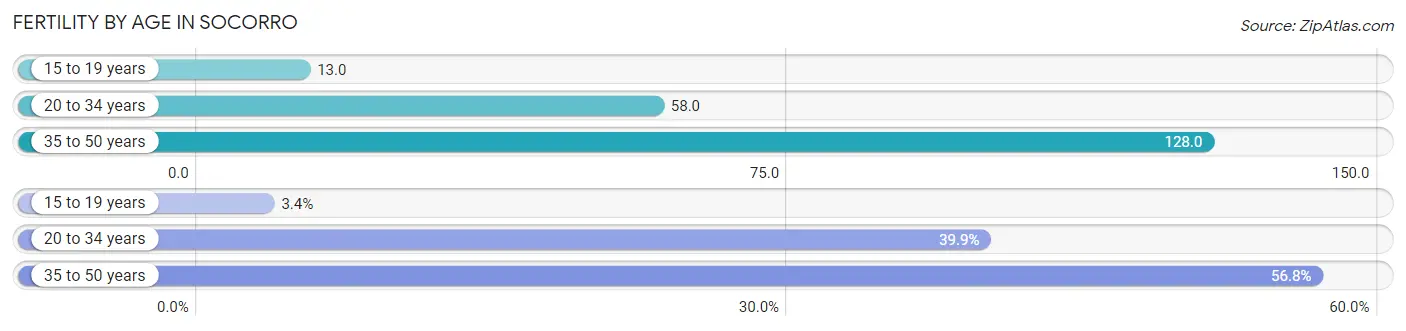
| Age Bracket | Women with Births | Births / 1,000 Women |
| 15 to 19 years | 5 (3.4%) | 13.0 |
| 20 to 34 years | 59 (39.9%) | 58.0 |
| 35 to 50 years | 84 (56.8%) | 128.0 |
| Total | 148 (100.0%) | 72.0 |
Fertility by Age by Marriage Status in Socorro
60.1% of women with births (148) in Socorro are married. The highest percentage of unmarried women with births falls into 15 to 19 years age bracket with 100.0% of them unmarried at the time of birth, while the lowest percentage of unmarried women with births belong to 35 to 50 years age bracket with 15.5% of them unmarried.
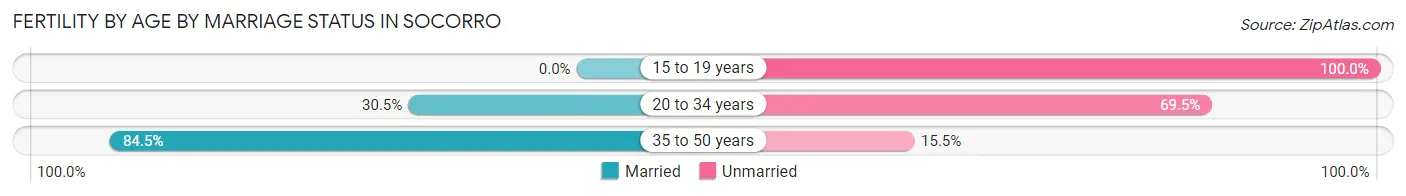
| Age Bracket | Married | Unmarried |
| 15 to 19 years | 0 (0.0%) | 5 (100.0%) |
| 20 to 34 years | 18 (30.5%) | 41 (69.5%) |
| 35 to 50 years | 71 (84.5%) | 13 (15.5%) |
| Total | 89 (60.1%) | 59 (39.9%) |
Fertility by Education in Socorro
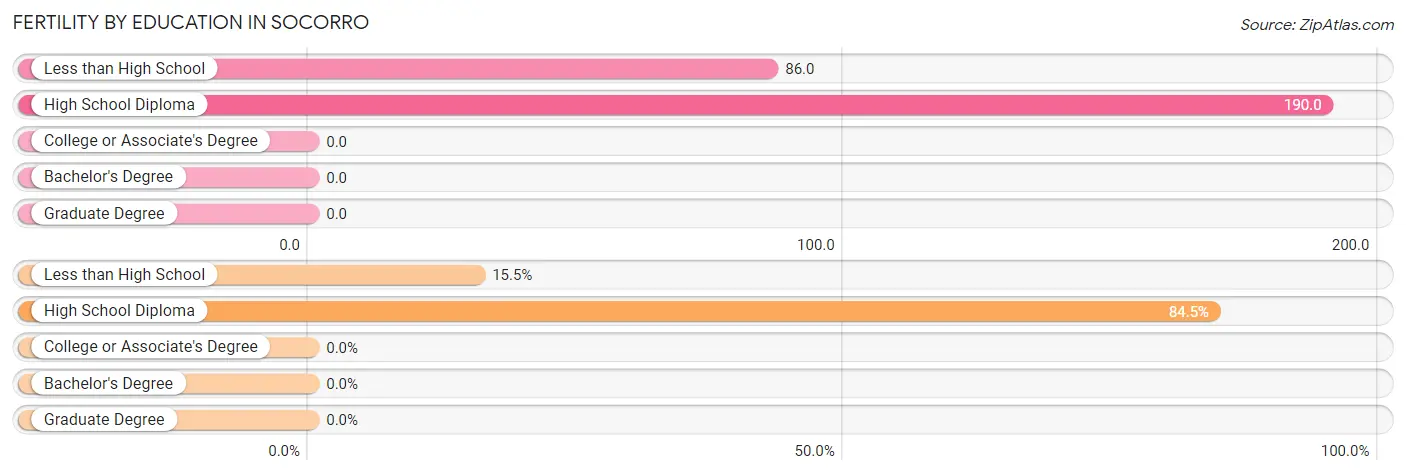
| Educational Attainment | Women with Births | Births / 1,000 Women |
| Less than High School | 23 (15.5%) | 86.0 |
| High School Diploma | 125 (84.5%) | 190.0 |
| College or Associate's Degree | 0 (0.0%) | 0.0 |
| Bachelor's Degree | 0 (0.0%) | 0.0 |
| Graduate Degree | 0 (0.0%) | 0.0 |
| Total | 148 (100.0%) | 72.0 |
Fertility by Education by Marriage Status in Socorro
39.9% of women with births in Socorro are unmarried. Women with the educational attainment of less than high school are most likely to be married with 78.3% of them married at childbirth, while women with the educational attainment of high school diploma are least likely to be married with 43.2% of them unmarried at childbirth.
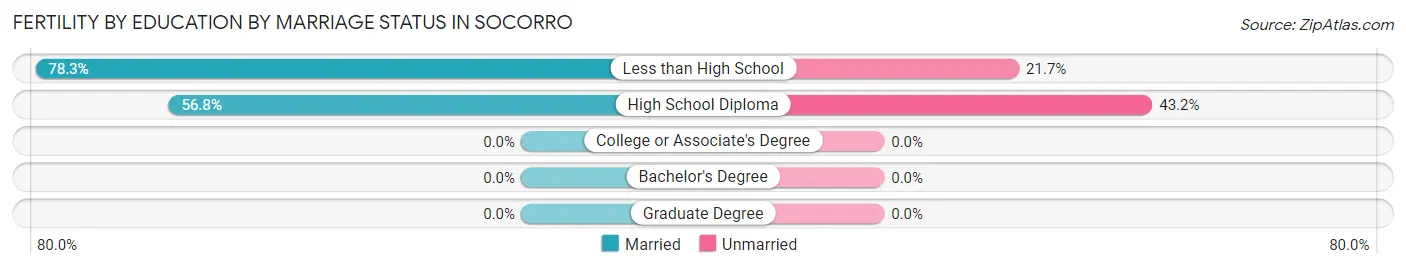
| Educational Attainment | Married | Unmarried |
| Less than High School | 18 (78.3%) | 5 (21.7%) |
| High School Diploma | 71 (56.8%) | 54 (43.2%) |
| College or Associate's Degree | 0 (0.0%) | 0 (0.0%) |
| Bachelor's Degree | 0 (0.0%) | 0 (0.0%) |
| Graduate Degree | 0 (0.0%) | 0 (0.0%) |
| Total | 89 (60.1%) | 59 (39.9%) |
Employment Characteristics in Socorro
Employment by Class of Employer in Socorro
Among the 3,105 employed individuals in Socorro, private company employees (1,443 | 46.5%), state government employees (852 | 27.4%), and not-for-profit organizations (302 | 9.7%) make up the most common classes of employment.
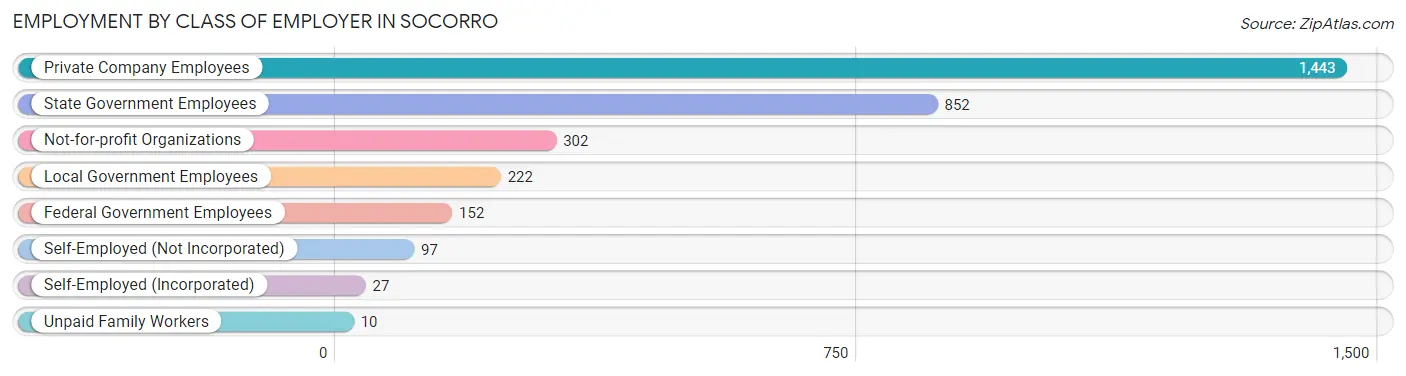
| Employer Class | # Employees | % Employees |
| Private Company Employees | 1,443 | 46.5% |
| Self-Employed (Incorporated) | 27 | 0.9% |
| Self-Employed (Not Incorporated) | 97 | 3.1% |
| Not-for-profit Organizations | 302 | 9.7% |
| Local Government Employees | 222 | 7.1% |
| State Government Employees | 852 | 27.4% |
| Federal Government Employees | 152 | 4.9% |
| Unpaid Family Workers | 10 | 0.3% |
| Total | 3,105 | 100.0% |
Employment Status by Age in Socorro
According to the labor force statistics for Socorro, out of the total population over 16 years of age (7,253), 45.4% or 3,293 individuals are in the labor force, with 3.0% or 99 of them unemployed. The age group with the highest labor force participation rate is 35 to 44 years, with 78.8% or 774 individuals in the labor force. Within the labor force, the 75 years and over age range has the highest percentage of unemployed individuals, with 19.4% or 7 of them being unemployed.
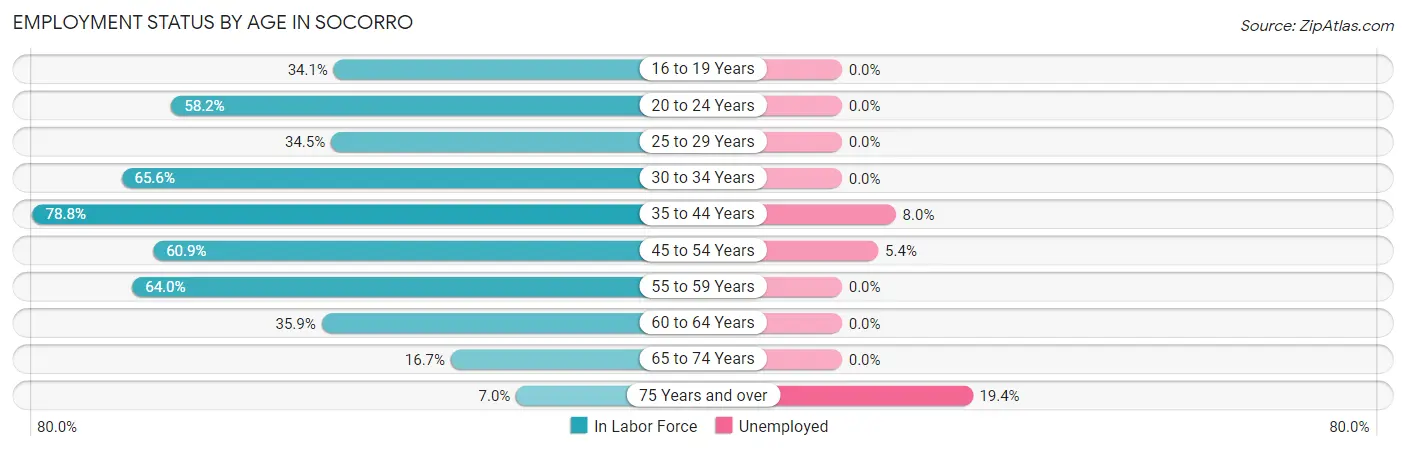
| Age Bracket | In Labor Force | Unemployed |
| 16 to 19 Years | 315 (34.1%) | 0 (0.0%) |
| 20 to 24 Years | 520 (58.2%) | 0 (0.0%) |
| 25 to 29 Years | 192 (34.5%) | 0 (0.0%) |
| 30 to 34 Years | 284 (65.6%) | 0 (0.0%) |
| 35 to 44 Years | 774 (78.8%) | 62 (8.0%) |
| 45 to 54 Years | 534 (60.9%) | 29 (5.4%) |
| 55 to 59 Years | 247 (64.0%) | 0 (0.0%) |
| 60 to 64 Years | 204 (35.9%) | 0 (0.0%) |
| 65 to 74 Years | 187 (16.7%) | 0 (0.0%) |
| 75 Years and over | 36 (7.0%) | 7 (19.4%) |
| Total | 3,293 (45.4%) | 99 (3.0%) |
Employment Status by Educational Attainment in Socorro
According to labor force statistics for Socorro, 58.8% of individuals (2,236) out of the total population between 25 and 64 years of age (3,803) are in the labor force, with 4.1% or 92 of them being unemployed. The group with the highest labor force participation rate are those with the educational attainment of bachelor's degree or higher, with 86.2% or 767 individuals in the labor force. Within the labor force, individuals with college / associate degree education have the highest percentage of unemployment, with 8.8% or 62 of them being unemployed.
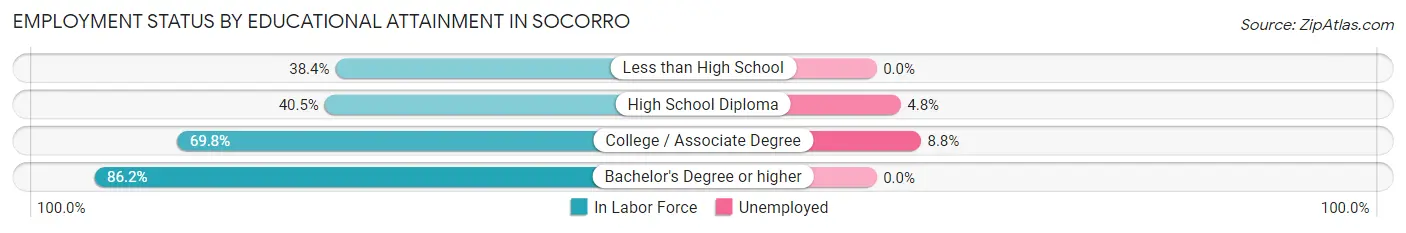
| Educational Attainment | In Labor Force | Unemployed |
| Less than High School | 156 (38.4%) | 0 (0.0%) |
| High School Diploma | 606 (40.5%) | 72 (4.8%) |
| College / Associate Degree | 706 (69.8%) | 89 (8.8%) |
| Bachelor's Degree or higher | 767 (86.2%) | 0 (0.0%) |
| Total | 2,236 (58.8%) | 156 (4.1%) |
Employment Occupations by Sex in Socorro
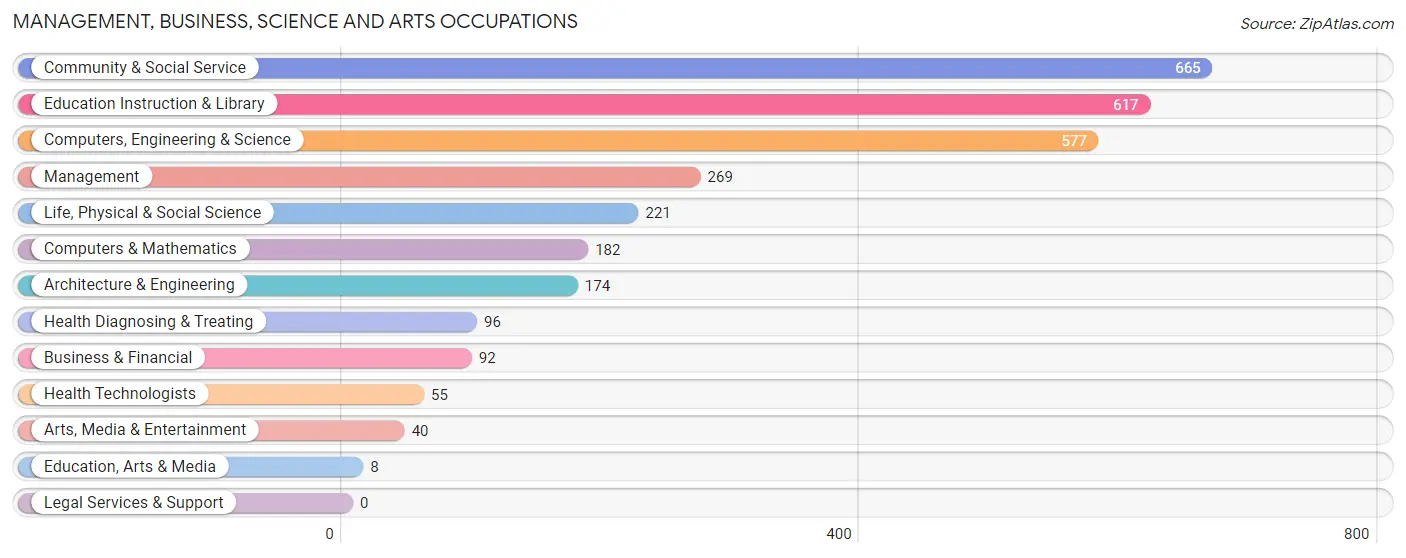
Management, Business, Science and Arts Occupations
The most common Management, Business, Science and Arts occupations in Socorro are Community & Social Service (665 | 20.8%), Education Instruction & Library (617 | 19.3%), Computers, Engineering & Science (577 | 18.1%), Management (269 | 8.4%), and Life, Physical & Social Science (221 | 6.9%).
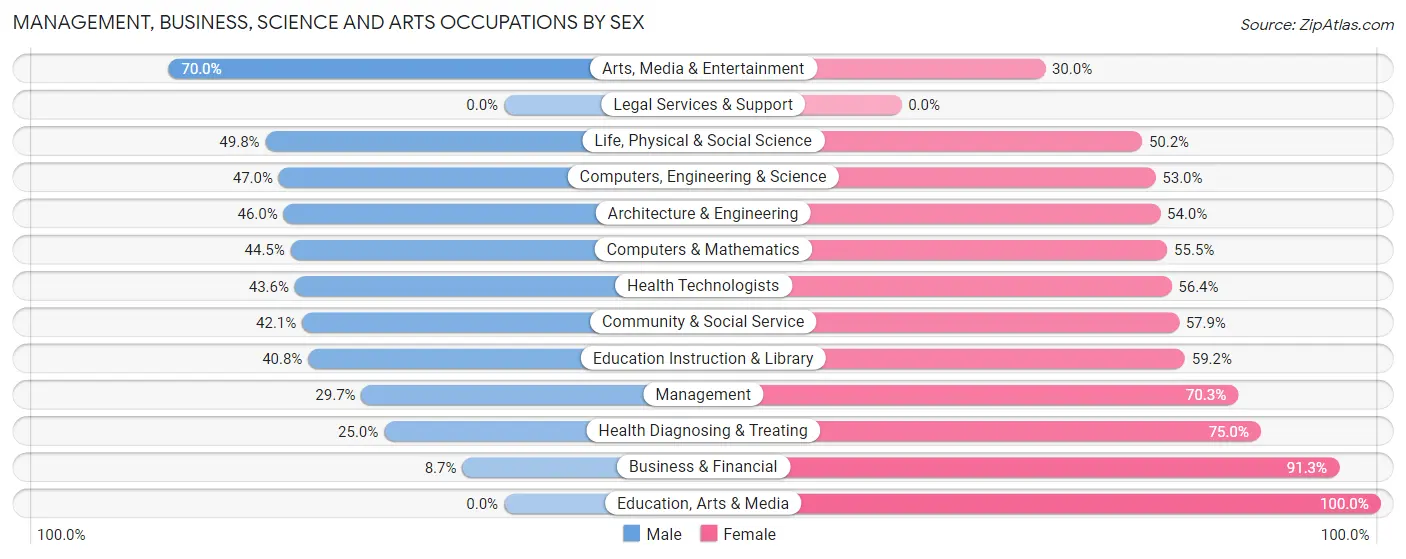
Management, Business, Science and Arts Occupations by Sex
Within the Management, Business, Science and Arts occupations in Socorro, the most male-oriented occupations are Arts, Media & Entertainment (70.0%), Life, Physical & Social Science (49.8%), and Computers, Engineering & Science (47.0%), while the most female-oriented occupations are Education, Arts & Media (100.0%), Business & Financial (91.3%), and Health Diagnosing & Treating (75.0%).
| Occupation | Male | Female |
| Management | 80 (29.7%) | 189 (70.3%) |
| Business & Financial | 8 (8.7%) | 84 (91.3%) |
| Computers, Engineering & Science | 271 (47.0%) | 306 (53.0%) |
| Computers & Mathematics | 81 (44.5%) | 101 (55.5%) |
| Architecture & Engineering | 80 (46.0%) | 94 (54.0%) |
| Life, Physical & Social Science | 110 (49.8%) | 111 (50.2%) |
| Community & Social Service | 280 (42.1%) | 385 (57.9%) |
| Education, Arts & Media | 0 (0.0%) | 8 (100.0%) |
| Legal Services & Support | 0 (0.0%) | 0 (0.0%) |
| Education Instruction & Library | 252 (40.8%) | 365 (59.2%) |
| Arts, Media & Entertainment | 28 (70.0%) | 12 (30.0%) |
| Health Diagnosing & Treating | 24 (25.0%) | 72 (75.0%) |
| Health Technologists | 24 (43.6%) | 31 (56.4%) |
| Total (Category) | 663 (39.0%) | 1,036 (61.0%) |
| Total (Overall) | 1,495 (46.8%) | 1,700 (53.2%) |
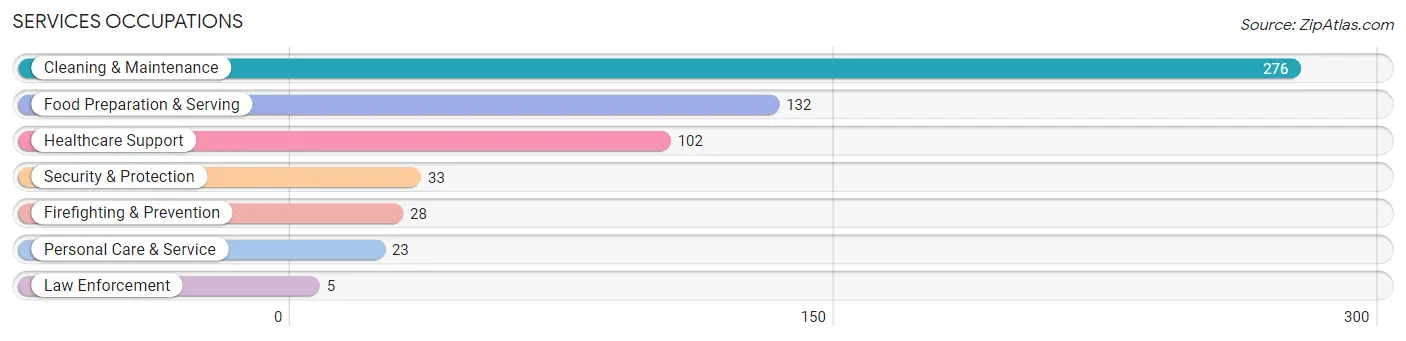
Services Occupations
The most common Services occupations in Socorro are Cleaning & Maintenance (276 | 8.6%), Food Preparation & Serving (132 | 4.1%), Healthcare Support (102 | 3.2%), Security & Protection (33 | 1.0%), and Firefighting & Prevention (28 | 0.9%).
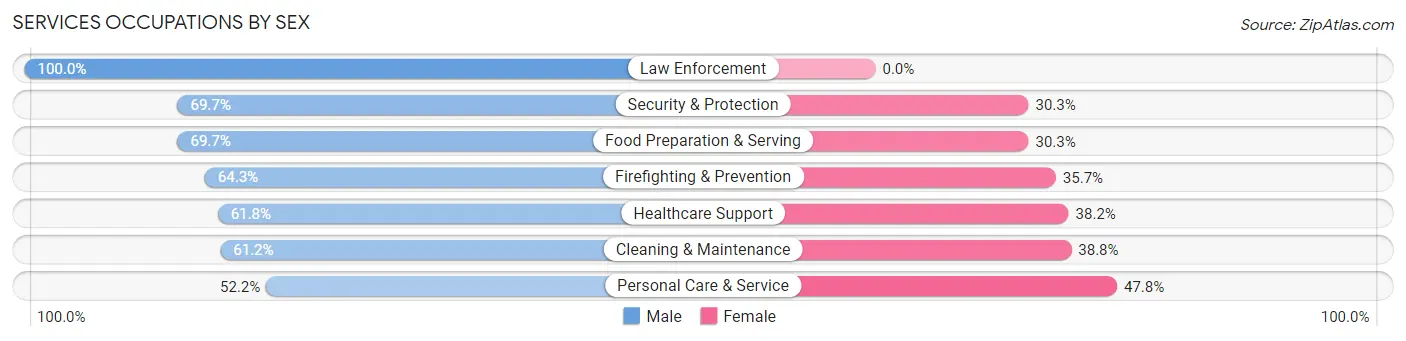
Services Occupations by Sex
Within the Services occupations in Socorro, the most male-oriented occupations are Law Enforcement (100.0%), Security & Protection (69.7%), and Food Preparation & Serving (69.7%), while the most female-oriented occupations are Personal Care & Service (47.8%), Cleaning & Maintenance (38.8%), and Healthcare Support (38.2%).
| Occupation | Male | Female |
| Healthcare Support | 63 (61.8%) | 39 (38.2%) |
| Security & Protection | 23 (69.7%) | 10 (30.3%) |
| Firefighting & Prevention | 18 (64.3%) | 10 (35.7%) |
| Law Enforcement | 5 (100.0%) | 0 (0.0%) |
| Food Preparation & Serving | 92 (69.7%) | 40 (30.3%) |
| Cleaning & Maintenance | 169 (61.2%) | 107 (38.8%) |
| Personal Care & Service | 12 (52.2%) | 11 (47.8%) |
| Total (Category) | 359 (63.4%) | 207 (36.6%) |
| Total (Overall) | 1,495 (46.8%) | 1,700 (53.2%) |
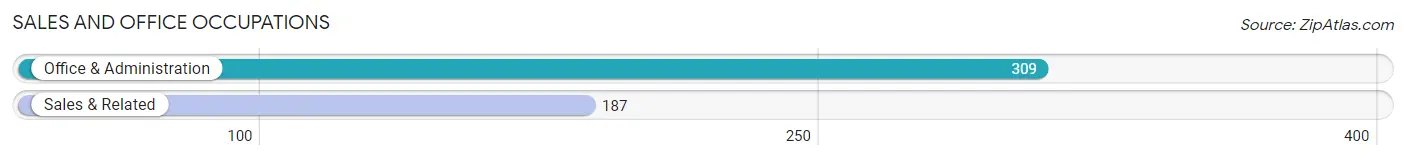
Sales and Office Occupations
The most common Sales and Office occupations in Socorro are Office & Administration (309 | 9.7%), and Sales & Related (187 | 5.9%).
Sales and Office Occupations by Sex
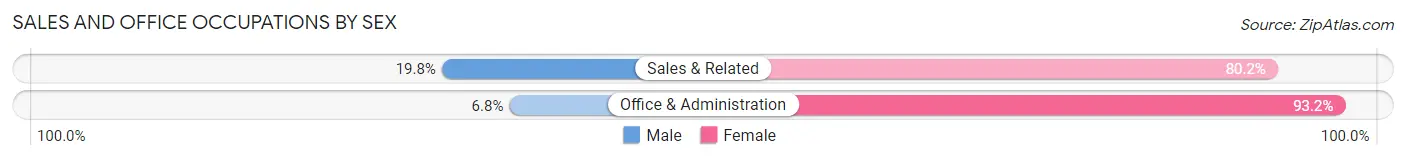
| Occupation | Male | Female |
| Sales & Related | 37 (19.8%) | 150 (80.2%) |
| Office & Administration | 21 (6.8%) | 288 (93.2%) |
| Total (Category) | 58 (11.7%) | 438 (88.3%) |
| Total (Overall) | 1,495 (46.8%) | 1,700 (53.2%) |
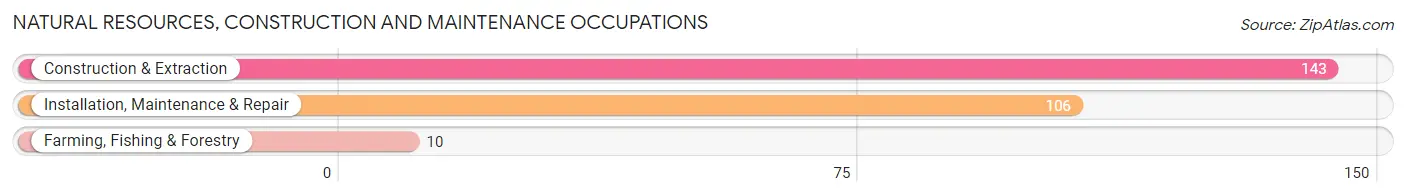
Natural Resources, Construction and Maintenance Occupations
The most common Natural Resources, Construction and Maintenance occupations in Socorro are Construction & Extraction (143 | 4.5%), Installation, Maintenance & Repair (106 | 3.3%), and Farming, Fishing & Forestry (10 | 0.3%).
Natural Resources, Construction and Maintenance Occupations by Sex
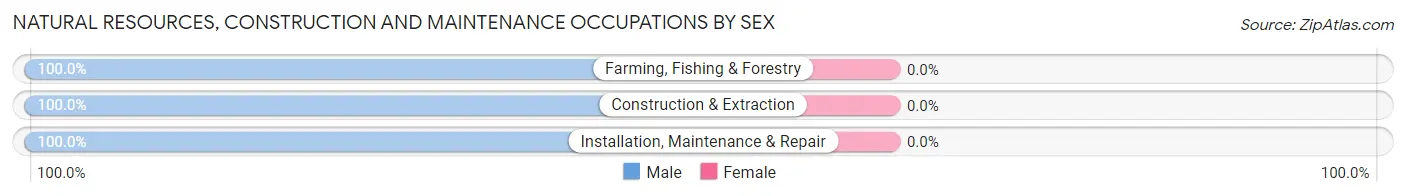
| Occupation | Male | Female |
| Farming, Fishing & Forestry | 10 (100.0%) | 0 (0.0%) |
| Construction & Extraction | 143 (100.0%) | 0 (0.0%) |
| Installation, Maintenance & Repair | 106 (100.0%) | 0 (0.0%) |
| Total (Category) | 259 (100.0%) | 0 (0.0%) |
| Total (Overall) | 1,495 (46.8%) | 1,700 (53.2%) |
Production, Transportation and Moving Occupations
The most common Production, Transportation and Moving occupations in Socorro are Transportation (86 | 2.7%), Material Moving (77 | 2.4%), and Production (12 | 0.4%).
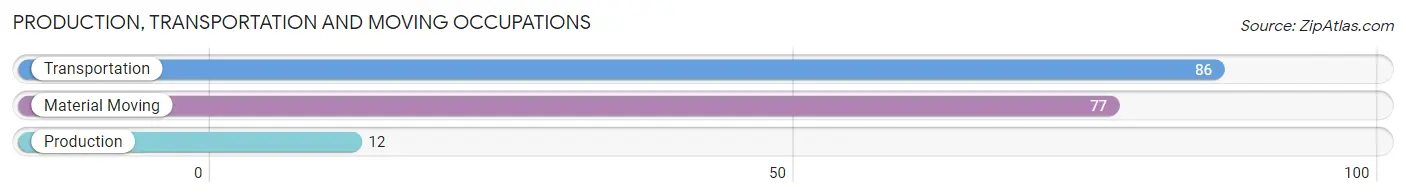
Production, Transportation and Moving Occupations by Sex
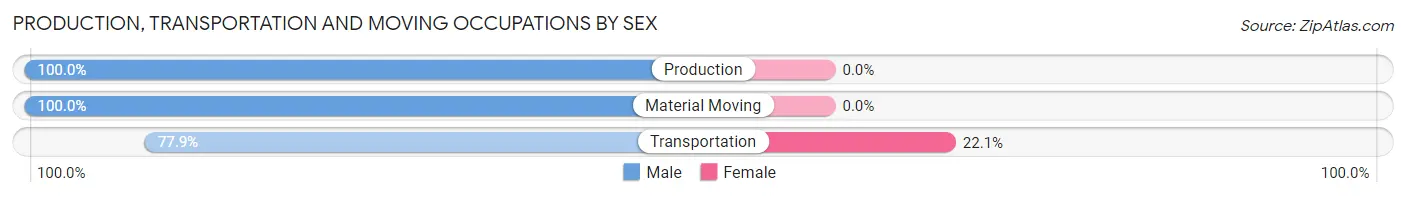
| Occupation | Male | Female |
| Production | 12 (100.0%) | 0 (0.0%) |
| Transportation | 67 (77.9%) | 19 (22.1%) |
| Material Moving | 77 (100.0%) | 0 (0.0%) |
| Total (Category) | 156 (89.1%) | 19 (10.9%) |
| Total (Overall) | 1,495 (46.8%) | 1,700 (53.2%) |
Employment Industries by Sex in Socorro
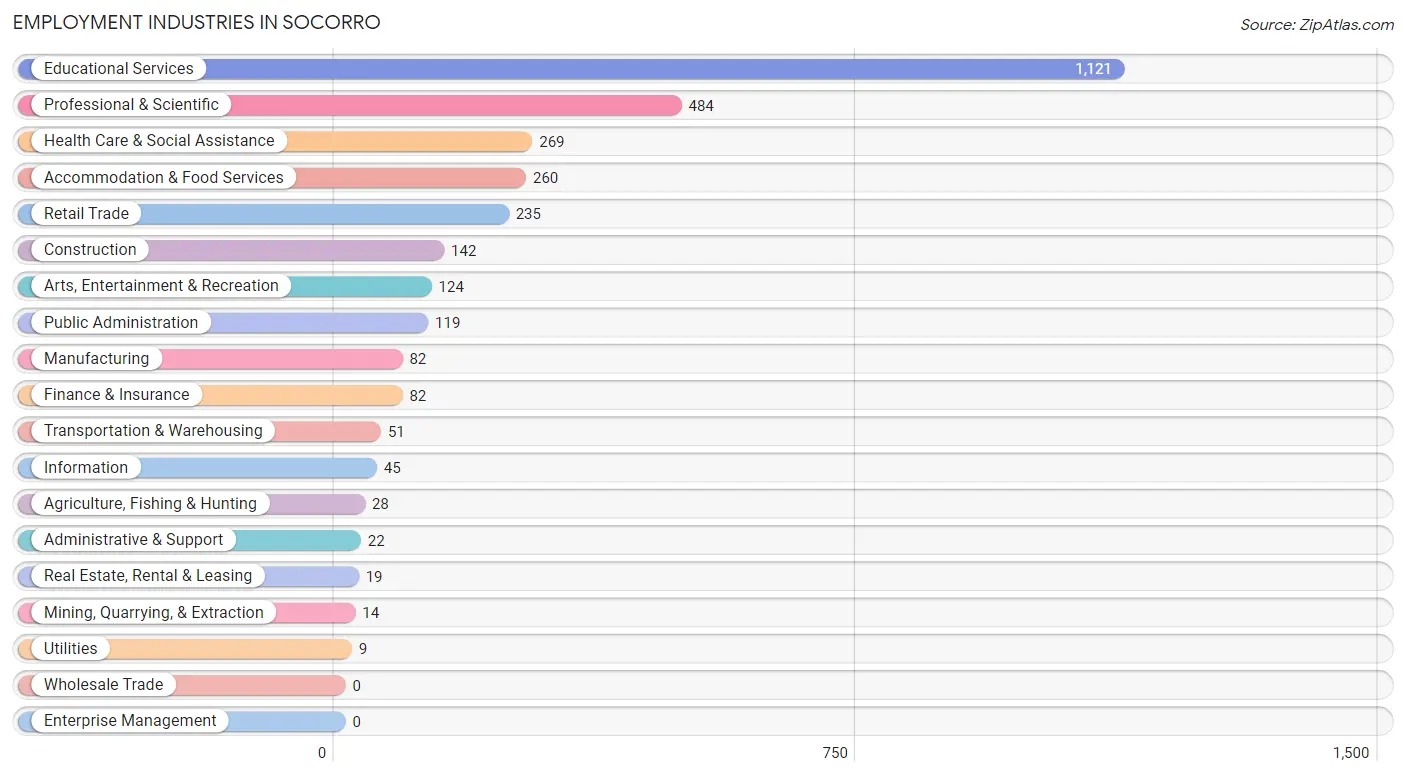
Employment Industries in Socorro
The major employment industries in Socorro include Educational Services (1,121 | 35.1%), Professional & Scientific (484 | 15.1%), Health Care & Social Assistance (269 | 8.4%), Accommodation & Food Services (260 | 8.1%), and Retail Trade (235 | 7.4%).
Employment Industries by Sex in Socorro
The Socorro industries that see more men than women are Mining, Quarrying, & Extraction (100.0%), Construction (100.0%), and Transportation & Warehousing (100.0%), whereas the industries that tend to have a higher number of women are Utilities (100.0%), Real Estate, Rental & Leasing (100.0%), and Administrative & Support (100.0%).
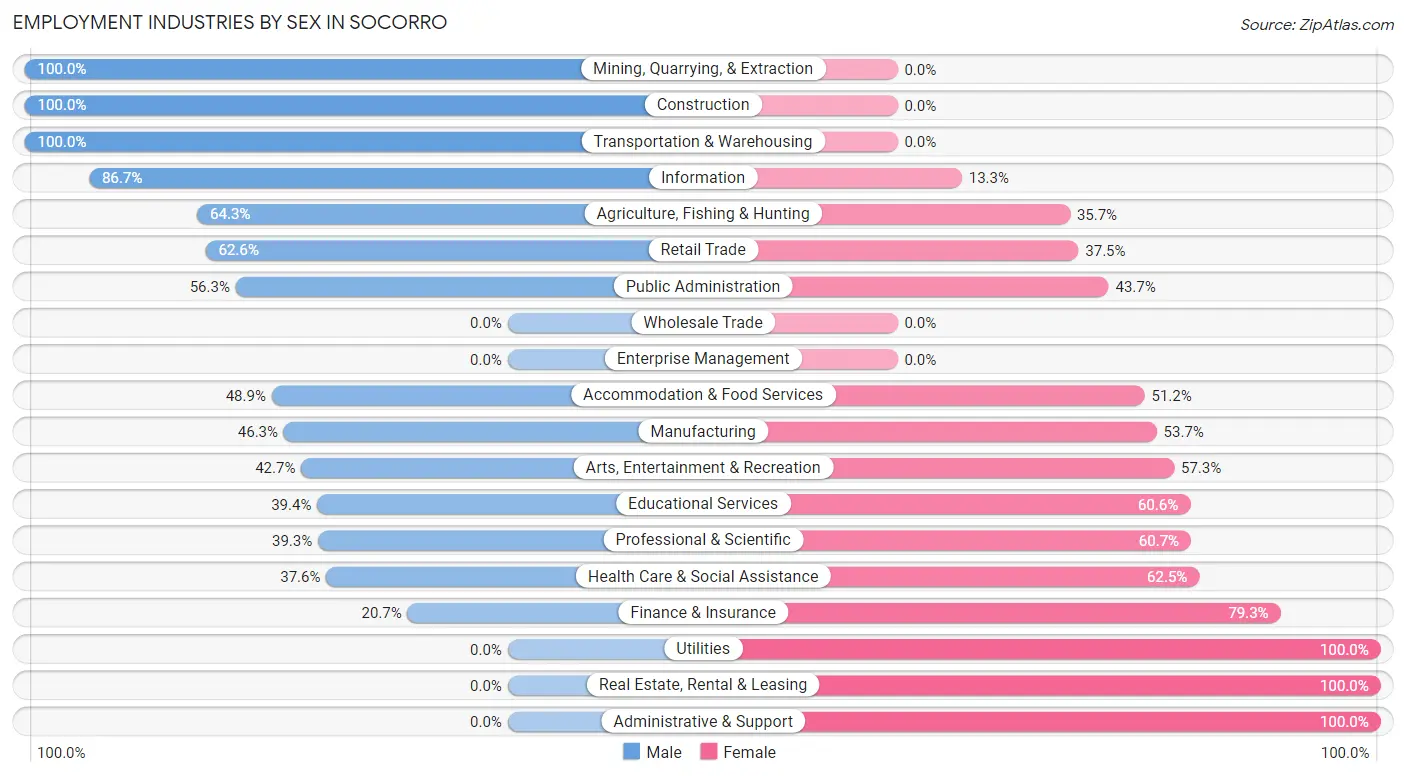
| Industry | Male | Female |
| Agriculture, Fishing & Hunting | 18 (64.3%) | 10 (35.7%) |
| Mining, Quarrying, & Extraction | 14 (100.0%) | 0 (0.0%) |
| Construction | 142 (100.0%) | 0 (0.0%) |
| Manufacturing | 38 (46.3%) | 44 (53.7%) |
| Wholesale Trade | 0 (0.0%) | 0 (0.0%) |
| Retail Trade | 147 (62.5%) | 88 (37.4%) |
| Transportation & Warehousing | 51 (100.0%) | 0 (0.0%) |
| Utilities | 0 (0.0%) | 9 (100.0%) |
| Information | 39 (86.7%) | 6 (13.3%) |
| Finance & Insurance | 17 (20.7%) | 65 (79.3%) |
| Real Estate, Rental & Leasing | 0 (0.0%) | 19 (100.0%) |
| Professional & Scientific | 190 (39.3%) | 294 (60.7%) |
| Enterprise Management | 0 (0.0%) | 0 (0.0%) |
| Administrative & Support | 0 (0.0%) | 22 (100.0%) |
| Educational Services | 442 (39.4%) | 679 (60.6%) |
| Health Care & Social Assistance | 101 (37.6%) | 168 (62.5%) |
| Arts, Entertainment & Recreation | 53 (42.7%) | 71 (57.3%) |
| Accommodation & Food Services | 127 (48.8%) | 133 (51.1%) |
| Public Administration | 67 (56.3%) | 52 (43.7%) |
| Total | 1,495 (46.8%) | 1,700 (53.2%) |
Education in Socorro
School Enrollment in Socorro
The most common levels of schooling among the 2,660 students in Socorro are college / undergraduate (1,437 | 54.0%), elementary school (463 | 17.4%), and high school (285 | 10.7%).
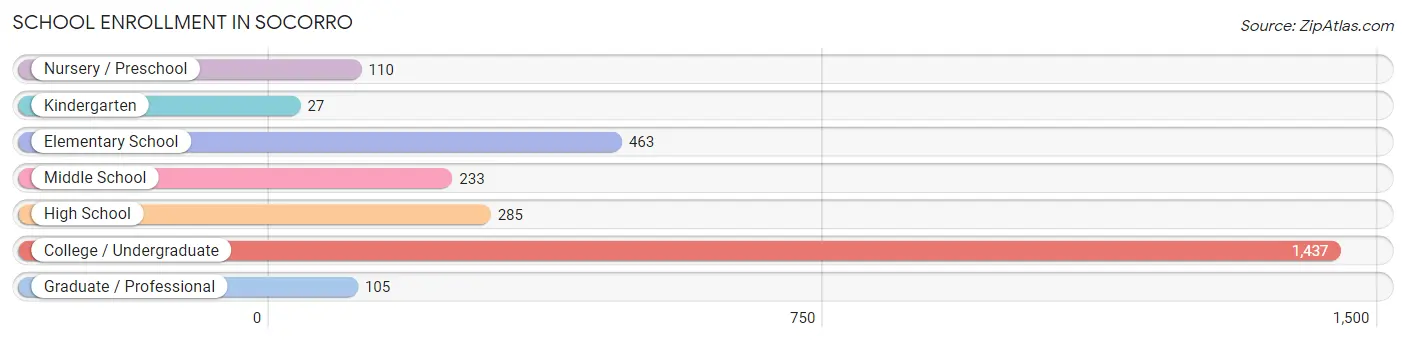
| School Level | # Students | % Students |
| Nursery / Preschool | 110 | 4.1% |
| Kindergarten | 27 | 1.0% |
| Elementary School | 463 | 17.4% |
| Middle School | 233 | 8.8% |
| High School | 285 | 10.7% |
| College / Undergraduate | 1,437 | 54.0% |
| Graduate / Professional | 105 | 4.0% |
| Total | 2,660 | 100.0% |
School Enrollment by Age by Funding Source in Socorro
Out of a total of 2,660 students who are enrolled in schools in Socorro, 93 (3.5%) attend a private institution, while the remaining 2,567 (96.5%) are enrolled in public schools. The age group of 5 to 9 year old has the highest likelihood of being enrolled in private schools, with 44 (10.9% in the age bracket) enrolled. Conversely, the age group of 3 to 4 year olds has the lowest likelihood of being enrolled in a private school, with 84 (100.0% in the age bracket) attending a public institution.
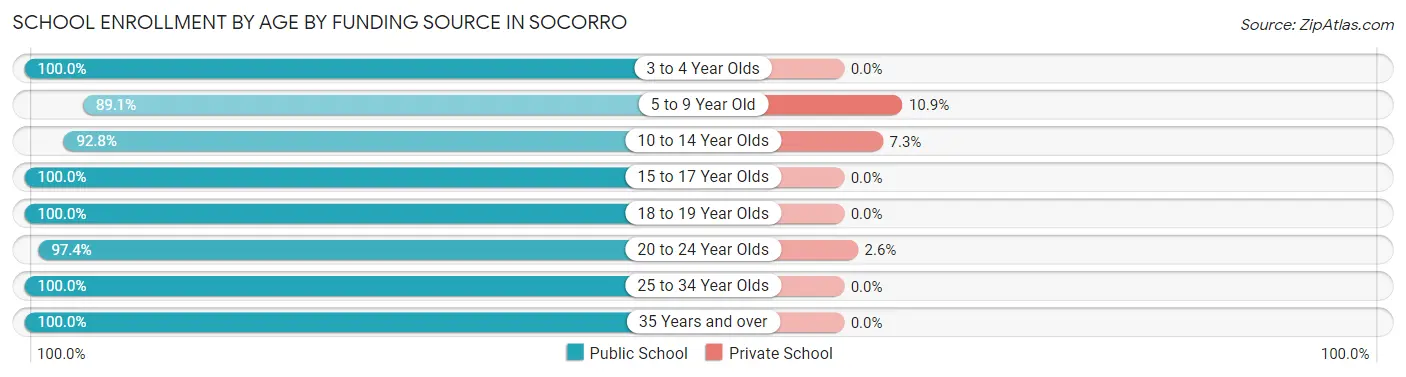
| Age Bracket | Public School | Private School |
| 3 to 4 Year Olds | 84 (100.0%) | 0 (0.0%) |
| 5 to 9 Year Old | 361 (89.1%) | 44 (10.9%) |
| 10 to 14 Year Olds | 384 (92.7%) | 30 (7.2%) |
| 15 to 17 Year Olds | 209 (100.0%) | 0 (0.0%) |
| 18 to 19 Year Olds | 712 (100.0%) | 0 (0.0%) |
| 20 to 24 Year Olds | 677 (97.4%) | 18 (2.6%) |
| 25 to 34 Year Olds | 87 (100.0%) | 0 (0.0%) |
| 35 Years and over | 54 (100.0%) | 0 (0.0%) |
| Total | 2,567 (96.5%) | 93 (3.5%) |
Educational Attainment by Field of Study in Socorro
Physical & health sciences (345 | 27.5%), bio, nature & agricultural (214 | 17.1%), business (161 | 12.8%), engineering (119 | 9.5%), and computers & mathematics (108 | 8.6%) are the most common fields of study among 1,254 individuals in Socorro who have obtained a bachelor's degree or higher.
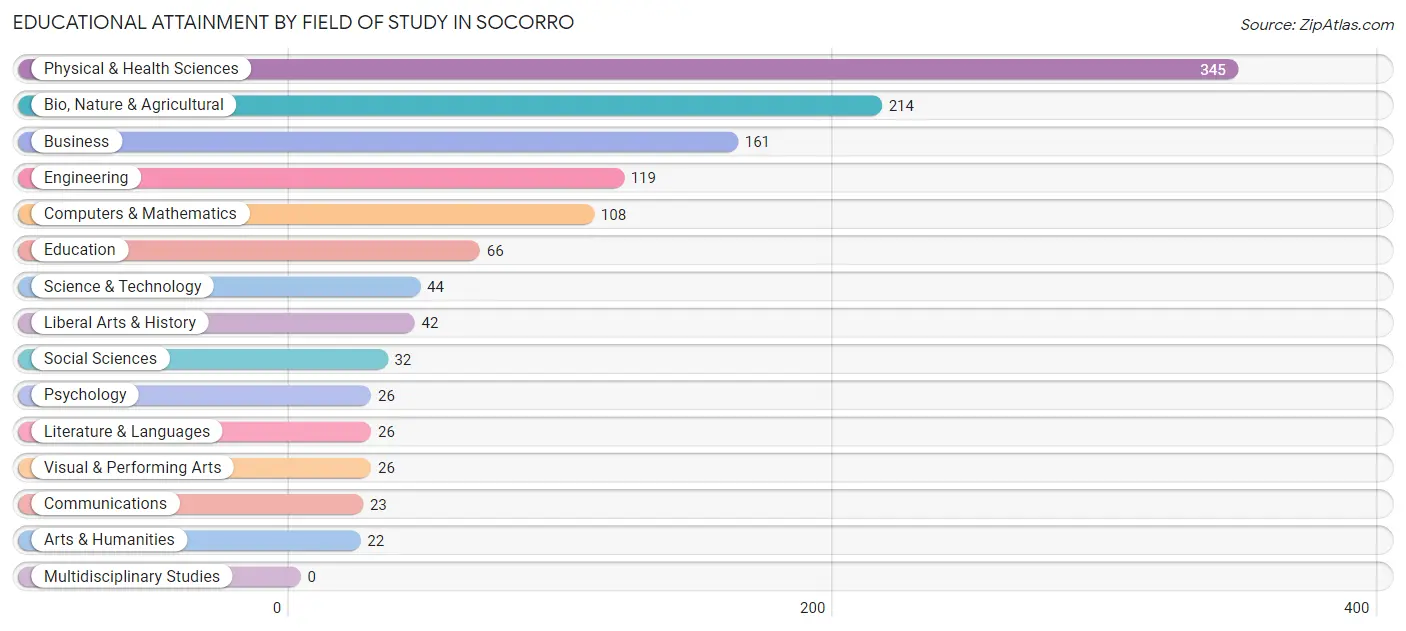
| Field of Study | # Graduates | % Graduates |
| Computers & Mathematics | 108 | 8.6% |
| Bio, Nature & Agricultural | 214 | 17.1% |
| Physical & Health Sciences | 345 | 27.5% |
| Psychology | 26 | 2.1% |
| Social Sciences | 32 | 2.5% |
| Engineering | 119 | 9.5% |
| Multidisciplinary Studies | 0 | 0.0% |
| Science & Technology | 44 | 3.5% |
| Business | 161 | 12.8% |
| Education | 66 | 5.3% |
| Literature & Languages | 26 | 2.1% |
| Liberal Arts & History | 42 | 3.4% |
| Visual & Performing Arts | 26 | 2.1% |
| Communications | 23 | 1.8% |
| Arts & Humanities | 22 | 1.8% |
| Total | 1,254 | 100.0% |
Transportation & Commute in Socorro
Vehicle Availability by Sex in Socorro
The most prevalent vehicle ownership categories in Socorro are males with 3 vehicles (506, accounting for 35.7%) and females with 3 vehicles (465, making up 32.7%).
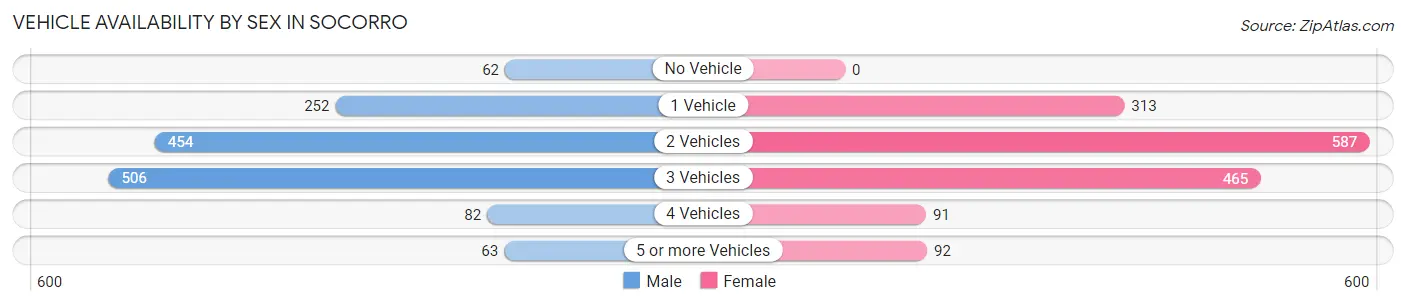
| Vehicles Available | Male | Female |
| No Vehicle | 62 (4.4%) | 0 (0.0%) |
| 1 Vehicle | 252 (17.8%) | 313 (20.2%) |
| 2 Vehicles | 454 (32.0%) | 587 (37.9%) |
| 3 Vehicles | 506 (35.7%) | 465 (30.0%) |
| 4 Vehicles | 82 (5.8%) | 91 (5.9%) |
| 5 or more Vehicles | 63 (4.4%) | 92 (5.9%) |
| Total | 1,419 (100.0%) | 1,548 (100.0%) |
Commute Time in Socorro
The most frequently occuring commute durations in Socorro are 5 to 9 minutes (1,595 commuters, 55.9%), 10 to 14 minutes (647 commuters, 22.7%), and less than 5 minutes (265 commuters, 9.3%).
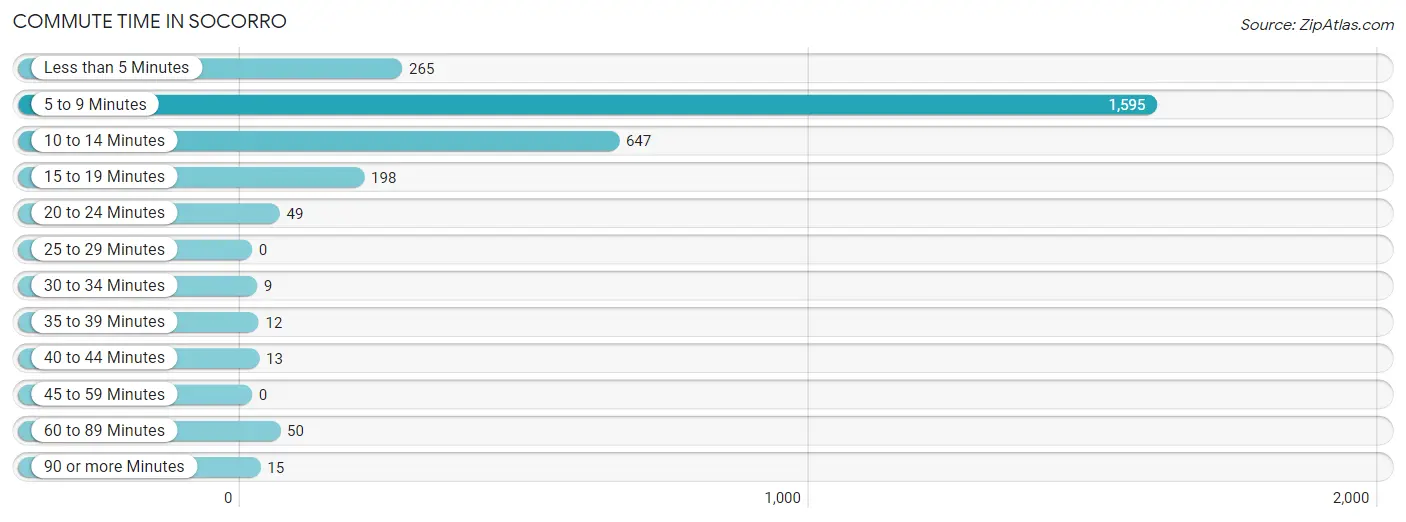
| Commute Time | # Commuters | % Commuters |
| Less than 5 Minutes | 265 | 9.3% |
| 5 to 9 Minutes | 1,595 | 55.9% |
| 10 to 14 Minutes | 647 | 22.7% |
| 15 to 19 Minutes | 198 | 6.9% |
| 20 to 24 Minutes | 49 | 1.7% |
| 25 to 29 Minutes | 0 | 0.0% |
| 30 to 34 Minutes | 9 | 0.3% |
| 35 to 39 Minutes | 12 | 0.4% |
| 40 to 44 Minutes | 13 | 0.5% |
| 45 to 59 Minutes | 0 | 0.0% |
| 60 to 89 Minutes | 50 | 1.8% |
| 90 or more Minutes | 15 | 0.5% |
Commute Time by Sex in Socorro
The most common commute times in Socorro are 5 to 9 minutes (766 commuters, 55.5%) for males and 5 to 9 minutes (829 commuters, 56.3%) for females.
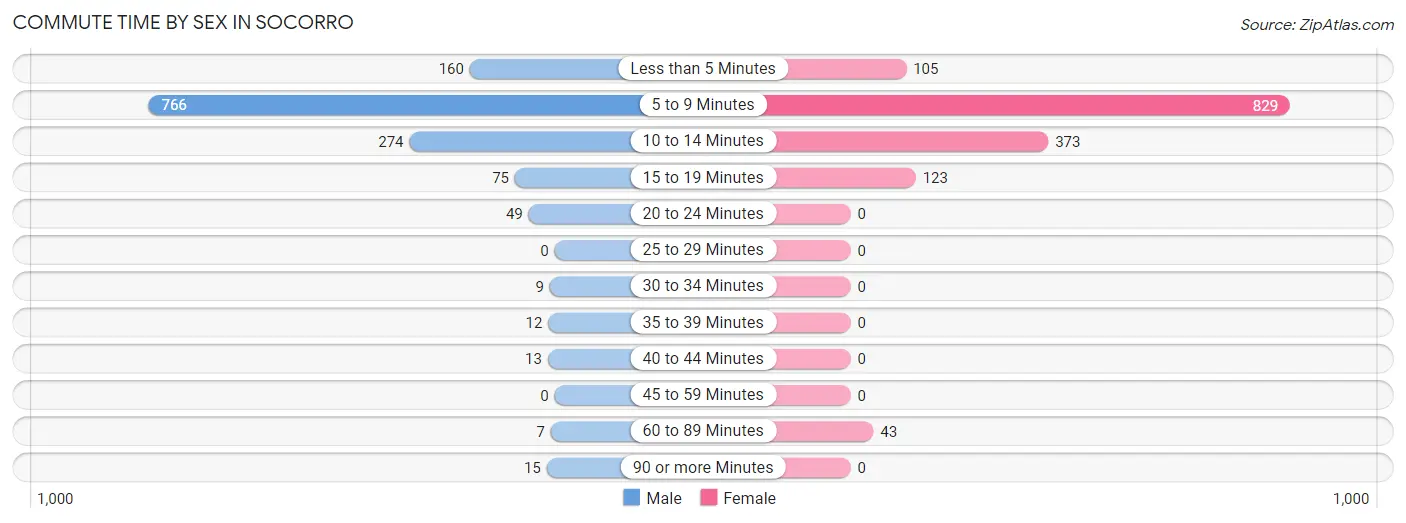
| Commute Time | Male | Female |
| Less than 5 Minutes | 160 (11.6%) | 105 (7.1%) |
| 5 to 9 Minutes | 766 (55.5%) | 829 (56.3%) |
| 10 to 14 Minutes | 274 (19.9%) | 373 (25.3%) |
| 15 to 19 Minutes | 75 (5.4%) | 123 (8.4%) |
| 20 to 24 Minutes | 49 (3.5%) | 0 (0.0%) |
| 25 to 29 Minutes | 0 (0.0%) | 0 (0.0%) |
| 30 to 34 Minutes | 9 (0.6%) | 0 (0.0%) |
| 35 to 39 Minutes | 12 (0.9%) | 0 (0.0%) |
| 40 to 44 Minutes | 13 (0.9%) | 0 (0.0%) |
| 45 to 59 Minutes | 0 (0.0%) | 0 (0.0%) |
| 60 to 89 Minutes | 7 (0.5%) | 43 (2.9%) |
| 90 or more Minutes | 15 (1.1%) | 0 (0.0%) |
Time of Departure to Work by Sex in Socorro
The most frequent times of departure to work in Socorro are 7:30 AM to 7:59 AM (226, 16.4%) for males and 7:30 AM to 7:59 AM (437, 29.7%) for females.
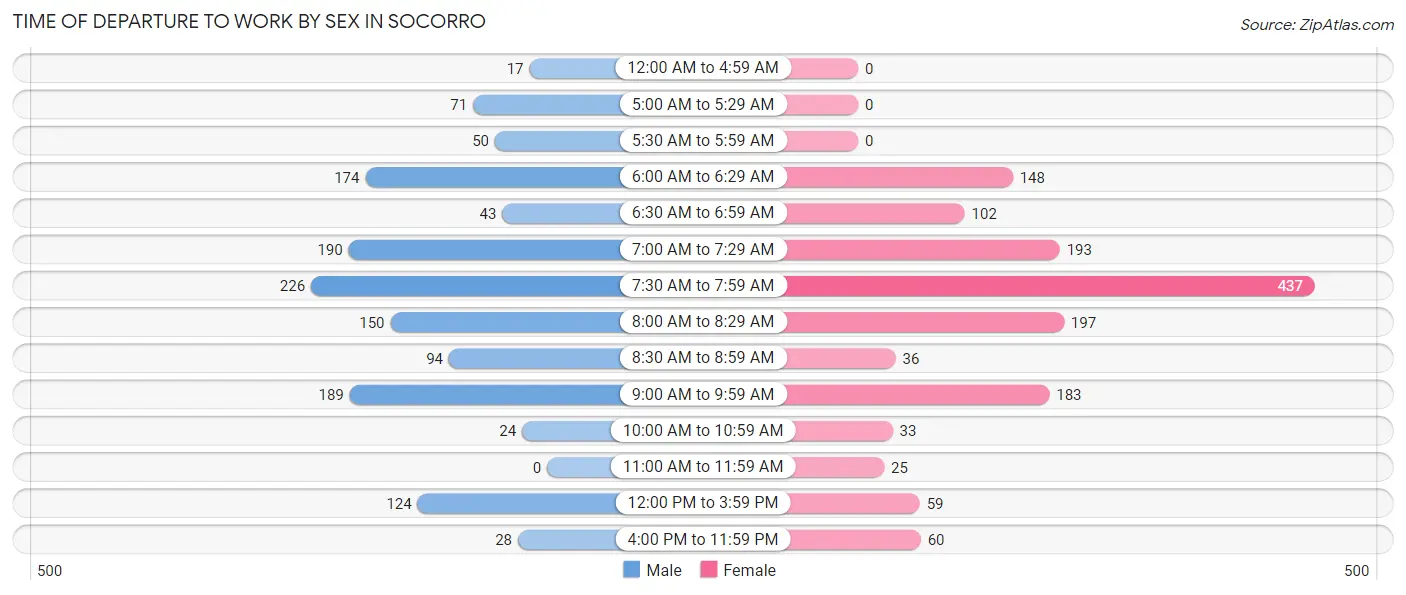
| Time of Departure | Male | Female |
| 12:00 AM to 4:59 AM | 17 (1.2%) | 0 (0.0%) |
| 5:00 AM to 5:29 AM | 71 (5.1%) | 0 (0.0%) |
| 5:30 AM to 5:59 AM | 50 (3.6%) | 0 (0.0%) |
| 6:00 AM to 6:29 AM | 174 (12.6%) | 148 (10.1%) |
| 6:30 AM to 6:59 AM | 43 (3.1%) | 102 (6.9%) |
| 7:00 AM to 7:29 AM | 190 (13.8%) | 193 (13.1%) |
| 7:30 AM to 7:59 AM | 226 (16.4%) | 437 (29.7%) |
| 8:00 AM to 8:29 AM | 150 (10.9%) | 197 (13.4%) |
| 8:30 AM to 8:59 AM | 94 (6.8%) | 36 (2.4%) |
| 9:00 AM to 9:59 AM | 189 (13.7%) | 183 (12.4%) |
| 10:00 AM to 10:59 AM | 24 (1.7%) | 33 (2.2%) |
| 11:00 AM to 11:59 AM | 0 (0.0%) | 25 (1.7%) |
| 12:00 PM to 3:59 PM | 124 (9.0%) | 59 (4.0%) |
| 4:00 PM to 11:59 PM | 28 (2.0%) | 60 (4.1%) |
| Total | 1,380 (100.0%) | 1,473 (100.0%) |
Housing Occupancy in Socorro
Occupancy by Ownership in Socorro
Of the total 2,694 dwellings in Socorro, owner-occupied units account for 1,669 (62.0%), while renter-occupied units make up 1,025 (38.1%).
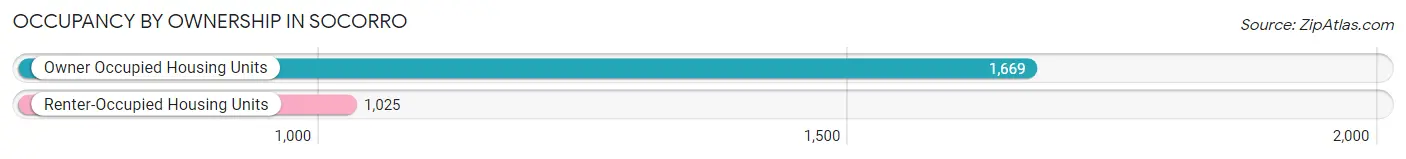
| Occupancy | # Housing Units | % Housing Units |
| Owner Occupied Housing Units | 1,669 | 62.0% |
| Renter-Occupied Housing Units | 1,025 | 38.1% |
| Total Occupied Housing Units | 2,694 | 100.0% |
Occupancy by Household Size in Socorro
| Household Size | # Housing Units | % Housing Units |
| 1-Person Household | 1,021 | 37.9% |
| 2-Person Household | 819 | 30.4% |
| 3-Person Household | 449 | 16.7% |
| 4+ Person Household | 405 | 15.0% |
| Total Housing Units | 2,694 | 100.0% |
Occupancy by Ownership by Household Size in Socorro
| Household Size | Owner-occupied | Renter-occupied |
| 1-Person Household | 570 (55.8%) | 451 (44.2%) |
| 2-Person Household | 586 (71.6%) | 233 (28.4%) |
| 3-Person Household | 253 (56.4%) | 196 (43.6%) |
| 4+ Person Household | 260 (64.2%) | 145 (35.8%) |
| Total Housing Units | 1,669 (62.0%) | 1,025 (38.1%) |
Occupancy by Educational Attainment in Socorro
| Household Size | Owner-occupied | Renter-occupied |
| Less than High School | 247 (67.9%) | 117 (32.1%) |
| High School Diploma | 327 (39.1%) | 509 (60.9%) |
| College/Associate Degree | 535 (68.9%) | 242 (31.1%) |
| Bachelor's Degree or higher | 560 (78.1%) | 157 (21.9%) |
Occupancy by Age of Householder in Socorro
| Age Bracket | # Households | % Households |
| Under 35 Years | 350 | 13.0% |
| 35 to 44 Years | 385 | 14.3% |
| 45 to 54 Years | 410 | 15.2% |
| 55 to 64 Years | 591 | 21.9% |
| 65 to 74 Years | 654 | 24.3% |
| 75 to 84 Years | 254 | 9.4% |
| 85 Years and Over | 50 | 1.9% |
| Total | 2,694 | 100.0% |
Housing Finances in Socorro
Median Income by Occupancy in Socorro
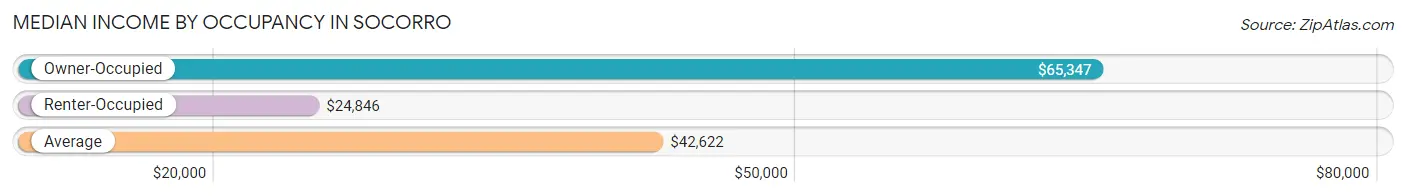
| Occupancy Type | # Households | Median Income |
| Owner-Occupied | 1,669 (62.0%) | $65,347 |
| Renter-Occupied | 1,025 (38.1%) | $24,846 |
| Average | 2,694 (100.0%) | $42,622 |
Occupancy by Householder Income Bracket in Socorro
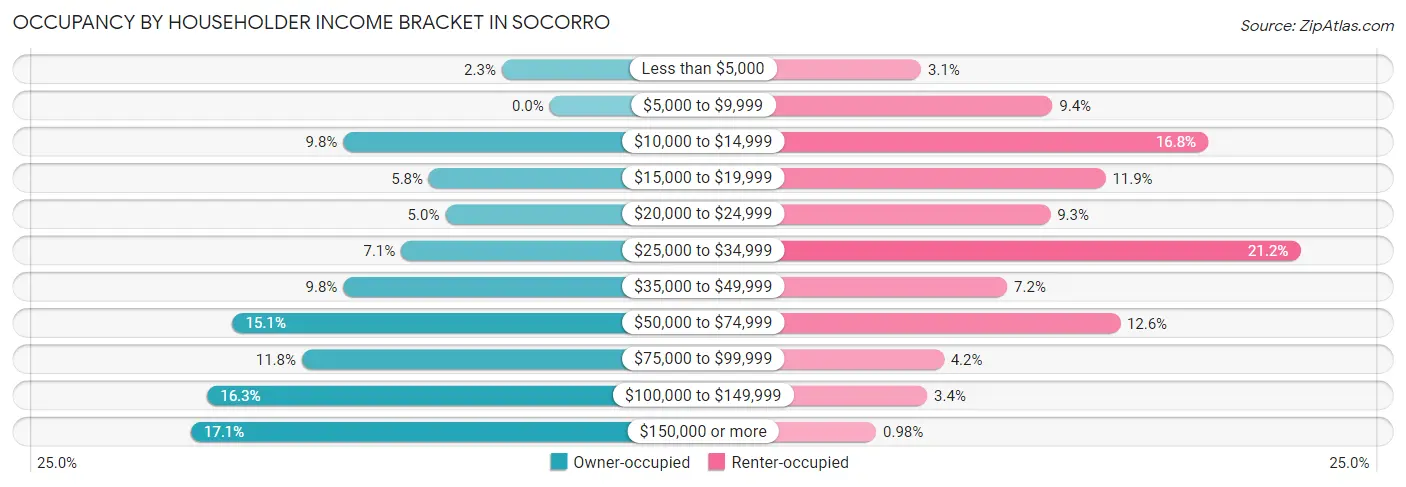
| Income Bracket | Owner-occupied | Renter-occupied |
| Less than $5,000 | 38 (2.3%) | 32 (3.1%) |
| $5,000 to $9,999 | 0 (0.0%) | 96 (9.4%) |
| $10,000 to $14,999 | 164 (9.8%) | 172 (16.8%) |
| $15,000 to $19,999 | 96 (5.8%) | 122 (11.9%) |
| $20,000 to $24,999 | 83 (5.0%) | 95 (9.3%) |
| $25,000 to $34,999 | 118 (7.1%) | 217 (21.2%) |
| $35,000 to $49,999 | 164 (9.8%) | 74 (7.2%) |
| $50,000 to $74,999 | 252 (15.1%) | 129 (12.6%) |
| $75,000 to $99,999 | 197 (11.8%) | 43 (4.2%) |
| $100,000 to $149,999 | 272 (16.3%) | 35 (3.4%) |
| $150,000 or more | 285 (17.1%) | 10 (1.0%) |
| Total | 1,669 (100.0%) | 1,025 (100.0%) |
Monthly Housing Cost Tiers in Socorro
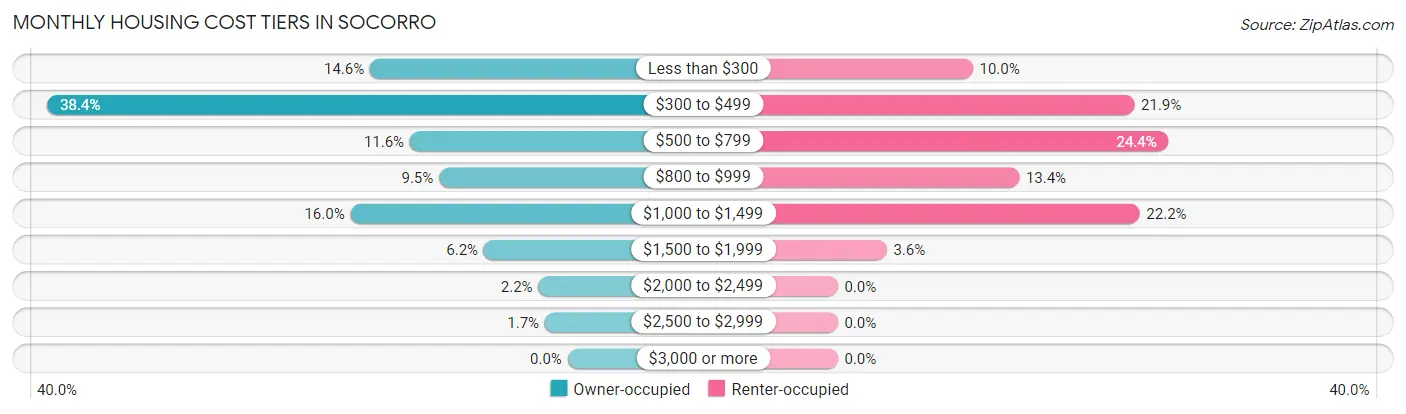
| Monthly Cost | Owner-occupied | Renter-occupied |
| Less than $300 | 243 (14.6%) | 102 (10.0%) |
| $300 to $499 | 640 (38.4%) | 224 (21.8%) |
| $500 to $799 | 194 (11.6%) | 250 (24.4%) |
| $800 to $999 | 158 (9.5%) | 137 (13.4%) |
| $1,000 to $1,499 | 267 (16.0%) | 228 (22.2%) |
| $1,500 to $1,999 | 103 (6.2%) | 37 (3.6%) |
| $2,000 to $2,499 | 36 (2.2%) | 0 (0.0%) |
| $2,500 to $2,999 | 28 (1.7%) | 0 (0.0%) |
| $3,000 or more | 0 (0.0%) | 0 (0.0%) |
| Total | 1,669 (100.0%) | 1,025 (100.0%) |
Physical Housing Characteristics in Socorro
Housing Structures in Socorro
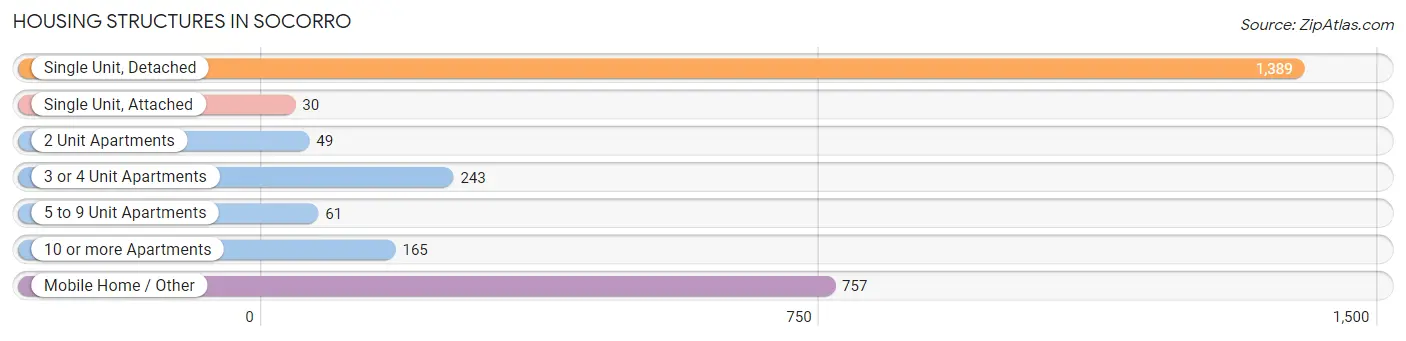
| Structure Type | # Housing Units | % Housing Units |
| Single Unit, Detached | 1,389 | 51.6% |
| Single Unit, Attached | 30 | 1.1% |
| 2 Unit Apartments | 49 | 1.8% |
| 3 or 4 Unit Apartments | 243 | 9.0% |
| 5 to 9 Unit Apartments | 61 | 2.3% |
| 10 or more Apartments | 165 | 6.1% |
| Mobile Home / Other | 757 | 28.1% |
| Total | 2,694 | 100.0% |
Housing Structures by Occupancy in Socorro
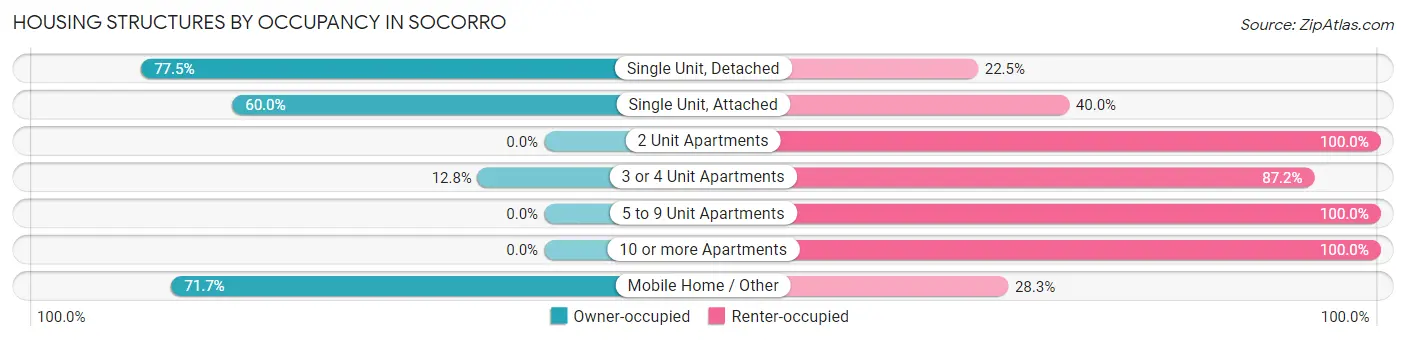
| Structure Type | Owner-occupied | Renter-occupied |
| Single Unit, Detached | 1,077 (77.5%) | 312 (22.5%) |
| Single Unit, Attached | 18 (60.0%) | 12 (40.0%) |
| 2 Unit Apartments | 0 (0.0%) | 49 (100.0%) |
| 3 or 4 Unit Apartments | 31 (12.8%) | 212 (87.2%) |
| 5 to 9 Unit Apartments | 0 (0.0%) | 61 (100.0%) |
| 10 or more Apartments | 0 (0.0%) | 165 (100.0%) |
| Mobile Home / Other | 543 (71.7%) | 214 (28.3%) |
| Total | 1,669 (62.0%) | 1,025 (38.1%) |
Housing Structures by Number of Rooms in Socorro
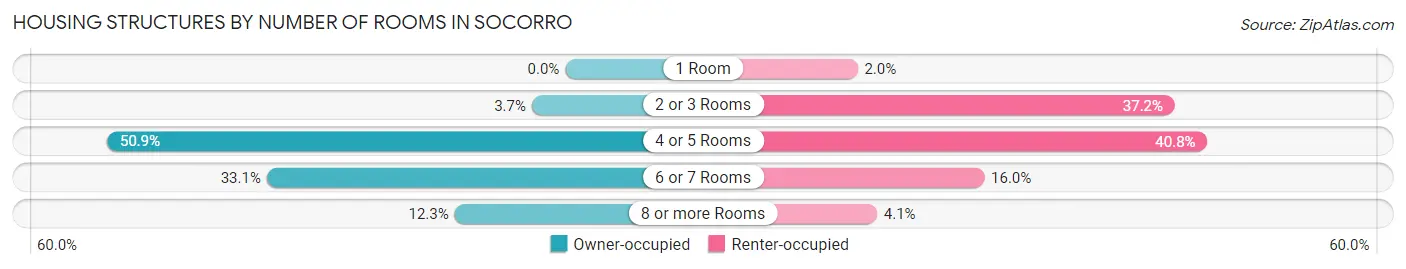
| Number of Rooms | Owner-occupied | Renter-occupied |
| 1 Room | 0 (0.0%) | 20 (1.9%) |
| 2 or 3 Rooms | 62 (3.7%) | 381 (37.2%) |
| 4 or 5 Rooms | 849 (50.9%) | 418 (40.8%) |
| 6 or 7 Rooms | 553 (33.1%) | 164 (16.0%) |
| 8 or more Rooms | 205 (12.3%) | 42 (4.1%) |
| Total | 1,669 (100.0%) | 1,025 (100.0%) |
Housing Structure by Heating Type in Socorro
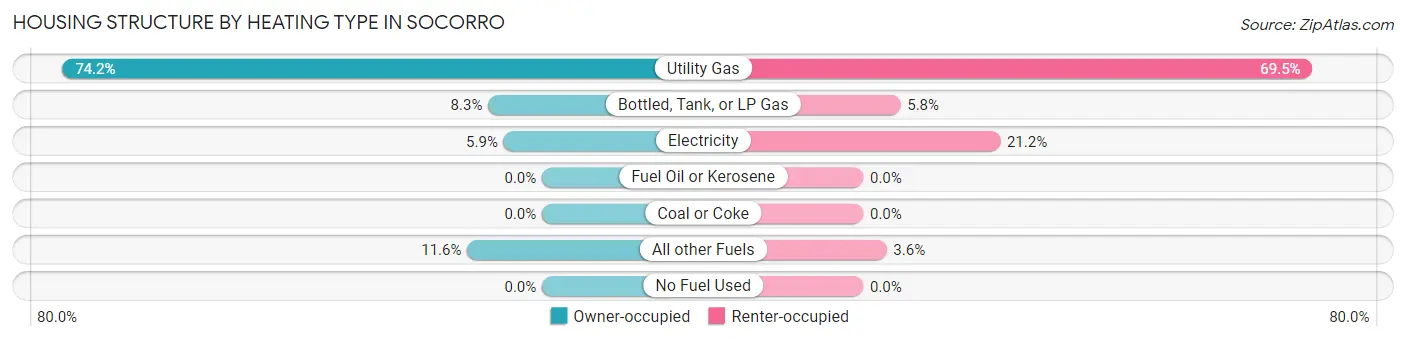
| Heating Type | Owner-occupied | Renter-occupied |
| Utility Gas | 1,238 (74.2%) | 712 (69.5%) |
| Bottled, Tank, or LP Gas | 139 (8.3%) | 59 (5.8%) |
| Electricity | 99 (5.9%) | 217 (21.2%) |
| Fuel Oil or Kerosene | 0 (0.0%) | 0 (0.0%) |
| Coal or Coke | 0 (0.0%) | 0 (0.0%) |
| All other Fuels | 193 (11.6%) | 37 (3.6%) |
| No Fuel Used | 0 (0.0%) | 0 (0.0%) |
| Total | 1,669 (100.0%) | 1,025 (100.0%) |
Household Vehicle Usage in Socorro
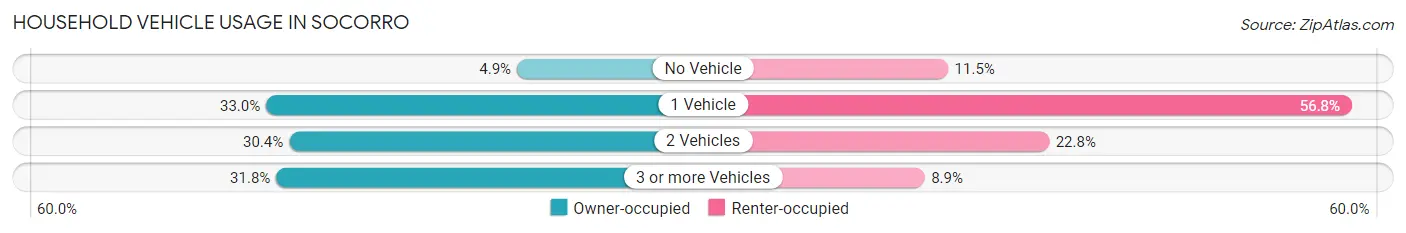
| Vehicles per Household | Owner-occupied | Renter-occupied |
| No Vehicle | 81 (4.9%) | 118 (11.5%) |
| 1 Vehicle | 550 (33.0%) | 582 (56.8%) |
| 2 Vehicles | 507 (30.4%) | 234 (22.8%) |
| 3 or more Vehicles | 531 (31.8%) | 91 (8.9%) |
| Total | 1,669 (100.0%) | 1,025 (100.0%) |
Real Estate & Mortgages in Socorro
Real Estate and Mortgage Overview in Socorro
| Characteristic | Without Mortgage | With Mortgage |
| Housing Units | 1,067 | 602 |
| Median Property Value | $97,800 | $178,500 |
| Median Household Income | $50,483 | $157 |
| Monthly Housing Costs | $359 | $0 |
| Real Estate Taxes | $669 | $10 |
Property Value by Mortgage Status in Socorro
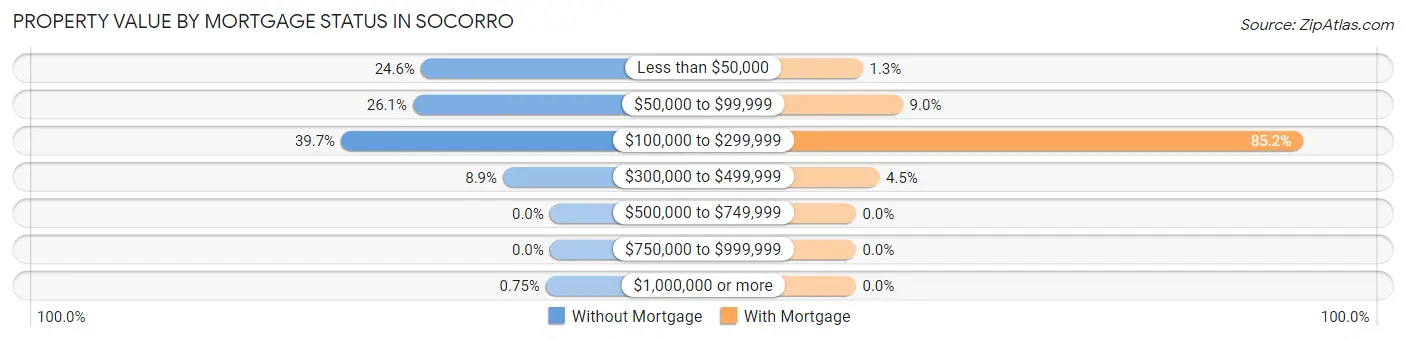
| Property Value | Without Mortgage | With Mortgage |
| Less than $50,000 | 262 (24.5%) | 8 (1.3%) |
| $50,000 to $99,999 | 278 (26.1%) | 54 (9.0%) |
| $100,000 to $299,999 | 424 (39.7%) | 513 (85.2%) |
| $300,000 to $499,999 | 95 (8.9%) | 27 (4.5%) |
| $500,000 to $749,999 | 0 (0.0%) | 0 (0.0%) |
| $750,000 to $999,999 | 0 (0.0%) | 0 (0.0%) |
| $1,000,000 or more | 8 (0.7%) | 0 (0.0%) |
| Total | 1,067 (100.0%) | 602 (100.0%) |
Household Income by Mortgage Status in Socorro
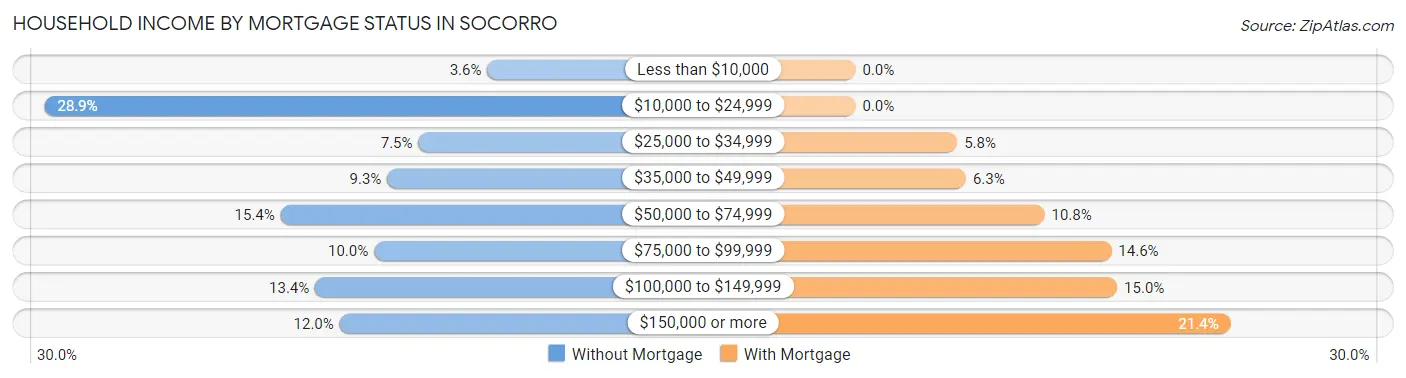
| Household Income | Without Mortgage | With Mortgage |
| Less than $10,000 | 38 (3.6%) | 0 (0.0%) |
| $10,000 to $24,999 | 308 (28.9%) | 0 (0.0%) |
| $25,000 to $34,999 | 80 (7.5%) | 35 (5.8%) |
| $35,000 to $49,999 | 99 (9.3%) | 38 (6.3%) |
| $50,000 to $74,999 | 164 (15.4%) | 65 (10.8%) |
| $75,000 to $99,999 | 107 (10.0%) | 88 (14.6%) |
| $100,000 to $149,999 | 143 (13.4%) | 90 (14.9%) |
| $150,000 or more | 128 (12.0%) | 129 (21.4%) |
| Total | 1,067 (100.0%) | 602 (100.0%) |
Property Value to Household Income Ratio in Socorro
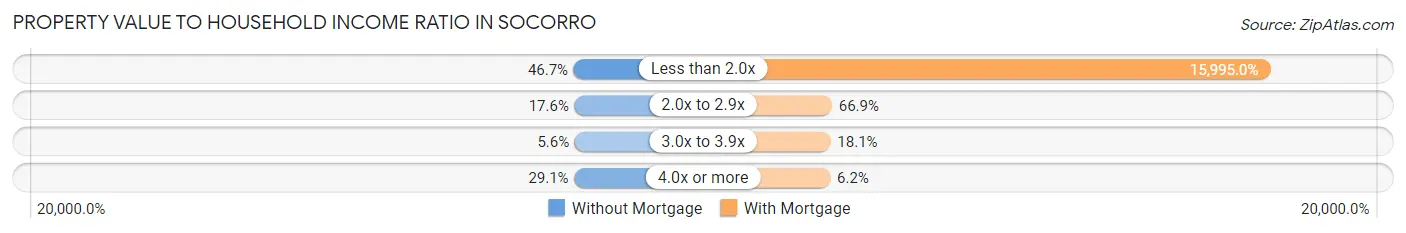
| Value-to-Income Ratio | Without Mortgage | With Mortgage |
| Less than 2.0x | 498 (46.7%) | 96,290 (15,995.0%) |
| 2.0x to 2.9x | 188 (17.6%) | 403 (66.9%) |
| 3.0x to 3.9x | 60 (5.6%) | 109 (18.1%) |
| 4.0x or more | 310 (29.0%) | 37 (6.1%) |
| Total | 1,067 (100.0%) | 602 (100.0%) |
Real Estate Taxes by Mortgage Status in Socorro
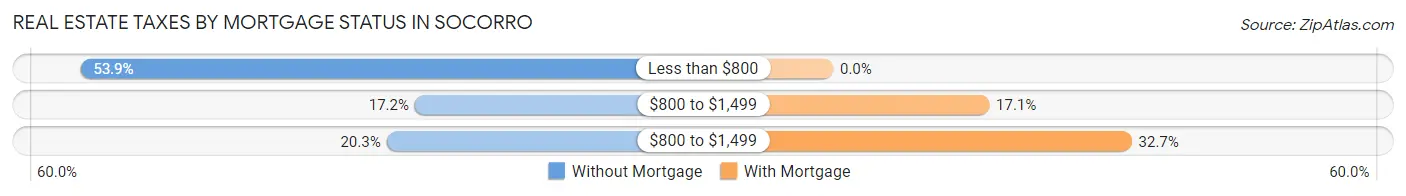
| Property Taxes | Without Mortgage | With Mortgage |
| Less than $800 | 575 (53.9%) | 0 (0.0%) |
| $800 to $1,499 | 184 (17.2%) | 103 (17.1%) |
| $800 to $1,499 | 217 (20.3%) | 197 (32.7%) |
| Total | 1,067 (100.0%) | 602 (100.0%) |
Health & Disability in Socorro
Health Insurance Coverage by Age in Socorro
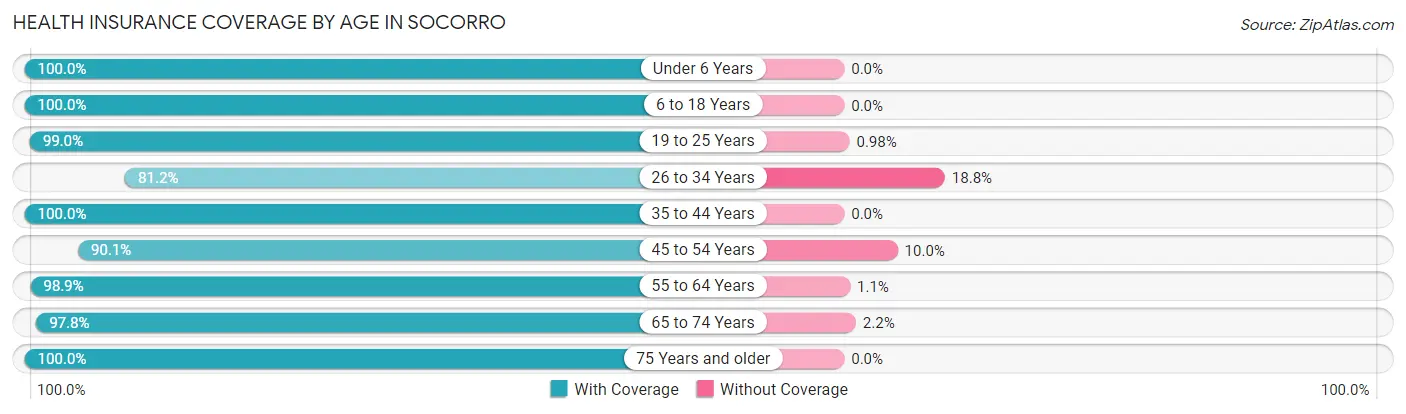
| Age Bracket | With Coverage | Without Coverage |
| Under 6 Years | 456 (100.0%) | 0 (0.0%) |
| 6 to 18 Years | 1,503 (100.0%) | 0 (0.0%) |
| 19 to 25 Years | 1,214 (99.0%) | 12 (1.0%) |
| 26 to 34 Years | 762 (81.2%) | 176 (18.8%) |
| 35 to 44 Years | 966 (100.0%) | 0 (0.0%) |
| 45 to 54 Years | 778 (90.0%) | 86 (10.0%) |
| 55 to 64 Years | 918 (98.9%) | 10 (1.1%) |
| 65 to 74 Years | 1,081 (97.8%) | 24 (2.2%) |
| 75 Years and older | 513 (100.0%) | 0 (0.0%) |
| Total | 8,191 (96.4%) | 308 (3.6%) |
Health Insurance Coverage by Citizenship Status in Socorro
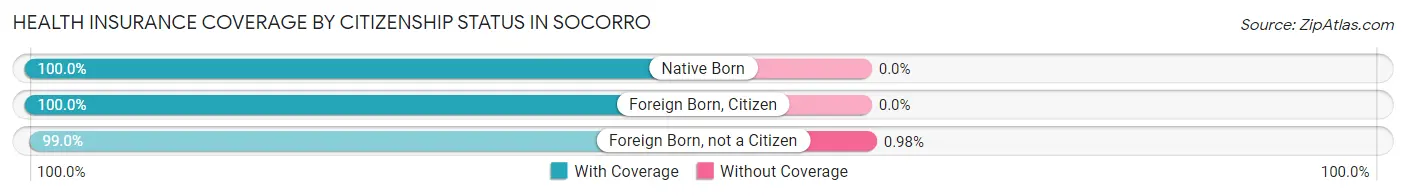
| Citizenship Status | With Coverage | Without Coverage |
| Native Born | 456 (100.0%) | 0 (0.0%) |
| Foreign Born, Citizen | 1,503 (100.0%) | 0 (0.0%) |
| Foreign Born, not a Citizen | 1,214 (99.0%) | 12 (1.0%) |
Health Insurance Coverage by Household Income in Socorro
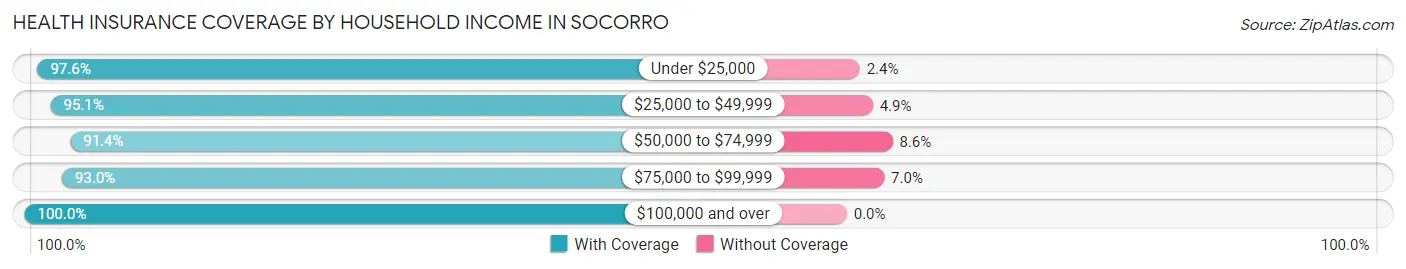
| Household Income | With Coverage | Without Coverage |
| Under $25,000 | 1,573 (97.6%) | 39 (2.4%) |
| $25,000 to $49,999 | 1,684 (95.1%) | 86 (4.9%) |
| $50,000 to $74,999 | 1,419 (91.4%) | 133 (8.6%) |
| $75,000 to $99,999 | 664 (93.0%) | 50 (7.0%) |
| $100,000 and over | 2,415 (100.0%) | 0 (0.0%) |
Public vs Private Health Insurance Coverage by Age in Socorro
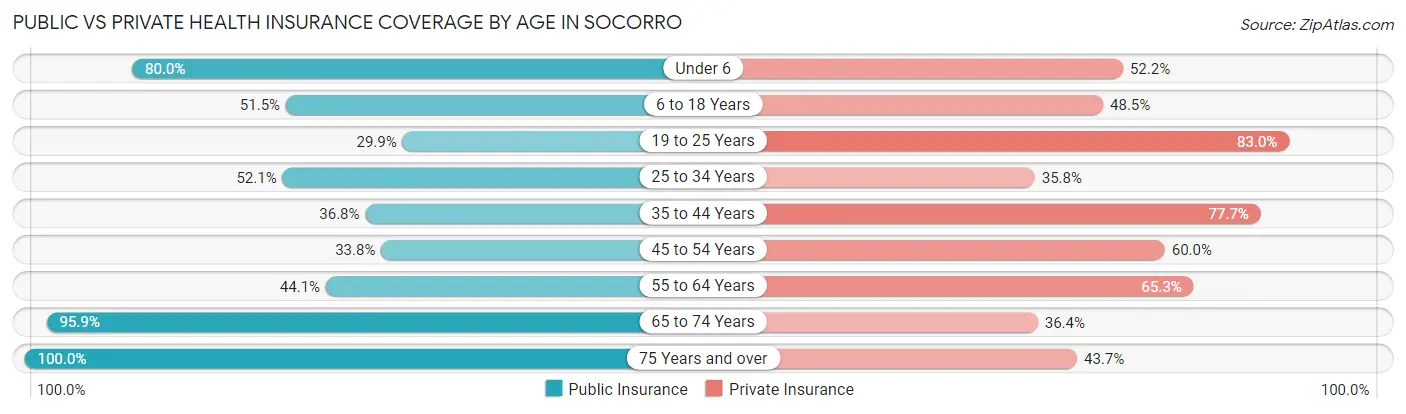
| Age Bracket | Public Insurance | Private Insurance |
| Under 6 | 365 (80.0%) | 238 (52.2%) |
| 6 to 18 Years | 774 (51.5%) | 729 (48.5%) |
| 19 to 25 Years | 366 (29.8%) | 1,018 (83.0%) |
| 25 to 34 Years | 489 (52.1%) | 336 (35.8%) |
| 35 to 44 Years | 355 (36.7%) | 751 (77.7%) |
| 45 to 54 Years | 292 (33.8%) | 518 (60.0%) |
| 55 to 64 Years | 409 (44.1%) | 606 (65.3%) |
| 65 to 74 Years | 1,060 (95.9%) | 402 (36.4%) |
| 75 Years and over | 513 (100.0%) | 224 (43.7%) |
| Total | 4,623 (54.4%) | 4,822 (56.7%) |
Disability Status by Sex by Age in Socorro
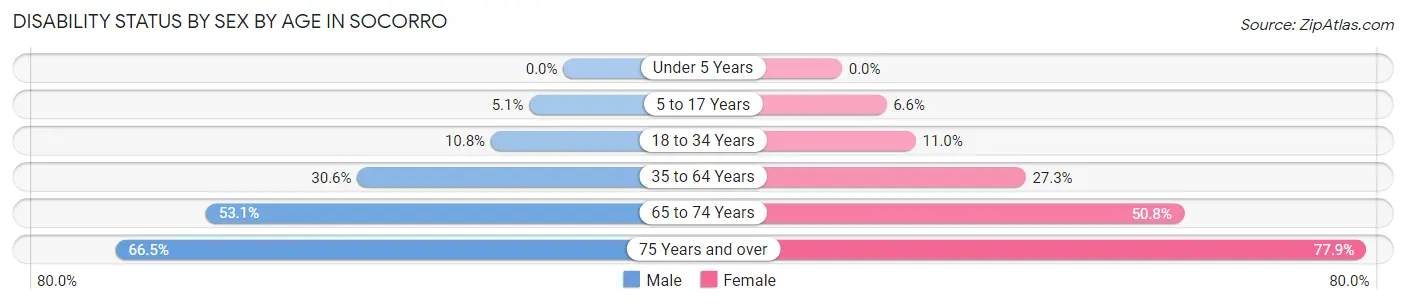
| Age Bracket | Male | Female |
| Under 5 Years | 0 (0.0%) | 0 (0.0%) |
| 5 to 17 Years | 21 (5.1%) | 44 (6.6%) |
| 18 to 34 Years | 144 (10.7%) | 140 (11.0%) |
| 35 to 64 Years | 450 (30.6%) | 351 (27.3%) |
| 65 to 74 Years | 275 (53.1%) | 298 (50.8%) |
| 75 Years and over | 131 (66.5%) | 246 (77.8%) |
Disability Class by Sex by Age in Socorro
Disability Class: Hearing Difficulty
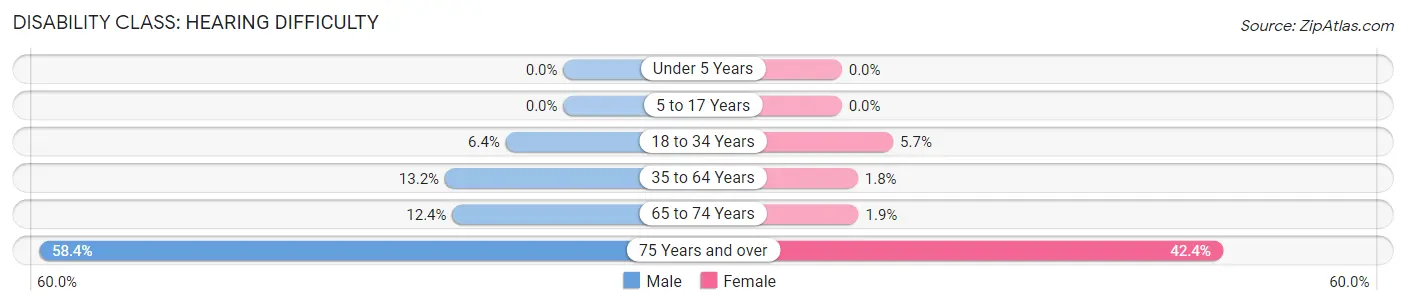
| Age Bracket | Male | Female |
| Under 5 Years | 0 (0.0%) | 0 (0.0%) |
| 5 to 17 Years | 0 (0.0%) | 0 (0.0%) |
| 18 to 34 Years | 86 (6.4%) | 73 (5.7%) |
| 35 to 64 Years | 194 (13.2%) | 23 (1.8%) |
| 65 to 74 Years | 64 (12.4%) | 11 (1.9%) |
| 75 Years and over | 115 (58.4%) | 134 (42.4%) |
Disability Class: Vision Difficulty
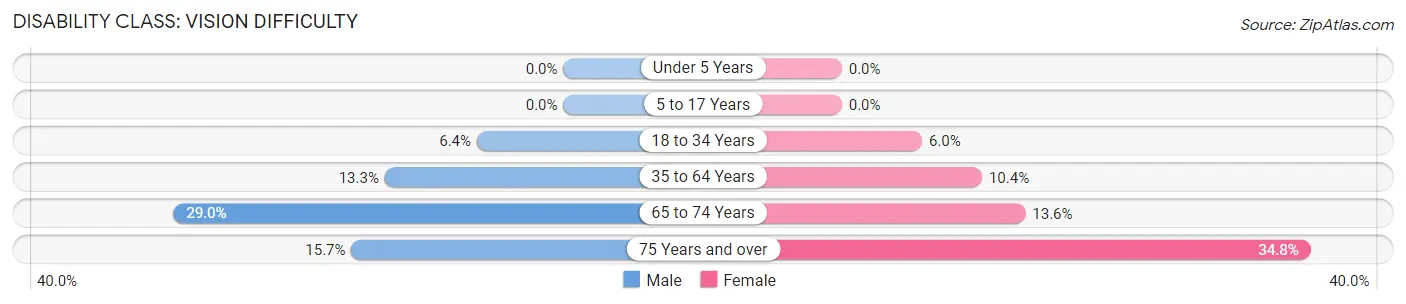
| Age Bracket | Male | Female |
| Under 5 Years | 0 (0.0%) | 0 (0.0%) |
| 5 to 17 Years | 0 (0.0%) | 0 (0.0%) |
| 18 to 34 Years | 86 (6.4%) | 76 (5.9%) |
| 35 to 64 Years | 195 (13.3%) | 134 (10.4%) |
| 65 to 74 Years | 150 (29.0%) | 80 (13.6%) |
| 75 Years and over | 31 (15.7%) | 110 (34.8%) |
Disability Class: Cognitive Difficulty
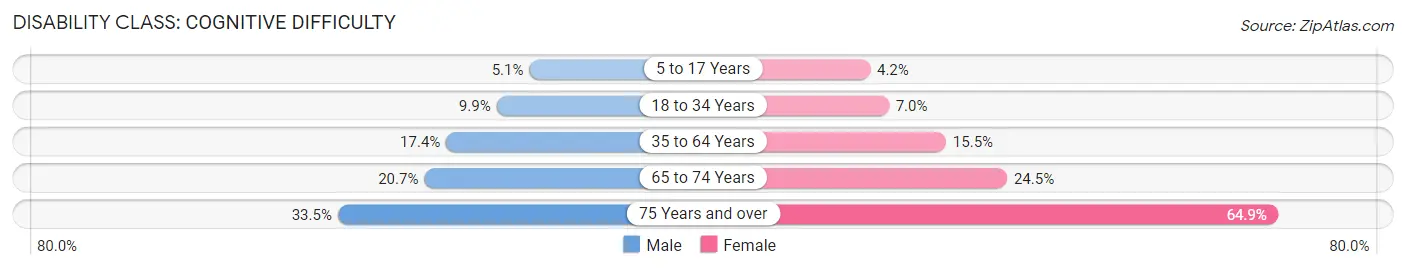
| Age Bracket | Male | Female |
| 5 to 17 Years | 21 (5.1%) | 28 (4.2%) |
| 18 to 34 Years | 133 (9.9%) | 89 (7.0%) |
| 35 to 64 Years | 256 (17.4%) | 199 (15.5%) |
| 65 to 74 Years | 107 (20.7%) | 144 (24.5%) |
| 75 Years and over | 66 (33.5%) | 205 (64.9%) |
Disability Class: Ambulatory Difficulty
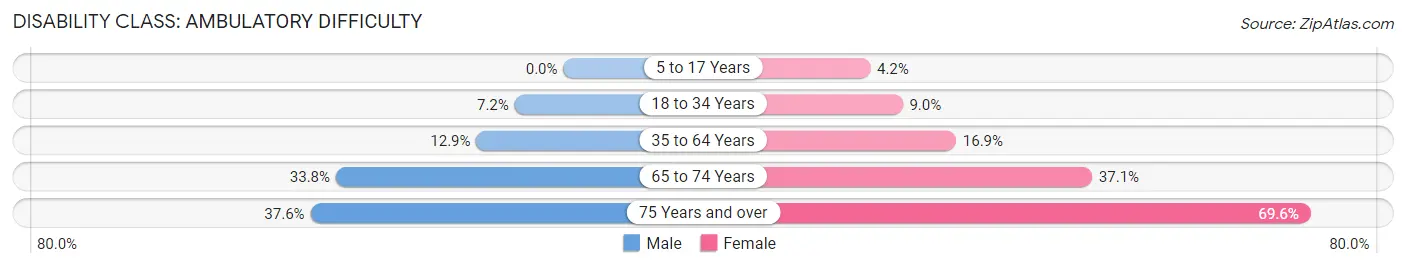
| Age Bracket | Male | Female |
| 5 to 17 Years | 0 (0.0%) | 28 (4.2%) |
| 18 to 34 Years | 97 (7.2%) | 115 (9.0%) |
| 35 to 64 Years | 190 (12.9%) | 218 (16.9%) |
| 65 to 74 Years | 175 (33.8%) | 218 (37.1%) |
| 75 Years and over | 74 (37.6%) | 220 (69.6%) |
Disability Class: Self-Care Difficulty
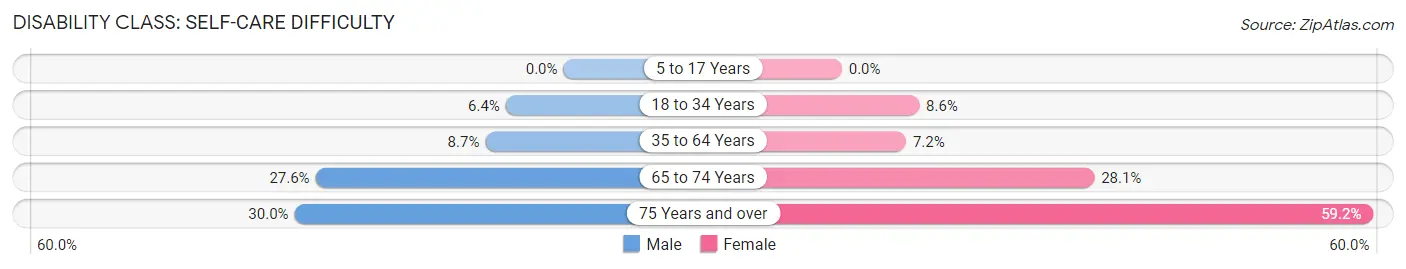
| Age Bracket | Male | Female |
| 5 to 17 Years | 0 (0.0%) | 0 (0.0%) |
| 18 to 34 Years | 86 (6.4%) | 110 (8.6%) |
| 35 to 64 Years | 128 (8.7%) | 92 (7.1%) |
| 65 to 74 Years | 143 (27.6%) | 165 (28.1%) |
| 75 Years and over | 59 (29.9%) | 187 (59.2%) |
Technology Access in Socorro
Computing Device Access in Socorro
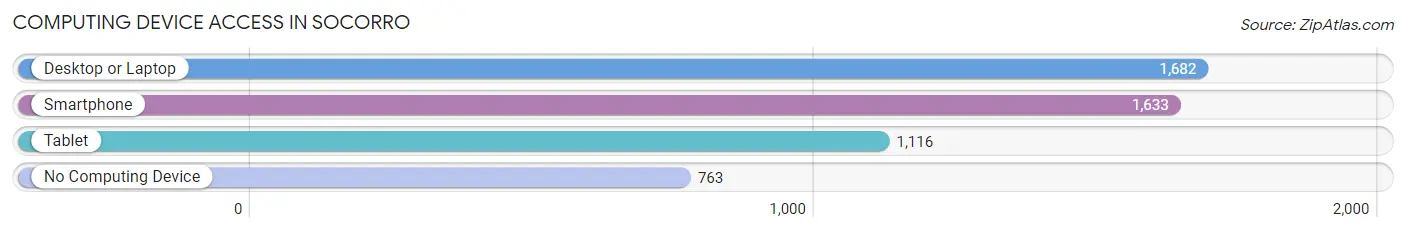
| Device Type | # Households | % Households |
| Desktop or Laptop | 1,682 | 62.4% |
| Smartphone | 1,633 | 60.6% |
| Tablet | 1,116 | 41.4% |
| No Computing Device | 763 | 28.3% |
| Total | 2,694 | 100.0% |
Internet Access in Socorro
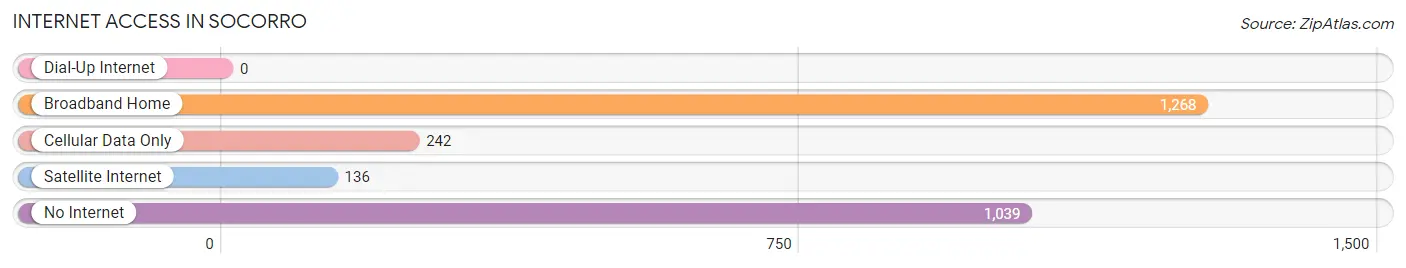
| Internet Type | # Households | % Households |
| Dial-Up Internet | 0 | 0.0% |
| Broadband Home | 1,268 | 47.1% |
| Cellular Data Only | 242 | 9.0% |
| Satellite Internet | 136 | 5.1% |
| No Internet | 1,039 | 38.6% |
| Total | 2,694 | 100.0% |
Socorro Summary
Socorro, New Mexico is a small city located in the Rio Grande Valley of Central New Mexico. It is the county seat of Socorro County and is located about 60 miles south of Albuquerque. The city has a population of 8,906 as of the 2010 census, making it the ninth largest city in the state.
History
The area around Socorro has been inhabited for thousands of years by various Native American tribes, including the Apache, Navajo, and Pueblo. The first Europeans to visit the area were Spanish explorers in the late 1500s. The area was part of the Spanish province of New Mexico until 1821, when Mexico gained independence from Spain. The area was then part of the Mexican state of Chihuahua until 1848, when the United States acquired it as part of the Treaty of Guadalupe Hidalgo.
The city of Socorro was founded in 1854 by a group of settlers from the nearby town of San Miguel del Bado. The settlers named the new town after the nearby Socorro River, which was named by the Spanish for the “help” they received from the local Native Americans. The town quickly grew and by the late 1800s had become an important trading center for the region.
Geography
Socorro is located in the Rio Grande Valley of Central New Mexico. The city is situated at an elevation of 4,719 feet and is surrounded by the San Mateo Mountains to the east and the Magdalena Mountains to the west. The Rio Grande River flows through the city, providing a source of water for the area.
The climate in Socorro is semi-arid, with hot summers and mild winters. The average annual temperature is 64°F, with an average high of 90°F in the summer and an average low of 37°F in the winter. The average annual precipitation is 11.5 inches, with most of it falling in the summer months.
Economy
The economy of Socorro is largely based on agriculture, with the main crops being alfalfa, cotton, and chile peppers. The city is also home to several manufacturing companies, including a large solar panel manufacturing plant. The city is also home to New Mexico Tech, a research university that specializes in science and engineering.
The city’s largest employer is the New Mexico Institute of Mining and Technology, which employs over 1,000 people. Other major employers include the Socorro Independent School District, the Socorro County government, and the Socorro General Hospital.
Demographics
As of the 2010 census, the population of Socorro was 8,906. The racial makeup of the city was 73.3% White, 0.9% African American, 1.2% Native American, 0.7% Asian, 0.1% Pacific Islander, 20.2% from other races, and 3.6% from two or more races. Hispanic or Latino of any race were 57.2% of the population.
The median household income in Socorro was $30,945, and the median family income was $37,917. The per capita income for the city was $17,845. About 18.2% of families and 22.2% of the population were below the poverty line, including 28.3% of those under age 18 and 11.2% of those age 65 or over.
Common Questions
What is Per Capita Income in Socorro?
Per Capita income in Socorro is $24,929.
What is the Median Family Income in Socorro?
Median Family Income in Socorro is $60,769.
What is the Median Household income in Socorro?
Median Household Income in Socorro is $42,622.
What is Income or Wage Gap in Socorro?
Income or Wage Gap in Socorro is 14.1%.
Women in Socorro earn 85.9 cents for every dollar earned by a man.
What is Family Income Deficit in Socorro?
Family Income Deficit in Socorro is $7,486.
Families that are below poverty line in Socorro earn $7,486 less on average than the poverty threshold level.
What is Inequality or Gini Index in Socorro?
Inequality or Gini Index in Socorro is 0.49.
What is the Total Population of Socorro?
Total Population of Socorro is 8,605.
What is the Total Male Population of Socorro?
Total Male Population of Socorro is 4,317.
What is the Total Female Population of Socorro?
Total Female Population of Socorro is 4,288.
What is the Ratio of Males per 100 Females in Socorro?
There are 100.68 Males per 100 Females in Socorro.
What is the Ratio of Females per 100 Males in Socorro?
There are 99.33 Females per 100 Males in Socorro.
What is the Median Population Age in Socorro?
Median Population Age in Socorro is 36.4 Years.
What is the Average Family Size in Socorro
Average Family Size in Socorro is 4.0 People.
What is the Average Household Size in Socorro
Average Household Size in Socorro is 3.0 People.
How Large is the Labor Force in Socorro?
There are 3,293 People in the Labor Forcein in Socorro.
What is the Percentage of People in the Labor Force in Socorro?
45.4% of People are in the Labor Force in Socorro.
What is the Unemployment Rate in Socorro?
Unemployment Rate in Socorro is 3.0%.