Farmington, NM Map & Demographics
Farmington Map
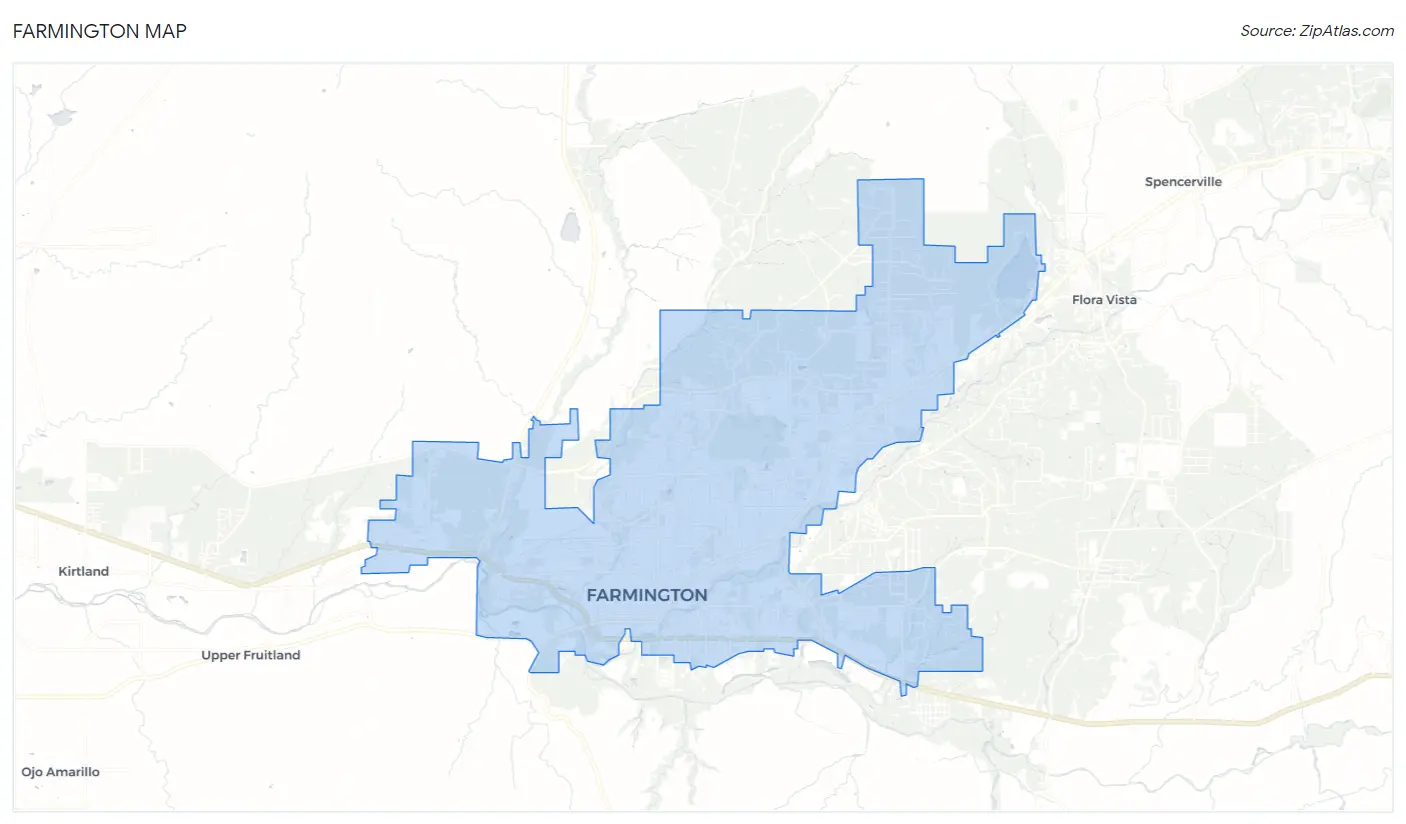
Farmington Overview
$28,961
PER CAPITA INCOME
$72,723
AVG FAMILY INCOME
$61,388
AVG HOUSEHOLD INCOME
33.9%
WAGE / INCOME GAP [ % ]
66.1¢/ $1
WAGE / INCOME GAP [ $ ]
$15,113
FAMILY INCOME DEFICIT
0.46
INEQUALITY / GINI INDEX
46,457
TOTAL POPULATION
22,467
MALE POPULATION
23,990
FEMALE POPULATION
93.65
MALES / 100 FEMALES
106.78
FEMALES / 100 MALES
35.7
MEDIAN AGE
3.4
AVG FAMILY SIZE
2.8
AVG HOUSEHOLD SIZE
19,774
LABOR FORCE [ PEOPLE ]
56.7%
PERCENT IN LABOR FORCE
7.7%
UNEMPLOYMENT RATE
Farmington Area Codes
Income in Farmington
Income Overview in Farmington
Per Capita Income in Farmington is $28,961, while median incomes of families and households are $72,723 and $61,388 respectively.
| Characteristic | Number | Measure |
| Per Capita Income | 46,457 | $28,961 |
| Median Family Income | 11,010 | $72,723 |
| Mean Family Income | 11,010 | $92,334 |
| Median Household Income | 15,868 | $61,388 |
| Mean Household Income | 15,868 | $82,149 |
| Income Deficit | 11,010 | $15,113 |
| Wage / Income Gap (%) | 46,457 | 33.85% |
| Wage / Income Gap ($) | 46,457 | 66.15¢ per $1 |
| Gini / Inequality Index | 46,457 | 0.46 |
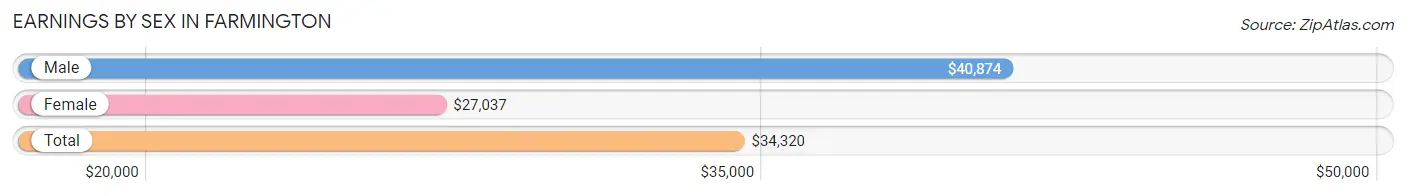
Earnings by Sex in Farmington
Average Earnings in Farmington are $34,320, $40,874 for men and $27,037 for women, a difference of 33.9%.
| Sex | Number | Average Earnings |
| Male | 10,907 (52.2%) | $40,874 |
| Female | 9,989 (47.8%) | $27,037 |
| Total | 20,896 (100.0%) | $34,320 |
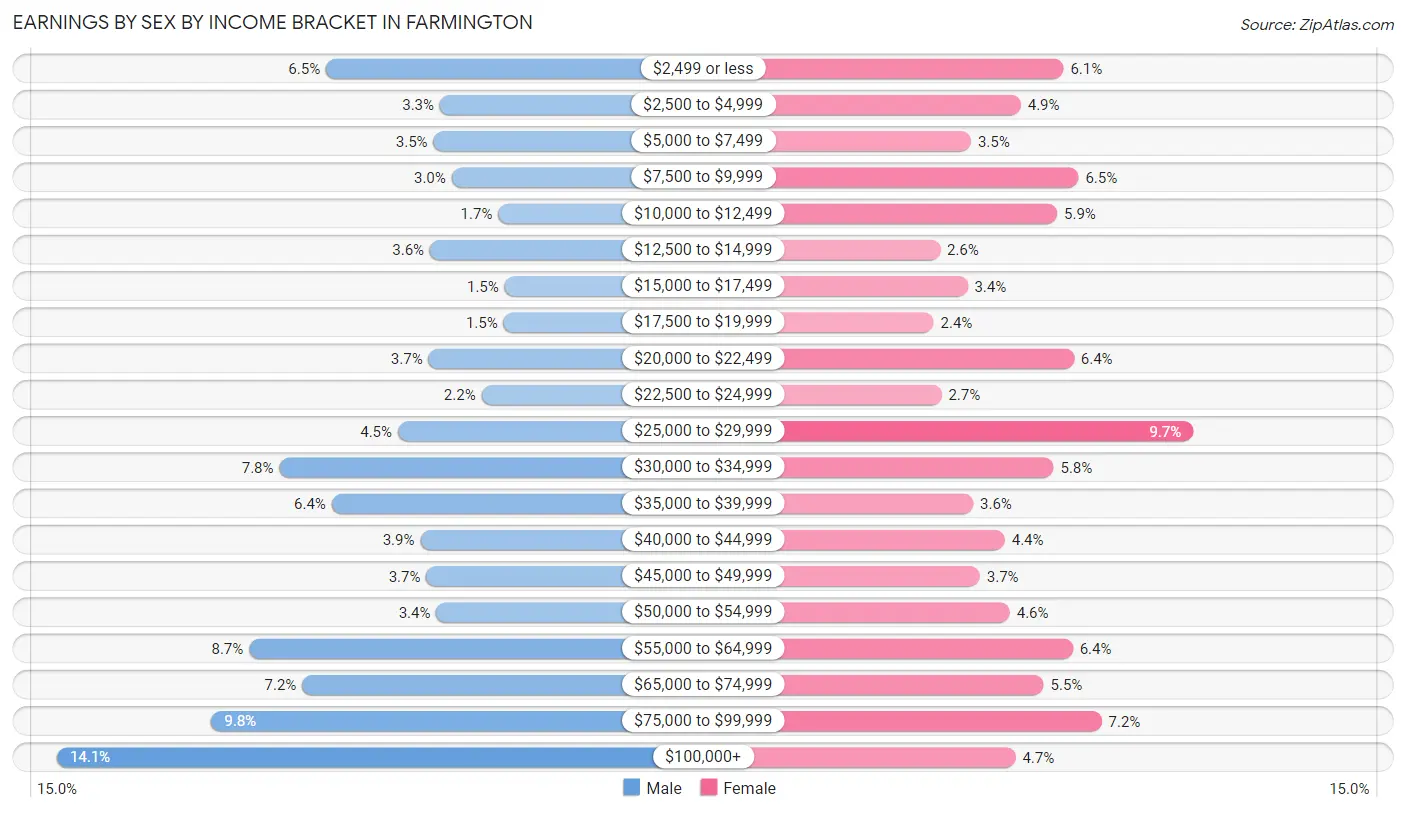
Earnings by Sex by Income Bracket in Farmington
The most common earnings brackets in Farmington are $100,000+ for men (1,537 | 14.1%) and $25,000 to $29,999 for women (972 | 9.7%).
| Income | Male | Female |
| $2,499 or less | 712 (6.5%) | 608 (6.1%) |
| $2,500 to $4,999 | 363 (3.3%) | 488 (4.9%) |
| $5,000 to $7,499 | 383 (3.5%) | 349 (3.5%) |
| $7,500 to $9,999 | 327 (3.0%) | 650 (6.5%) |
| $10,000 to $12,499 | 184 (1.7%) | 590 (5.9%) |
| $12,500 to $14,999 | 394 (3.6%) | 262 (2.6%) |
| $15,000 to $17,499 | 165 (1.5%) | 339 (3.4%) |
| $17,500 to $19,999 | 168 (1.5%) | 244 (2.4%) |
| $20,000 to $22,499 | 398 (3.6%) | 637 (6.4%) |
| $22,500 to $24,999 | 236 (2.2%) | 266 (2.7%) |
| $25,000 to $29,999 | 492 (4.5%) | 972 (9.7%) |
| $30,000 to $34,999 | 855 (7.8%) | 580 (5.8%) |
| $35,000 to $39,999 | 695 (6.4%) | 355 (3.5%) |
| $40,000 to $44,999 | 423 (3.9%) | 444 (4.4%) |
| $45,000 to $49,999 | 405 (3.7%) | 374 (3.7%) |
| $50,000 to $54,999 | 374 (3.4%) | 457 (4.6%) |
| $55,000 to $64,999 | 948 (8.7%) | 634 (6.4%) |
| $65,000 to $74,999 | 785 (7.2%) | 552 (5.5%) |
| $75,000 to $99,999 | 1,063 (9.8%) | 715 (7.2%) |
| $100,000+ | 1,537 (14.1%) | 473 (4.7%) |
| Total | 10,907 (100.0%) | 9,989 (100.0%) |
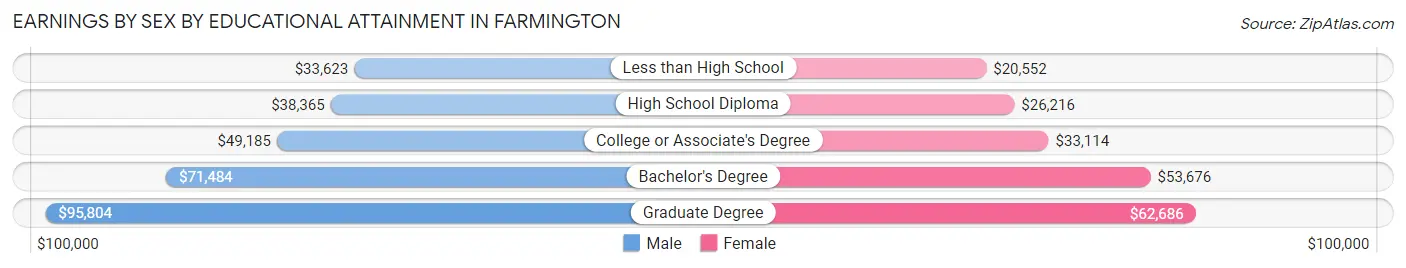
Earnings by Sex by Educational Attainment in Farmington
Average earnings in Farmington are $49,243 for men and $31,919 for women, a difference of 35.2%. Men with an educational attainment of graduate degree enjoy the highest average annual earnings of $95,804, while those with less than high school education earn the least with $33,623. Women with an educational attainment of graduate degree earn the most with the average annual earnings of $62,686, while those with less than high school education have the smallest earnings of $20,552.
| Educational Attainment | Male Income | Female Income |
| Less than High School | $33,623 | $20,552 |
| High School Diploma | $38,365 | $26,216 |
| College or Associate's Degree | $49,185 | $33,114 |
| Bachelor's Degree | $71,484 | $53,676 |
| Graduate Degree | $95,804 | $62,686 |
| Total | $49,243 | $31,919 |
Family Income in Farmington
Family Income Brackets in Farmington
According to the Farmington family income data, there are 2,301 families falling into the $50,000 to $74,999 income range, which is the most common income bracket and makes up 20.9% of all families. Conversely, the $10,000 to $14,999 income bracket is the least frequent group with only 242 families (2.2%) belonging to this category.
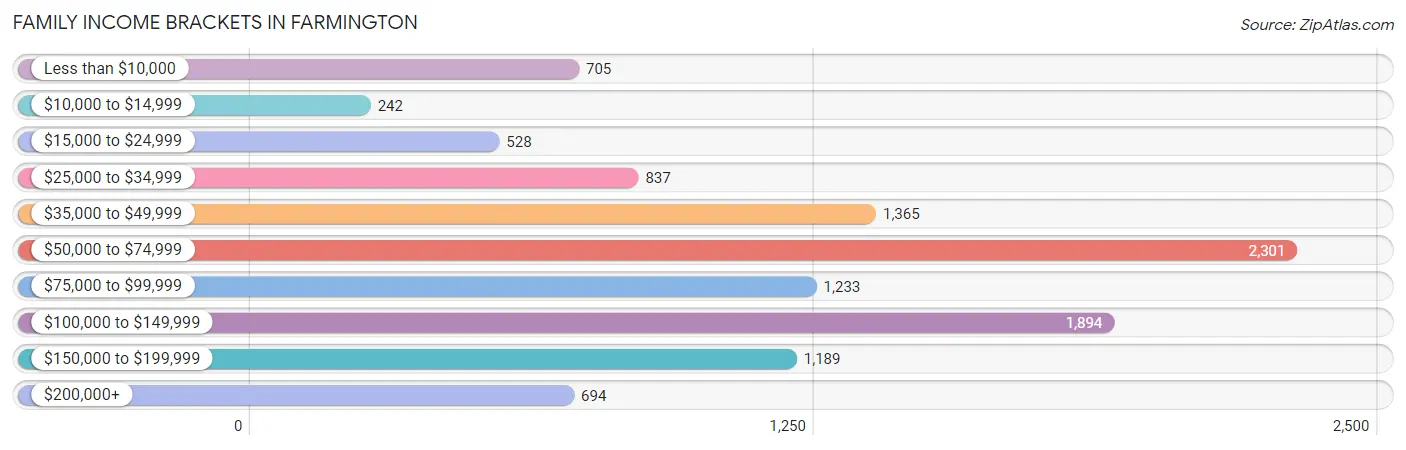
| Income Bracket | # Families | % Families |
| Less than $10,000 | 705 | 6.4% |
| $10,000 to $14,999 | 242 | 2.2% |
| $15,000 to $24,999 | 528 | 4.8% |
| $25,000 to $34,999 | 837 | 7.6% |
| $35,000 to $49,999 | 1,365 | 12.4% |
| $50,000 to $74,999 | 2,301 | 20.9% |
| $75,000 to $99,999 | 1,233 | 11.2% |
| $100,000 to $149,999 | 1,894 | 17.2% |
| $150,000 to $199,999 | 1,189 | 10.8% |
| $200,000+ | 694 | 6.3% |
Family Income by Famaliy Size in Farmington
5-person families (862 | 7.8%) account for the highest median family income in Farmington with $87,273 per family, while 2-person families (5,026 | 45.7%) have the highest median income of $32,050 per family member.
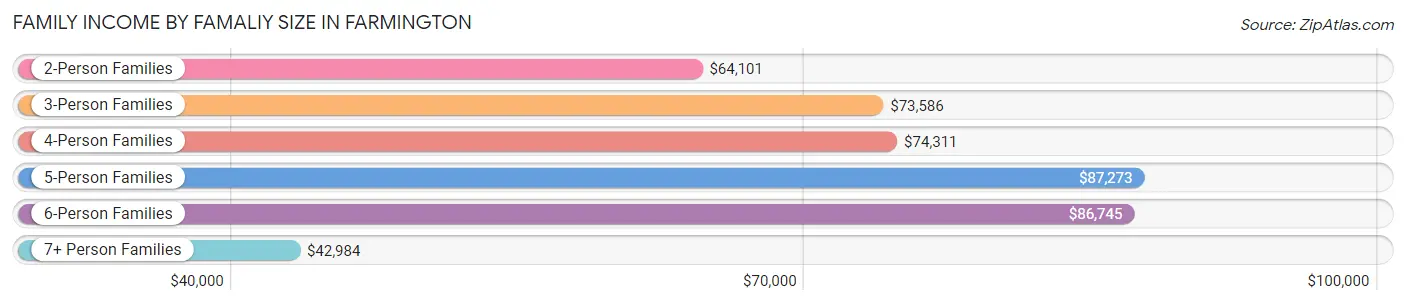
| Income Bracket | # Families | Median Income |
| 2-Person Families | 5,026 (45.7%) | $64,101 |
| 3-Person Families | 2,009 (18.2%) | $73,586 |
| 4-Person Families | 2,203 (20.0%) | $74,311 |
| 5-Person Families | 862 (7.8%) | $87,273 |
| 6-Person Families | 692 (6.3%) | $86,745 |
| 7+ Person Families | 218 (2.0%) | $42,984 |
| Total | 11,010 (100.0%) | $72,723 |
Family Income by Number of Earners in Farmington
The median family income in Farmington is $72,723, with families comprising 2 earners (3,635) having the highest median family income of $111,103, while families with no earners (1,861) have the lowest median family income of $41,007, accounting for 33.0% and 16.9% of families, respectively.
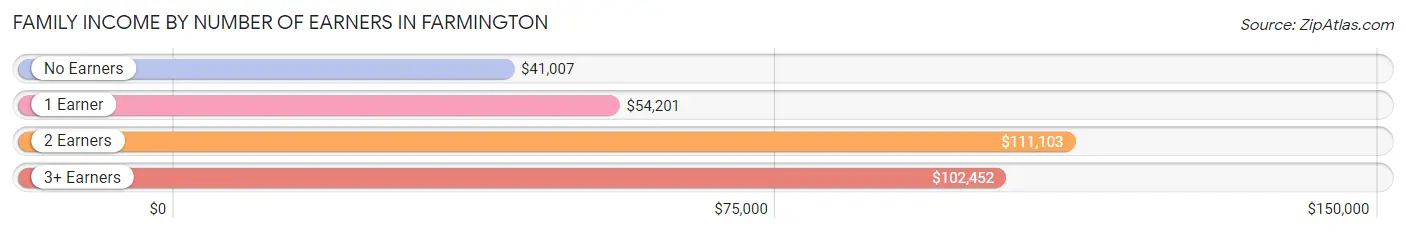
| Number of Earners | # Families | Median Income |
| No Earners | 1,861 (16.9%) | $41,007 |
| 1 Earner | 4,153 (37.7%) | $54,201 |
| 2 Earners | 3,635 (33.0%) | $111,103 |
| 3+ Earners | 1,361 (12.4%) | $102,452 |
| Total | 11,010 (100.0%) | $72,723 |
Household Income in Farmington
Household Income Brackets in Farmington
With 3,015 households falling in the category, the $50,000 to $74,999 income range is the most frequent in Farmington, accounting for 19.0% of all households. In contrast, only 762 households (4.8%) fall into the $10,000 to $14,999 income bracket, making it the least populous group.
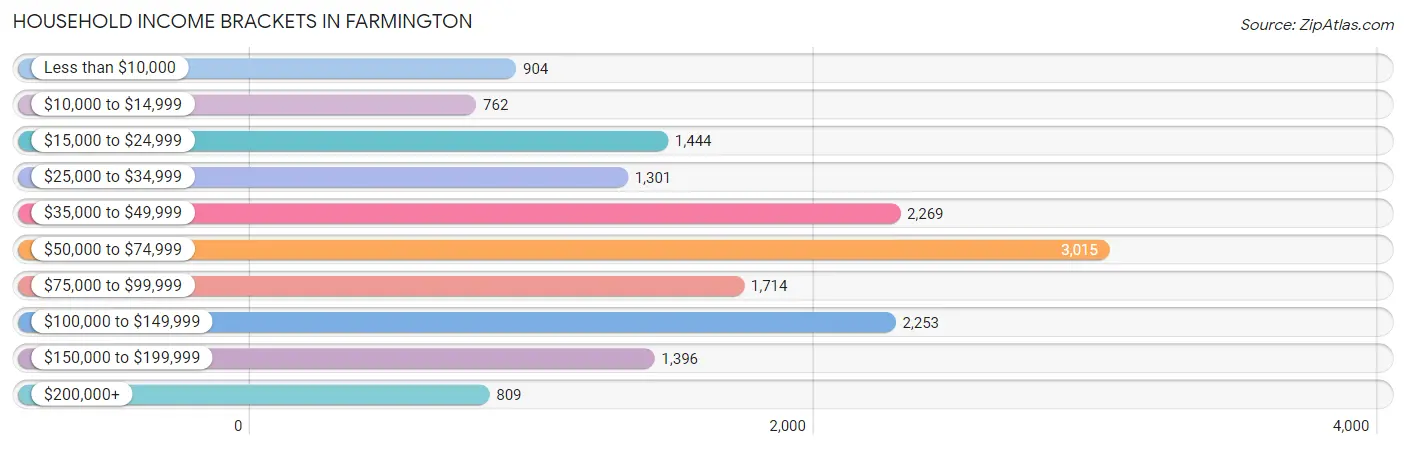
| Income Bracket | # Households | % Households |
| Less than $10,000 | 904 | 5.7% |
| $10,000 to $14,999 | 762 | 4.8% |
| $15,000 to $24,999 | 1,444 | 9.1% |
| $25,000 to $34,999 | 1,301 | 8.2% |
| $35,000 to $49,999 | 2,269 | 14.3% |
| $50,000 to $74,999 | 3,015 | 19.0% |
| $75,000 to $99,999 | 1,714 | 10.8% |
| $100,000 to $149,999 | 2,253 | 14.2% |
| $150,000 to $199,999 | 1,396 | 8.8% |
| $200,000+ | 809 | 5.1% |
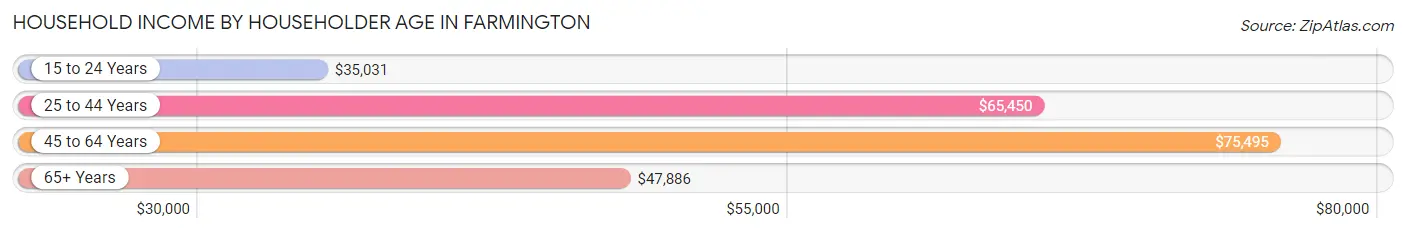
Household Income by Householder Age in Farmington
The median household income in Farmington is $61,388, with the highest median household income of $75,495 found in the 45 to 64 years age bracket for the primary householder. A total of 5,372 households (33.9%) fall into this category. Meanwhile, the 15 to 24 years age bracket for the primary householder has the lowest median household income of $35,031, with 535 households (3.4%) in this group.
| Income Bracket | # Households | Median Income |
| 15 to 24 Years | 535 (3.4%) | $35,031 |
| 25 to 44 Years | 5,979 (37.7%) | $65,450 |
| 45 to 64 Years | 5,372 (33.9%) | $75,495 |
| 65+ Years | 3,982 (25.1%) | $47,886 |
| Total | 15,868 (100.0%) | $61,388 |
Poverty in Farmington
Income Below Poverty by Sex and Age in Farmington
With 20.7% poverty level for males and 20.8% for females among the residents of Farmington, 12 to 14 year old males and 18 to 24 year old females are the most vulnerable to poverty, with 479 males (40.6%) and 827 females (37.3%) in their respective age groups living below the poverty level.
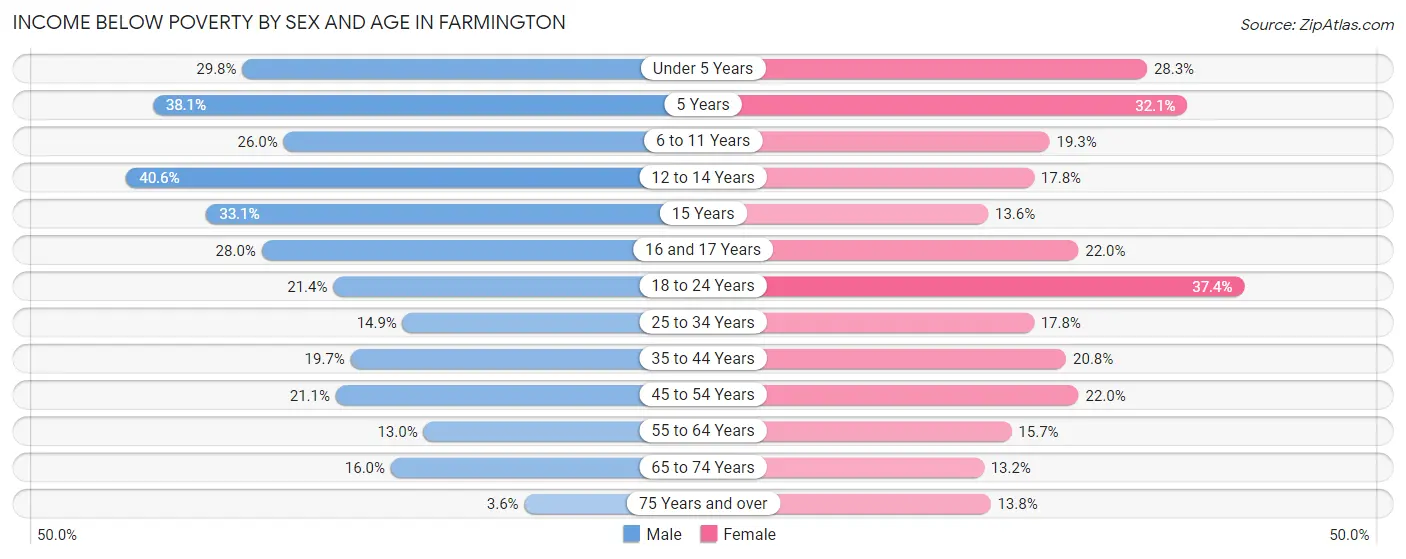
| Age Bracket | Male | Female |
| Under 5 Years | 463 (29.8%) | 501 (28.3%) |
| 5 Years | 80 (38.1%) | 76 (32.1%) |
| 6 to 11 Years | 574 (26.0%) | 395 (19.3%) |
| 12 to 14 Years | 479 (40.6%) | 282 (17.8%) |
| 15 Years | 55 (33.1%) | 60 (13.6%) |
| 16 and 17 Years | 254 (28.0%) | 160 (22.0%) |
| 18 to 24 Years | 350 (21.3%) | 827 (37.3%) |
| 25 to 34 Years | 410 (14.9%) | 462 (17.8%) |
| 35 to 44 Years | 678 (19.7%) | 720 (20.8%) |
| 45 to 54 Years | 518 (21.1%) | 539 (22.0%) |
| 55 to 64 Years | 309 (13.0%) | 379 (15.7%) |
| 65 to 74 Years | 282 (16.0%) | 271 (13.2%) |
| 75 Years and over | 36 (3.6%) | 209 (13.8%) |
| Total | 4,488 (20.7%) | 4,881 (20.8%) |
Income Above Poverty by Sex and Age in Farmington
According to the poverty statistics in Farmington, males aged 75 years and over and females aged 65 to 74 years are the age groups that are most secure financially, with 96.4% of males and 86.8% of females in these age groups living above the poverty line.
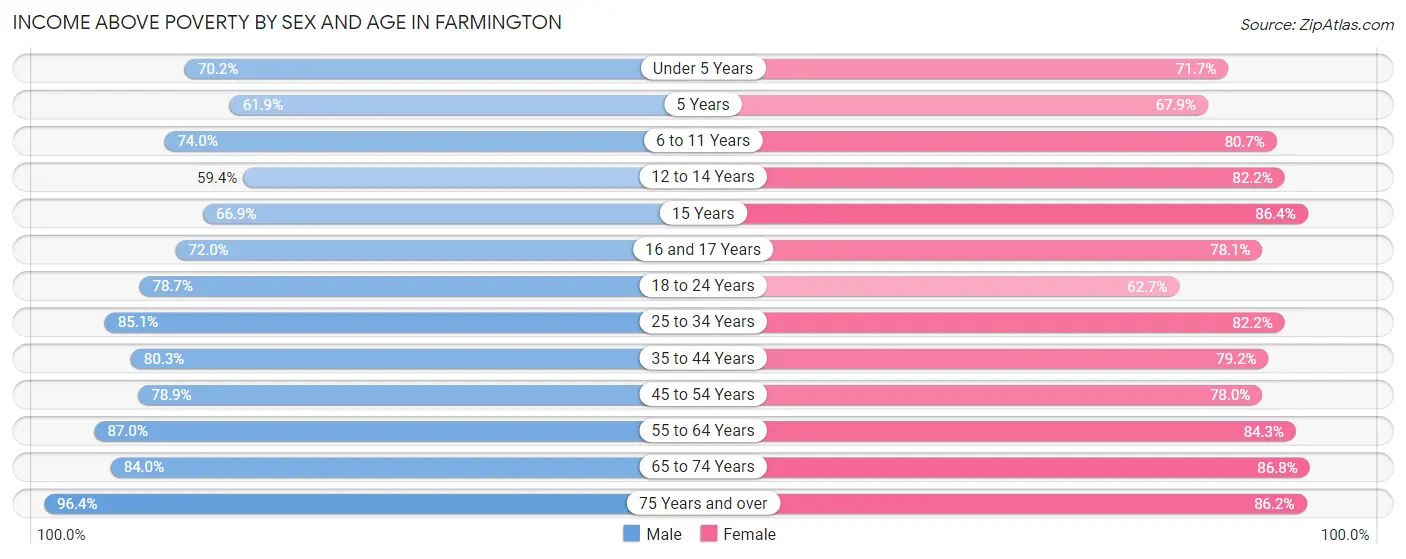
| Age Bracket | Male | Female |
| Under 5 Years | 1,091 (70.2%) | 1,268 (71.7%) |
| 5 Years | 130 (61.9%) | 161 (67.9%) |
| 6 to 11 Years | 1,636 (74.0%) | 1,654 (80.7%) |
| 12 to 14 Years | 702 (59.4%) | 1,300 (82.2%) |
| 15 Years | 111 (66.9%) | 382 (86.4%) |
| 16 and 17 Years | 653 (72.0%) | 569 (78.0%) |
| 18 to 24 Years | 1,289 (78.6%) | 1,387 (62.6%) |
| 25 to 34 Years | 2,340 (85.1%) | 2,132 (82.2%) |
| 35 to 44 Years | 2,756 (80.3%) | 2,739 (79.2%) |
| 45 to 54 Years | 1,935 (78.9%) | 1,914 (78.0%) |
| 55 to 64 Years | 2,071 (87.0%) | 2,029 (84.3%) |
| 65 to 74 Years | 1,479 (84.0%) | 1,786 (86.8%) |
| 75 Years and over | 962 (96.4%) | 1,305 (86.2%) |
| Total | 17,155 (79.3%) | 18,626 (79.2%) |
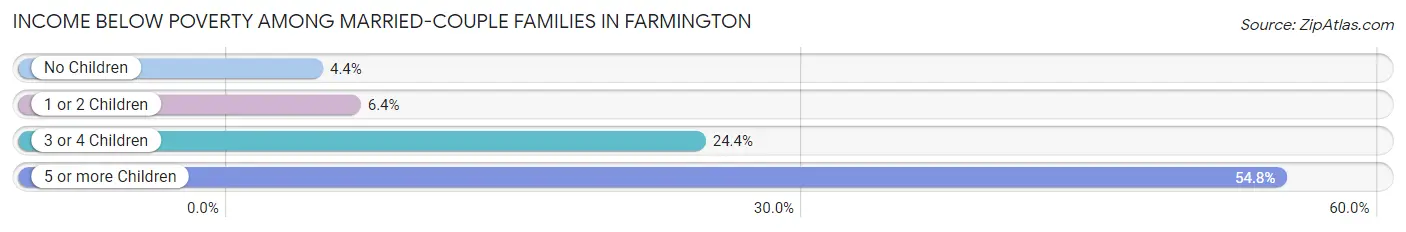
Income Below Poverty Among Married-Couple Families in Farmington
The poverty statistics for married-couple families in Farmington show that 8.5% or 632 of the total 7,448 families live below the poverty line. Families with 5 or more children have the highest poverty rate of 54.8%, comprising of 80 families. On the other hand, families with no children have the lowest poverty rate of 4.4%, which includes 183 families.
| Children | Above Poverty | Below Poverty |
| No Children | 3,939 (95.6%) | 183 (4.4%) |
| 1 or 2 Children | 2,118 (93.6%) | 145 (6.4%) |
| 3 or 4 Children | 693 (75.6%) | 224 (24.4%) |
| 5 or more Children | 66 (45.2%) | 80 (54.8%) |
| Total | 6,816 (91.5%) | 632 (8.5%) |
Income Below Poverty Among Single-Parent Households in Farmington
According to the poverty data in Farmington, 11.7% or 151 single-father households and 32.9% or 745 single-mother households are living below the poverty line. Among single-father households, those with no children have the highest poverty rate, with 62 households (18.1%) experiencing poverty. Likewise, among single-mother households, those with 5 or more children have the highest poverty rate, with 23 households (100.0%) falling below the poverty line.
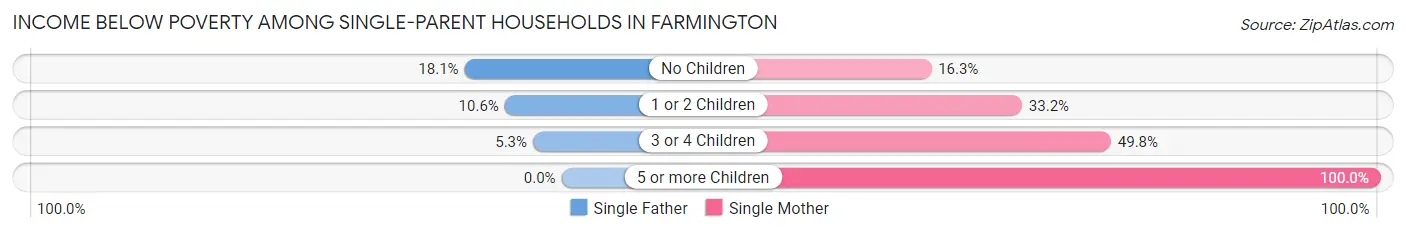
| Children | Single Father | Single Mother |
| No Children | 62 (18.1%) | 90 (16.3%) |
| 1 or 2 Children | 77 (10.6%) | 420 (33.2%) |
| 3 or 4 Children | 12 (5.3%) | 212 (49.8%) |
| 5 or more Children | 0 (0.0%) | 23 (100.0%) |
| Total | 151 (11.7%) | 745 (32.9%) |
Income Below Poverty Among Married-Couple vs Single-Parent Households in Farmington
The poverty data for Farmington shows that 632 of the married-couple family households (8.5%) and 896 of the single-parent households (25.2%) are living below the poverty level. Within the married-couple family households, those with 5 or more children have the highest poverty rate, with 80 households (54.8%) falling below the poverty line. Among the single-parent households, those with 5 or more children have the highest poverty rate, with 23 household (100.0%) living below poverty.
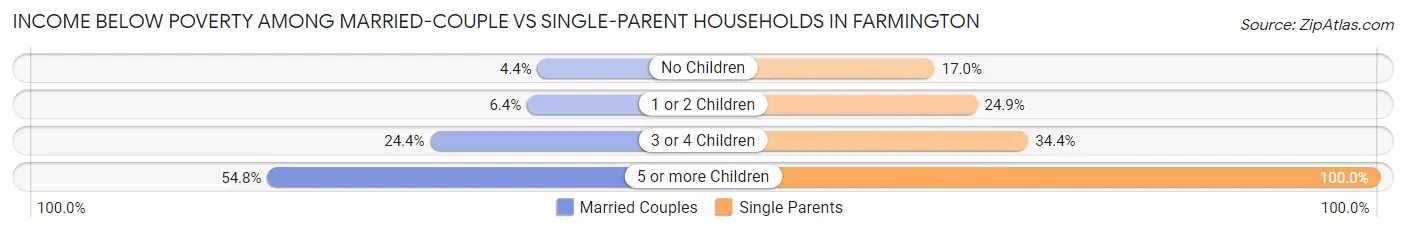
| Children | Married-Couple Families | Single-Parent Households |
| No Children | 183 (4.4%) | 152 (17.0%) |
| 1 or 2 Children | 145 (6.4%) | 497 (24.9%) |
| 3 or 4 Children | 224 (24.4%) | 224 (34.4%) |
| 5 or more Children | 80 (54.8%) | 23 (100.0%) |
| Total | 632 (8.5%) | 896 (25.2%) |
Race in Farmington
The most populous races in Farmington are White / Caucasian (24,541 | 52.8%), Native / Alaskan (13,239 | 28.5%), and Hispanic or Latino (11,993 | 25.8%).
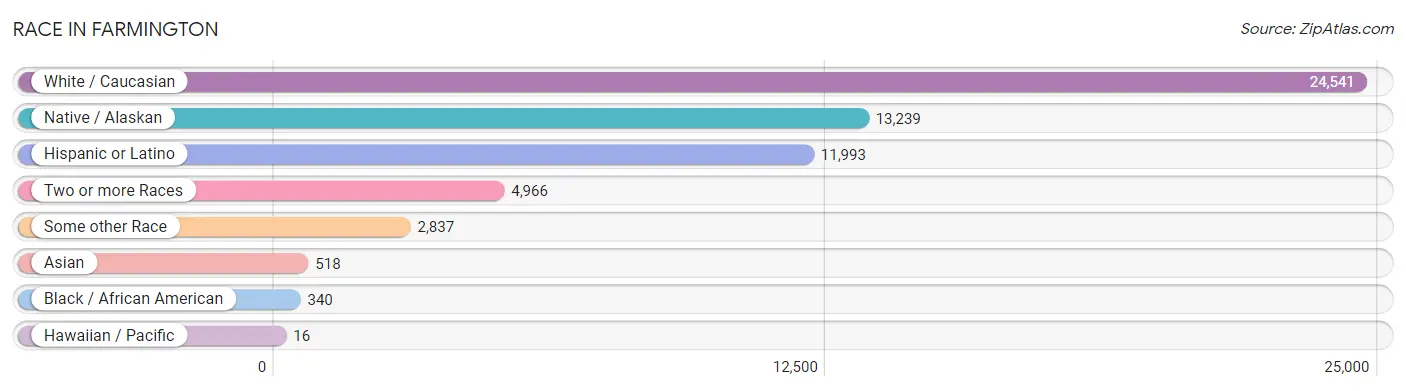
| Race | # Population | % Population |
| Asian | 518 | 1.1% |
| Black / African American | 340 | 0.7% |
| Hawaiian / Pacific | 16 | 0.0% |
| Hispanic or Latino | 11,993 | 25.8% |
| Native / Alaskan | 13,239 | 28.5% |
| White / Caucasian | 24,541 | 52.8% |
| Two or more Races | 4,966 | 10.7% |
| Some other Race | 2,837 | 6.1% |
| Total | 46,457 | 100.0% |
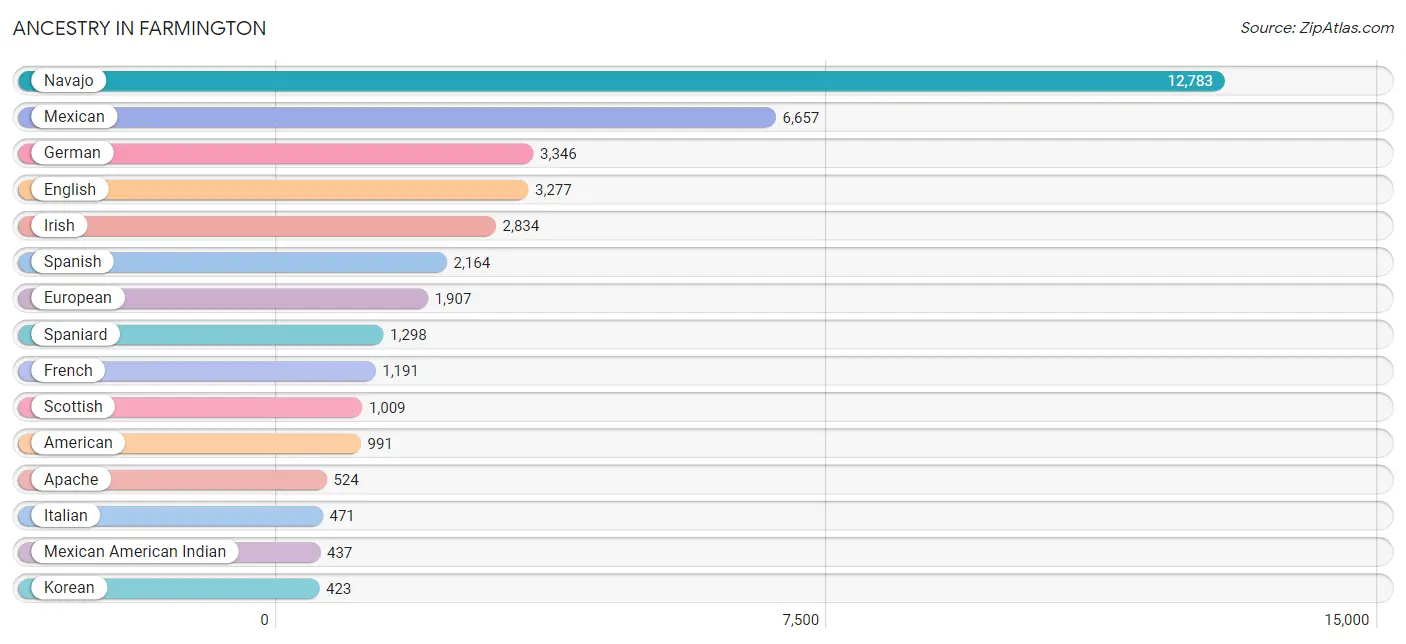
Ancestry in Farmington
The most populous ancestries reported in Farmington are Navajo (12,783 | 27.5%), Mexican (6,657 | 14.3%), German (3,346 | 7.2%), English (3,277 | 7.0%), and Irish (2,834 | 6.1%), together accounting for 62.2% of all Farmington residents.
| Ancestry | # Population | % Population |
| African | 16 | 0.0% |
| American | 991 | 2.1% |
| Apache | 524 | 1.1% |
| Austrian | 100 | 0.2% |
| Basque | 31 | 0.1% |
| Belgian | 64 | 0.1% |
| Bhutanese | 62 | 0.1% |
| Blackfeet | 2 | 0.0% |
| Brazilian | 1 | 0.0% |
| British | 94 | 0.2% |
| Burmese | 34 | 0.1% |
| Canadian | 34 | 0.1% |
| Central American | 7 | 0.0% |
| Cherokee | 148 | 0.3% |
| Cheyenne | 2 | 0.0% |
| Chippewa | 32 | 0.1% |
| Choctaw | 52 | 0.1% |
| Colombian | 22 | 0.1% |
| Comanche | 2 | 0.0% |
| Creek | 32 | 0.1% |
| Cuban | 31 | 0.1% |
| Czech | 160 | 0.3% |
| Czechoslovakian | 32 | 0.1% |
| Danish | 158 | 0.3% |
| Dominican | 7 | 0.0% |
| Dutch | 380 | 0.8% |
| Dutch West Indian | 6 | 0.0% |
| Eastern European | 86 | 0.2% |
| Ecuadorian | 26 | 0.1% |
| English | 3,277 | 7.0% |
| Estonian | 13 | 0.0% |
| European | 1,907 | 4.1% |
| Finnish | 33 | 0.1% |
| French | 1,191 | 2.6% |
| French Canadian | 16 | 0.0% |
| German | 3,346 | 7.2% |
| Greek | 11 | 0.0% |
| Hopi | 29 | 0.1% |
| Hungarian | 143 | 0.3% |
| Indian (Asian) | 7 | 0.0% |
| Iranian | 3 | 0.0% |
| Irish | 2,834 | 6.1% |
| Italian | 471 | 1.0% |
| Korean | 423 | 0.9% |
| Laotian | 22 | 0.1% |
| Lithuanian | 41 | 0.1% |
| Malaysian | 15 | 0.0% |
| Mexican | 6,657 | 14.3% |
| Mexican American Indian | 437 | 0.9% |
| Native Hawaiian | 9 | 0.0% |
| Navajo | 12,783 | 27.5% |
| Northern European | 95 | 0.2% |
| Norwegian | 294 | 0.6% |
| Pakistani | 4 | 0.0% |
| Panamanian | 7 | 0.0% |
| Pennsylvania German | 38 | 0.1% |
| Peruvian | 23 | 0.1% |
| Polish | 221 | 0.5% |
| Portuguese | 61 | 0.1% |
| Pueblo | 117 | 0.3% |
| Puerto Rican | 136 | 0.3% |
| Romanian | 6 | 0.0% |
| Russian | 175 | 0.4% |
| Samoan | 7 | 0.0% |
| Scandinavian | 86 | 0.2% |
| Scotch-Irish | 117 | 0.3% |
| Scottish | 1,009 | 2.2% |
| Sioux | 150 | 0.3% |
| Slavic | 39 | 0.1% |
| Slovak | 5 | 0.0% |
| Slovene | 9 | 0.0% |
| South American | 71 | 0.2% |
| South American Indian | 23 | 0.1% |
| Spaniard | 1,298 | 2.8% |
| Spanish | 2,164 | 4.7% |
| Subsaharan African | 16 | 0.0% |
| Swedish | 139 | 0.3% |
| Swiss | 56 | 0.1% |
| Thai | 26 | 0.1% |
| Turkish | 22 | 0.1% |
| Ukrainian | 47 | 0.1% |
| Ute | 112 | 0.2% |
| Welsh | 231 | 0.5% |
| West Indian | 45 | 0.1% |
| Yugoslavian | 11 | 0.0% | View All 85 Rows |
Immigrants in Farmington
The most numerous immigrant groups reported in Farmington came from Latin America (791 | 1.7%), Central America (740 | 1.6%), Mexico (740 | 1.6%), Asia (369 | 0.8%), and South Eastern Asia (226 | 0.5%), together accounting for 6.2% of all Farmington residents.
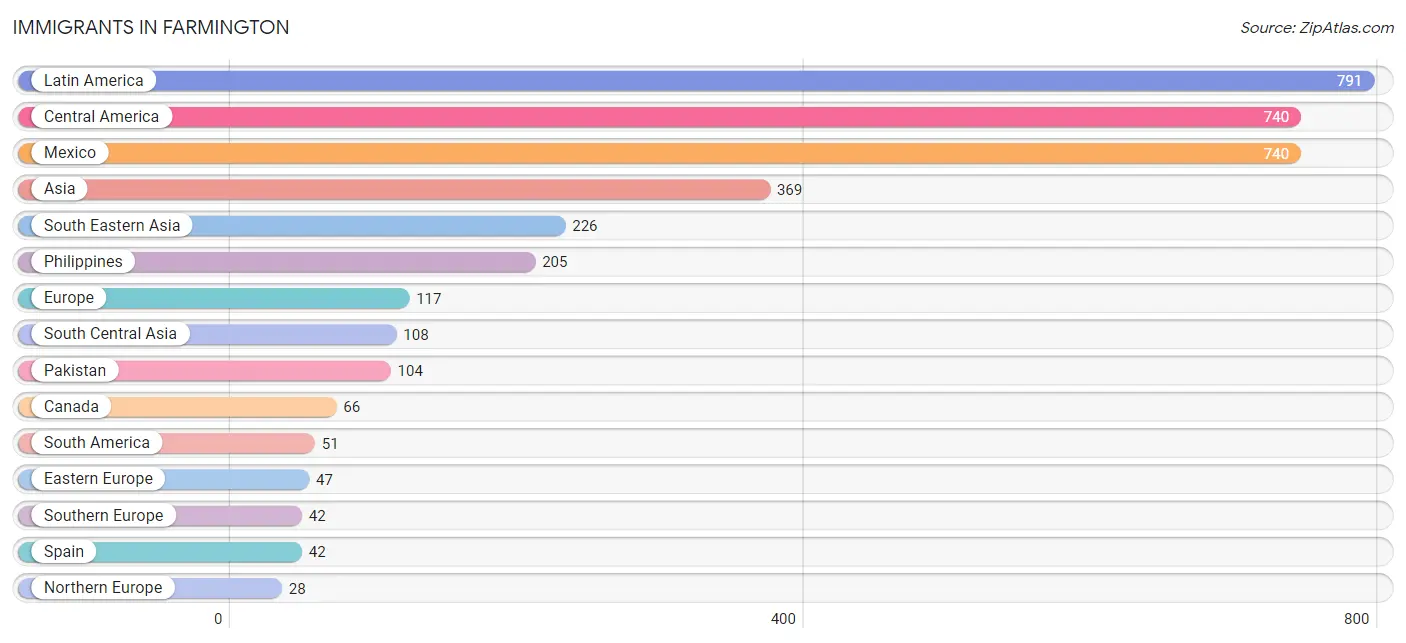
| Immigration Origin | # Population | % Population |
| Africa | 5 | 0.0% |
| Asia | 369 | 0.8% |
| Brazil | 12 | 0.0% |
| Canada | 66 | 0.1% |
| Central America | 740 | 1.6% |
| China | 7 | 0.0% |
| Czechoslovakia | 10 | 0.0% |
| Denmark | 17 | 0.0% |
| Eastern Asia | 13 | 0.0% |
| Eastern Europe | 47 | 0.1% |
| Ecuador | 16 | 0.0% |
| Europe | 117 | 0.3% |
| India | 4 | 0.0% |
| Indonesia | 2 | 0.0% |
| Korea | 6 | 0.0% |
| Laos | 15 | 0.0% |
| Latin America | 791 | 1.7% |
| Mexico | 740 | 1.6% |
| Northern Europe | 28 | 0.1% |
| Pakistan | 104 | 0.2% |
| Peru | 23 | 0.1% |
| Philippines | 205 | 0.4% |
| Poland | 9 | 0.0% |
| Russia | 15 | 0.0% |
| Scotland | 11 | 0.0% |
| South Africa | 5 | 0.0% |
| South America | 51 | 0.1% |
| South Central Asia | 108 | 0.2% |
| South Eastern Asia | 226 | 0.5% |
| Southern Europe | 42 | 0.1% |
| Spain | 42 | 0.1% |
| Thailand | 4 | 0.0% |
| Turkey | 22 | 0.1% |
| Western Asia | 22 | 0.1% | View All 34 Rows |
Sex and Age in Farmington
Sex and Age in Farmington
The most populous age groups in Farmington are 10 to 14 Years (2,128 | 9.5%) for men and 10 to 14 Years (2,236 | 9.3%) for women.
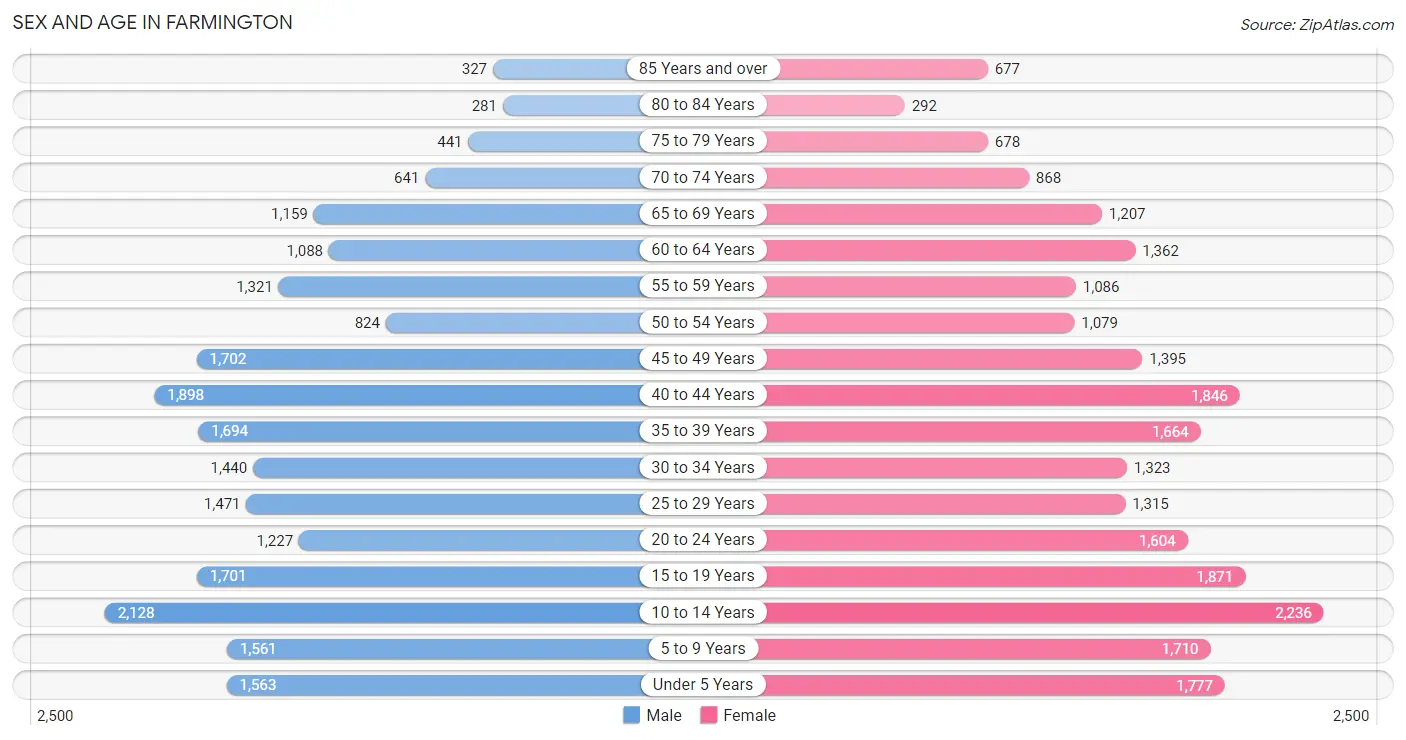
| Age Bracket | Male | Female |
| Under 5 Years | 1,563 (7.0%) | 1,777 (7.4%) |
| 5 to 9 Years | 1,561 (7.0%) | 1,710 (7.1%) |
| 10 to 14 Years | 2,128 (9.5%) | 2,236 (9.3%) |
| 15 to 19 Years | 1,701 (7.6%) | 1,871 (7.8%) |
| 20 to 24 Years | 1,227 (5.5%) | 1,604 (6.7%) |
| 25 to 29 Years | 1,471 (6.6%) | 1,315 (5.5%) |
| 30 to 34 Years | 1,440 (6.4%) | 1,323 (5.5%) |
| 35 to 39 Years | 1,694 (7.5%) | 1,664 (6.9%) |
| 40 to 44 Years | 1,898 (8.5%) | 1,846 (7.7%) |
| 45 to 49 Years | 1,702 (7.6%) | 1,395 (5.8%) |
| 50 to 54 Years | 824 (3.7%) | 1,079 (4.5%) |
| 55 to 59 Years | 1,321 (5.9%) | 1,086 (4.5%) |
| 60 to 64 Years | 1,088 (4.8%) | 1,362 (5.7%) |
| 65 to 69 Years | 1,159 (5.2%) | 1,207 (5.0%) |
| 70 to 74 Years | 641 (2.9%) | 868 (3.6%) |
| 75 to 79 Years | 441 (2.0%) | 678 (2.8%) |
| 80 to 84 Years | 281 (1.3%) | 292 (1.2%) |
| 85 Years and over | 327 (1.5%) | 677 (2.8%) |
| Total | 22,467 (100.0%) | 23,990 (100.0%) |
Families and Households in Farmington
Median Family Size in Farmington
The median family size in Farmington is 3.40 persons per family, with single female/mother families (2,266 | 20.6%) accounting for the largest median family size of 3.82 persons per family. On the other hand, single male/father families (1,296 | 11.8%) represent the smallest median family size with 3.09 persons per family.
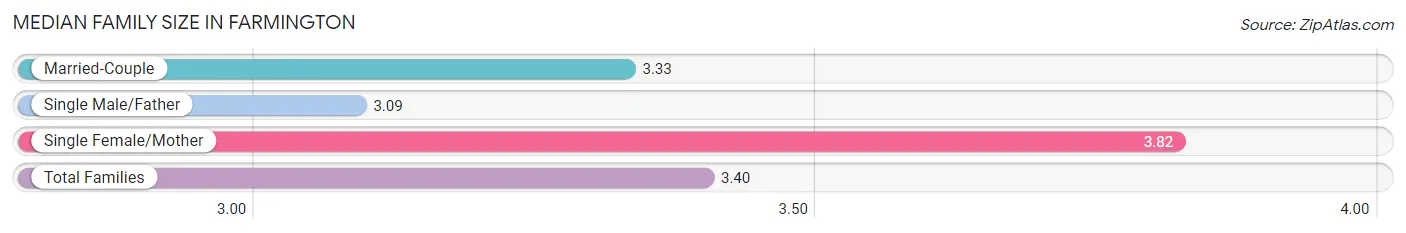
| Family Type | # Families | Family Size |
| Married-Couple | 7,448 (67.6%) | 3.33 |
| Single Male/Father | 1,296 (11.8%) | 3.09 |
| Single Female/Mother | 2,266 (20.6%) | 3.82 |
| Total Families | 11,010 (100.0%) | 3.40 |
Median Household Size in Farmington
The median household size in Farmington is 2.84 persons per household, with single female/mother households (2,266 | 14.3%) accounting for the largest median household size of 4.24 persons per household. non-family households (4,858 | 30.6%) represent the smallest median household size with 1.23 persons per household.
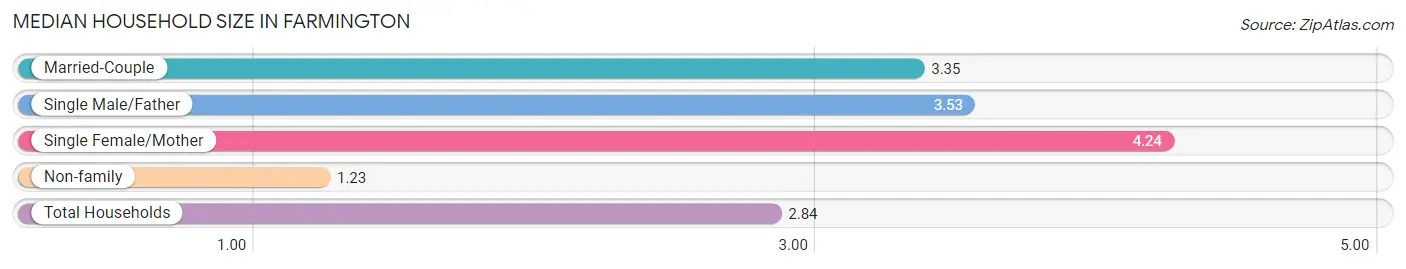
| Household Type | # Households | Household Size |
| Married-Couple | 7,448 (46.9%) | 3.35 |
| Single Male/Father | 1,296 (8.2%) | 3.53 |
| Single Female/Mother | 2,266 (14.3%) | 4.24 |
| Non-family | 4,858 (30.6%) | 1.23 |
| Total Households | 15,868 (100.0%) | 2.84 |
Household Size by Marriage Status in Farmington
Out of a total of 15,868 households in Farmington, 11,010 (69.4%) are family households, while 4,858 (30.6%) are nonfamily households. The most numerous type of family households are 2-person households, comprising 4,570, and the most common type of nonfamily households are 1-person households, comprising 4,073.
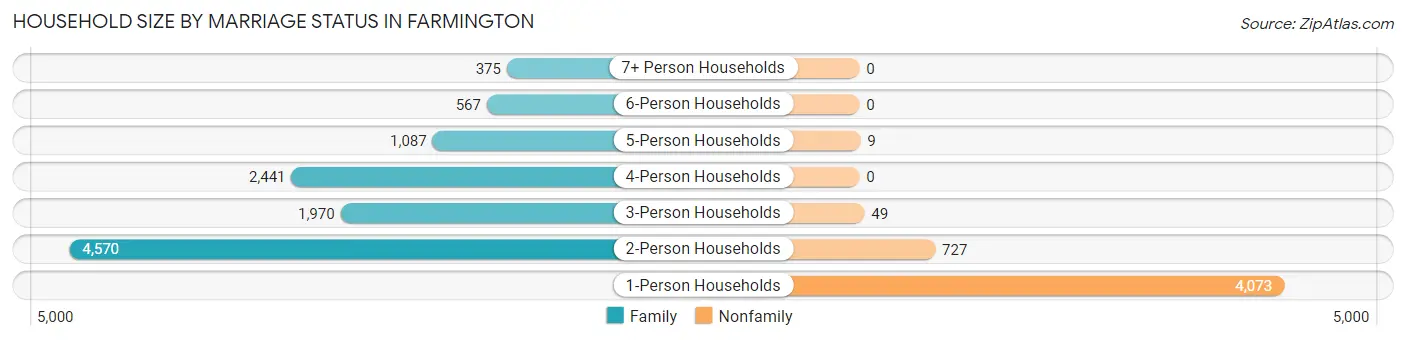
| Household Size | Family Households | Nonfamily Households |
| 1-Person Households | - | 4,073 (25.7%) |
| 2-Person Households | 4,570 (28.8%) | 727 (4.6%) |
| 3-Person Households | 1,970 (12.4%) | 49 (0.3%) |
| 4-Person Households | 2,441 (15.4%) | 0 (0.0%) |
| 5-Person Households | 1,087 (6.9%) | 9 (0.1%) |
| 6-Person Households | 567 (3.6%) | 0 (0.0%) |
| 7+ Person Households | 375 (2.4%) | 0 (0.0%) |
| Total | 11,010 (69.4%) | 4,858 (30.6%) |
Female Fertility in Farmington
Fertility by Age in Farmington
Average fertility rate in Farmington is 79.0 births per 1,000 women. Women in the age bracket of 20 to 34 years have the highest fertility rate with 133.0 births per 1,000 women. Women in the age bracket of 20 to 34 years acount for 63.1% of all women with births.
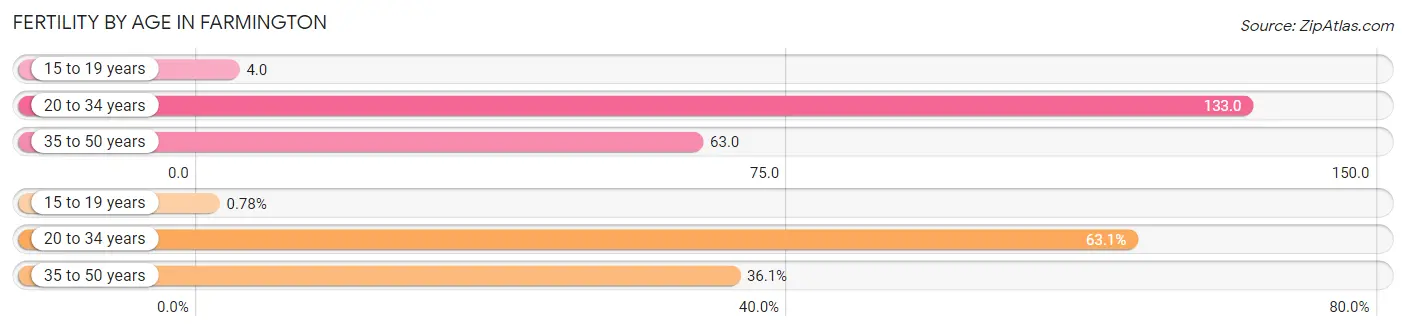
| Age Bracket | Women with Births | Births / 1,000 Women |
| 15 to 19 years | 7 (0.8%) | 4.0 |
| 20 to 34 years | 563 (63.1%) | 133.0 |
| 35 to 50 years | 322 (36.1%) | 63.0 |
| Total | 892 (100.0%) | 79.0 |
Fertility by Age by Marriage Status in Farmington
69.1% of women with births (892) in Farmington are married. The highest percentage of unmarried women with births falls into 15 to 19 years age bracket with 100.0% of them unmarried at the time of birth, while the lowest percentage of unmarried women with births belong to 20 to 34 years age bracket with 29.3% of them unmarried.
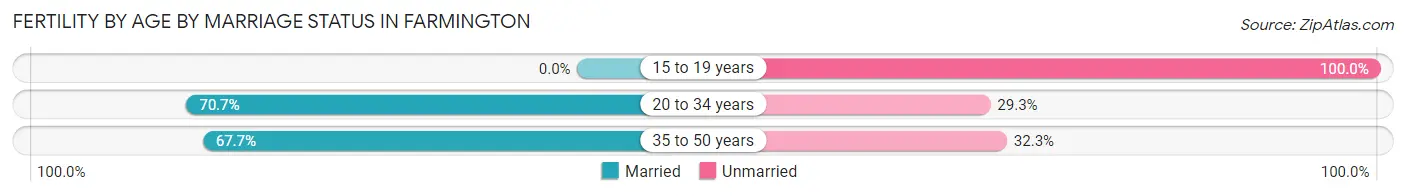
| Age Bracket | Married | Unmarried |
| 15 to 19 years | 0 (0.0%) | 7 (100.0%) |
| 20 to 34 years | 398 (70.7%) | 165 (29.3%) |
| 35 to 50 years | 218 (67.7%) | 104 (32.3%) |
| Total | 616 (69.1%) | 276 (30.9%) |
Fertility by Education in Farmington
Average fertility rate in Farmington is 79.0 births per 1,000 women. Women with the education attainment of graduate degree have the highest fertility rate of 246.0 births per 1,000 women, while women with the education attainment of less than high school have the lowest fertility at 11.0 births per 1,000 women. Women with the education attainment of college or associate's degree represent 38.5% of all women with births.
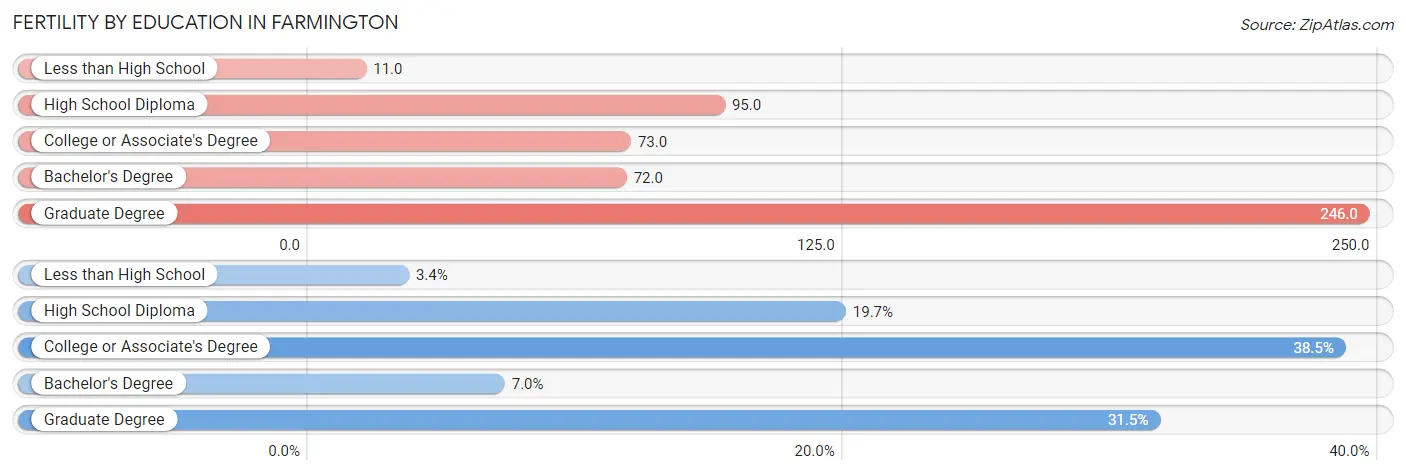
| Educational Attainment | Women with Births | Births / 1,000 Women |
| Less than High School | 30 (3.4%) | 11.0 |
| High School Diploma | 176 (19.7%) | 95.0 |
| College or Associate's Degree | 343 (38.5%) | 73.0 |
| Bachelor's Degree | 62 (7.0%) | 72.0 |
| Graduate Degree | 281 (31.5%) | 246.0 |
| Total | 892 (100.0%) | 79.0 |
Fertility by Education by Marriage Status in Farmington
30.9% of women with births in Farmington are unmarried. Women with the educational attainment of graduate degree are most likely to be married with 93.2% of them married at childbirth, while women with the educational attainment of bachelor's degree are least likely to be married with 74.2% of them unmarried at childbirth.
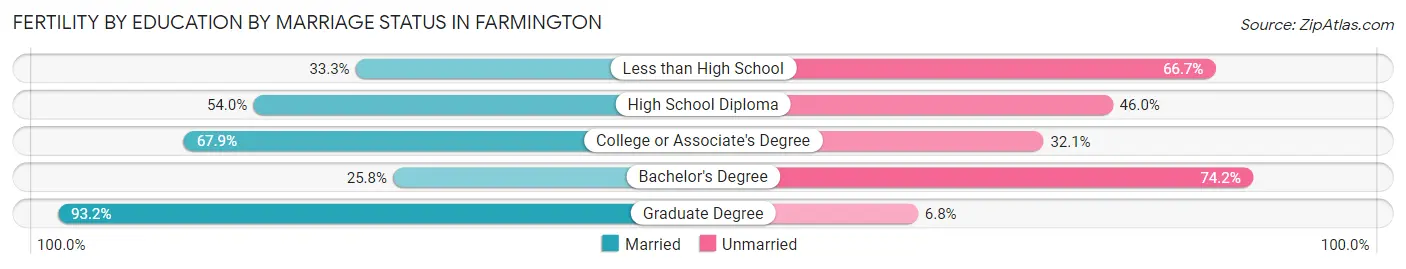
| Educational Attainment | Married | Unmarried |
| Less than High School | 10 (33.3%) | 20 (66.7%) |
| High School Diploma | 95 (54.0%) | 81 (46.0%) |
| College or Associate's Degree | 233 (67.9%) | 110 (32.1%) |
| Bachelor's Degree | 16 (25.8%) | 46 (74.2%) |
| Graduate Degree | 262 (93.2%) | 19 (6.8%) |
| Total | 616 (69.1%) | 276 (30.9%) |
Employment Characteristics in Farmington
Employment by Class of Employer in Farmington
Among the 17,764 employed individuals in Farmington, private company employees (11,509 | 64.8%), local government employees (1,863 | 10.5%), and not-for-profit organizations (1,140 | 6.4%) make up the most common classes of employment.
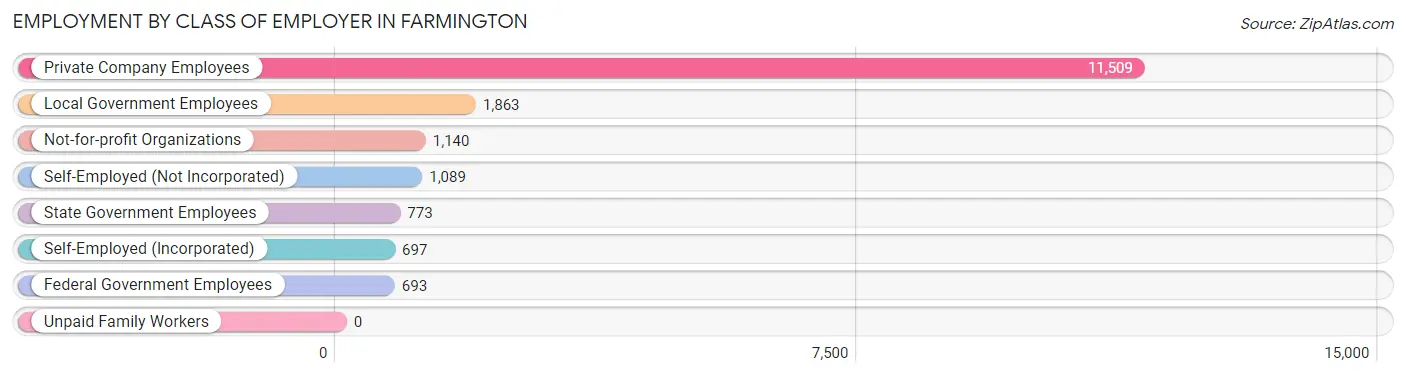
| Employer Class | # Employees | % Employees |
| Private Company Employees | 11,509 | 64.8% |
| Self-Employed (Incorporated) | 697 | 3.9% |
| Self-Employed (Not Incorporated) | 1,089 | 6.1% |
| Not-for-profit Organizations | 1,140 | 6.4% |
| Local Government Employees | 1,863 | 10.5% |
| State Government Employees | 773 | 4.3% |
| Federal Government Employees | 693 | 3.9% |
| Unpaid Family Workers | 0 | 0.0% |
| Total | 17,764 | 100.0% |
Employment Status by Age in Farmington
According to the labor force statistics for Farmington, out of the total population over 16 years of age (34,874), 56.7% or 19,774 individuals are in the labor force, with 7.7% or 1,523 of them unemployed. The age group with the highest labor force participation rate is 55 to 59 years, with 85.7% or 2,063 individuals in the labor force. Within the labor force, the 16 to 19 years age range has the highest percentage of unemployed individuals, with 18.8% or 171 of them being unemployed.
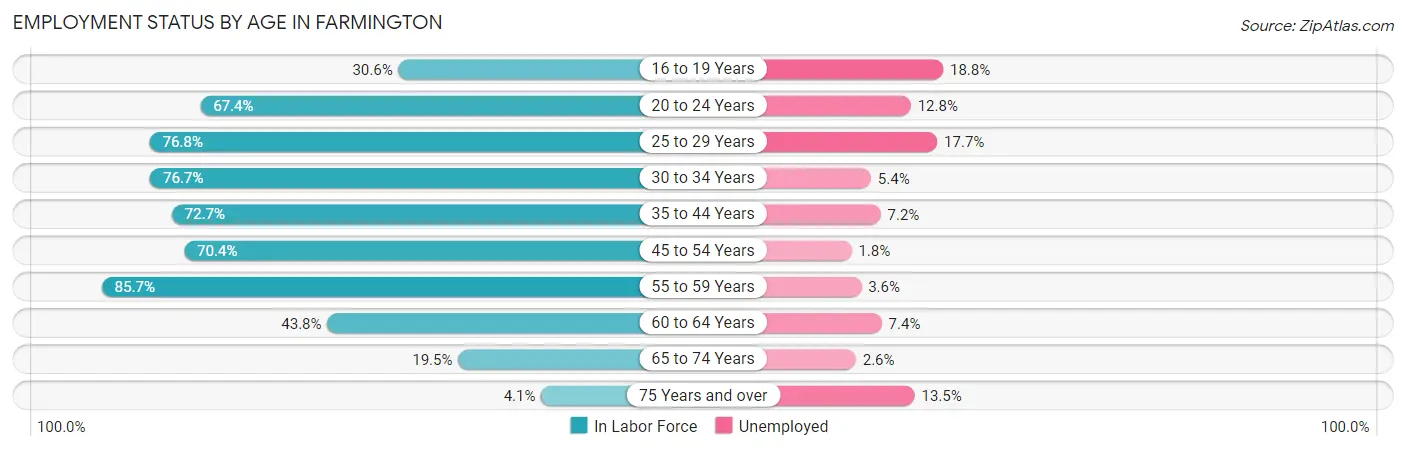
| Age Bracket | In Labor Force | Unemployed |
| 16 to 19 Years | 907 (30.6%) | 171 (18.8%) |
| 20 to 24 Years | 1,908 (67.4%) | 244 (12.8%) |
| 25 to 29 Years | 2,140 (76.8%) | 379 (17.7%) |
| 30 to 34 Years | 2,119 (76.7%) | 114 (5.4%) |
| 35 to 44 Years | 5,163 (72.7%) | 372 (7.2%) |
| 45 to 54 Years | 3,520 (70.4%) | 63 (1.8%) |
| 55 to 59 Years | 2,063 (85.7%) | 74 (3.6%) |
| 60 to 64 Years | 1,073 (43.8%) | 79 (7.4%) |
| 65 to 74 Years | 756 (19.5%) | 20 (2.6%) |
| 75 Years and over | 111 (4.1%) | 15 (13.5%) |
| Total | 19,774 (56.7%) | 1,523 (7.7%) |
Employment Status by Educational Attainment in Farmington
According to labor force statistics for Farmington, 71.4% of individuals (16,071) out of the total population between 25 and 64 years of age (22,508) are in the labor force, with 6.7% or 1,077 of them being unemployed. The group with the highest labor force participation rate are those with the educational attainment of bachelor's degree or higher, with 80.4% or 3,718 individuals in the labor force. Within the labor force, individuals with less than high school education have the highest percentage of unemployment, with 24.2% or 428 of them being unemployed.
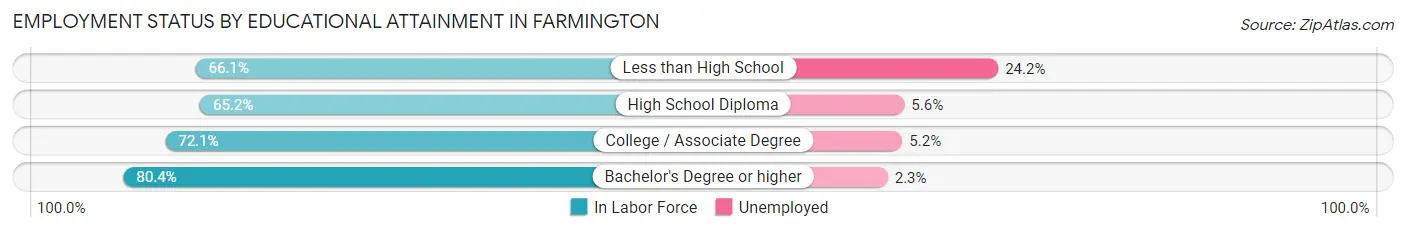
| Educational Attainment | In Labor Force | Unemployed |
| Less than High School | 1,770 (66.1%) | 648 (24.2%) |
| High School Diploma | 3,513 (65.2%) | 302 (5.6%) |
| College / Associate Degree | 7,079 (72.1%) | 511 (5.2%) |
| Bachelor's Degree or higher | 3,718 (80.4%) | 106 (2.3%) |
| Total | 16,071 (71.4%) | 1,508 (6.7%) |
Employment Occupations by Sex in Farmington
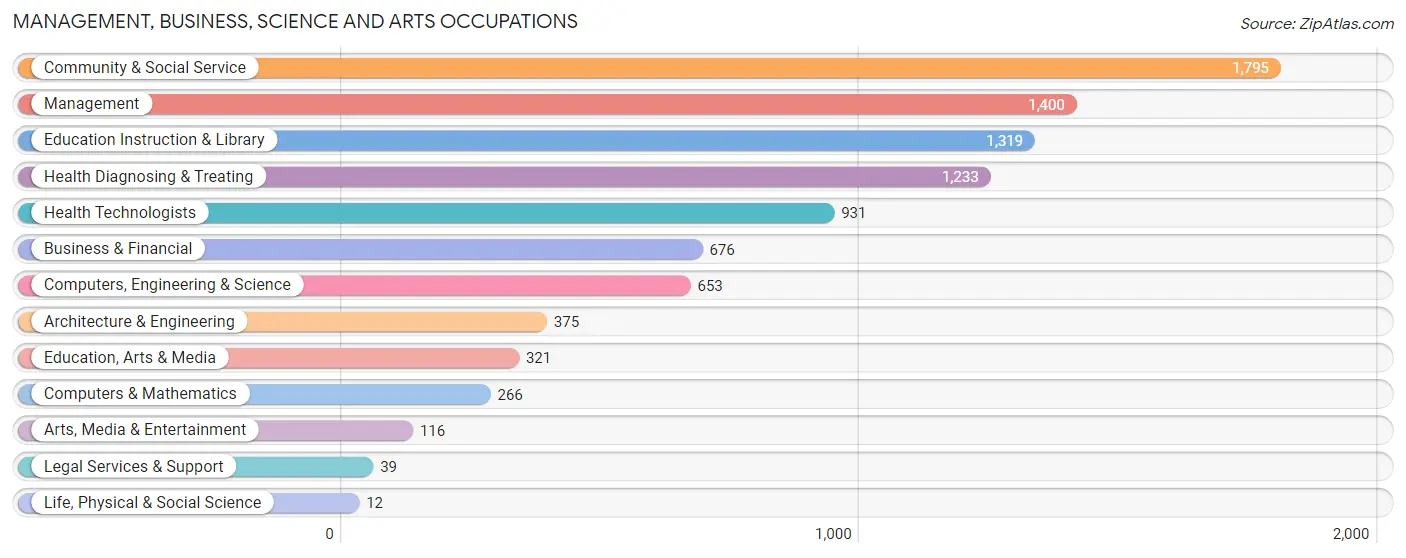
Management, Business, Science and Arts Occupations
The most common Management, Business, Science and Arts occupations in Farmington are Community & Social Service (1,795 | 9.9%), Management (1,400 | 7.7%), Education Instruction & Library (1,319 | 7.2%), Health Diagnosing & Treating (1,233 | 6.8%), and Health Technologists (931 | 5.1%).
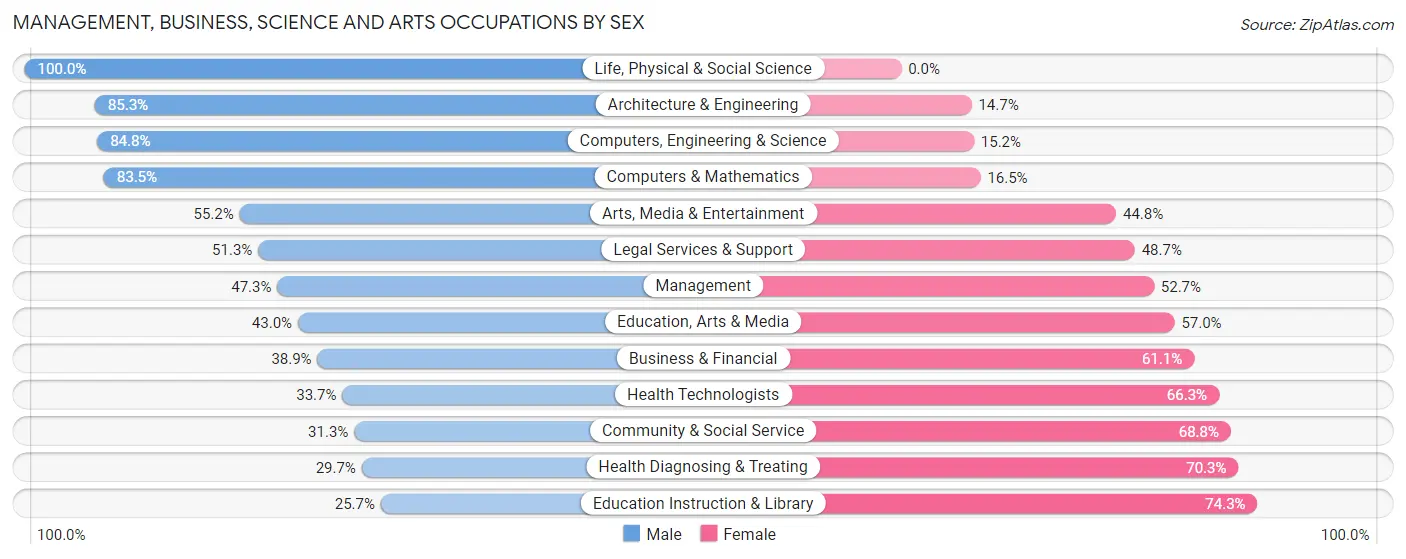
Management, Business, Science and Arts Occupations by Sex
Within the Management, Business, Science and Arts occupations in Farmington, the most male-oriented occupations are Life, Physical & Social Science (100.0%), Architecture & Engineering (85.3%), and Computers, Engineering & Science (84.8%), while the most female-oriented occupations are Education Instruction & Library (74.3%), Health Diagnosing & Treating (70.3%), and Community & Social Service (68.8%).
| Occupation | Male | Female |
| Management | 662 (47.3%) | 738 (52.7%) |
| Business & Financial | 263 (38.9%) | 413 (61.1%) |
| Computers, Engineering & Science | 554 (84.8%) | 99 (15.2%) |
| Computers & Mathematics | 222 (83.5%) | 44 (16.5%) |
| Architecture & Engineering | 320 (85.3%) | 55 (14.7%) |
| Life, Physical & Social Science | 12 (100.0%) | 0 (0.0%) |
| Community & Social Service | 561 (31.2%) | 1,234 (68.8%) |
| Education, Arts & Media | 138 (43.0%) | 183 (57.0%) |
| Legal Services & Support | 20 (51.3%) | 19 (48.7%) |
| Education Instruction & Library | 339 (25.7%) | 980 (74.3%) |
| Arts, Media & Entertainment | 64 (55.2%) | 52 (44.8%) |
| Health Diagnosing & Treating | 366 (29.7%) | 867 (70.3%) |
| Health Technologists | 314 (33.7%) | 617 (66.3%) |
| Total (Category) | 2,406 (41.8%) | 3,351 (58.2%) |
| Total (Overall) | 9,775 (53.6%) | 8,455 (46.4%) |
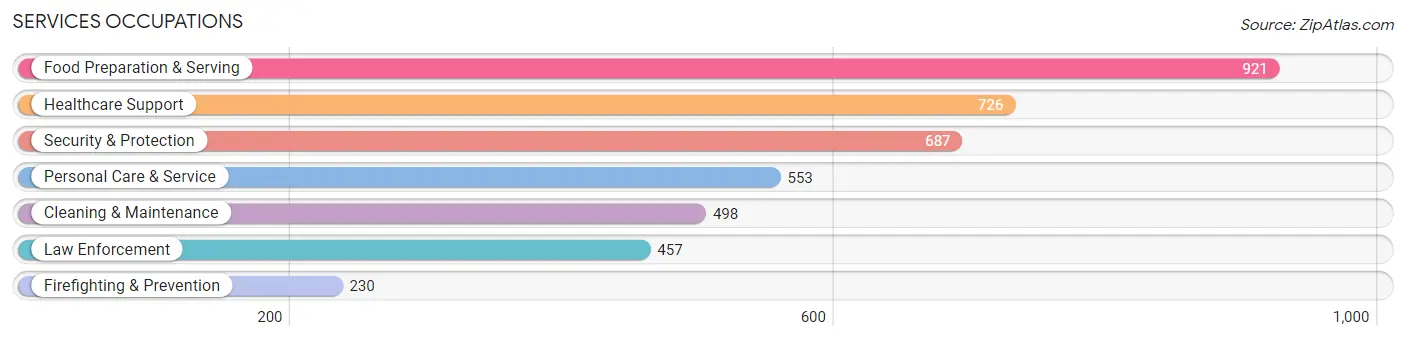
Services Occupations
The most common Services occupations in Farmington are Food Preparation & Serving (921 | 5.1%), Healthcare Support (726 | 4.0%), Security & Protection (687 | 3.8%), Personal Care & Service (553 | 3.0%), and Cleaning & Maintenance (498 | 2.7%).
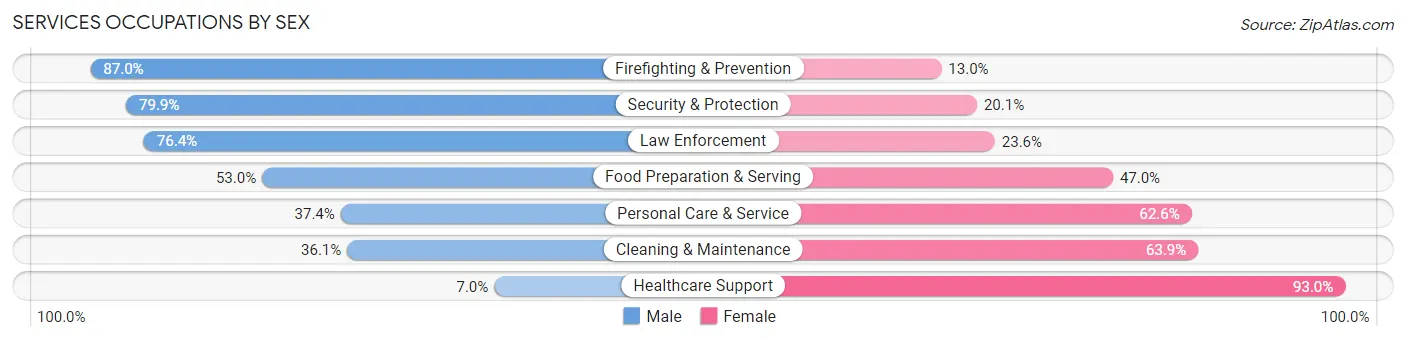
Services Occupations by Sex
Within the Services occupations in Farmington, the most male-oriented occupations are Firefighting & Prevention (87.0%), Security & Protection (79.9%), and Law Enforcement (76.4%), while the most female-oriented occupations are Healthcare Support (93.0%), Cleaning & Maintenance (63.9%), and Personal Care & Service (62.6%).
| Occupation | Male | Female |
| Healthcare Support | 51 (7.0%) | 675 (93.0%) |
| Security & Protection | 549 (79.9%) | 138 (20.1%) |
| Firefighting & Prevention | 200 (87.0%) | 30 (13.0%) |
| Law Enforcement | 349 (76.4%) | 108 (23.6%) |
| Food Preparation & Serving | 488 (53.0%) | 433 (47.0%) |
| Cleaning & Maintenance | 180 (36.1%) | 318 (63.9%) |
| Personal Care & Service | 207 (37.4%) | 346 (62.6%) |
| Total (Category) | 1,475 (43.6%) | 1,910 (56.4%) |
| Total (Overall) | 9,775 (53.6%) | 8,455 (46.4%) |
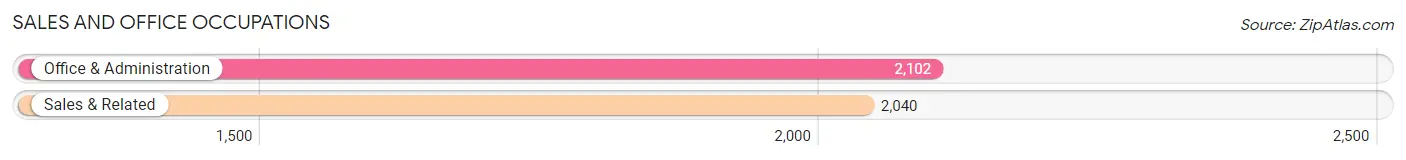
Sales and Office Occupations
The most common Sales and Office occupations in Farmington are Office & Administration (2,102 | 11.5%), and Sales & Related (2,040 | 11.2%).
Sales and Office Occupations by Sex
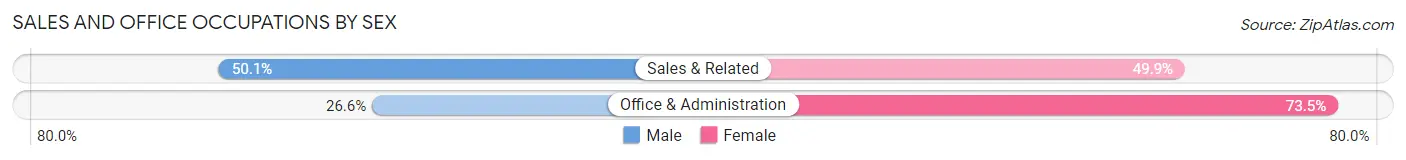
| Occupation | Male | Female |
| Sales & Related | 1,022 (50.1%) | 1,018 (49.9%) |
| Office & Administration | 558 (26.6%) | 1,544 (73.5%) |
| Total (Category) | 1,580 (38.2%) | 2,562 (61.9%) |
| Total (Overall) | 9,775 (53.6%) | 8,455 (46.4%) |
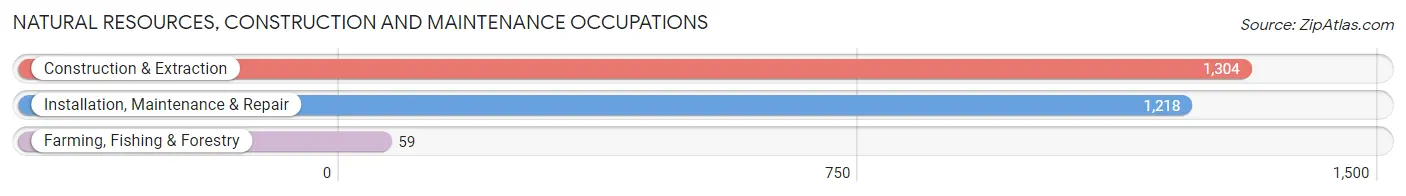
Natural Resources, Construction and Maintenance Occupations
The most common Natural Resources, Construction and Maintenance occupations in Farmington are Construction & Extraction (1,304 | 7.1%), Installation, Maintenance & Repair (1,218 | 6.7%), and Farming, Fishing & Forestry (59 | 0.3%).
Natural Resources, Construction and Maintenance Occupations by Sex
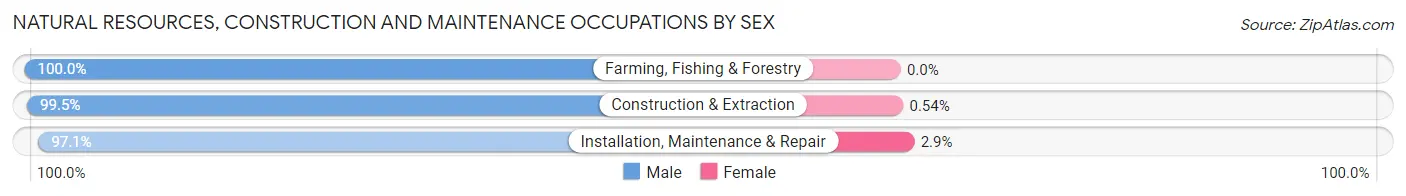
| Occupation | Male | Female |
| Farming, Fishing & Forestry | 59 (100.0%) | 0 (0.0%) |
| Construction & Extraction | 1,297 (99.5%) | 7 (0.5%) |
| Installation, Maintenance & Repair | 1,183 (97.1%) | 35 (2.9%) |
| Total (Category) | 2,539 (98.4%) | 42 (1.6%) |
| Total (Overall) | 9,775 (53.6%) | 8,455 (46.4%) |
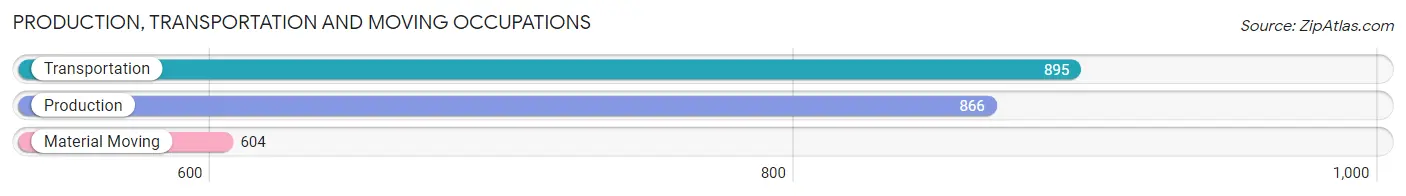
Production, Transportation and Moving Occupations
The most common Production, Transportation and Moving occupations in Farmington are Transportation (895 | 4.9%), Production (866 | 4.8%), and Material Moving (604 | 3.3%).
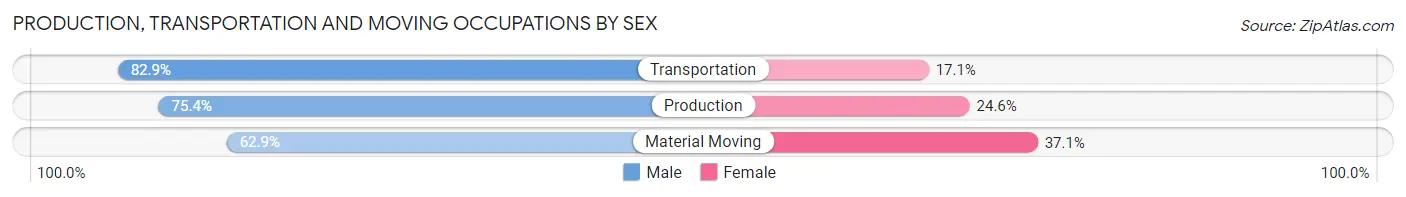
Production, Transportation and Moving Occupations by Sex
| Occupation | Male | Female |
| Production | 653 (75.4%) | 213 (24.6%) |
| Transportation | 742 (82.9%) | 153 (17.1%) |
| Material Moving | 380 (62.9%) | 224 (37.1%) |
| Total (Category) | 1,775 (75.0%) | 590 (24.9%) |
| Total (Overall) | 9,775 (53.6%) | 8,455 (46.4%) |
Employment Industries by Sex in Farmington
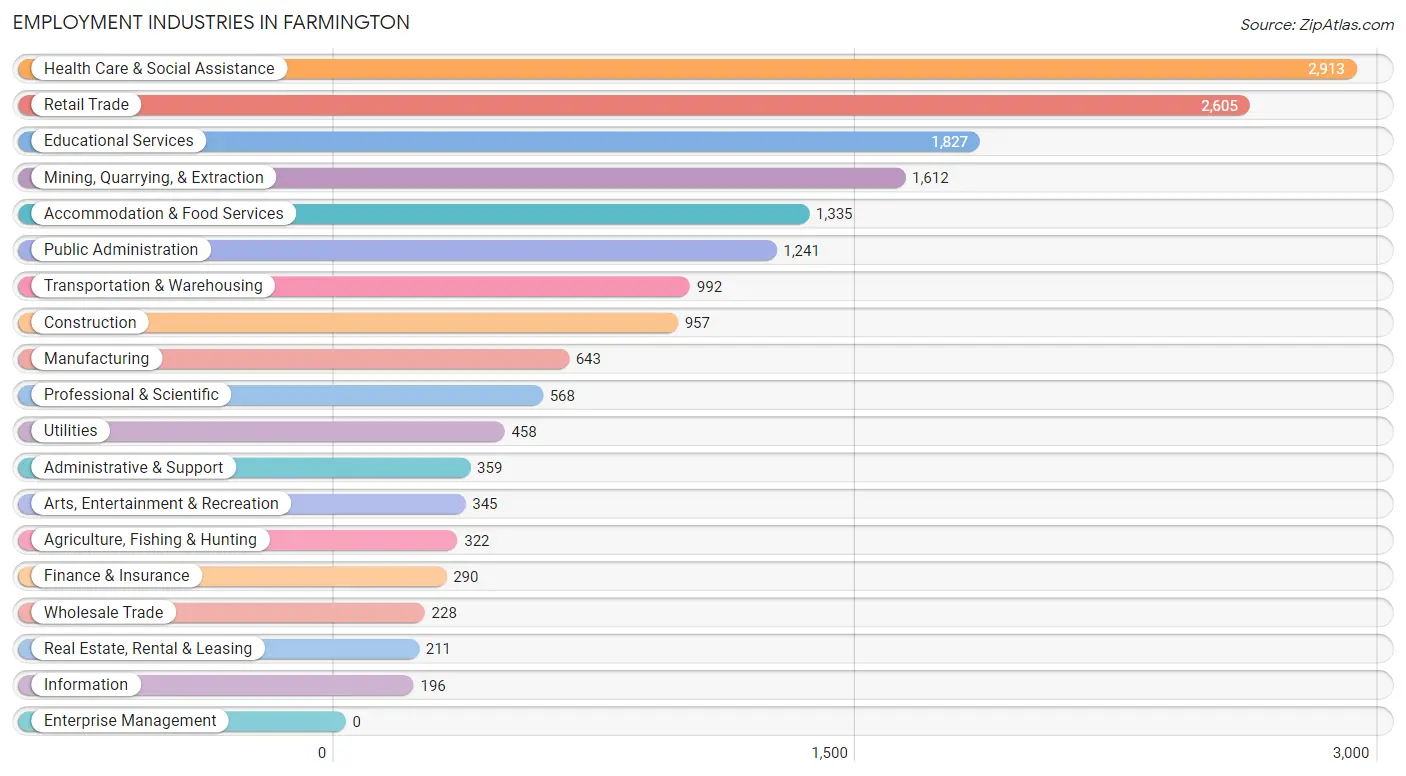
Employment Industries in Farmington
The major employment industries in Farmington include Health Care & Social Assistance (2,913 | 16.0%), Retail Trade (2,605 | 14.3%), Educational Services (1,827 | 10.0%), Mining, Quarrying, & Extraction (1,612 | 8.8%), and Accommodation & Food Services (1,335 | 7.3%).
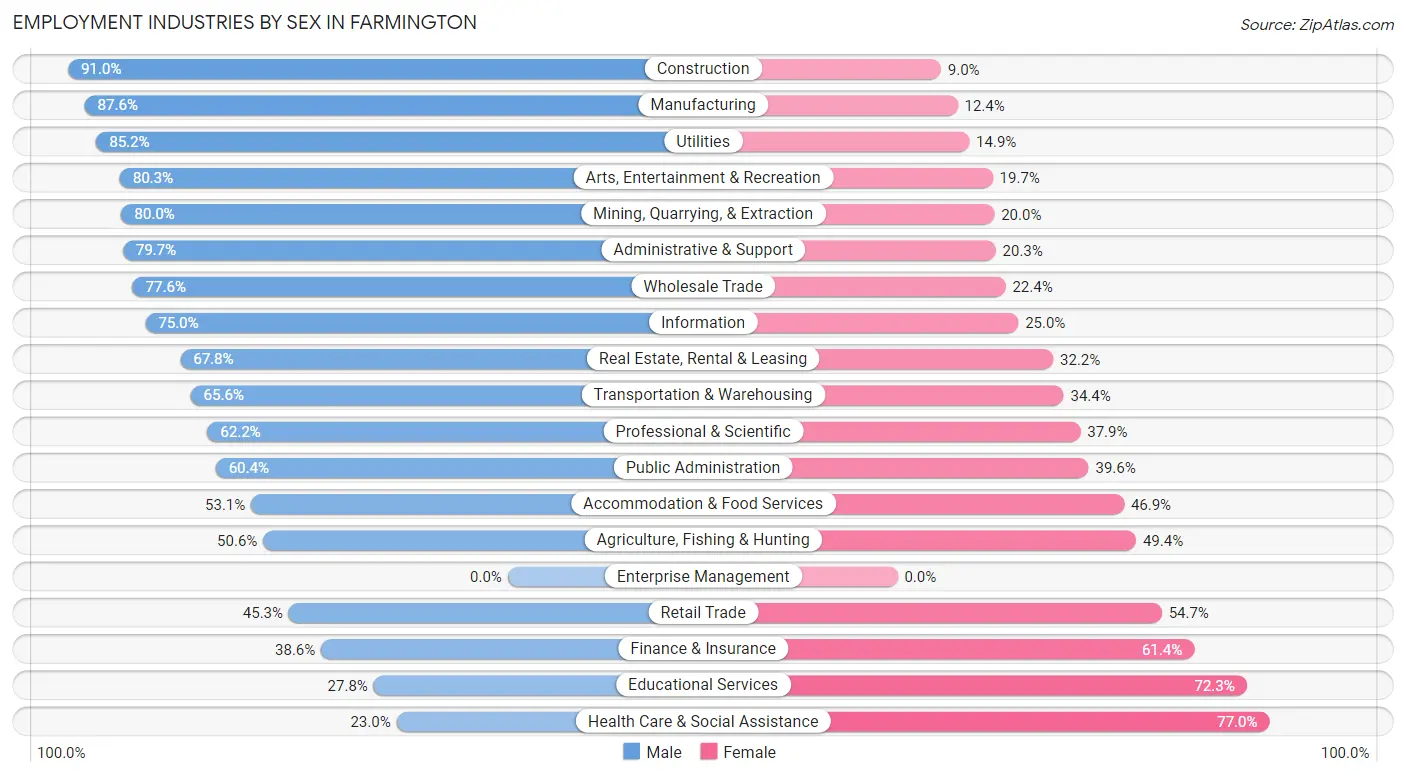
Employment Industries by Sex in Farmington
The Farmington industries that see more men than women are Construction (91.0%), Manufacturing (87.6%), and Utilities (85.2%), whereas the industries that tend to have a higher number of women are Health Care & Social Assistance (77.0%), Educational Services (72.3%), and Finance & Insurance (61.4%).
| Industry | Male | Female |
| Agriculture, Fishing & Hunting | 163 (50.6%) | 159 (49.4%) |
| Mining, Quarrying, & Extraction | 1,289 (80.0%) | 323 (20.0%) |
| Construction | 871 (91.0%) | 86 (9.0%) |
| Manufacturing | 563 (87.6%) | 80 (12.4%) |
| Wholesale Trade | 177 (77.6%) | 51 (22.4%) |
| Retail Trade | 1,180 (45.3%) | 1,425 (54.7%) |
| Transportation & Warehousing | 651 (65.6%) | 341 (34.4%) |
| Utilities | 390 (85.2%) | 68 (14.8%) |
| Information | 147 (75.0%) | 49 (25.0%) |
| Finance & Insurance | 112 (38.6%) | 178 (61.4%) |
| Real Estate, Rental & Leasing | 143 (67.8%) | 68 (32.2%) |
| Professional & Scientific | 353 (62.2%) | 215 (37.9%) |
| Enterprise Management | 0 (0.0%) | 0 (0.0%) |
| Administrative & Support | 286 (79.7%) | 73 (20.3%) |
| Educational Services | 507 (27.8%) | 1,320 (72.3%) |
| Health Care & Social Assistance | 671 (23.0%) | 2,242 (77.0%) |
| Arts, Entertainment & Recreation | 277 (80.3%) | 68 (19.7%) |
| Accommodation & Food Services | 709 (53.1%) | 626 (46.9%) |
| Public Administration | 750 (60.4%) | 491 (39.6%) |
| Total | 9,775 (53.6%) | 8,455 (46.4%) |
Education in Farmington
School Enrollment in Farmington
The most common levels of schooling among the 13,145 students in Farmington are middle school (3,266 | 24.8%), elementary school (2,853 | 21.7%), and high school (2,743 | 20.9%).
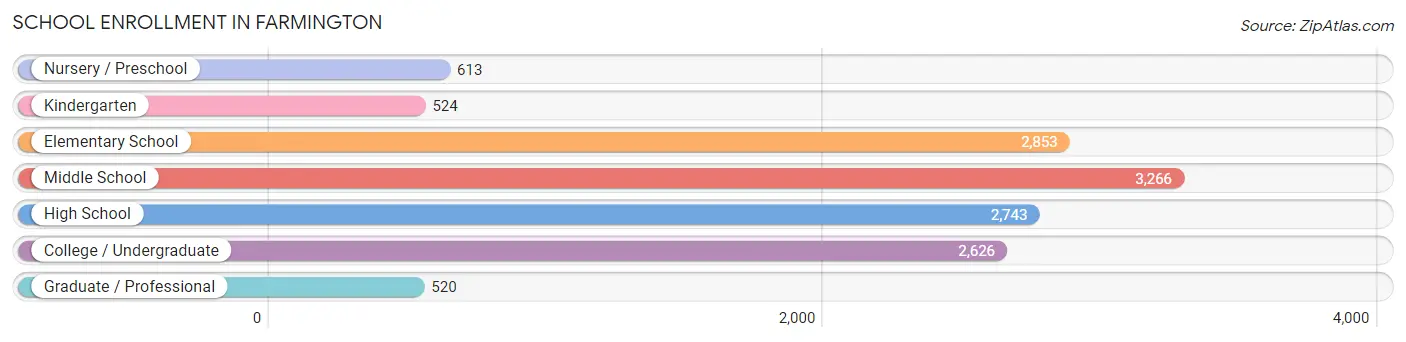
| School Level | # Students | % Students |
| Nursery / Preschool | 613 | 4.7% |
| Kindergarten | 524 | 4.0% |
| Elementary School | 2,853 | 21.7% |
| Middle School | 3,266 | 24.8% |
| High School | 2,743 | 20.9% |
| College / Undergraduate | 2,626 | 20.0% |
| Graduate / Professional | 520 | 4.0% |
| Total | 13,145 | 100.0% |
School Enrollment by Age by Funding Source in Farmington
Out of a total of 13,145 students who are enrolled in schools in Farmington, 1,209 (9.2%) attend a private institution, while the remaining 11,936 (90.8%) are enrolled in public schools. The age group of 35 years and over has the highest likelihood of being enrolled in private schools, with 253 (22.2% in the age bracket) enrolled. Conversely, the age group of 3 to 4 year olds has the lowest likelihood of being enrolled in a private school, with 531 (97.6% in the age bracket) attending a public institution.
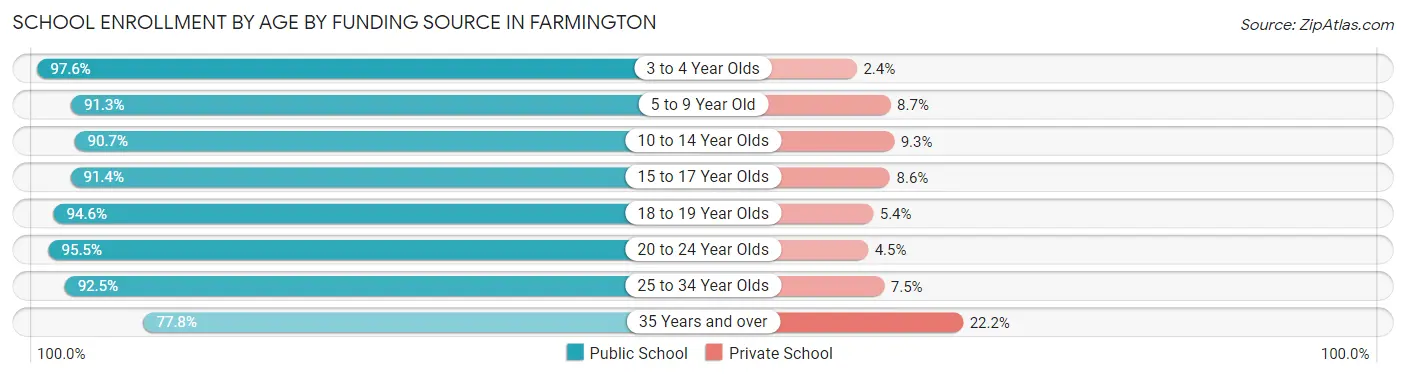
| Age Bracket | Public School | Private School |
| 3 to 4 Year Olds | 531 (97.6%) | 13 (2.4%) |
| 5 to 9 Year Old | 2,838 (91.3%) | 269 (8.7%) |
| 10 to 14 Year Olds | 3,475 (90.7%) | 357 (9.3%) |
| 15 to 17 Year Olds | 1,975 (91.4%) | 185 (8.6%) |
| 18 to 19 Year Olds | 786 (94.6%) | 45 (5.4%) |
| 20 to 24 Year Olds | 874 (95.5%) | 41 (4.5%) |
| 25 to 34 Year Olds | 569 (92.5%) | 46 (7.5%) |
| 35 Years and over | 888 (77.8%) | 253 (22.2%) |
| Total | 11,936 (90.8%) | 1,209 (9.2%) |
Educational Attainment by Field of Study in Farmington
Education (1,376 | 21.2%), business (1,143 | 17.6%), bio, nature & agricultural (562 | 8.6%), science & technology (562 | 8.6%), and engineering (515 | 7.9%) are the most common fields of study among 6,501 individuals in Farmington who have obtained a bachelor's degree or higher.
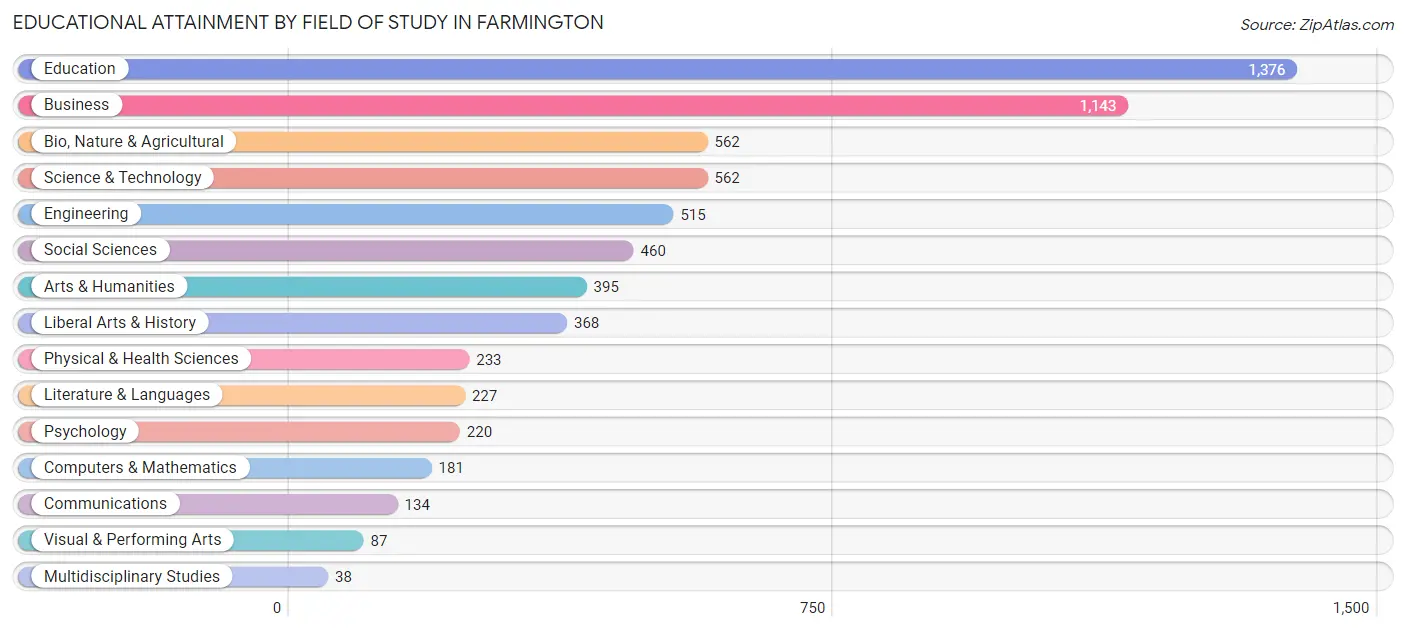
| Field of Study | # Graduates | % Graduates |
| Computers & Mathematics | 181 | 2.8% |
| Bio, Nature & Agricultural | 562 | 8.6% |
| Physical & Health Sciences | 233 | 3.6% |
| Psychology | 220 | 3.4% |
| Social Sciences | 460 | 7.1% |
| Engineering | 515 | 7.9% |
| Multidisciplinary Studies | 38 | 0.6% |
| Science & Technology | 562 | 8.6% |
| Business | 1,143 | 17.6% |
| Education | 1,376 | 21.2% |
| Literature & Languages | 227 | 3.5% |
| Liberal Arts & History | 368 | 5.7% |
| Visual & Performing Arts | 87 | 1.3% |
| Communications | 134 | 2.1% |
| Arts & Humanities | 395 | 6.1% |
| Total | 6,501 | 100.0% |
Transportation & Commute in Farmington
Vehicle Availability by Sex in Farmington
The most prevalent vehicle ownership categories in Farmington are males with 2 vehicles (4,006, accounting for 41.6%) and females with 2 vehicles (2,772, making up 49.9%).
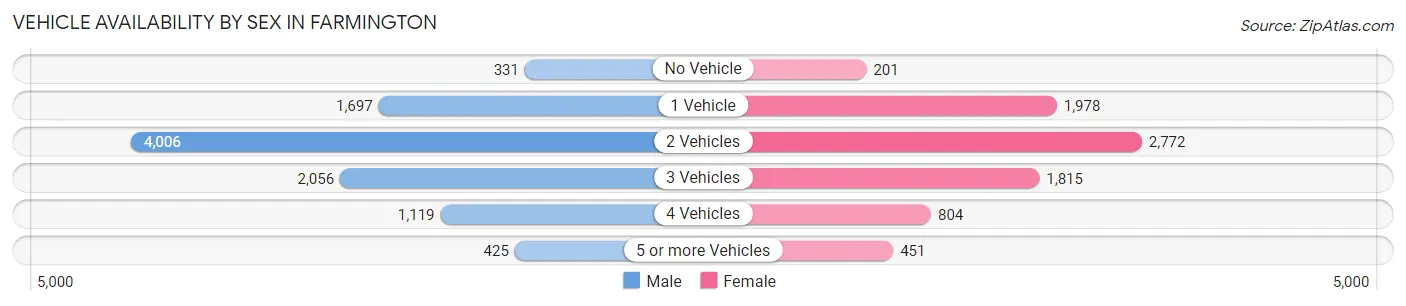
| Vehicles Available | Male | Female |
| No Vehicle | 331 (3.4%) | 201 (2.5%) |
| 1 Vehicle | 1,697 (17.6%) | 1,978 (24.7%) |
| 2 Vehicles | 4,006 (41.6%) | 2,772 (34.6%) |
| 3 Vehicles | 2,056 (21.3%) | 1,815 (22.6%) |
| 4 Vehicles | 1,119 (11.6%) | 804 (10.0%) |
| 5 or more Vehicles | 425 (4.4%) | 451 (5.6%) |
| Total | 9,634 (100.0%) | 8,021 (100.0%) |
Commute Time in Farmington
The most frequently occuring commute durations in Farmington are 10 to 14 minutes (4,422 commuters, 26.1%), 5 to 9 minutes (3,393 commuters, 20.0%), and 15 to 19 minutes (2,864 commuters, 16.9%).
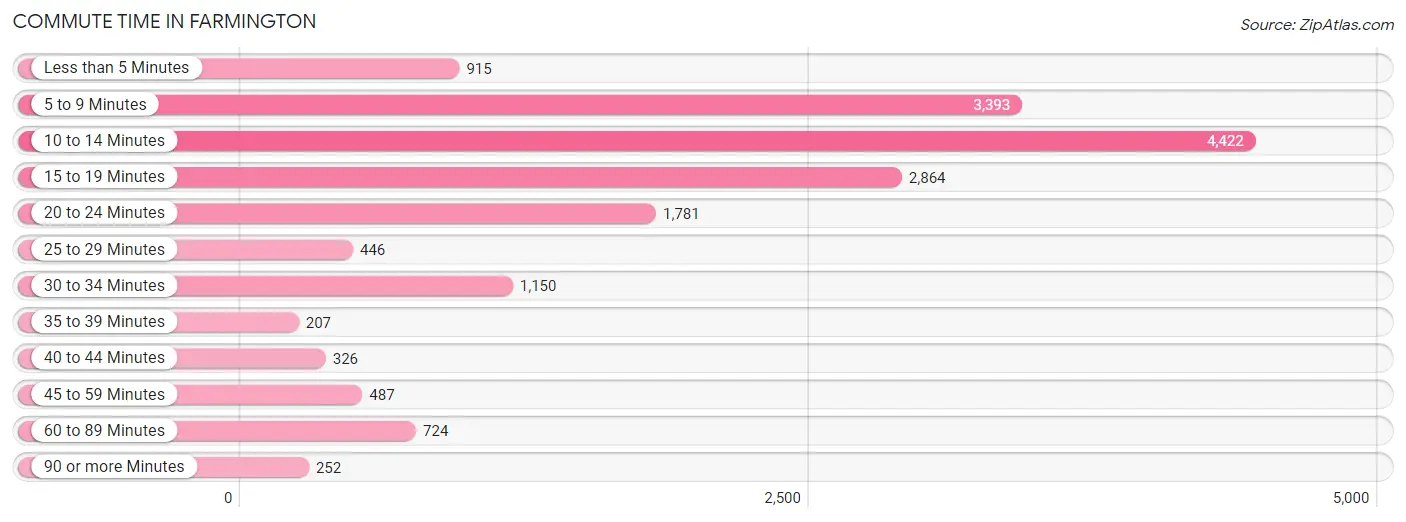
| Commute Time | # Commuters | % Commuters |
| Less than 5 Minutes | 915 | 5.4% |
| 5 to 9 Minutes | 3,393 | 20.0% |
| 10 to 14 Minutes | 4,422 | 26.1% |
| 15 to 19 Minutes | 2,864 | 16.9% |
| 20 to 24 Minutes | 1,781 | 10.5% |
| 25 to 29 Minutes | 446 | 2.6% |
| 30 to 34 Minutes | 1,150 | 6.8% |
| 35 to 39 Minutes | 207 | 1.2% |
| 40 to 44 Minutes | 326 | 1.9% |
| 45 to 59 Minutes | 487 | 2.9% |
| 60 to 89 Minutes | 724 | 4.3% |
| 90 or more Minutes | 252 | 1.5% |
Commute Time by Sex in Farmington
The most common commute times in Farmington are 10 to 14 minutes (2,224 commuters, 23.9%) for males and 10 to 14 minutes (2,198 commuters, 28.7%) for females.
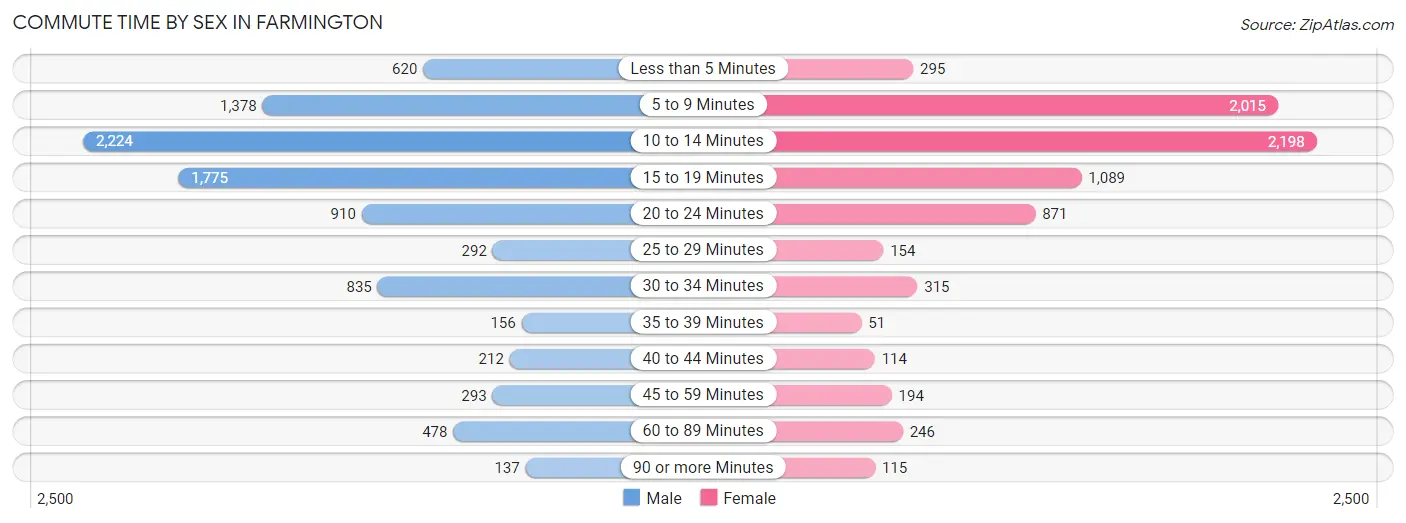
| Commute Time | Male | Female |
| Less than 5 Minutes | 620 (6.7%) | 295 (3.8%) |
| 5 to 9 Minutes | 1,378 (14.8%) | 2,015 (26.3%) |
| 10 to 14 Minutes | 2,224 (23.9%) | 2,198 (28.7%) |
| 15 to 19 Minutes | 1,775 (19.1%) | 1,089 (14.2%) |
| 20 to 24 Minutes | 910 (9.8%) | 871 (11.4%) |
| 25 to 29 Minutes | 292 (3.1%) | 154 (2.0%) |
| 30 to 34 Minutes | 835 (9.0%) | 315 (4.1%) |
| 35 to 39 Minutes | 156 (1.7%) | 51 (0.7%) |
| 40 to 44 Minutes | 212 (2.3%) | 114 (1.5%) |
| 45 to 59 Minutes | 293 (3.2%) | 194 (2.5%) |
| 60 to 89 Minutes | 478 (5.1%) | 246 (3.2%) |
| 90 or more Minutes | 137 (1.5%) | 115 (1.5%) |
Time of Departure to Work by Sex in Farmington
The most frequent times of departure to work in Farmington are 7:00 AM to 7:29 AM (1,657, 17.8%) for males and 7:30 AM to 7:59 AM (1,229, 16.1%) for females.
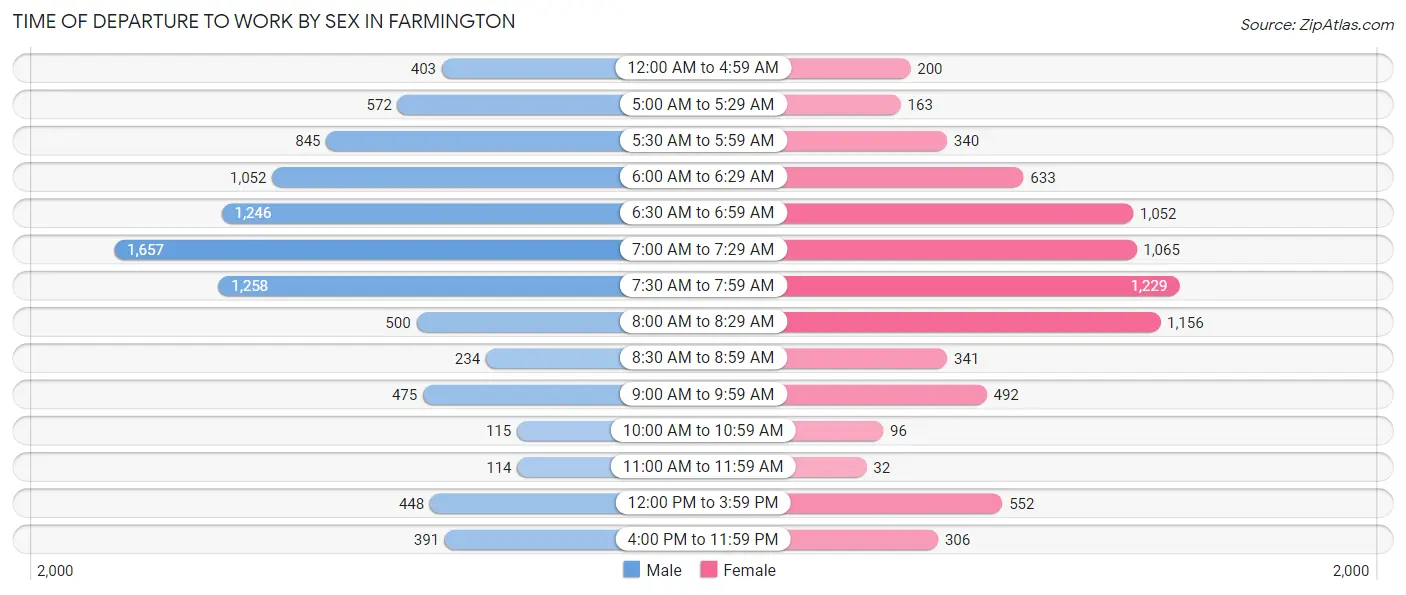
| Time of Departure | Male | Female |
| 12:00 AM to 4:59 AM | 403 (4.3%) | 200 (2.6%) |
| 5:00 AM to 5:29 AM | 572 (6.1%) | 163 (2.1%) |
| 5:30 AM to 5:59 AM | 845 (9.1%) | 340 (4.4%) |
| 6:00 AM to 6:29 AM | 1,052 (11.3%) | 633 (8.3%) |
| 6:30 AM to 6:59 AM | 1,246 (13.4%) | 1,052 (13.7%) |
| 7:00 AM to 7:29 AM | 1,657 (17.8%) | 1,065 (13.9%) |
| 7:30 AM to 7:59 AM | 1,258 (13.5%) | 1,229 (16.1%) |
| 8:00 AM to 8:29 AM | 500 (5.4%) | 1,156 (15.1%) |
| 8:30 AM to 8:59 AM | 234 (2.5%) | 341 (4.4%) |
| 9:00 AM to 9:59 AM | 475 (5.1%) | 492 (6.4%) |
| 10:00 AM to 10:59 AM | 115 (1.2%) | 96 (1.3%) |
| 11:00 AM to 11:59 AM | 114 (1.2%) | 32 (0.4%) |
| 12:00 PM to 3:59 PM | 448 (4.8%) | 552 (7.2%) |
| 4:00 PM to 11:59 PM | 391 (4.2%) | 306 (4.0%) |
| Total | 9,310 (100.0%) | 7,657 (100.0%) |
Housing Occupancy in Farmington
Occupancy by Ownership in Farmington
Of the total 15,868 dwellings in Farmington, owner-occupied units account for 9,986 (62.9%), while renter-occupied units make up 5,882 (37.1%).
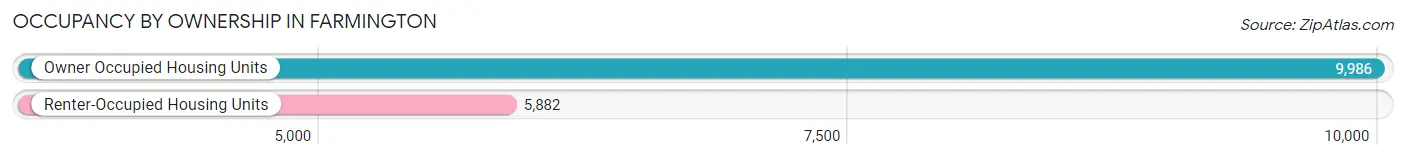
| Occupancy | # Housing Units | % Housing Units |
| Owner Occupied Housing Units | 9,986 | 62.9% |
| Renter-Occupied Housing Units | 5,882 | 37.1% |
| Total Occupied Housing Units | 15,868 | 100.0% |
Occupancy by Household Size in Farmington
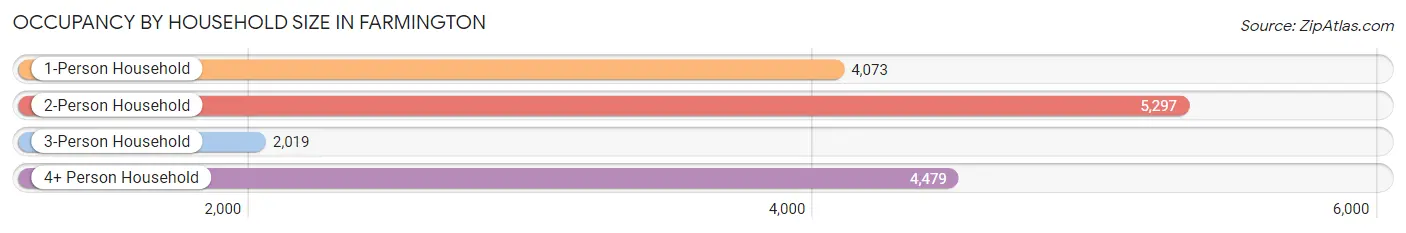
| Household Size | # Housing Units | % Housing Units |
| 1-Person Household | 4,073 | 25.7% |
| 2-Person Household | 5,297 | 33.4% |
| 3-Person Household | 2,019 | 12.7% |
| 4+ Person Household | 4,479 | 28.2% |
| Total Housing Units | 15,868 | 100.0% |
Occupancy by Ownership by Household Size in Farmington
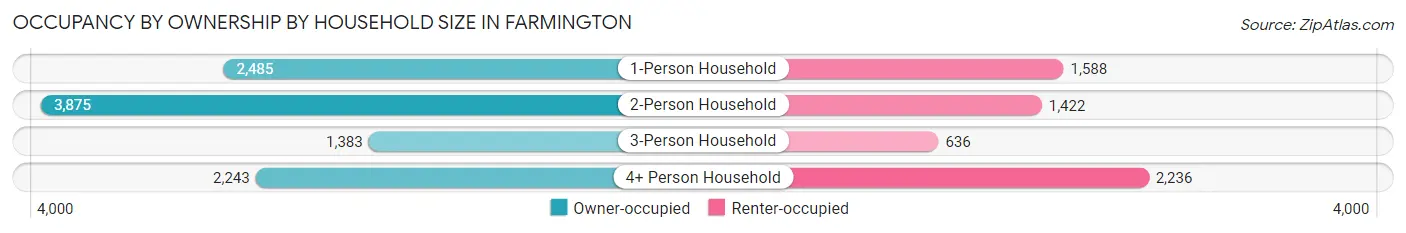
| Household Size | Owner-occupied | Renter-occupied |
| 1-Person Household | 2,485 (61.0%) | 1,588 (39.0%) |
| 2-Person Household | 3,875 (73.2%) | 1,422 (26.9%) |
| 3-Person Household | 1,383 (68.5%) | 636 (31.5%) |
| 4+ Person Household | 2,243 (50.1%) | 2,236 (49.9%) |
| Total Housing Units | 9,986 (62.9%) | 5,882 (37.1%) |
Occupancy by Educational Attainment in Farmington
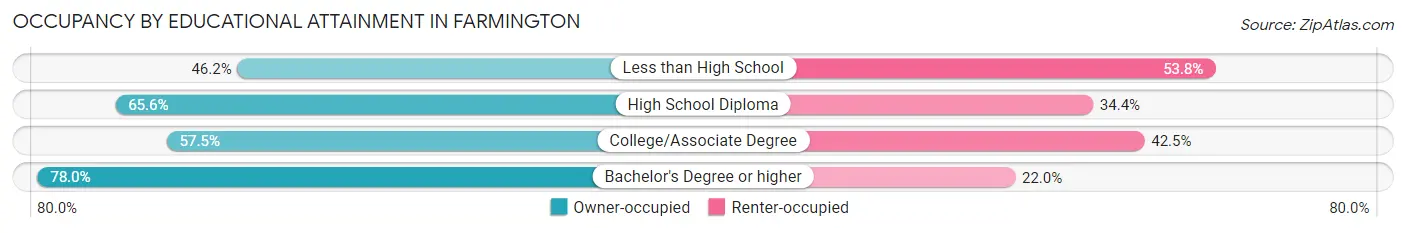
| Household Size | Owner-occupied | Renter-occupied |
| Less than High School | 571 (46.2%) | 664 (53.8%) |
| High School Diploma | 2,405 (65.6%) | 1,260 (34.4%) |
| College/Associate Degree | 4,322 (57.5%) | 3,199 (42.5%) |
| Bachelor's Degree or higher | 2,688 (78.0%) | 759 (22.0%) |
Occupancy by Age of Householder in Farmington
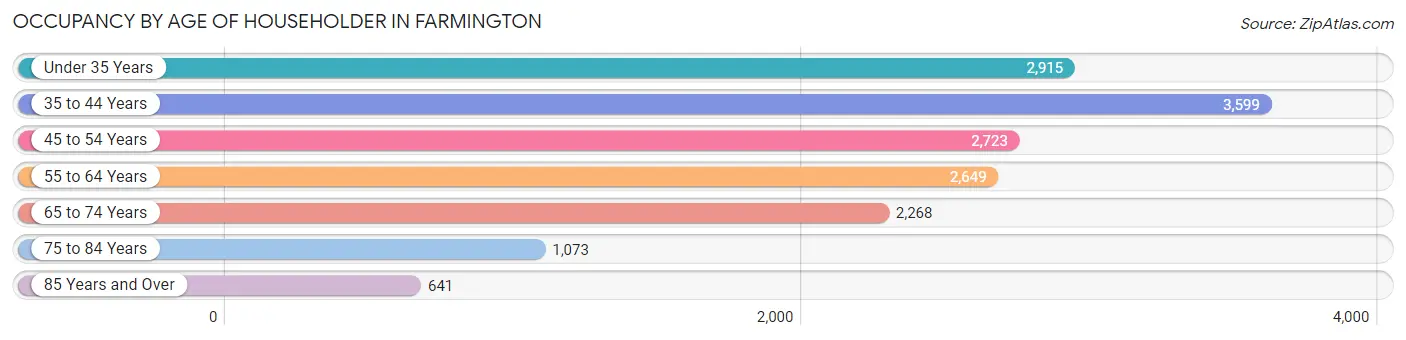
| Age Bracket | # Households | % Households |
| Under 35 Years | 2,915 | 18.4% |
| 35 to 44 Years | 3,599 | 22.7% |
| 45 to 54 Years | 2,723 | 17.2% |
| 55 to 64 Years | 2,649 | 16.7% |
| 65 to 74 Years | 2,268 | 14.3% |
| 75 to 84 Years | 1,073 | 6.8% |
| 85 Years and Over | 641 | 4.0% |
| Total | 15,868 | 100.0% |
Housing Finances in Farmington
Median Income by Occupancy in Farmington
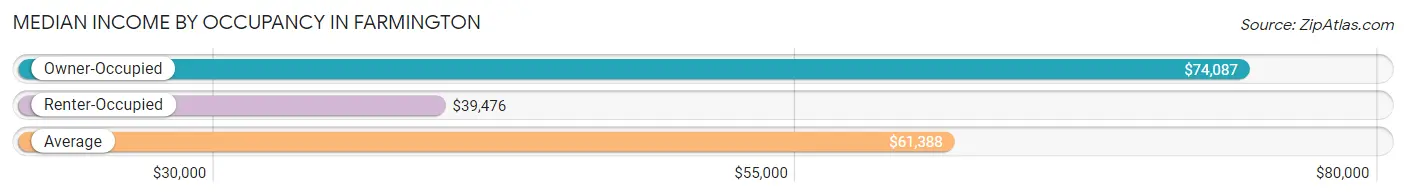
| Occupancy Type | # Households | Median Income |
| Owner-Occupied | 9,986 (62.9%) | $74,087 |
| Renter-Occupied | 5,882 (37.1%) | $39,476 |
| Average | 15,868 (100.0%) | $61,388 |
Occupancy by Householder Income Bracket in Farmington
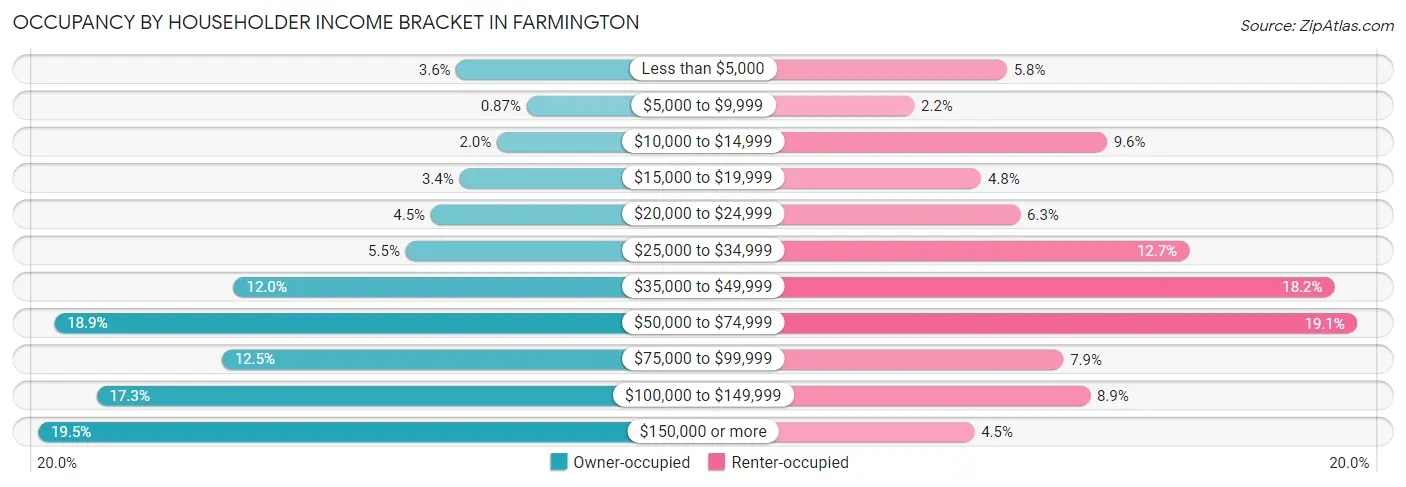
| Income Bracket | Owner-occupied | Renter-occupied |
| Less than $5,000 | 355 (3.5%) | 339 (5.8%) |
| $5,000 to $9,999 | 87 (0.9%) | 131 (2.2%) |
| $10,000 to $14,999 | 200 (2.0%) | 563 (9.6%) |
| $15,000 to $19,999 | 343 (3.4%) | 281 (4.8%) |
| $20,000 to $24,999 | 451 (4.5%) | 369 (6.3%) |
| $25,000 to $34,999 | 547 (5.5%) | 747 (12.7%) |
| $35,000 to $49,999 | 1,202 (12.0%) | 1,073 (18.2%) |
| $50,000 to $74,999 | 1,884 (18.9%) | 1,123 (19.1%) |
| $75,000 to $99,999 | 1,247 (12.5%) | 465 (7.9%) |
| $100,000 to $149,999 | 1,724 (17.3%) | 525 (8.9%) |
| $150,000 or more | 1,946 (19.5%) | 266 (4.5%) |
| Total | 9,986 (100.0%) | 5,882 (100.0%) |
Monthly Housing Cost Tiers in Farmington
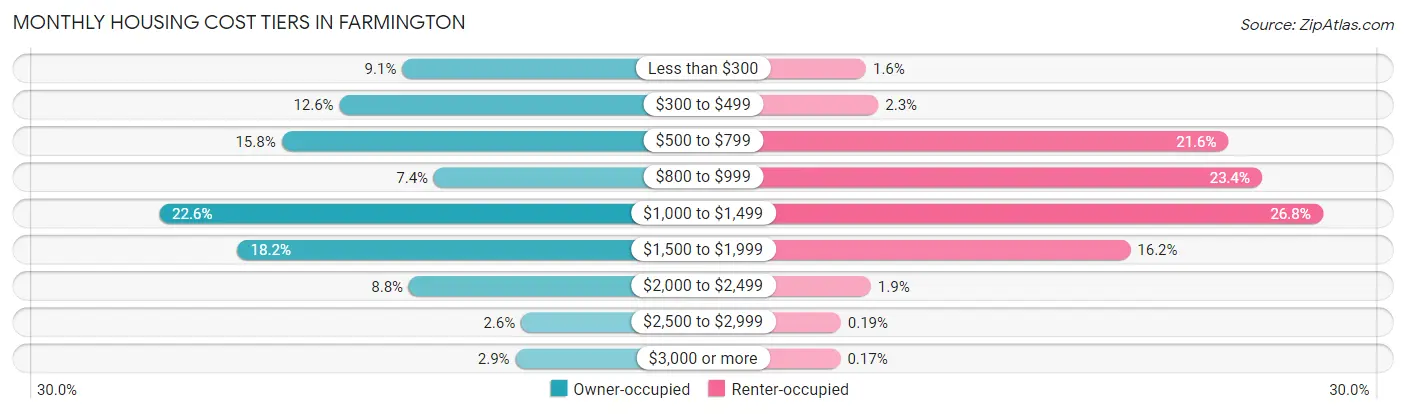
| Monthly Cost | Owner-occupied | Renter-occupied |
| Less than $300 | 913 (9.1%) | 93 (1.6%) |
| $300 to $499 | 1,259 (12.6%) | 133 (2.3%) |
| $500 to $799 | 1,579 (15.8%) | 1,270 (21.6%) |
| $800 to $999 | 738 (7.4%) | 1,379 (23.4%) |
| $1,000 to $1,499 | 2,254 (22.6%) | 1,576 (26.8%) |
| $1,500 to $1,999 | 1,820 (18.2%) | 952 (16.2%) |
| $2,000 to $2,499 | 876 (8.8%) | 109 (1.8%) |
| $2,500 to $2,999 | 258 (2.6%) | 11 (0.2%) |
| $3,000 or more | 289 (2.9%) | 10 (0.2%) |
| Total | 9,986 (100.0%) | 5,882 (100.0%) |
Physical Housing Characteristics in Farmington
Housing Structures in Farmington
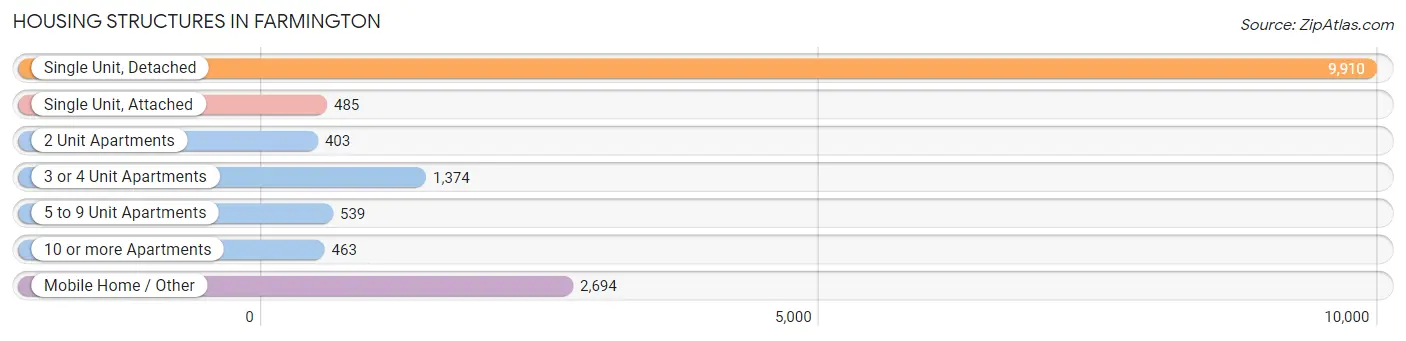
| Structure Type | # Housing Units | % Housing Units |
| Single Unit, Detached | 9,910 | 62.5% |
| Single Unit, Attached | 485 | 3.1% |
| 2 Unit Apartments | 403 | 2.5% |
| 3 or 4 Unit Apartments | 1,374 | 8.7% |
| 5 to 9 Unit Apartments | 539 | 3.4% |
| 10 or more Apartments | 463 | 2.9% |
| Mobile Home / Other | 2,694 | 17.0% |
| Total | 15,868 | 100.0% |
Housing Structures by Occupancy in Farmington
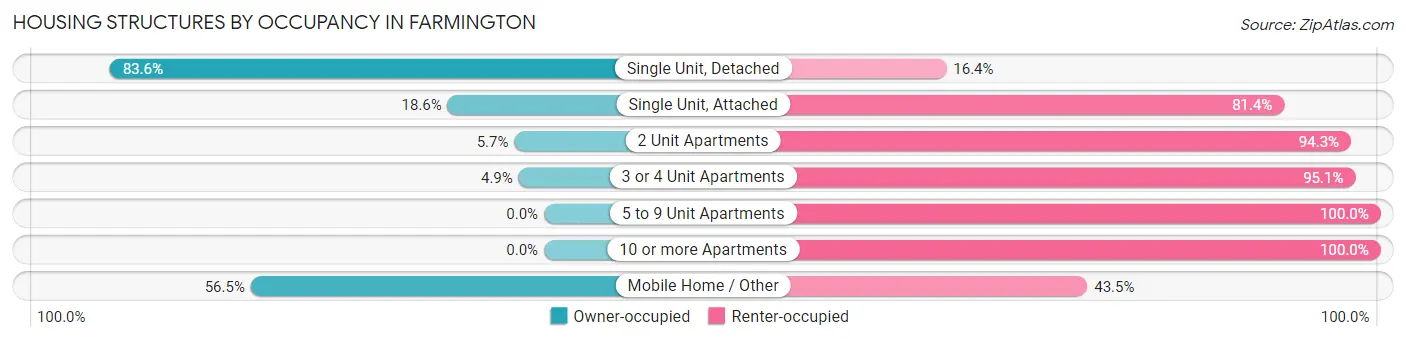
| Structure Type | Owner-occupied | Renter-occupied |
| Single Unit, Detached | 8,285 (83.6%) | 1,625 (16.4%) |
| Single Unit, Attached | 90 (18.6%) | 395 (81.4%) |
| 2 Unit Apartments | 23 (5.7%) | 380 (94.3%) |
| 3 or 4 Unit Apartments | 67 (4.9%) | 1,307 (95.1%) |
| 5 to 9 Unit Apartments | 0 (0.0%) | 539 (100.0%) |
| 10 or more Apartments | 0 (0.0%) | 463 (100.0%) |
| Mobile Home / Other | 1,521 (56.5%) | 1,173 (43.5%) |
| Total | 9,986 (62.9%) | 5,882 (37.1%) |
Housing Structures by Number of Rooms in Farmington
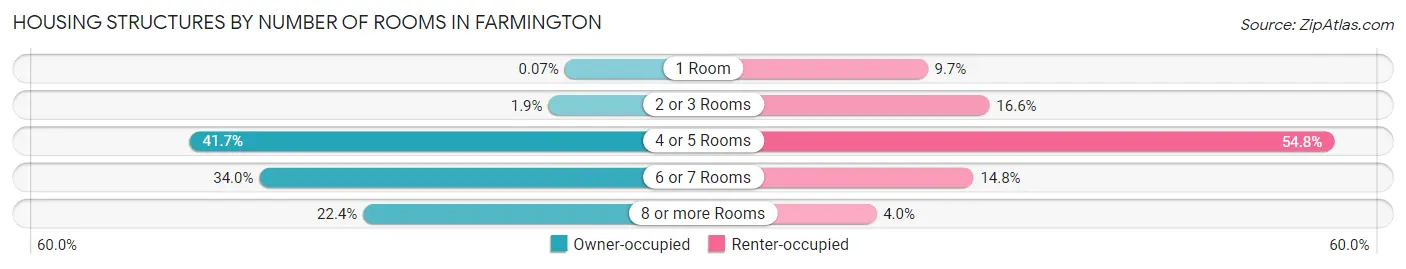
| Number of Rooms | Owner-occupied | Renter-occupied |
| 1 Room | 7 (0.1%) | 572 (9.7%) |
| 2 or 3 Rooms | 187 (1.9%) | 976 (16.6%) |
| 4 or 5 Rooms | 4,162 (41.7%) | 3,225 (54.8%) |
| 6 or 7 Rooms | 3,390 (34.0%) | 872 (14.8%) |
| 8 or more Rooms | 2,240 (22.4%) | 237 (4.0%) |
| Total | 9,986 (100.0%) | 5,882 (100.0%) |
Housing Structure by Heating Type in Farmington
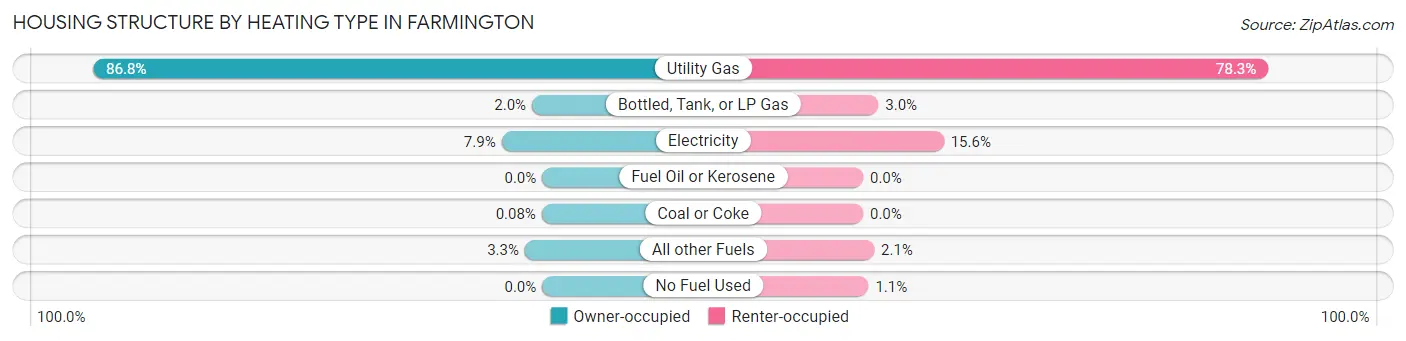
| Heating Type | Owner-occupied | Renter-occupied |
| Utility Gas | 8,663 (86.8%) | 4,604 (78.3%) |
| Bottled, Tank, or LP Gas | 197 (2.0%) | 174 (3.0%) |
| Electricity | 784 (7.9%) | 917 (15.6%) |
| Fuel Oil or Kerosene | 0 (0.0%) | 0 (0.0%) |
| Coal or Coke | 8 (0.1%) | 0 (0.0%) |
| All other Fuels | 334 (3.3%) | 125 (2.1%) |
| No Fuel Used | 0 (0.0%) | 62 (1.1%) |
| Total | 9,986 (100.0%) | 5,882 (100.0%) |
Household Vehicle Usage in Farmington
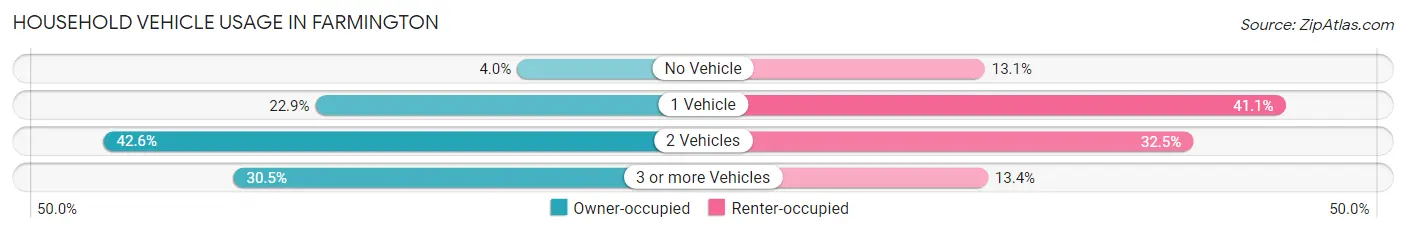
| Vehicles per Household | Owner-occupied | Renter-occupied |
| No Vehicle | 402 (4.0%) | 768 (13.1%) |
| 1 Vehicle | 2,283 (22.9%) | 2,418 (41.1%) |
| 2 Vehicles | 4,256 (42.6%) | 1,911 (32.5%) |
| 3 or more Vehicles | 3,045 (30.5%) | 785 (13.4%) |
| Total | 9,986 (100.0%) | 5,882 (100.0%) |
Real Estate & Mortgages in Farmington
Real Estate and Mortgage Overview in Farmington
| Characteristic | Without Mortgage | With Mortgage |
| Housing Units | 3,925 | 6,061 |
| Median Property Value | $185,600 | $236,900 |
| Median Household Income | $49,848 | $1,525 |
| Monthly Housing Costs | $473 | $289 |
| Real Estate Taxes | $1,142 | $249 |
Property Value by Mortgage Status in Farmington
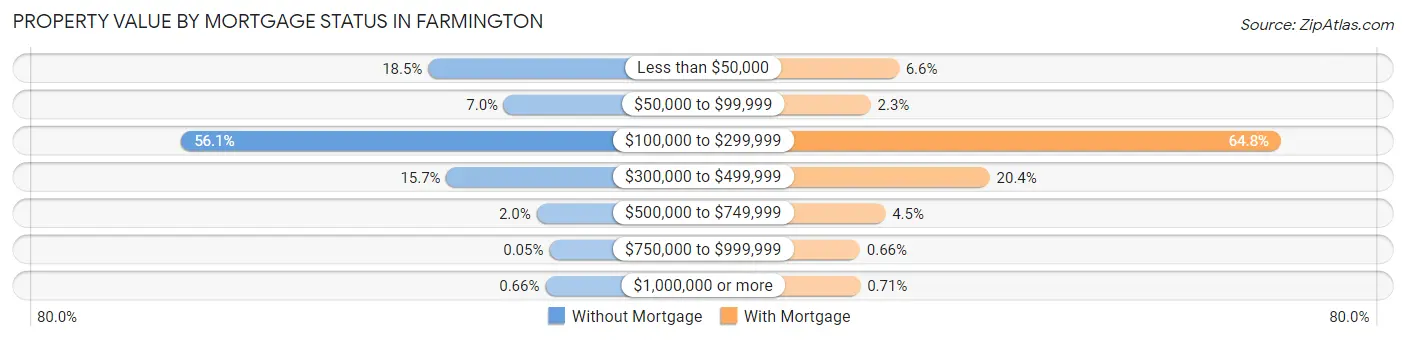
| Property Value | Without Mortgage | With Mortgage |
| Less than $50,000 | 726 (18.5%) | 399 (6.6%) |
| $50,000 to $99,999 | 273 (7.0%) | 139 (2.3%) |
| $100,000 to $299,999 | 2,203 (56.1%) | 3,928 (64.8%) |
| $300,000 to $499,999 | 617 (15.7%) | 1,238 (20.4%) |
| $500,000 to $749,999 | 78 (2.0%) | 274 (4.5%) |
| $750,000 to $999,999 | 2 (0.1%) | 40 (0.7%) |
| $1,000,000 or more | 26 (0.7%) | 43 (0.7%) |
| Total | 3,925 (100.0%) | 6,061 (100.0%) |
Household Income by Mortgage Status in Farmington
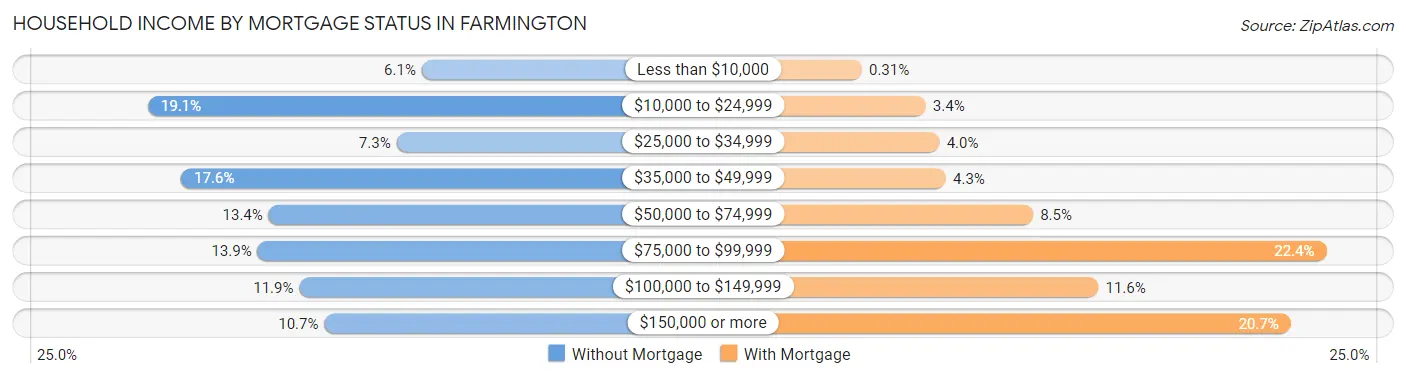
| Household Income | Without Mortgage | With Mortgage |
| Less than $10,000 | 239 (6.1%) | 19 (0.3%) |
| $10,000 to $24,999 | 751 (19.1%) | 203 (3.4%) |
| $25,000 to $34,999 | 286 (7.3%) | 243 (4.0%) |
| $35,000 to $49,999 | 689 (17.5%) | 261 (4.3%) |
| $50,000 to $74,999 | 525 (13.4%) | 513 (8.5%) |
| $75,000 to $99,999 | 546 (13.9%) | 1,359 (22.4%) |
| $100,000 to $149,999 | 468 (11.9%) | 701 (11.6%) |
| $150,000 or more | 421 (10.7%) | 1,256 (20.7%) |
| Total | 3,925 (100.0%) | 6,061 (100.0%) |
Property Value to Household Income Ratio in Farmington
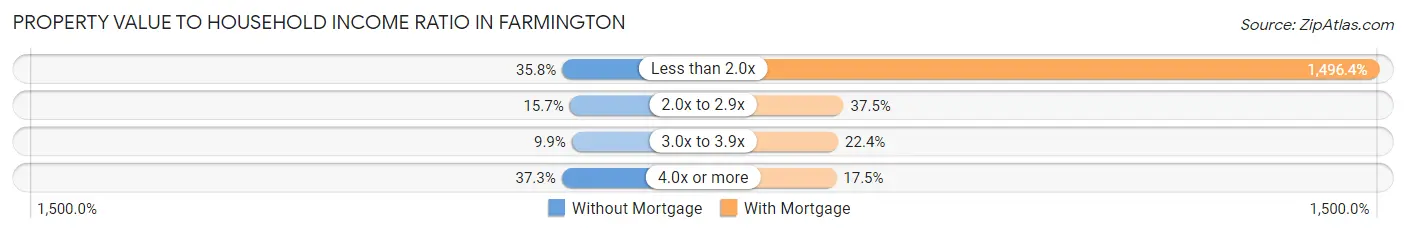
| Value-to-Income Ratio | Without Mortgage | With Mortgage |
| Less than 2.0x | 1,403 (35.7%) | 90,699 (1,496.4%) |
| 2.0x to 2.9x | 615 (15.7%) | 2,270 (37.4%) |
| 3.0x to 3.9x | 387 (9.9%) | 1,360 (22.4%) |
| 4.0x or more | 1,465 (37.3%) | 1,059 (17.5%) |
| Total | 3,925 (100.0%) | 6,061 (100.0%) |
Real Estate Taxes by Mortgage Status in Farmington
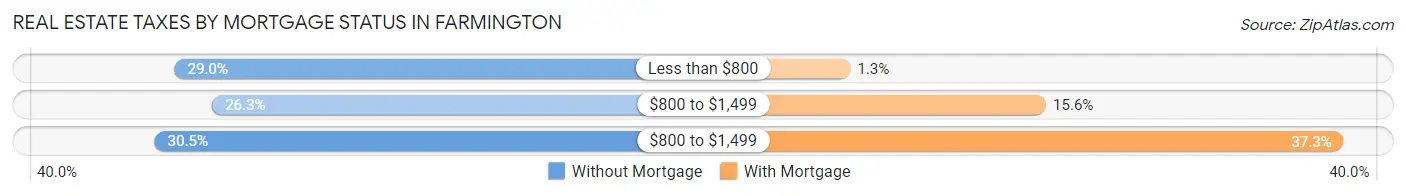
| Property Taxes | Without Mortgage | With Mortgage |
| Less than $800 | 1,140 (29.0%) | 77 (1.3%) |
| $800 to $1,499 | 1,032 (26.3%) | 944 (15.6%) |
| $800 to $1,499 | 1,197 (30.5%) | 2,261 (37.3%) |
| Total | 3,925 (100.0%) | 6,061 (100.0%) |
Health & Disability in Farmington
Health Insurance Coverage by Age in Farmington
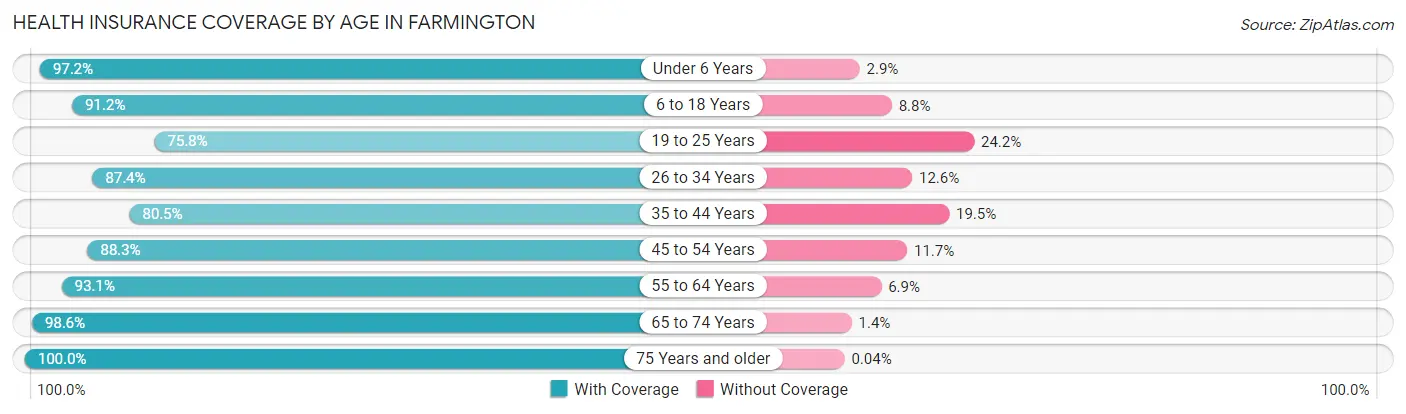
| Age Bracket | With Coverage | Without Coverage |
| Under 6 Years | 3,679 (97.2%) | 108 (2.9%) |
| 6 to 18 Years | 8,991 (91.2%) | 872 (8.8%) |
| 19 to 25 Years | 2,988 (75.8%) | 954 (24.2%) |
| 26 to 34 Years | 4,292 (87.4%) | 621 (12.6%) |
| 35 to 44 Years | 5,546 (80.5%) | 1,347 (19.5%) |
| 45 to 54 Years | 4,332 (88.3%) | 574 (11.7%) |
| 55 to 64 Years | 4,458 (93.1%) | 330 (6.9%) |
| 65 to 74 Years | 3,766 (98.6%) | 52 (1.4%) |
| 75 Years and older | 2,511 (100.0%) | 1 (0.0%) |
| Total | 40,563 (89.3%) | 4,859 (10.7%) |
Health Insurance Coverage by Citizenship Status in Farmington
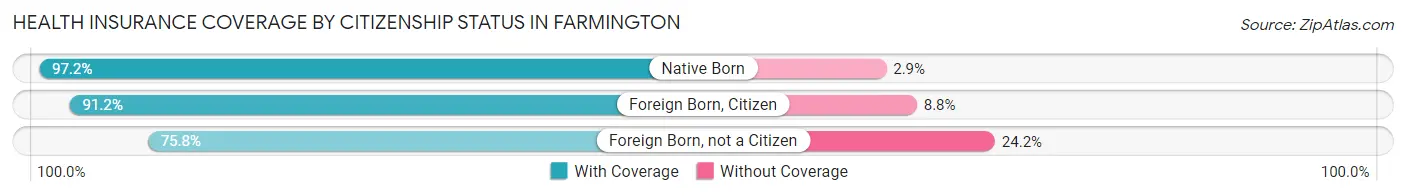
| Citizenship Status | With Coverage | Without Coverage |
| Native Born | 3,679 (97.2%) | 108 (2.9%) |
| Foreign Born, Citizen | 8,991 (91.2%) | 872 (8.8%) |
| Foreign Born, not a Citizen | 2,988 (75.8%) | 954 (24.2%) |
Health Insurance Coverage by Household Income in Farmington
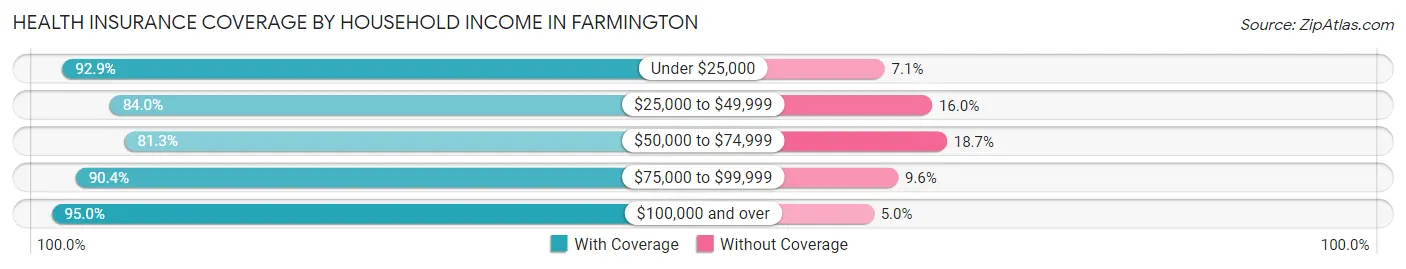
| Household Income | With Coverage | Without Coverage |
| Under $25,000 | 6,431 (92.9%) | 491 (7.1%) |
| $25,000 to $49,999 | 8,702 (84.0%) | 1,652 (16.0%) |
| $50,000 to $74,999 | 6,402 (81.3%) | 1,475 (18.7%) |
| $75,000 to $99,999 | 4,715 (90.4%) | 500 (9.6%) |
| $100,000 and over | 13,952 (95.0%) | 741 (5.0%) |
Public vs Private Health Insurance Coverage by Age in Farmington
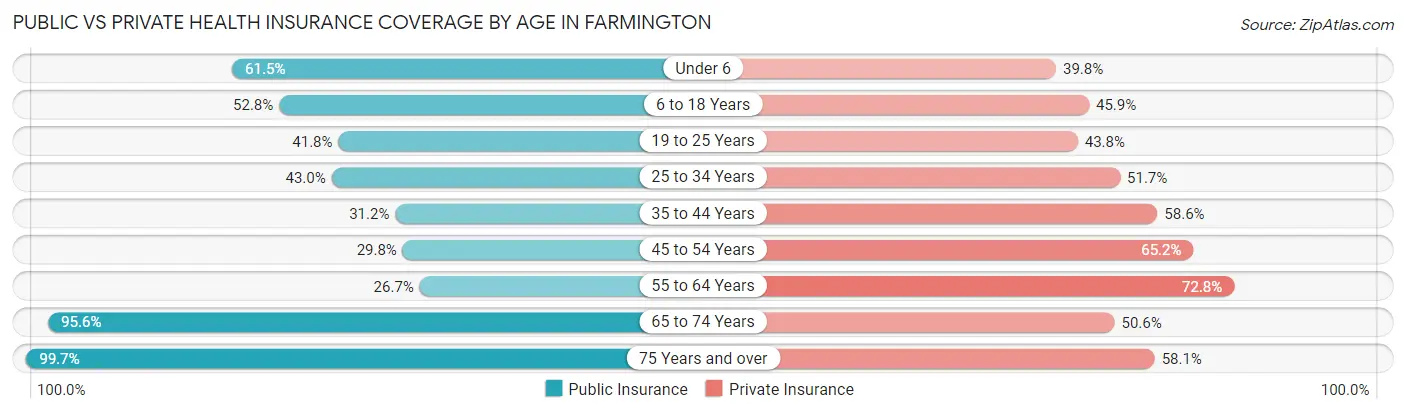
| Age Bracket | Public Insurance | Private Insurance |
| Under 6 | 2,328 (61.5%) | 1,506 (39.8%) |
| 6 to 18 Years | 5,204 (52.8%) | 4,526 (45.9%) |
| 19 to 25 Years | 1,646 (41.8%) | 1,727 (43.8%) |
| 25 to 34 Years | 2,114 (43.0%) | 2,538 (51.7%) |
| 35 to 44 Years | 2,151 (31.2%) | 4,038 (58.6%) |
| 45 to 54 Years | 1,463 (29.8%) | 3,200 (65.2%) |
| 55 to 64 Years | 1,277 (26.7%) | 3,486 (72.8%) |
| 65 to 74 Years | 3,651 (95.6%) | 1,933 (50.6%) |
| 75 Years and over | 2,504 (99.7%) | 1,459 (58.1%) |
| Total | 22,338 (49.2%) | 24,413 (53.7%) |
Disability Status by Sex by Age in Farmington
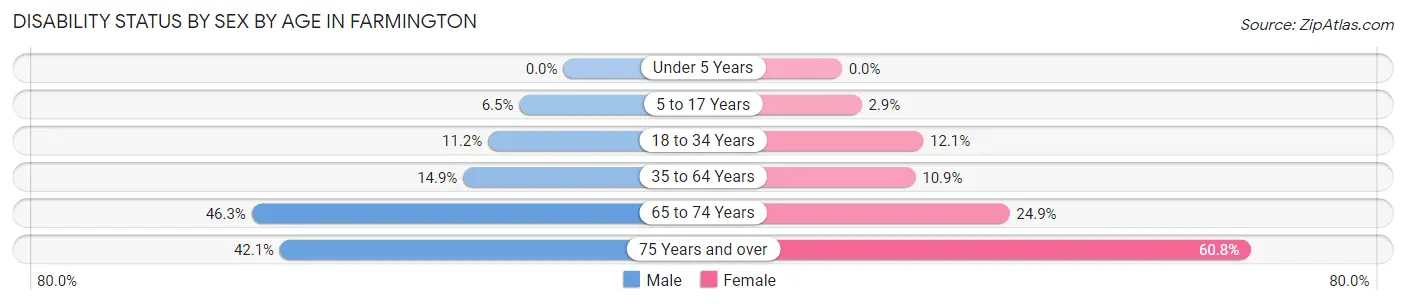
| Age Bracket | Male | Female |
| Under 5 Years | 0 (0.0%) | 0 (0.0%) |
| 5 to 17 Years | 311 (6.5%) | 150 (2.9%) |
| 18 to 34 Years | 493 (11.2%) | 589 (12.1%) |
| 35 to 64 Years | 1,229 (14.9%) | 908 (10.9%) |
| 65 to 74 Years | 815 (46.3%) | 512 (24.9%) |
| 75 Years and over | 420 (42.1%) | 920 (60.8%) |
Disability Class by Sex by Age in Farmington
Disability Class: Hearing Difficulty
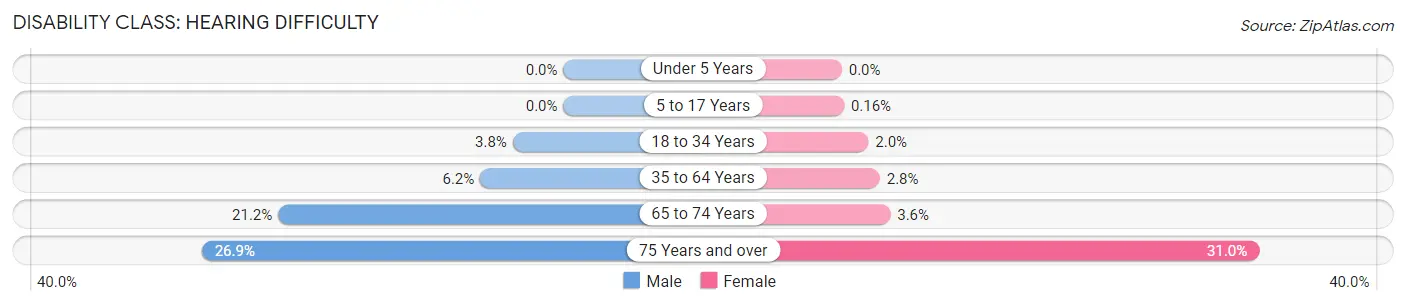
| Age Bracket | Male | Female |
| Under 5 Years | 0 (0.0%) | 0 (0.0%) |
| 5 to 17 Years | 0 (0.0%) | 8 (0.2%) |
| 18 to 34 Years | 166 (3.8%) | 96 (2.0%) |
| 35 to 64 Years | 511 (6.2%) | 235 (2.8%) |
| 65 to 74 Years | 373 (21.2%) | 74 (3.6%) |
| 75 Years and over | 268 (26.9%) | 469 (31.0%) |
Disability Class: Vision Difficulty
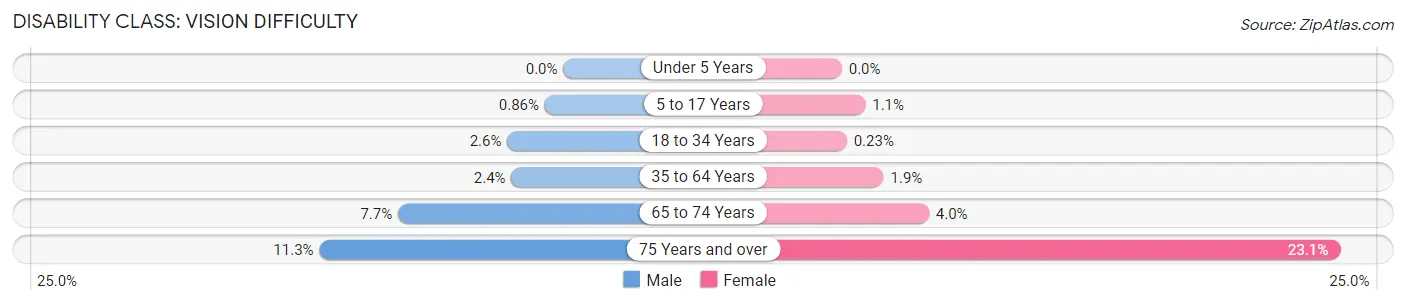
| Age Bracket | Male | Female |
| Under 5 Years | 0 (0.0%) | 0 (0.0%) |
| 5 to 17 Years | 41 (0.9%) | 56 (1.1%) |
| 18 to 34 Years | 115 (2.6%) | 11 (0.2%) |
| 35 to 64 Years | 199 (2.4%) | 161 (1.9%) |
| 65 to 74 Years | 135 (7.7%) | 83 (4.0%) |
| 75 Years and over | 113 (11.3%) | 350 (23.1%) |
Disability Class: Cognitive Difficulty
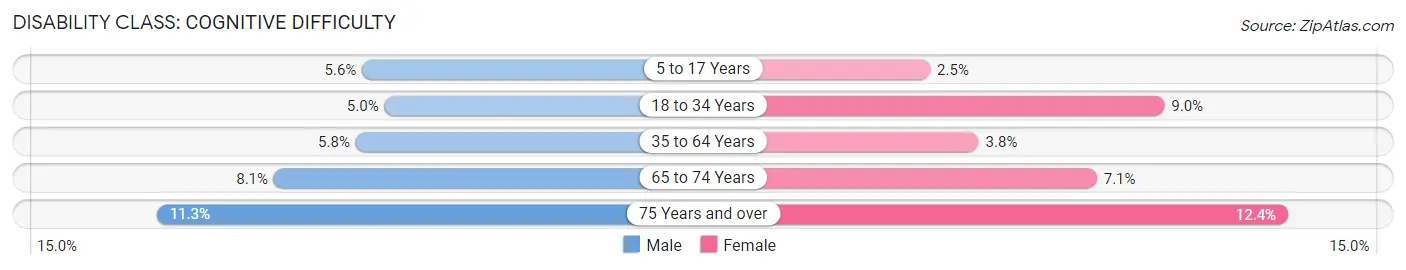
| Age Bracket | Male | Female |
| 5 to 17 Years | 266 (5.6%) | 126 (2.5%) |
| 18 to 34 Years | 220 (5.0%) | 438 (9.0%) |
| 35 to 64 Years | 478 (5.8%) | 317 (3.8%) |
| 65 to 74 Years | 142 (8.1%) | 146 (7.1%) |
| 75 Years and over | 113 (11.3%) | 188 (12.4%) |
Disability Class: Ambulatory Difficulty
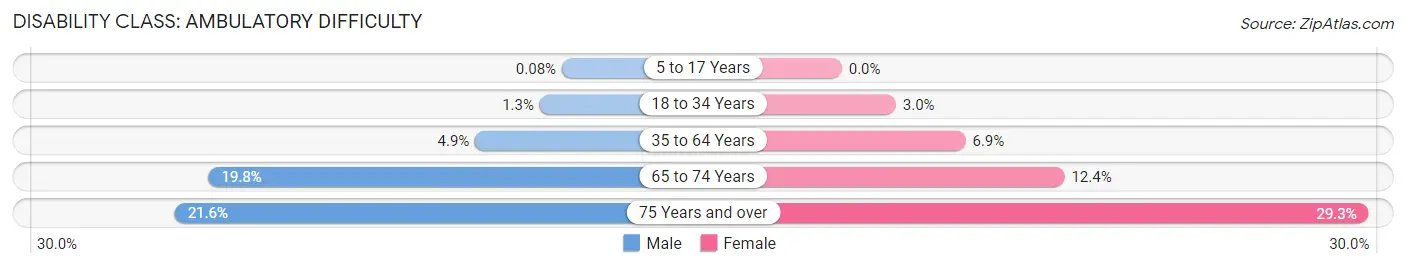
| Age Bracket | Male | Female |
| 5 to 17 Years | 4 (0.1%) | 0 (0.0%) |
| 18 to 34 Years | 58 (1.3%) | 147 (3.0%) |
| 35 to 64 Years | 406 (4.9%) | 573 (6.9%) |
| 65 to 74 Years | 348 (19.8%) | 255 (12.4%) |
| 75 Years and over | 216 (21.6%) | 444 (29.3%) |
Disability Class: Self-Care Difficulty
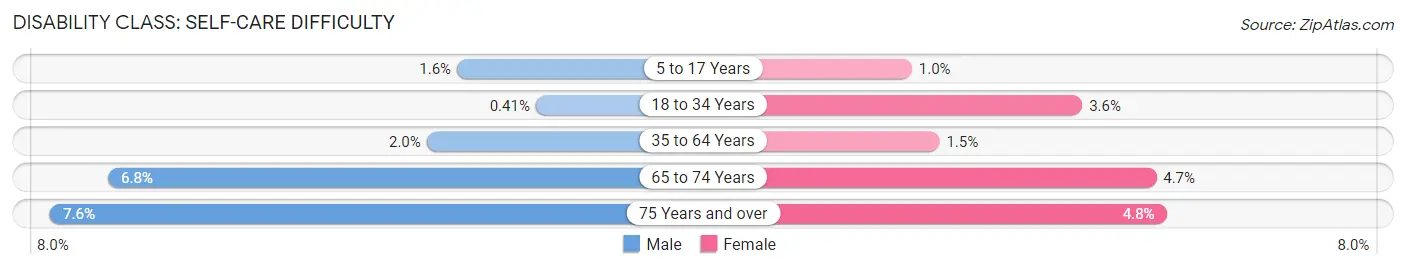
| Age Bracket | Male | Female |
| 5 to 17 Years | 75 (1.6%) | 53 (1.0%) |
| 18 to 34 Years | 18 (0.4%) | 174 (3.6%) |
| 35 to 64 Years | 168 (2.0%) | 121 (1.5%) |
| 65 to 74 Years | 119 (6.8%) | 96 (4.7%) |
| 75 Years and over | 76 (7.6%) | 73 (4.8%) |
Technology Access in Farmington
Computing Device Access in Farmington
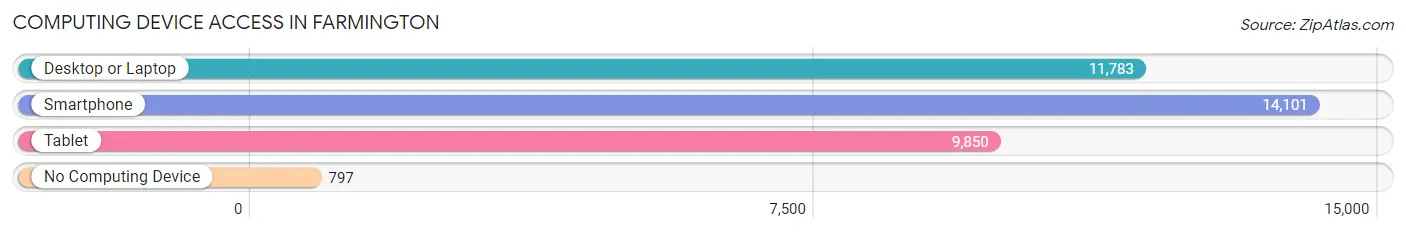
| Device Type | # Households | % Households |
| Desktop or Laptop | 11,783 | 74.3% |
| Smartphone | 14,101 | 88.9% |
| Tablet | 9,850 | 62.1% |
| No Computing Device | 797 | 5.0% |
| Total | 15,868 | 100.0% |
Internet Access in Farmington
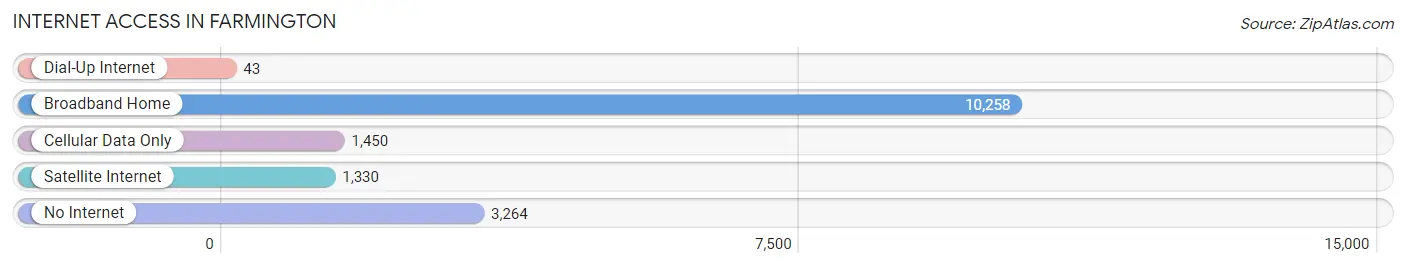
| Internet Type | # Households | % Households |
| Dial-Up Internet | 43 | 0.3% |
| Broadband Home | 10,258 | 64.6% |
| Cellular Data Only | 1,450 | 9.1% |
| Satellite Internet | 1,330 | 8.4% |
| No Internet | 3,264 | 20.6% |
| Total | 15,868 | 100.0% |
Farmington Summary
History
The area now known as Farmington, New Mexico has been inhabited for thousands of years. The earliest known inhabitants were the Ancestral Puebloans, who lived in the area from around 1000 BC to 1300 AD. The Ancestral Puebloans built villages and farmed the land, leaving behind a rich archaeological record.
The first Europeans to visit the area were Spanish explorers in the late 1500s. The Spanish established a mission in the area in 1659, and the area was part of the Spanish Empire until 1821, when Mexico gained independence. The area was part of the Mexican state of Nuevo Mexico until 1848, when the United States acquired it as part of the Treaty of Guadalupe Hidalgo.
In 1876, the area was officially established as the town of Farmington. The town was named after the nearby Animas River, which was known as the "Farming River" by the local Navajo people. The town quickly grew, and by the early 1900s, it was a bustling center of commerce and industry.
Geography
Farmington is located in the Four Corners region of the southwestern United States. It is situated in the northwest corner of New Mexico, near the borders of Colorado, Utah, and Arizona. The city is located in the San Juan Basin, a large sedimentary basin that covers much of northwestern New Mexico.
The city is situated at an elevation of 5,400 feet above sea level, and is surrounded by the San Juan Mountains to the east and the Chuska Mountains to the west. The Animas River runs through the city, and the nearby San Juan River is a popular destination for fishing and boating.
Economy
The economy of Farmington is largely based on the energy industry. The city is home to several oil and gas companies, as well as a number of coal-fired power plants. The city is also home to several manufacturing companies, including a large paper mill and a number of food processing plants.
The city is also a major center for tourism. The nearby Navajo Nation is a popular destination for visitors, and the city is home to several museums and other attractions. The city is also home to a number of outdoor recreation areas, including the nearby Chaco Culture National Historical Park.
Demographics
As of the 2010 census, the population of Farmington was 45,877. The city has a diverse population, with a majority of the population being of Hispanic or Latino origin. The city also has a significant Native American population, with the Navajo Nation making up the largest portion of the population.
The median household income in Farmington is $41,945, and the median home value is $142,400. The city has a poverty rate of 18.3%, and the unemployment rate is 6.2%. The city has a high school graduation rate of 79.3%, and the average commute time is 19.3 minutes.
Common Questions
What is Per Capita Income in Farmington?
Per Capita income in Farmington is $28,961.
What is the Median Family Income in Farmington?
Median Family Income in Farmington is $72,723.
What is the Median Household income in Farmington?
Median Household Income in Farmington is $61,388.
What is Income or Wage Gap in Farmington?
Income or Wage Gap in Farmington is 33.9%.
Women in Farmington earn 66.1 cents for every dollar earned by a man.
What is Family Income Deficit in Farmington?
Family Income Deficit in Farmington is $15,113.
Families that are below poverty line in Farmington earn $15,113 less on average than the poverty threshold level.
What is Inequality or Gini Index in Farmington?
Inequality or Gini Index in Farmington is 0.46.
What is the Total Population of Farmington?
Total Population of Farmington is 46,457.
What is the Total Male Population of Farmington?
Total Male Population of Farmington is 22,467.
What is the Total Female Population of Farmington?
Total Female Population of Farmington is 23,990.
What is the Ratio of Males per 100 Females in Farmington?
There are 93.65 Males per 100 Females in Farmington.
What is the Ratio of Females per 100 Males in Farmington?
There are 106.78 Females per 100 Males in Farmington.
What is the Median Population Age in Farmington?
Median Population Age in Farmington is 35.7 Years.
What is the Average Family Size in Farmington
Average Family Size in Farmington is 3.4 People.
What is the Average Household Size in Farmington
Average Household Size in Farmington is 2.8 People.
How Large is the Labor Force in Farmington?
There are 19,774 People in the Labor Forcein in Farmington.
What is the Percentage of People in the Labor Force in Farmington?
56.7% of People are in the Labor Force in Farmington.
What is the Unemployment Rate in Farmington?
Unemployment Rate in Farmington is 7.7%.