Whitesboro, NJ Map & Demographics
Whitesboro Map
Whitesboro Overview
$34,248
PER CAPITA INCOME
$88,281
AVG FAMILY INCOME
$62,273
AVG HOUSEHOLD INCOME
42.0%
WAGE / INCOME GAP [ % ]
58.0¢/ $1
WAGE / INCOME GAP [ $ ]
0.44
INEQUALITY / GINI INDEX
2,497
TOTAL POPULATION
1,473
MALE POPULATION
1,024
FEMALE POPULATION
143.85
MALES / 100 FEMALES
69.52
FEMALES / 100 MALES
37.8
MEDIAN AGE
3.3
AVG FAMILY SIZE
2.4
AVG HOUSEHOLD SIZE
1,124
LABOR FORCE [ PEOPLE ]
59.2%
PERCENT IN LABOR FORCE
9.6%
UNEMPLOYMENT RATE
Whitesboro Area Codes
Income in Whitesboro
Income Overview in Whitesboro
Per Capita Income in Whitesboro is $34,248, while median incomes of families and households are $88,281 and $62,273 respectively.
| Characteristic | Number | Measure |
| Per Capita Income | 2,497 | $34,248 |
| Median Family Income | 639 | $88,281 |
| Mean Family Income | 639 | $100,403 |
| Median Household Income | 1,024 | $62,273 |
| Mean Household Income | 1,024 | $79,793 |
| Income Deficit | 639 | $0 |
| Wage / Income Gap (%) | 2,497 | 42.03% |
| Wage / Income Gap ($) | 2,497 | 57.97¢ per $1 |
| Gini / Inequality Index | 2,497 | 0.44 |
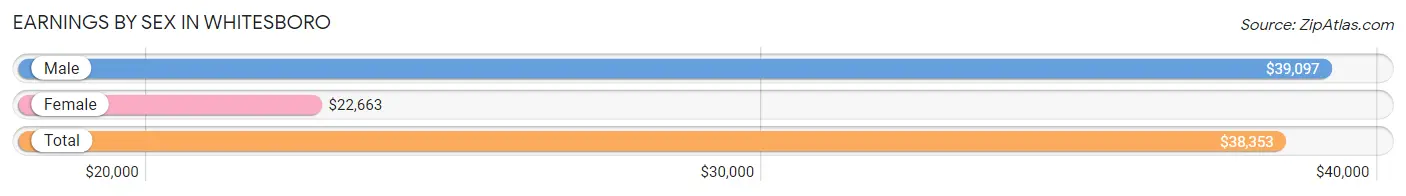
Earnings by Sex in Whitesboro
Average Earnings in Whitesboro are $38,353, $39,097 for men and $22,663 for women, a difference of 42.0%.
| Sex | Number | Average Earnings |
| Male | 791 (64.8%) | $39,097 |
| Female | 429 (35.2%) | $22,663 |
| Total | 1,220 (100.0%) | $38,353 |
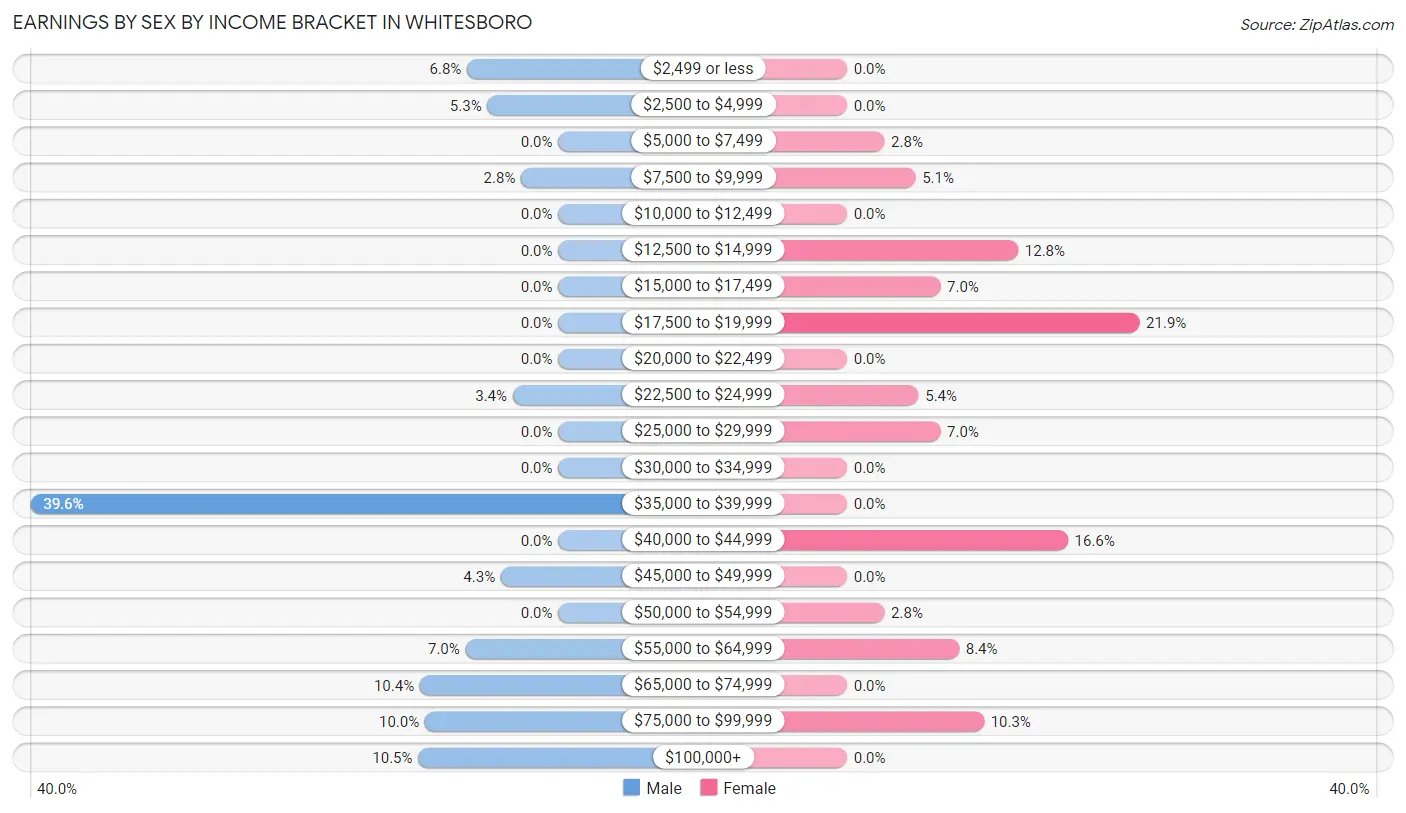
Earnings by Sex by Income Bracket in Whitesboro
The most common earnings brackets in Whitesboro are $35,000 to $39,999 for men (313 | 39.6%) and $17,500 to $19,999 for women (94 | 21.9%).
| Income | Male | Female |
| $2,499 or less | 54 (6.8%) | 0 (0.0%) |
| $2,500 to $4,999 | 42 (5.3%) | 0 (0.0%) |
| $5,000 to $7,499 | 0 (0.0%) | 12 (2.8%) |
| $7,500 to $9,999 | 22 (2.8%) | 22 (5.1%) |
| $10,000 to $12,499 | 0 (0.0%) | 0 (0.0%) |
| $12,500 to $14,999 | 0 (0.0%) | 55 (12.8%) |
| $15,000 to $17,499 | 0 (0.0%) | 30 (7.0%) |
| $17,500 to $19,999 | 0 (0.0%) | 94 (21.9%) |
| $20,000 to $22,499 | 0 (0.0%) | 0 (0.0%) |
| $22,500 to $24,999 | 27 (3.4%) | 23 (5.4%) |
| $25,000 to $29,999 | 0 (0.0%) | 30 (7.0%) |
| $30,000 to $34,999 | 0 (0.0%) | 0 (0.0%) |
| $35,000 to $39,999 | 313 (39.6%) | 0 (0.0%) |
| $40,000 to $44,999 | 0 (0.0%) | 71 (16.6%) |
| $45,000 to $49,999 | 34 (4.3%) | 0 (0.0%) |
| $50,000 to $54,999 | 0 (0.0%) | 12 (2.8%) |
| $55,000 to $64,999 | 55 (7.0%) | 36 (8.4%) |
| $65,000 to $74,999 | 82 (10.4%) | 0 (0.0%) |
| $75,000 to $99,999 | 79 (10.0%) | 44 (10.3%) |
| $100,000+ | 83 (10.5%) | 0 (0.0%) |
| Total | 791 (100.0%) | 429 (100.0%) |
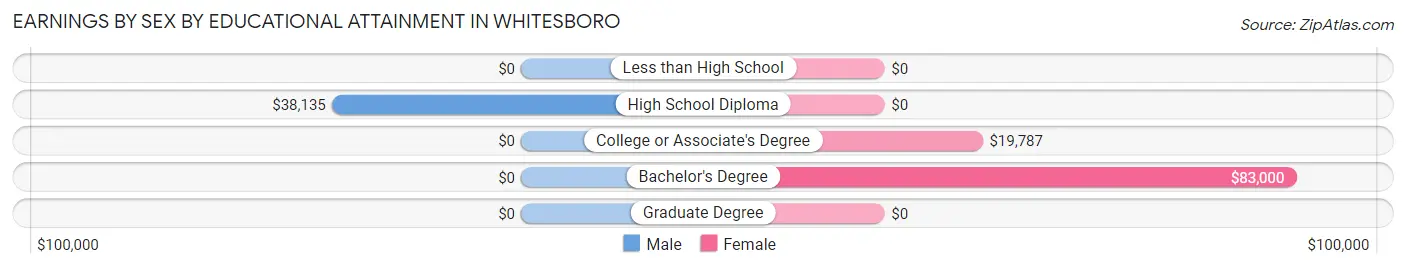
Earnings by Sex by Educational Attainment in Whitesboro
Average earnings in Whitesboro are $39,646 for men and $22,663 for women, a difference of 42.8%. Men with an educational attainment of high school diploma enjoy the highest average annual earnings of $38,135, while those with high school diploma education earn the least with $38,135. Women with an educational attainment of bachelor's degree earn the most with the average annual earnings of $83,000, while those with college or associate's degree education have the smallest earnings of $19,787.
| Educational Attainment | Male Income | Female Income |
| Less than High School | - | - |
| High School Diploma | $38,135 | $0 |
| College or Associate's Degree | - | - |
| Bachelor's Degree | - | - |
| Graduate Degree | - | - |
| Total | $39,646 | $22,663 |
Family Income in Whitesboro
Family Income Brackets in Whitesboro
According to the Whitesboro family income data, there are 203 families falling into the $75,000 to $99,999 income range, which is the most common income bracket and makes up 31.8% of all families.
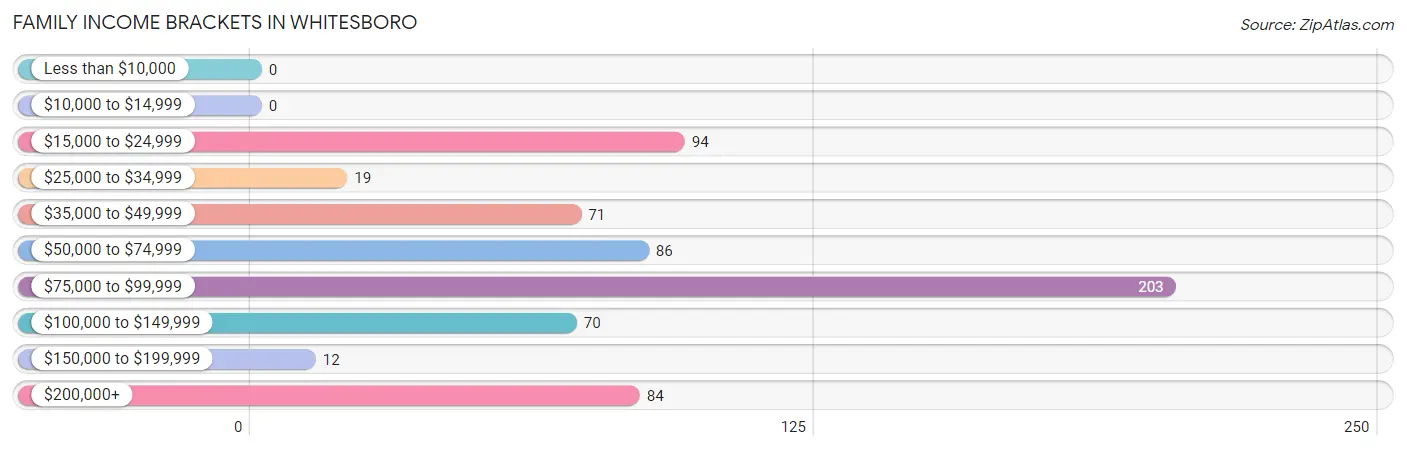
| Income Bracket | # Families | % Families |
| Less than $10,000 | 0 | 0.0% |
| $10,000 to $14,999 | 0 | 0.0% |
| $15,000 to $24,999 | 94 | 14.7% |
| $25,000 to $34,999 | 19 | 3.0% |
| $35,000 to $49,999 | 71 | 11.1% |
| $50,000 to $74,999 | 86 | 13.5% |
| $75,000 to $99,999 | 203 | 31.8% |
| $100,000 to $149,999 | 70 | 11.0% |
| $150,000 to $199,999 | 12 | 1.9% |
| $200,000+ | 84 | 13.1% |
Family Income by Famaliy Size in Whitesboro
4-person families (208 | 32.6%) account for the highest median family income in Whitesboro with $93,506 per family, while 2-person families (124 | 19.4%) have the highest median income of $38,261 per family member.
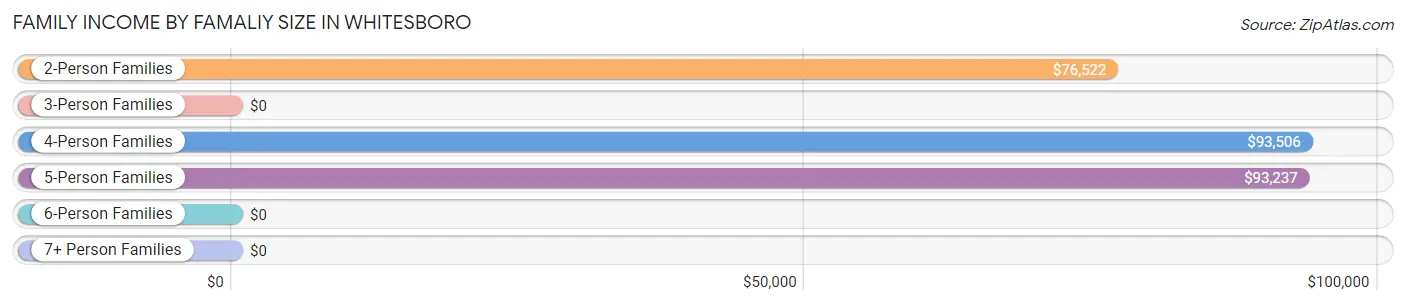
| Income Bracket | # Families | Median Income |
| 2-Person Families | 124 (19.4%) | $76,522 |
| 3-Person Families | 214 (33.5%) | $0 |
| 4-Person Families | 208 (32.6%) | $93,506 |
| 5-Person Families | 55 (8.6%) | $93,237 |
| 6-Person Families | 38 (5.9%) | $0 |
| 7+ Person Families | 0 (0.0%) | $0 |
| Total | 639 (100.0%) | $88,281 |
Family Income by Number of Earners in Whitesboro
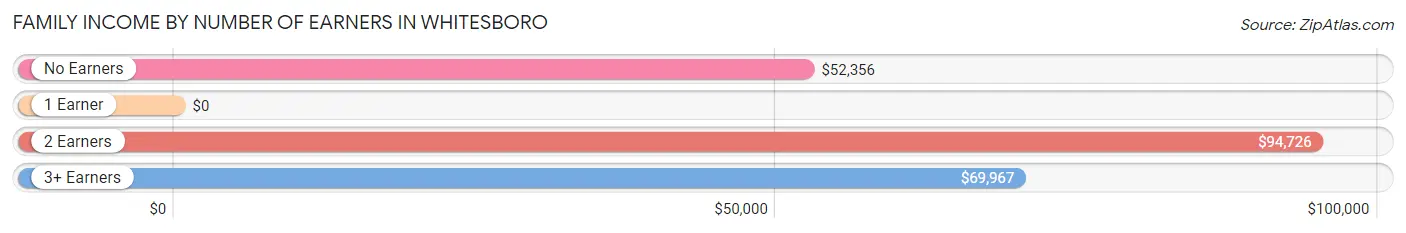
| Number of Earners | # Families | Median Income |
| No Earners | 87 (13.6%) | $52,356 |
| 1 Earner | 261 (40.8%) | $0 |
| 2 Earners | 216 (33.8%) | $94,726 |
| 3+ Earners | 75 (11.7%) | $69,967 |
| Total | 639 (100.0%) | $88,281 |
Household Income in Whitesboro
Household Income Brackets in Whitesboro
With 265 households falling in the category, the $75,000 to $99,999 income range is the most frequent in Whitesboro, accounting for 25.9% of all households.
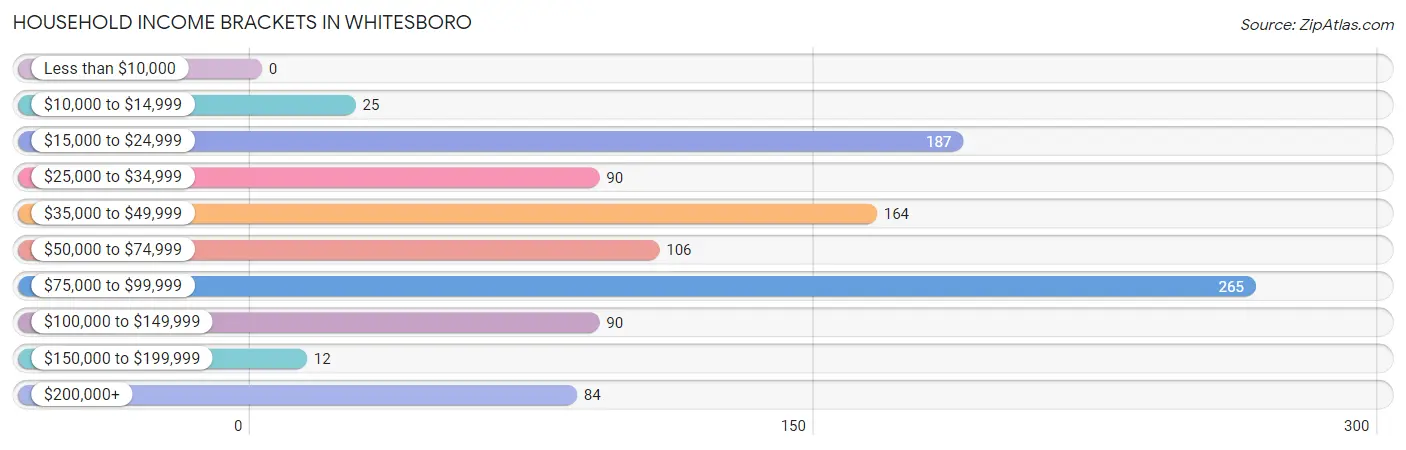
| Income Bracket | # Households | % Households |
| Less than $10,000 | 0 | 0.0% |
| $10,000 to $14,999 | 25 | 2.4% |
| $15,000 to $24,999 | 187 | 18.3% |
| $25,000 to $34,999 | 90 | 8.8% |
| $35,000 to $49,999 | 164 | 16.0% |
| $50,000 to $74,999 | 106 | 10.4% |
| $75,000 to $99,999 | 265 | 25.9% |
| $100,000 to $149,999 | 90 | 8.8% |
| $150,000 to $199,999 | 12 | 1.2% |
| $200,000+ | 84 | 8.2% |
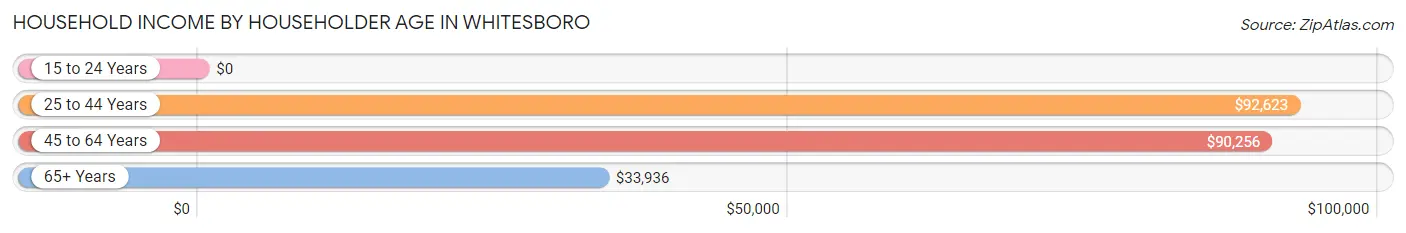
Household Income by Householder Age in Whitesboro
The median household income in Whitesboro is $62,273, with the highest median household income of $92,623 found in the 25 to 44 years age bracket for the primary householder. A total of 416 households (40.6%) fall into this category.
| Income Bracket | # Households | Median Income |
| 15 to 24 Years | 0 (0.0%) | $0 |
| 25 to 44 Years | 416 (40.6%) | $92,623 |
| 45 to 64 Years | 328 (32.0%) | $90,256 |
| 65+ Years | 280 (27.3%) | $33,936 |
| Total | 1,024 (100.0%) | $62,273 |
Poverty in Whitesboro
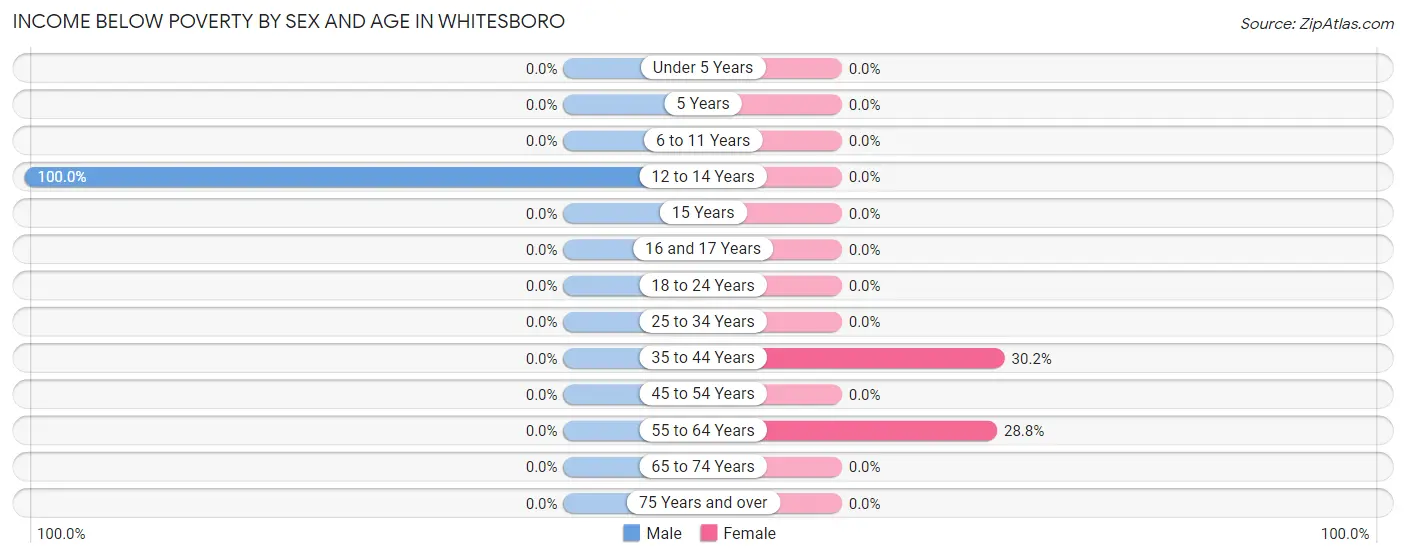
Income Below Poverty by Sex and Age in Whitesboro
With 4.3% poverty level for males and 14.0% for females among the residents of Whitesboro, 12 to 14 year old males and 35 to 44 year old females are the most vulnerable to poverty, with 64 males (100.0%) and 94 females (30.2%) in their respective age groups living below the poverty level.
| Age Bracket | Male | Female |
| Under 5 Years | 0 (0.0%) | 0 (0.0%) |
| 5 Years | 0 (0.0%) | 0 (0.0%) |
| 6 to 11 Years | 0 (0.0%) | 0 (0.0%) |
| 12 to 14 Years | 64 (100.0%) | 0 (0.0%) |
| 15 Years | 0 (0.0%) | 0 (0.0%) |
| 16 and 17 Years | 0 (0.0%) | 0 (0.0%) |
| 18 to 24 Years | 0 (0.0%) | 0 (0.0%) |
| 25 to 34 Years | 0 (0.0%) | 0 (0.0%) |
| 35 to 44 Years | 0 (0.0%) | 94 (30.2%) |
| 45 to 54 Years | 0 (0.0%) | 0 (0.0%) |
| 55 to 64 Years | 0 (0.0%) | 49 (28.8%) |
| 65 to 74 Years | 0 (0.0%) | 0 (0.0%) |
| 75 Years and over | 0 (0.0%) | 0 (0.0%) |
| Total | 64 (4.3%) | 143 (14.0%) |
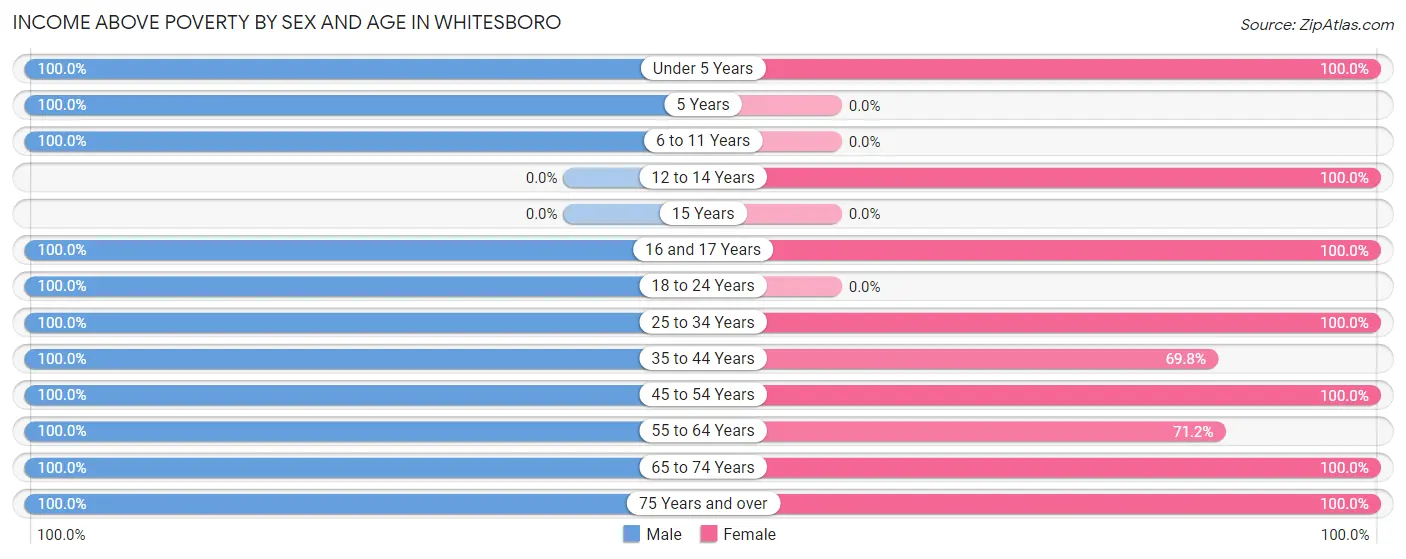
Income Above Poverty by Sex and Age in Whitesboro
According to the poverty statistics in Whitesboro, males aged under 5 years and females aged under 5 years are the age groups that are most secure financially, with 100.0% of males and 100.0% of females in these age groups living above the poverty line.
| Age Bracket | Male | Female |
| Under 5 Years | 108 (100.0%) | 92 (100.0%) |
| 5 Years | 46 (100.0%) | 0 (0.0%) |
| 6 to 11 Years | 231 (100.0%) | 0 (0.0%) |
| 12 to 14 Years | 0 (0.0%) | 58 (100.0%) |
| 15 Years | 0 (0.0%) | 0 (0.0%) |
| 16 and 17 Years | 22 (100.0%) | 24 (100.0%) |
| 18 to 24 Years | 54 (100.0%) | 0 (0.0%) |
| 25 to 34 Years | 285 (100.0%) | 154 (100.0%) |
| 35 to 44 Years | 103 (100.0%) | 217 (69.8%) |
| 45 to 54 Years | 236 (100.0%) | 24 (100.0%) |
| 55 to 64 Years | 168 (100.0%) | 121 (71.2%) |
| 65 to 74 Years | 86 (100.0%) | 95 (100.0%) |
| 75 Years and over | 70 (100.0%) | 96 (100.0%) |
| Total | 1,409 (95.7%) | 881 (86.0%) |
Income Below Poverty Among Married-Couple Families in Whitesboro
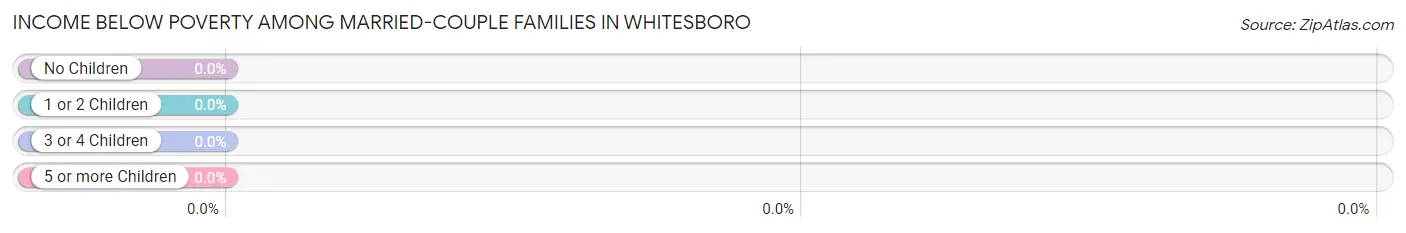
| Children | Above Poverty | Below Poverty |
| No Children | 136 (100.0%) | 0 (0.0%) |
| 1 or 2 Children | 330 (100.0%) | 0 (0.0%) |
| 3 or 4 Children | 39 (100.0%) | 0 (0.0%) |
| 5 or more Children | 0 (0.0%) | 0 (0.0%) |
| Total | 505 (100.0%) | 0 (0.0%) |
Income Below Poverty Among Single-Parent Households in Whitesboro
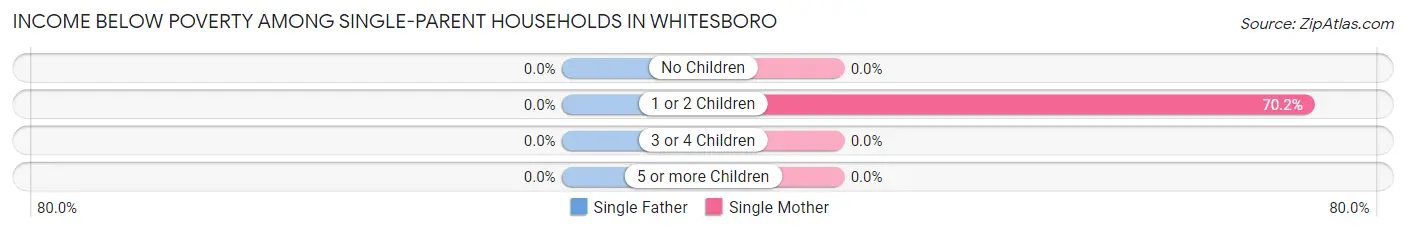
| Children | Single Father | Single Mother |
| No Children | 0 (0.0%) | 0 (0.0%) |
| 1 or 2 Children | 0 (0.0%) | 94 (70.2%) |
| 3 or 4 Children | 0 (0.0%) | 0 (0.0%) |
| 5 or more Children | 0 (0.0%) | 0 (0.0%) |
| Total | 0 (0.0%) | 94 (70.2%) |
Income Below Poverty Among Married-Couple vs Single-Parent Households in Whitesboro
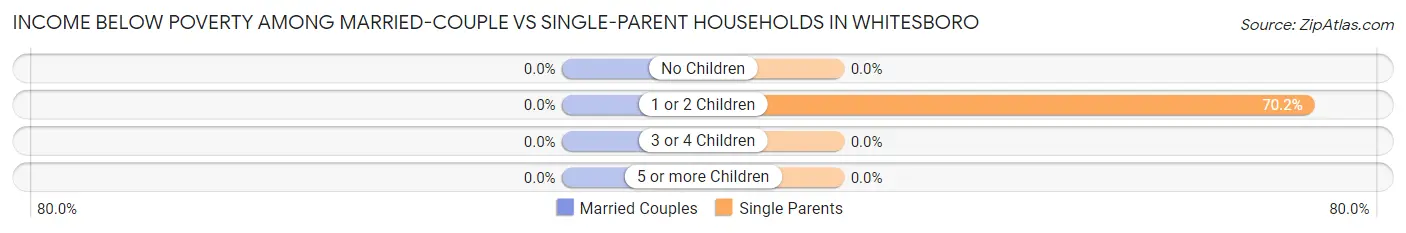
| Children | Married-Couple Families | Single-Parent Households |
| No Children | 0 (0.0%) | 0 (0.0%) |
| 1 or 2 Children | 0 (0.0%) | 94 (70.2%) |
| 3 or 4 Children | 0 (0.0%) | 0 (0.0%) |
| 5 or more Children | 0 (0.0%) | 0 (0.0%) |
| Total | 0 (0.0%) | 94 (70.2%) |
Race in Whitesboro
The most populous races in Whitesboro are White / Caucasian (1,268 | 50.8%), Black / African American (998 | 40.0%), and Hispanic or Latino (626 | 25.1%).
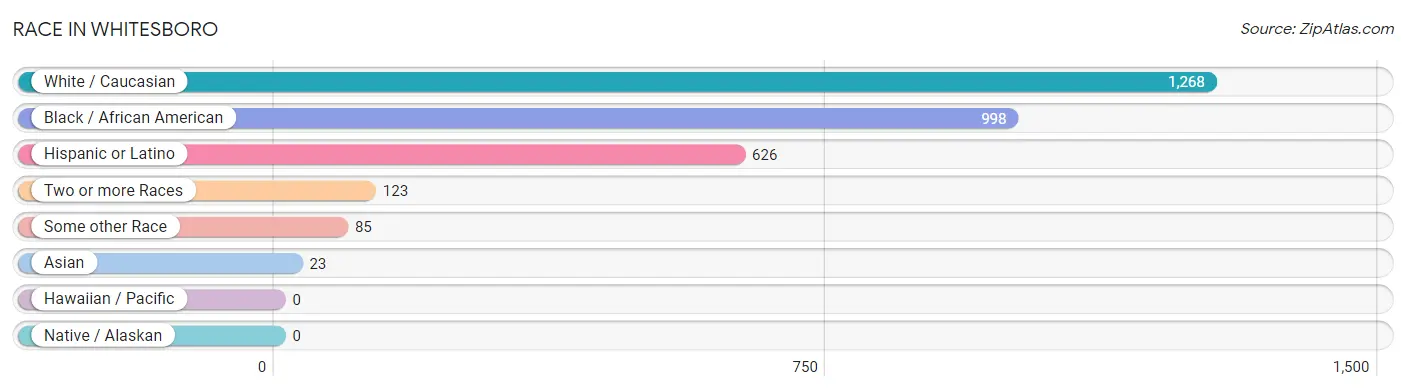
| Race | # Population | % Population |
| Asian | 23 | 0.9% |
| Black / African American | 998 | 40.0% |
| Hawaiian / Pacific | 0 | 0.0% |
| Hispanic or Latino | 626 | 25.1% |
| Native / Alaskan | 0 | 0.0% |
| White / Caucasian | 1,268 | 50.8% |
| Two or more Races | 123 | 4.9% |
| Some other Race | 85 | 3.4% |
| Total | 2,497 | 100.0% |
Ancestry in Whitesboro
The most populous ancestries reported in Whitesboro are Italian (267 | 10.7%), Irish (215 | 8.6%), English (197 | 7.9%), Colombian (178 | 7.1%), and South American (178 | 7.1%), together accounting for 41.5% of all Whitesboro residents.
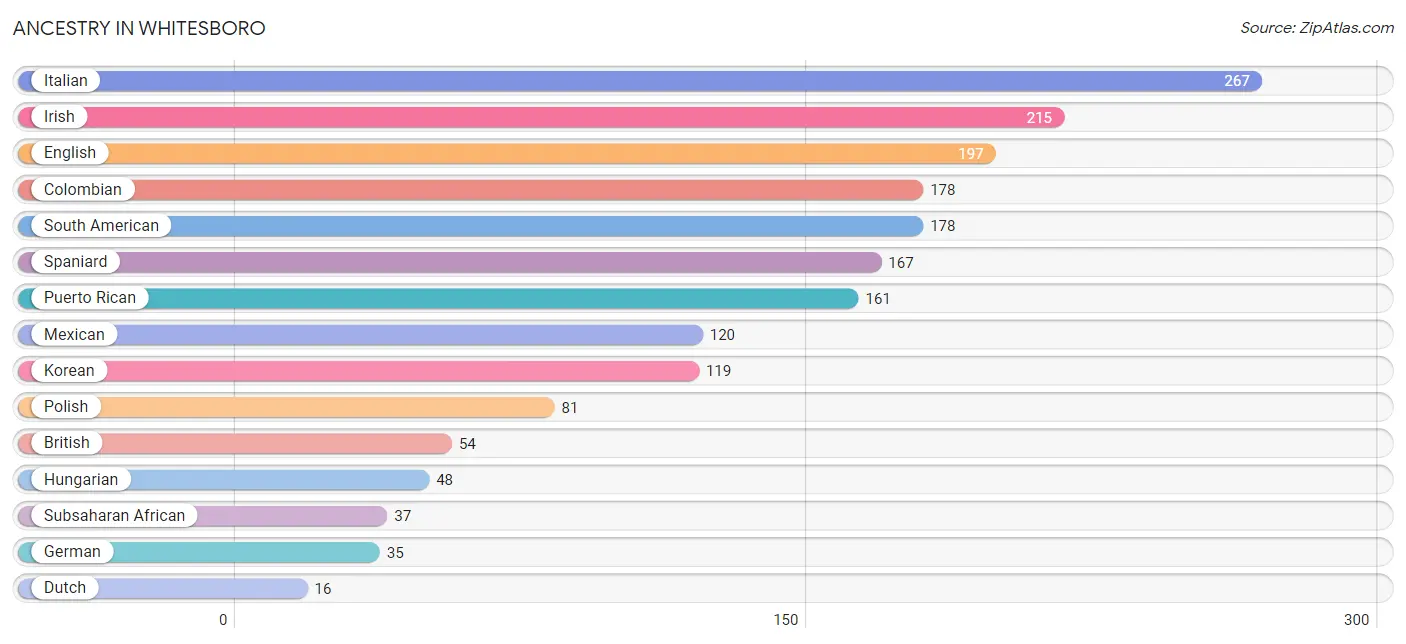
| Ancestry | # Population | % Population |
| British | 54 | 2.2% |
| Colombian | 178 | 7.1% |
| Dutch | 16 | 0.6% |
| English | 197 | 7.9% |
| German | 35 | 1.4% |
| Hungarian | 48 | 1.9% |
| Irish | 215 | 8.6% |
| Italian | 267 | 10.7% |
| Korean | 119 | 4.8% |
| Mexican | 120 | 4.8% |
| Polish | 81 | 3.2% |
| Puerto Rican | 161 | 6.5% |
| South American | 178 | 7.1% |
| Spaniard | 167 | 6.7% |
| Subsaharan African | 37 | 1.5% | View All 15 Rows |
Immigrants in Whitesboro
The most numerous immigrant groups reported in Whitesboro came from Europe (101 | 4.0%), Southern Europe (101 | 4.0%), Spain (101 | 4.0%), Central America (50 | 2.0%), and Latin America (50 | 2.0%), together accounting for 16.1% of all Whitesboro residents.
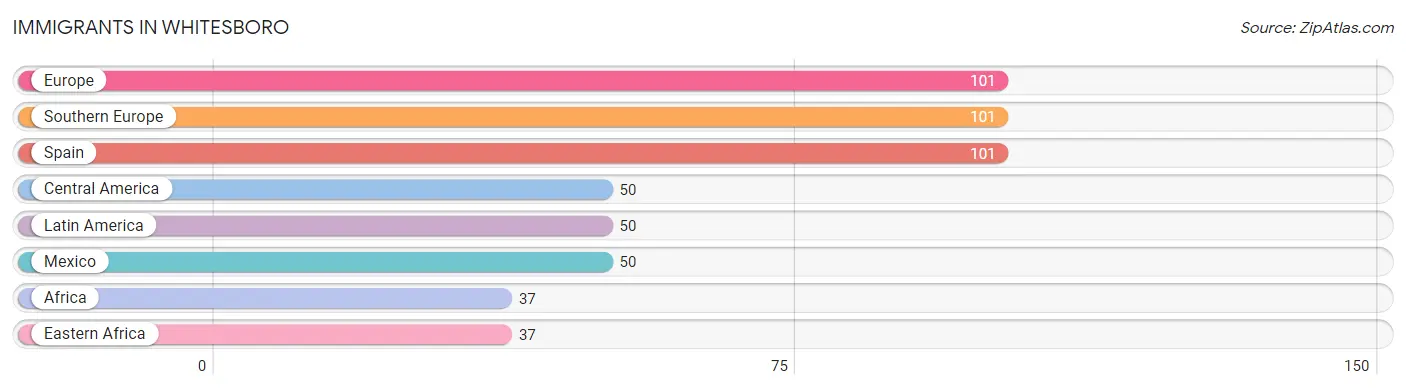
| Immigration Origin | # Population | % Population |
| Africa | 37 | 1.5% |
| Central America | 50 | 2.0% |
| Eastern Africa | 37 | 1.5% |
| Europe | 101 | 4.0% |
| Latin America | 50 | 2.0% |
| Mexico | 50 | 2.0% |
| Southern Europe | 101 | 4.0% |
| Spain | 101 | 4.0% | View All 8 Rows |
Sex and Age in Whitesboro
Sex and Age in Whitesboro
The most populous age groups in Whitesboro are 25 to 29 Years (235 | 16.0%) for men and 40 to 44 Years (179 | 17.5%) for women.
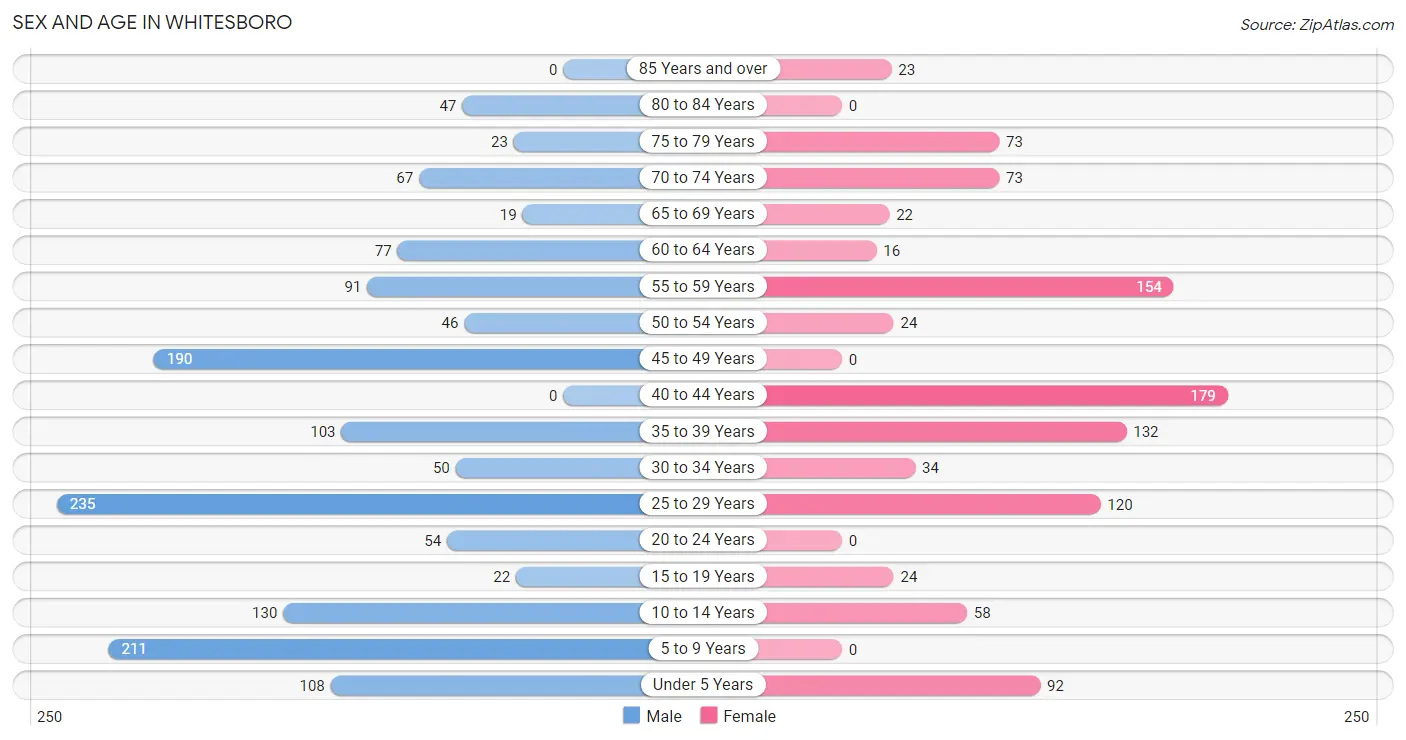
| Age Bracket | Male | Female |
| Under 5 Years | 108 (7.3%) | 92 (9.0%) |
| 5 to 9 Years | 211 (14.3%) | 0 (0.0%) |
| 10 to 14 Years | 130 (8.8%) | 58 (5.7%) |
| 15 to 19 Years | 22 (1.5%) | 24 (2.3%) |
| 20 to 24 Years | 54 (3.7%) | 0 (0.0%) |
| 25 to 29 Years | 235 (16.0%) | 120 (11.7%) |
| 30 to 34 Years | 50 (3.4%) | 34 (3.3%) |
| 35 to 39 Years | 103 (7.0%) | 132 (12.9%) |
| 40 to 44 Years | 0 (0.0%) | 179 (17.5%) |
| 45 to 49 Years | 190 (12.9%) | 0 (0.0%) |
| 50 to 54 Years | 46 (3.1%) | 24 (2.3%) |
| 55 to 59 Years | 91 (6.2%) | 154 (15.0%) |
| 60 to 64 Years | 77 (5.2%) | 16 (1.6%) |
| 65 to 69 Years | 19 (1.3%) | 22 (2.1%) |
| 70 to 74 Years | 67 (4.5%) | 73 (7.1%) |
| 75 to 79 Years | 23 (1.6%) | 73 (7.1%) |
| 80 to 84 Years | 47 (3.2%) | 0 (0.0%) |
| 85 Years and over | 0 (0.0%) | 23 (2.2%) |
| Total | 1,473 (100.0%) | 1,024 (100.0%) |
Families and Households in Whitesboro
Median Family Size in Whitesboro
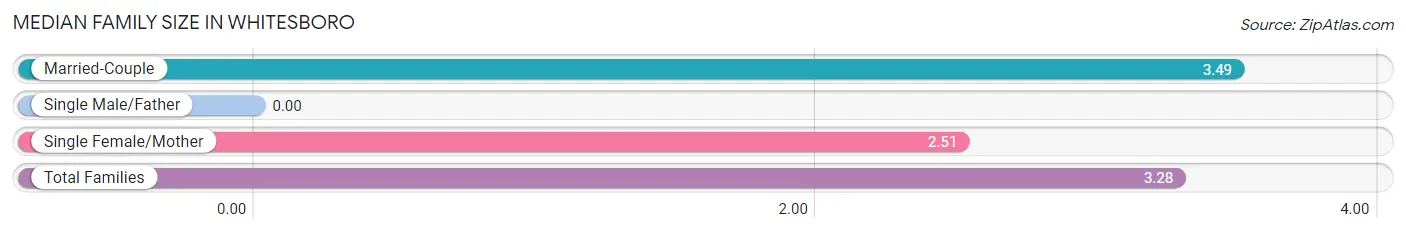
| Family Type | # Families | Family Size |
| Married-Couple | 505 (79.0%) | 3.49 |
| Single Male/Father | 0 (0.0%) | - |
| Single Female/Mother | 134 (21.0%) | 2.51 |
| Total Families | 639 (100.0%) | 3.28 |
Median Household Size in Whitesboro
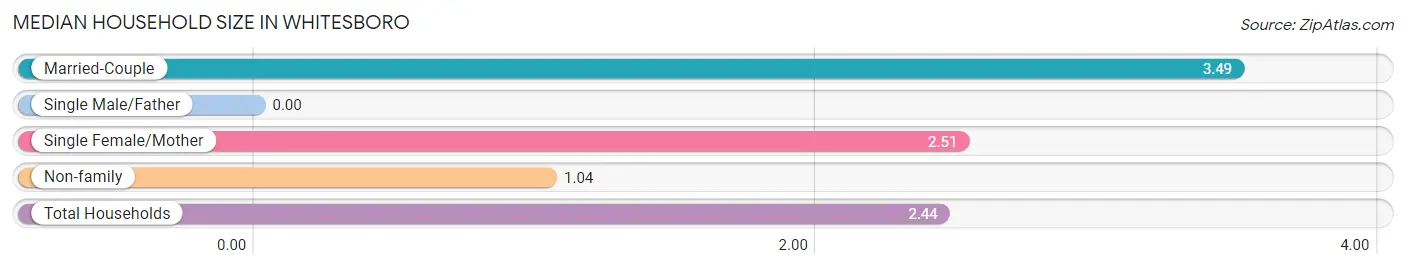
| Household Type | # Households | Household Size |
| Married-Couple | 505 (49.3%) | 3.49 |
| Single Male/Father | 0 (0.0%) | - |
| Single Female/Mother | 134 (13.1%) | 2.51 |
| Non-family | 385 (37.6%) | 1.04 |
| Total Households | 1,024 (100.0%) | 2.44 |
Household Size by Marriage Status in Whitesboro
Out of a total of 1,024 households in Whitesboro, 639 (62.4%) are family households, while 385 (37.6%) are nonfamily households. The most numerous type of family households are 3-person households, comprising 214, and the most common type of nonfamily households are 1-person households, comprising 365.
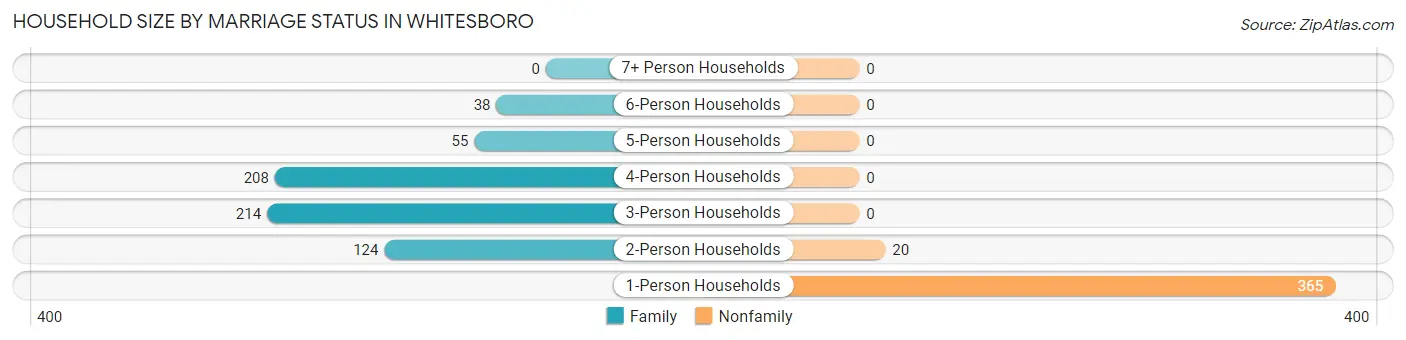
| Household Size | Family Households | Nonfamily Households |
| 1-Person Households | - | 365 (35.6%) |
| 2-Person Households | 124 (12.1%) | 20 (1.9%) |
| 3-Person Households | 214 (20.9%) | 0 (0.0%) |
| 4-Person Households | 208 (20.3%) | 0 (0.0%) |
| 5-Person Households | 55 (5.4%) | 0 (0.0%) |
| 6-Person Households | 38 (3.7%) | 0 (0.0%) |
| 7+ Person Households | 0 (0.0%) | 0 (0.0%) |
| Total | 639 (62.4%) | 385 (37.6%) |
Female Fertility in Whitesboro
Fertility by Age in Whitesboro
| Age Bracket | Women with Births | Births / 1,000 Women |
| 15 to 19 years | 0 (0.0%) | 0.0 |
| 20 to 34 years | 0 (0.0%) | 0.0 |
| 35 to 50 years | 0 (0.0%) | 0.0 |
| Total | 0 (0.0%) | 0.0 |
Fertility by Age by Marriage Status in Whitesboro
| Age Bracket | Married | Unmarried |
| 15 to 19 years | 0 (0.0%) | 0 (0.0%) |
| 20 to 34 years | 0 (0.0%) | 0 (0.0%) |
| 35 to 50 years | 0 (0.0%) | 0 (0.0%) |
| Total | 0 (0.0%) | 0 (0.0%) |
Fertility by Education in Whitesboro
| Educational Attainment | Women with Births | Births / 1,000 Women |
| Less than High School | 0 (0.0%) | 0.0 |
| High School Diploma | 0 (0.0%) | 0.0 |
| College or Associate's Degree | 0 (0.0%) | 0.0 |
| Bachelor's Degree | 0 (0.0%) | 0.0 |
| Graduate Degree | 0 (0.0%) | 0.0 |
| Total | 0 (0.0%) | 0.0 |
Fertility by Education by Marriage Status in Whitesboro
| Educational Attainment | Married | Unmarried |
| Less than High School | 0 (0.0%) | 0 (0.0%) |
| High School Diploma | 0 (0.0%) | 0 (0.0%) |
| College or Associate's Degree | 0 (0.0%) | 0 (0.0%) |
| Bachelor's Degree | 0 (0.0%) | 0 (0.0%) |
| Graduate Degree | 0 (0.0%) | 0 (0.0%) |
| Total | 0 (0.0%) | 0 (0.0%) |
Employment Characteristics in Whitesboro
Employment by Class of Employer in Whitesboro
Among the 999 employed individuals in Whitesboro, private company employees (360 | 36.0%), local government employees (220 | 22.0%), and self-employed (not incorporated) (189 | 18.9%) make up the most common classes of employment.
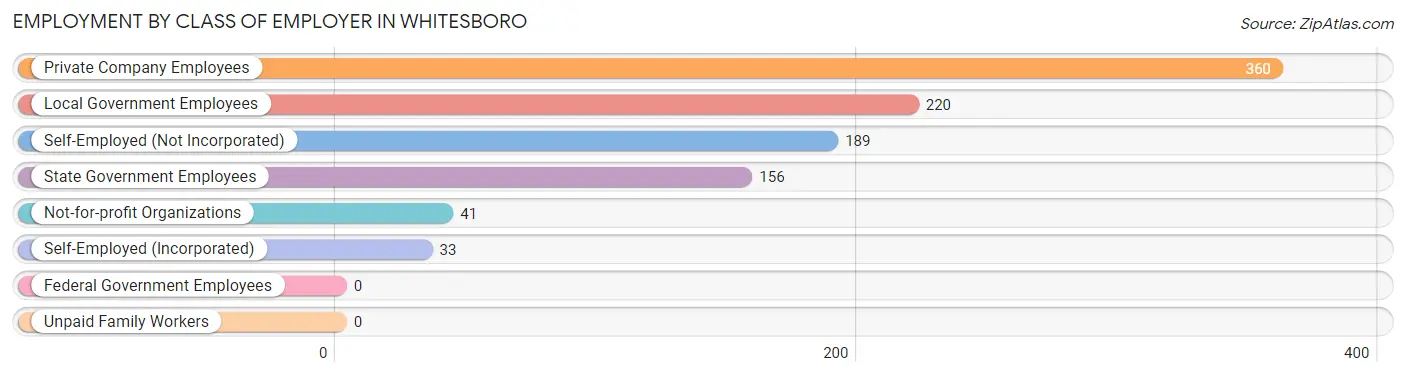
| Employer Class | # Employees | % Employees |
| Private Company Employees | 360 | 36.0% |
| Self-Employed (Incorporated) | 33 | 3.3% |
| Self-Employed (Not Incorporated) | 189 | 18.9% |
| Not-for-profit Organizations | 41 | 4.1% |
| Local Government Employees | 220 | 22.0% |
| State Government Employees | 156 | 15.6% |
| Federal Government Employees | 0 | 0.0% |
| Unpaid Family Workers | 0 | 0.0% |
| Total | 999 | 100.0% |
Employment Status by Age in Whitesboro
According to the labor force statistics for Whitesboro, out of the total population over 16 years of age (1,898), 59.2% or 1,124 individuals are in the labor force, with 9.6% or 108 of them unemployed. The age group with the highest labor force participation rate is 30 to 34 years, with 100.0% or 84 individuals in the labor force. Within the labor force, the 45 to 54 years age range has the highest percentage of unemployed individuals, with 45.8% or 108 of them being unemployed.
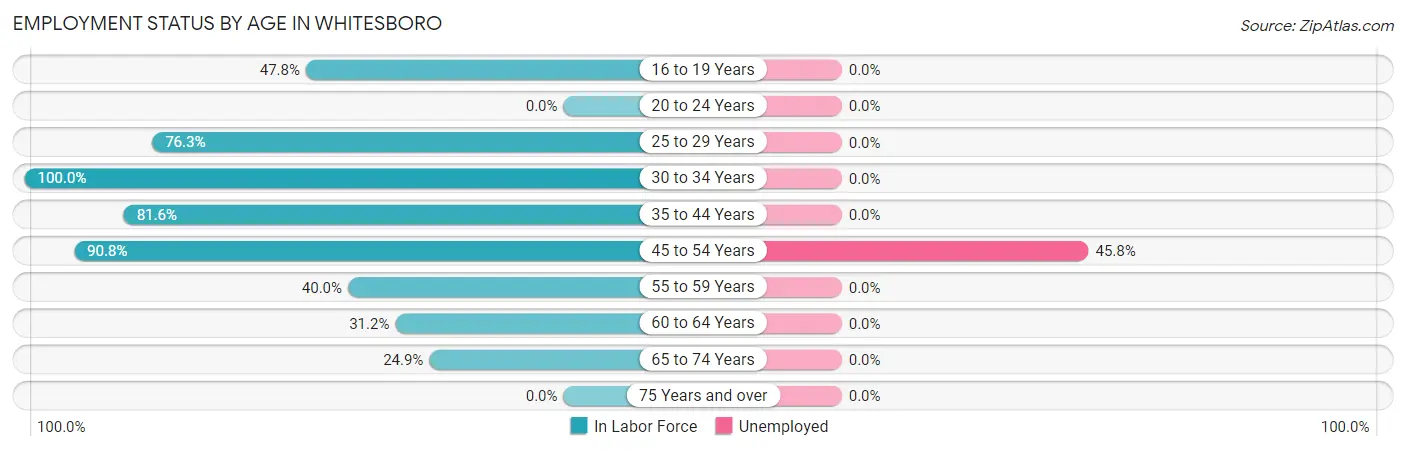
| Age Bracket | In Labor Force | Unemployed |
| 16 to 19 Years | 22 (47.8%) | 0 (0.0%) |
| 20 to 24 Years | 0 (0.0%) | 0 (0.0%) |
| 25 to 29 Years | 271 (76.3%) | 0 (0.0%) |
| 30 to 34 Years | 84 (100.0%) | 0 (0.0%) |
| 35 to 44 Years | 338 (81.6%) | 0 (0.0%) |
| 45 to 54 Years | 236 (90.8%) | 108 (45.8%) |
| 55 to 59 Years | 98 (40.0%) | 0 (0.0%) |
| 60 to 64 Years | 29 (31.2%) | 0 (0.0%) |
| 65 to 74 Years | 45 (24.9%) | 0 (0.0%) |
| 75 Years and over | 0 (0.0%) | 0 (0.0%) |
| Total | 1,124 (59.2%) | 108 (9.6%) |
Employment Status by Educational Attainment in Whitesboro
According to labor force statistics for Whitesboro, 72.8% of individuals (1,056) out of the total population between 25 and 64 years of age (1,451) are in the labor force, with 10.2% or 108 of them being unemployed. The group with the highest labor force participation rate are those with the educational attainment of college / associate degree, with 91.0% or 436 individuals in the labor force. Within the labor force, individuals with college / associate degree education have the highest percentage of unemployment, with 24.8% or 108 of them being unemployed.
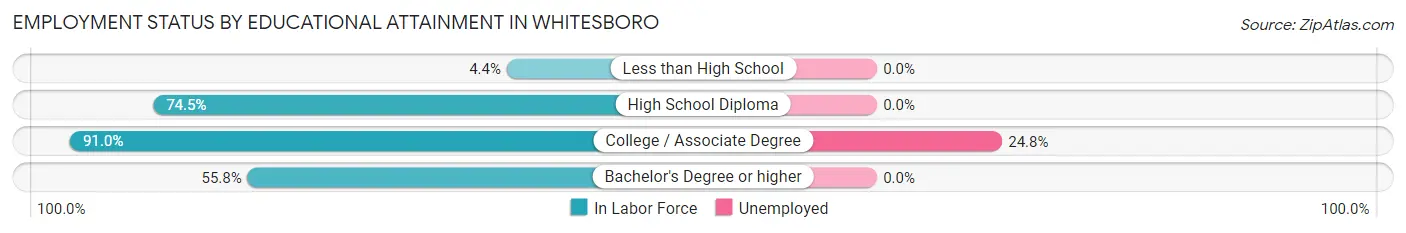
| Educational Attainment | In Labor Force | Unemployed |
| Less than High School | 4 (4.4%) | 0 (0.0%) |
| High School Diploma | 496 (74.5%) | 0 (0.0%) |
| College / Associate Degree | 436 (91.0%) | 119 (24.8%) |
| Bachelor's Degree or higher | 120 (55.8%) | 0 (0.0%) |
| Total | 1,056 (72.8%) | 148 (10.2%) |
Employment Occupations by Sex in Whitesboro
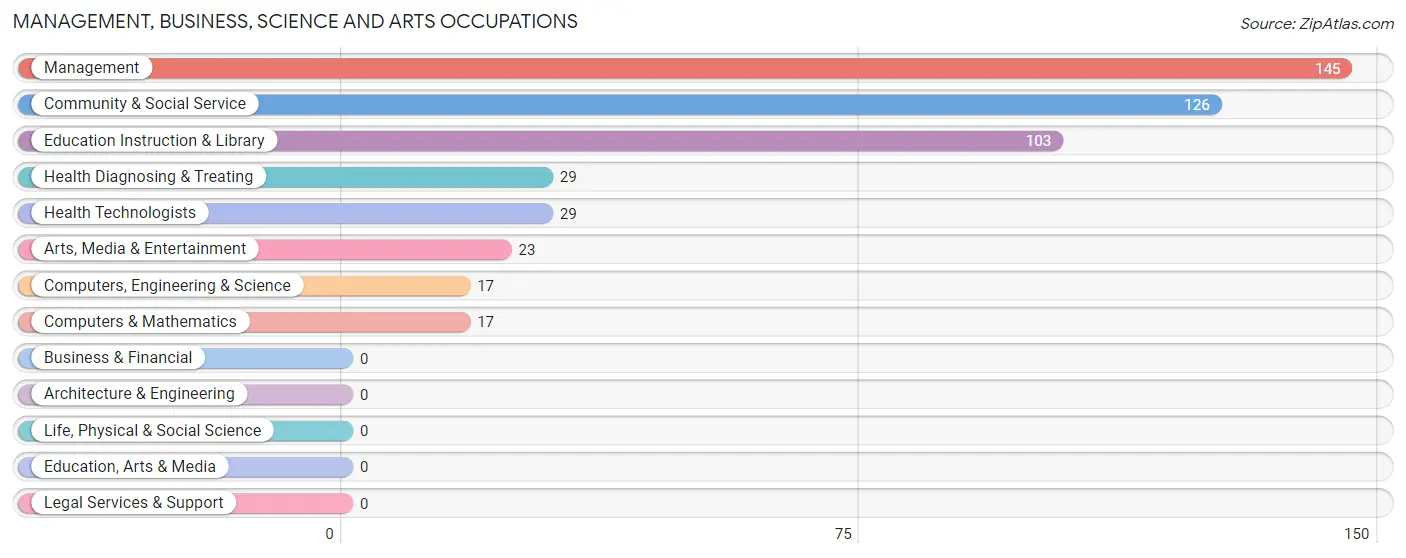
Management, Business, Science and Arts Occupations
The most common Management, Business, Science and Arts occupations in Whitesboro are Management (145 | 14.3%), Community & Social Service (126 | 12.4%), Education Instruction & Library (103 | 10.2%), Health Diagnosing & Treating (29 | 2.9%), and Health Technologists (29 | 2.9%).
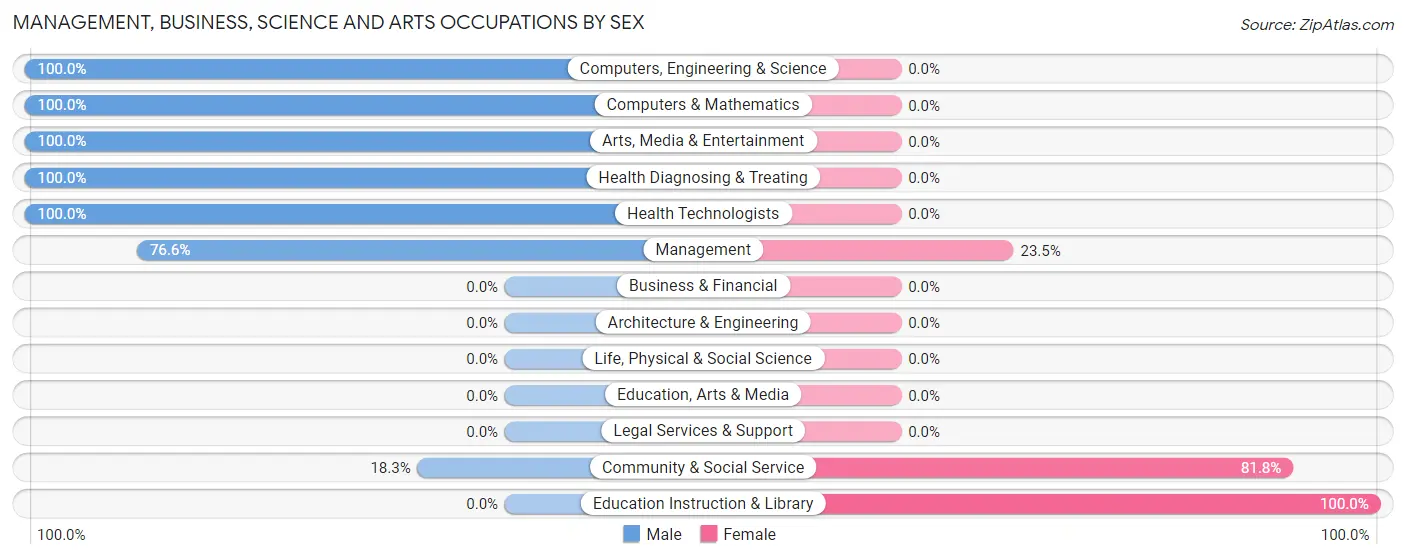
Management, Business, Science and Arts Occupations by Sex
Within the Management, Business, Science and Arts occupations in Whitesboro, the most male-oriented occupations are Computers, Engineering & Science (100.0%), Computers & Mathematics (100.0%), and Arts, Media & Entertainment (100.0%), while the most female-oriented occupations are Education Instruction & Library (100.0%), Community & Social Service (81.8%), and Management (23.4%).
| Occupation | Male | Female |
| Management | 111 (76.5%) | 34 (23.4%) |
| Business & Financial | 0 (0.0%) | 0 (0.0%) |
| Computers, Engineering & Science | 17 (100.0%) | 0 (0.0%) |
| Computers & Mathematics | 17 (100.0%) | 0 (0.0%) |
| Architecture & Engineering | 0 (0.0%) | 0 (0.0%) |
| Life, Physical & Social Science | 0 (0.0%) | 0 (0.0%) |
| Community & Social Service | 23 (18.2%) | 103 (81.8%) |
| Education, Arts & Media | 0 (0.0%) | 0 (0.0%) |
| Legal Services & Support | 0 (0.0%) | 0 (0.0%) |
| Education Instruction & Library | 0 (0.0%) | 103 (100.0%) |
| Arts, Media & Entertainment | 23 (100.0%) | 0 (0.0%) |
| Health Diagnosing & Treating | 29 (100.0%) | 0 (0.0%) |
| Health Technologists | 29 (100.0%) | 0 (0.0%) |
| Total (Category) | 180 (56.8%) | 137 (43.2%) |
| Total (Overall) | 610 (60.1%) | 405 (39.9%) |
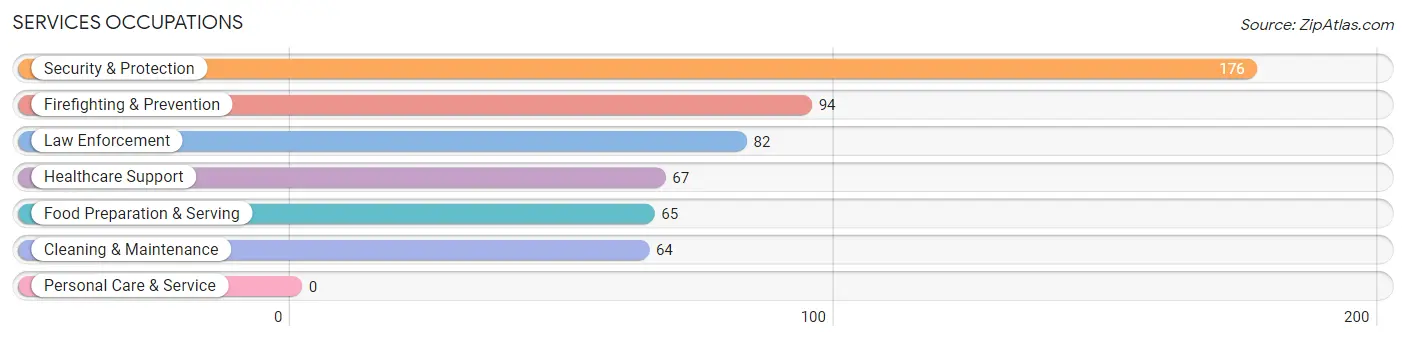
Services Occupations
The most common Services occupations in Whitesboro are Security & Protection (176 | 17.3%), Firefighting & Prevention (94 | 9.3%), Law Enforcement (82 | 8.1%), Healthcare Support (67 | 6.6%), and Food Preparation & Serving (65 | 6.4%).
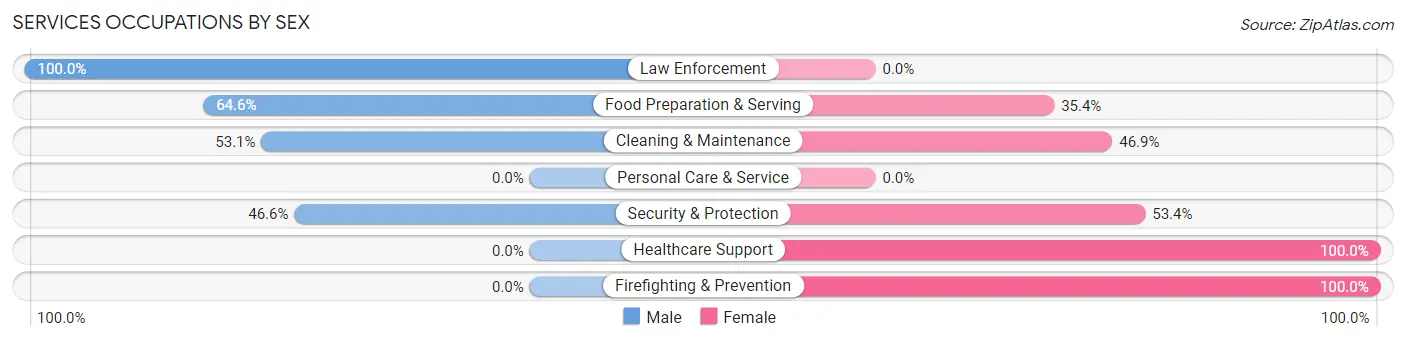
Services Occupations by Sex
Within the Services occupations in Whitesboro, the most male-oriented occupations are Law Enforcement (100.0%), Food Preparation & Serving (64.6%), and Cleaning & Maintenance (53.1%), while the most female-oriented occupations are Healthcare Support (100.0%), Firefighting & Prevention (100.0%), and Security & Protection (53.4%).
| Occupation | Male | Female |
| Healthcare Support | 0 (0.0%) | 67 (100.0%) |
| Security & Protection | 82 (46.6%) | 94 (53.4%) |
| Firefighting & Prevention | 0 (0.0%) | 94 (100.0%) |
| Law Enforcement | 82 (100.0%) | 0 (0.0%) |
| Food Preparation & Serving | 42 (64.6%) | 23 (35.4%) |
| Cleaning & Maintenance | 34 (53.1%) | 30 (46.9%) |
| Personal Care & Service | 0 (0.0%) | 0 (0.0%) |
| Total (Category) | 158 (42.5%) | 214 (57.5%) |
| Total (Overall) | 610 (60.1%) | 405 (39.9%) |
Sales and Office Occupations
The most common Sales and Office occupations in Whitesboro are Sales & Related (22 | 2.2%), and Office & Administration (12 | 1.2%).
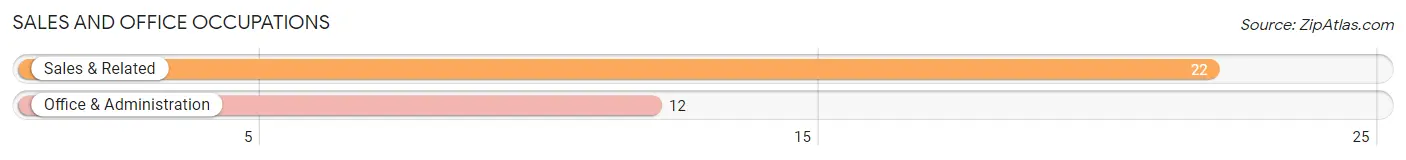
Sales and Office Occupations by Sex
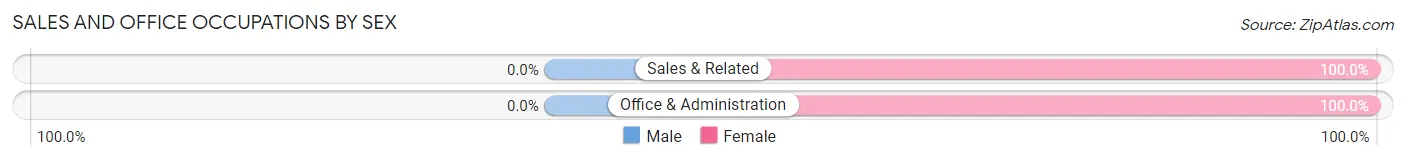
| Occupation | Male | Female |
| Sales & Related | 0 (0.0%) | 22 (100.0%) |
| Office & Administration | 0 (0.0%) | 12 (100.0%) |
| Total (Category) | 0 (0.0%) | 34 (100.0%) |
| Total (Overall) | 610 (60.1%) | 405 (39.9%) |
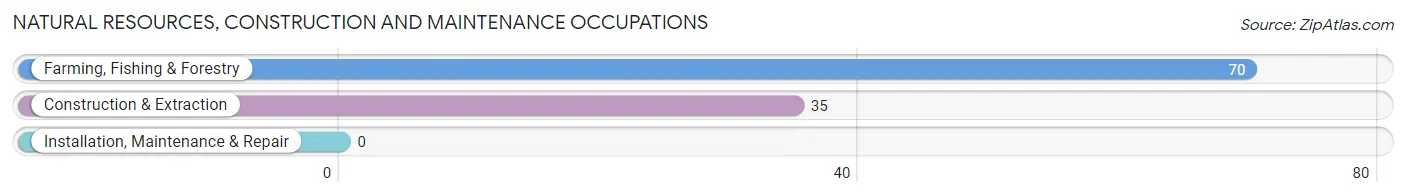
Natural Resources, Construction and Maintenance Occupations
The most common Natural Resources, Construction and Maintenance occupations in Whitesboro are Farming, Fishing & Forestry (70 | 6.9%), and Construction & Extraction (35 | 3.5%).
Natural Resources, Construction and Maintenance Occupations by Sex
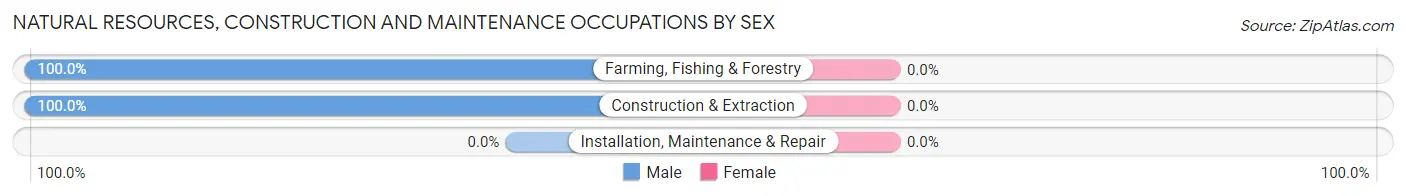
| Occupation | Male | Female |
| Farming, Fishing & Forestry | 70 (100.0%) | 0 (0.0%) |
| Construction & Extraction | 35 (100.0%) | 0 (0.0%) |
| Installation, Maintenance & Repair | 0 (0.0%) | 0 (0.0%) |
| Total (Category) | 105 (100.0%) | 0 (0.0%) |
| Total (Overall) | 610 (60.1%) | 405 (39.9%) |
Production, Transportation and Moving Occupations
The most common Production, Transportation and Moving occupations in Whitesboro are Transportation (151 | 14.9%), and Production (36 | 3.5%).
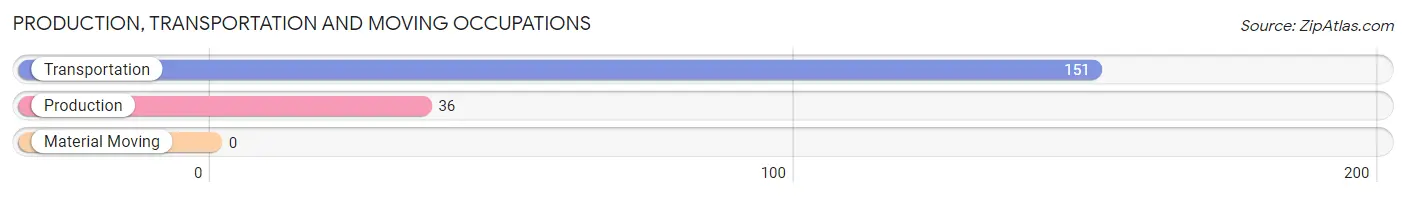
Production, Transportation and Moving Occupations by Sex
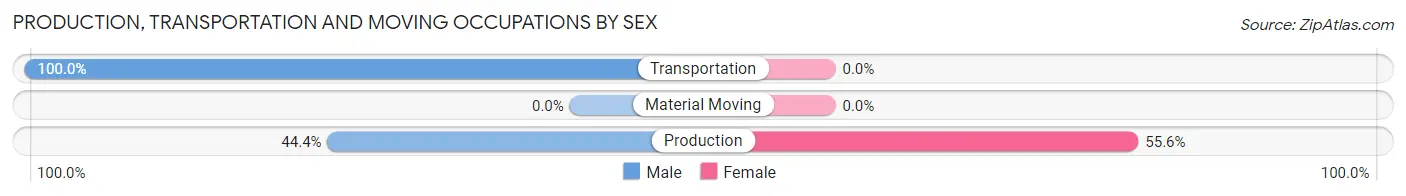
| Occupation | Male | Female |
| Production | 16 (44.4%) | 20 (55.6%) |
| Transportation | 151 (100.0%) | 0 (0.0%) |
| Material Moving | 0 (0.0%) | 0 (0.0%) |
| Total (Category) | 167 (89.3%) | 20 (10.7%) |
| Total (Overall) | 610 (60.1%) | 405 (39.9%) |
Employment Industries by Sex in Whitesboro
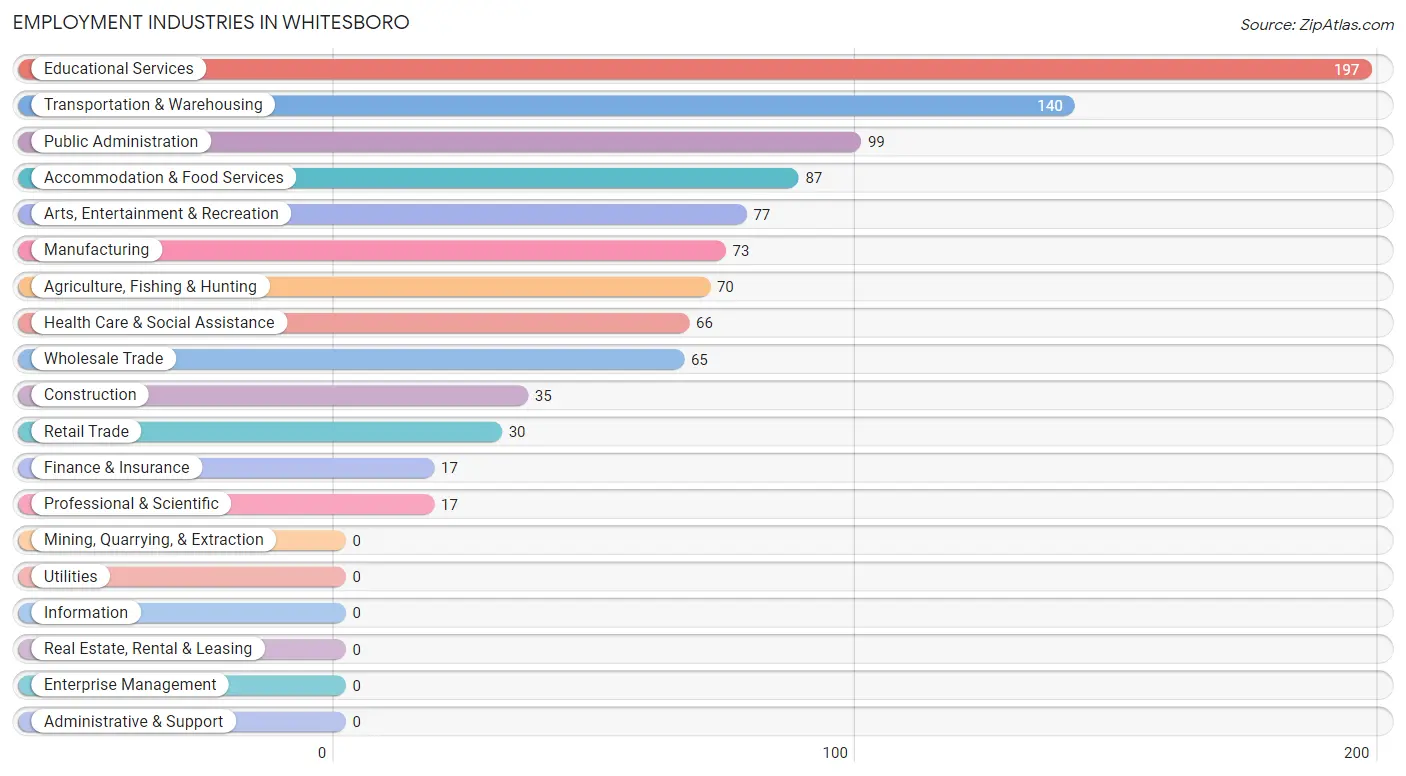
Employment Industries in Whitesboro
The major employment industries in Whitesboro include Educational Services (197 | 19.4%), Transportation & Warehousing (140 | 13.8%), Public Administration (99 | 9.8%), Accommodation & Food Services (87 | 8.6%), and Arts, Entertainment & Recreation (77 | 7.6%).
Employment Industries by Sex in Whitesboro
The Whitesboro industries that see more men than women are Agriculture, Fishing & Hunting (100.0%), Construction (100.0%), and Manufacturing (100.0%), whereas the industries that tend to have a higher number of women are Retail Trade (100.0%), Finance & Insurance (100.0%), and Professional & Scientific (100.0%).
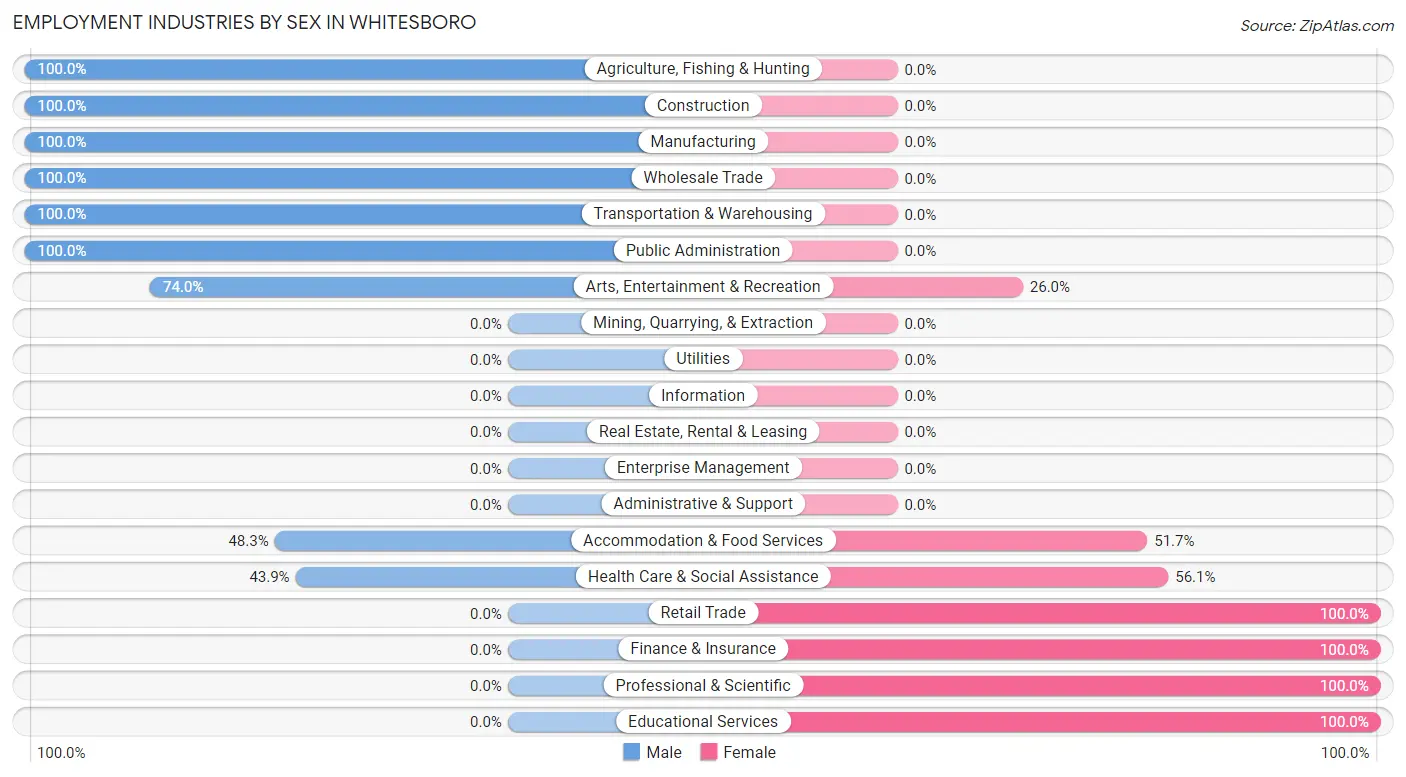
| Industry | Male | Female |
| Agriculture, Fishing & Hunting | 70 (100.0%) | 0 (0.0%) |
| Mining, Quarrying, & Extraction | 0 (0.0%) | 0 (0.0%) |
| Construction | 35 (100.0%) | 0 (0.0%) |
| Manufacturing | 73 (100.0%) | 0 (0.0%) |
| Wholesale Trade | 65 (100.0%) | 0 (0.0%) |
| Retail Trade | 0 (0.0%) | 30 (100.0%) |
| Transportation & Warehousing | 140 (100.0%) | 0 (0.0%) |
| Utilities | 0 (0.0%) | 0 (0.0%) |
| Information | 0 (0.0%) | 0 (0.0%) |
| Finance & Insurance | 0 (0.0%) | 17 (100.0%) |
| Real Estate, Rental & Leasing | 0 (0.0%) | 0 (0.0%) |
| Professional & Scientific | 0 (0.0%) | 17 (100.0%) |
| Enterprise Management | 0 (0.0%) | 0 (0.0%) |
| Administrative & Support | 0 (0.0%) | 0 (0.0%) |
| Educational Services | 0 (0.0%) | 197 (100.0%) |
| Health Care & Social Assistance | 29 (43.9%) | 37 (56.1%) |
| Arts, Entertainment & Recreation | 57 (74.0%) | 20 (26.0%) |
| Accommodation & Food Services | 42 (48.3%) | 45 (51.7%) |
| Public Administration | 99 (100.0%) | 0 (0.0%) |
| Total | 610 (60.1%) | 405 (39.9%) |
Education in Whitesboro
School Enrollment in Whitesboro
The most common levels of schooling among the 570 students in Whitesboro are middle school (188 | 33.0%), elementary school (137 | 24.0%), and college / undergraduate (77 | 13.5%).
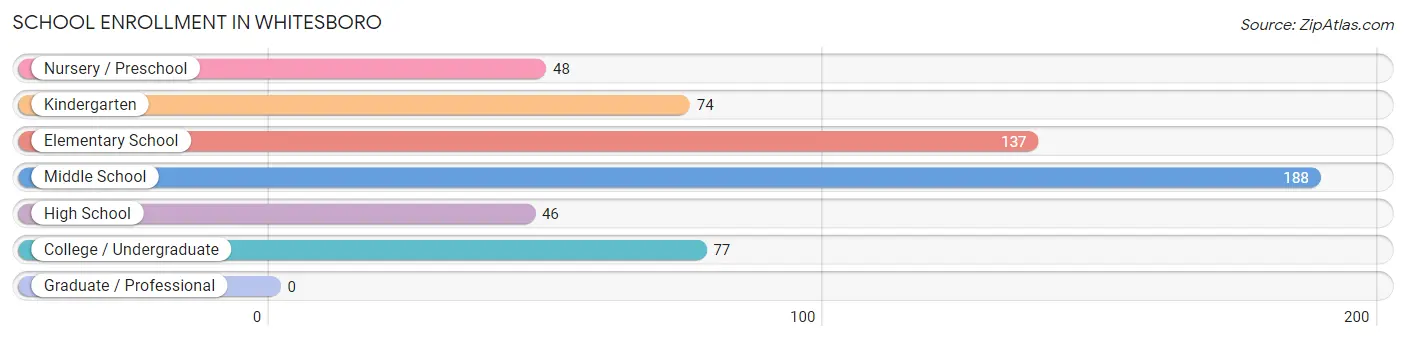
| School Level | # Students | % Students |
| Nursery / Preschool | 48 | 8.4% |
| Kindergarten | 74 | 13.0% |
| Elementary School | 137 | 24.0% |
| Middle School | 188 | 33.0% |
| High School | 46 | 8.1% |
| College / Undergraduate | 77 | 13.5% |
| Graduate / Professional | 0 | 0.0% |
| Total | 570 | 100.0% |
School Enrollment by Age by Funding Source in Whitesboro
Out of a total of 570 students who are enrolled in schools in Whitesboro, 23 (4.0%) attend a private institution, while the remaining 547 (96.0%) are enrolled in public schools. The age group of 25 to 34 year olds has the highest likelihood of being enrolled in private schools, with 23 (100.0% in the age bracket) enrolled. Conversely, the age group of 3 to 4 year olds has the lowest likelihood of being enrolled in a private school, with 48 (100.0% in the age bracket) attending a public institution.
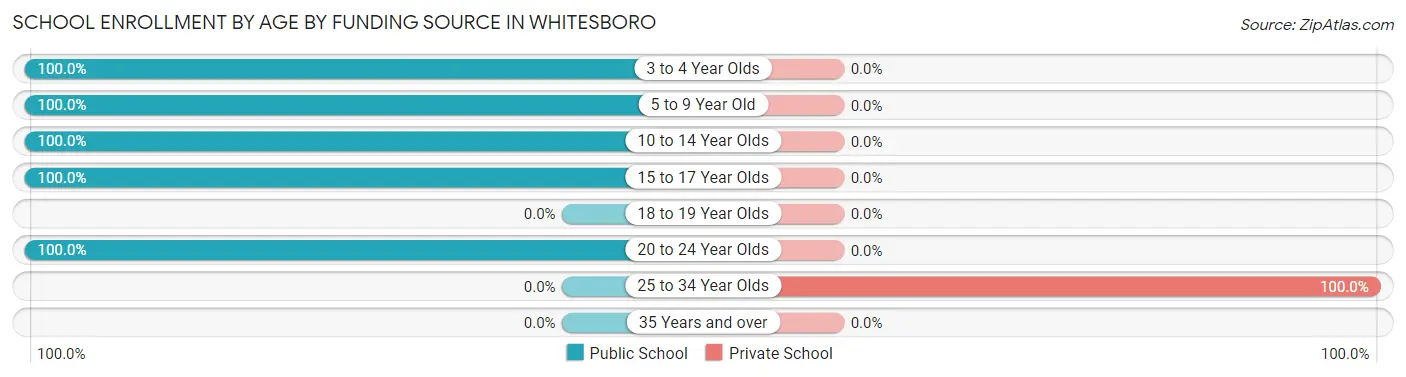
| Age Bracket | Public School | Private School |
| 3 to 4 Year Olds | 48 (100.0%) | 0 (0.0%) |
| 5 to 9 Year Old | 211 (100.0%) | 0 (0.0%) |
| 10 to 14 Year Olds | 188 (100.0%) | 0 (0.0%) |
| 15 to 17 Year Olds | 46 (100.0%) | 0 (0.0%) |
| 18 to 19 Year Olds | 0 (0.0%) | 0 (0.0%) |
| 20 to 24 Year Olds | 54 (100.0%) | 0 (0.0%) |
| 25 to 34 Year Olds | 0 (0.0%) | 23 (100.0%) |
| 35 Years and over | 0 (0.0%) | 0 (0.0%) |
| Total | 547 (96.0%) | 23 (4.0%) |
Educational Attainment by Field of Study in Whitesboro
Business (95 | 39.9%), education (88 | 37.0%), literature & languages (23 | 9.7%), computers & mathematics (20 | 8.4%), and social sciences (12 | 5.0%) are the most common fields of study among 238 individuals in Whitesboro who have obtained a bachelor's degree or higher.
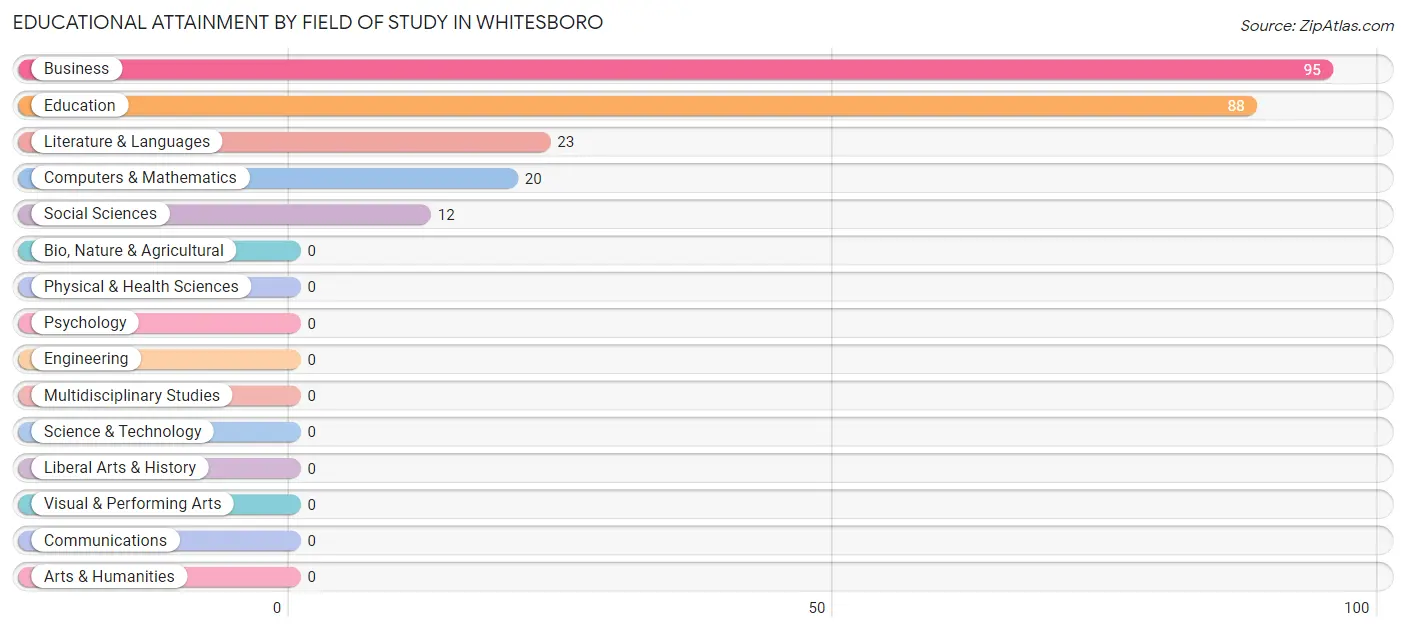
| Field of Study | # Graduates | % Graduates |
| Computers & Mathematics | 20 | 8.4% |
| Bio, Nature & Agricultural | 0 | 0.0% |
| Physical & Health Sciences | 0 | 0.0% |
| Psychology | 0 | 0.0% |
| Social Sciences | 12 | 5.0% |
| Engineering | 0 | 0.0% |
| Multidisciplinary Studies | 0 | 0.0% |
| Science & Technology | 0 | 0.0% |
| Business | 95 | 39.9% |
| Education | 88 | 37.0% |
| Literature & Languages | 23 | 9.7% |
| Liberal Arts & History | 0 | 0.0% |
| Visual & Performing Arts | 0 | 0.0% |
| Communications | 0 | 0.0% |
| Arts & Humanities | 0 | 0.0% |
| Total | 238 | 100.0% |
Transportation & Commute in Whitesboro
Vehicle Availability by Sex in Whitesboro
The most prevalent vehicle ownership categories in Whitesboro are males with 2 vehicles (310, accounting for 52.2%) and females with 2 vehicles (288, making up 76.5%).
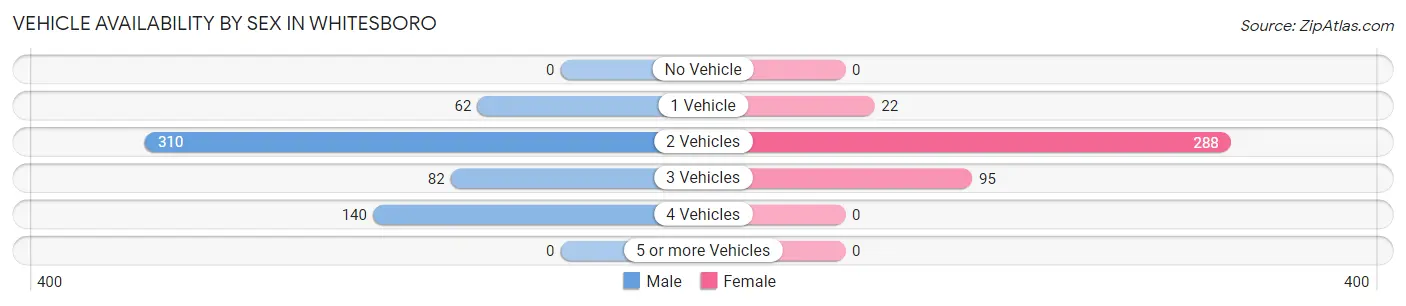
| Vehicles Available | Male | Female |
| No Vehicle | 0 (0.0%) | 0 (0.0%) |
| 1 Vehicle | 62 (10.4%) | 22 (5.4%) |
| 2 Vehicles | 310 (52.2%) | 288 (71.1%) |
| 3 Vehicles | 82 (13.8%) | 95 (23.5%) |
| 4 Vehicles | 140 (23.6%) | 0 (0.0%) |
| 5 or more Vehicles | 0 (0.0%) | 0 (0.0%) |
| Total | 594 (100.0%) | 405 (100.0%) |
Commute Time in Whitesboro
The most frequently occuring commute durations in Whitesboro are 15 to 19 minutes (215 commuters, 22.3%), 5 to 9 minutes (176 commuters, 18.2%), and 20 to 24 minutes (147 commuters, 15.2%).
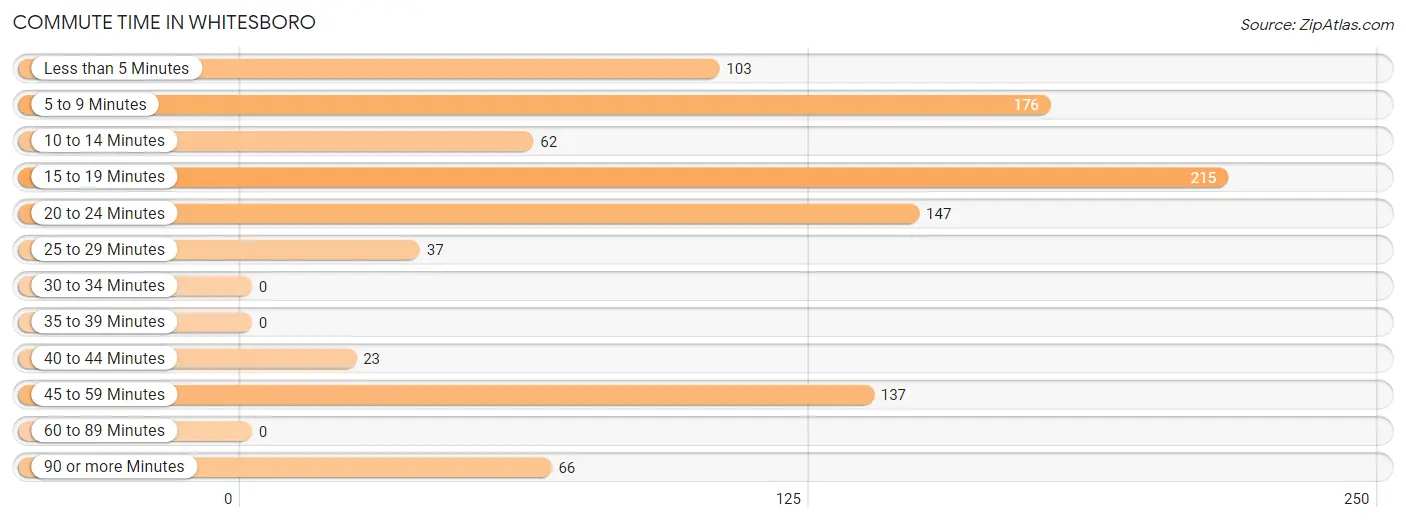
| Commute Time | # Commuters | % Commuters |
| Less than 5 Minutes | 103 | 10.7% |
| 5 to 9 Minutes | 176 | 18.2% |
| 10 to 14 Minutes | 62 | 6.4% |
| 15 to 19 Minutes | 215 | 22.3% |
| 20 to 24 Minutes | 147 | 15.2% |
| 25 to 29 Minutes | 37 | 3.8% |
| 30 to 34 Minutes | 0 | 0.0% |
| 35 to 39 Minutes | 0 | 0.0% |
| 40 to 44 Minutes | 23 | 2.4% |
| 45 to 59 Minutes | 137 | 14.2% |
| 60 to 89 Minutes | 0 | 0.0% |
| 90 or more Minutes | 66 | 6.8% |
Commute Time by Sex in Whitesboro
The most common commute times in Whitesboro are 15 to 19 minutes (215 commuters, 36.2%) for males and 5 to 9 minutes (130 commuters, 34.9%) for females.
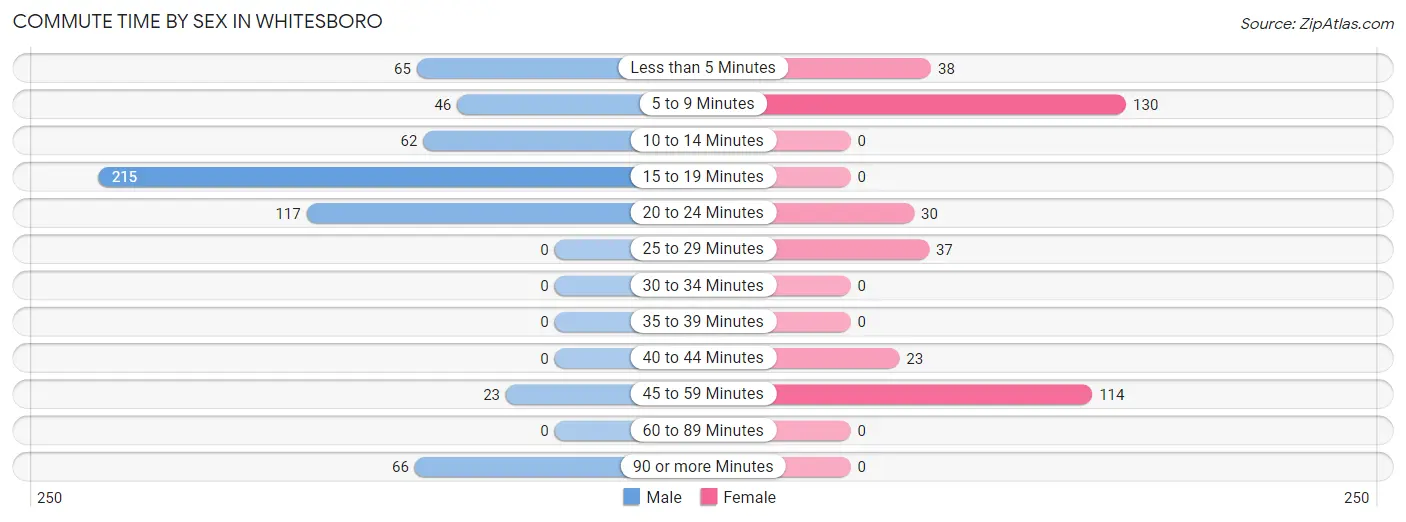
| Commute Time | Male | Female |
| Less than 5 Minutes | 65 (10.9%) | 38 (10.2%) |
| 5 to 9 Minutes | 46 (7.7%) | 130 (34.9%) |
| 10 to 14 Minutes | 62 (10.4%) | 0 (0.0%) |
| 15 to 19 Minutes | 215 (36.2%) | 0 (0.0%) |
| 20 to 24 Minutes | 117 (19.7%) | 30 (8.1%) |
| 25 to 29 Minutes | 0 (0.0%) | 37 (10.0%) |
| 30 to 34 Minutes | 0 (0.0%) | 0 (0.0%) |
| 35 to 39 Minutes | 0 (0.0%) | 0 (0.0%) |
| 40 to 44 Minutes | 0 (0.0%) | 23 (6.2%) |
| 45 to 59 Minutes | 23 (3.9%) | 114 (30.6%) |
| 60 to 89 Minutes | 0 (0.0%) | 0 (0.0%) |
| 90 or more Minutes | 66 (11.1%) | 0 (0.0%) |
Time of Departure to Work by Sex in Whitesboro
The most frequent times of departure to work in Whitesboro are 6:30 AM to 6:59 AM (205, 34.5%) for males and 6:00 AM to 6:29 AM (149, 40.1%) for females.
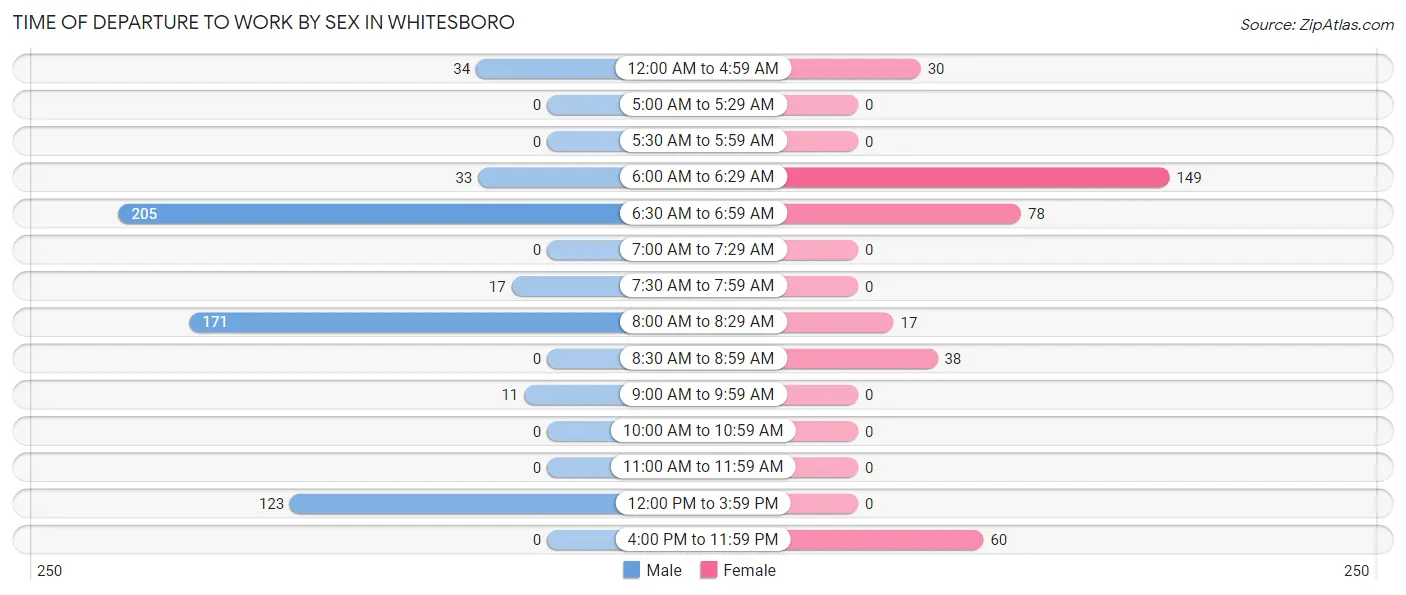
| Time of Departure | Male | Female |
| 12:00 AM to 4:59 AM | 34 (5.7%) | 30 (8.1%) |
| 5:00 AM to 5:29 AM | 0 (0.0%) | 0 (0.0%) |
| 5:30 AM to 5:59 AM | 0 (0.0%) | 0 (0.0%) |
| 6:00 AM to 6:29 AM | 33 (5.6%) | 149 (40.1%) |
| 6:30 AM to 6:59 AM | 205 (34.5%) | 78 (21.0%) |
| 7:00 AM to 7:29 AM | 0 (0.0%) | 0 (0.0%) |
| 7:30 AM to 7:59 AM | 17 (2.9%) | 0 (0.0%) |
| 8:00 AM to 8:29 AM | 171 (28.8%) | 17 (4.6%) |
| 8:30 AM to 8:59 AM | 0 (0.0%) | 38 (10.2%) |
| 9:00 AM to 9:59 AM | 11 (1.8%) | 0 (0.0%) |
| 10:00 AM to 10:59 AM | 0 (0.0%) | 0 (0.0%) |
| 11:00 AM to 11:59 AM | 0 (0.0%) | 0 (0.0%) |
| 12:00 PM to 3:59 PM | 123 (20.7%) | 0 (0.0%) |
| 4:00 PM to 11:59 PM | 0 (0.0%) | 60 (16.1%) |
| Total | 594 (100.0%) | 372 (100.0%) |
Housing Occupancy in Whitesboro
Occupancy by Ownership in Whitesboro
Of the total 1,024 dwellings in Whitesboro, owner-occupied units account for 911 (89.0%), while renter-occupied units make up 113 (11.0%).
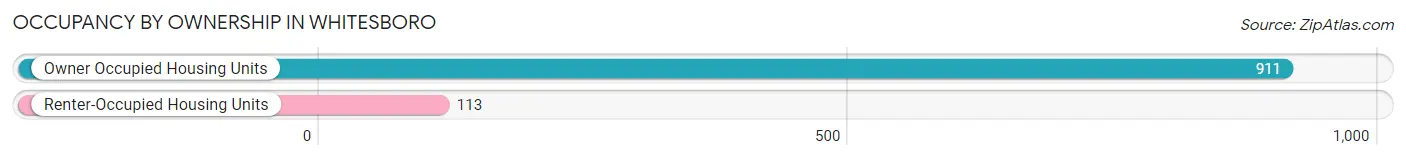
| Occupancy | # Housing Units | % Housing Units |
| Owner Occupied Housing Units | 911 | 89.0% |
| Renter-Occupied Housing Units | 113 | 11.0% |
| Total Occupied Housing Units | 1,024 | 100.0% |
Occupancy by Household Size in Whitesboro
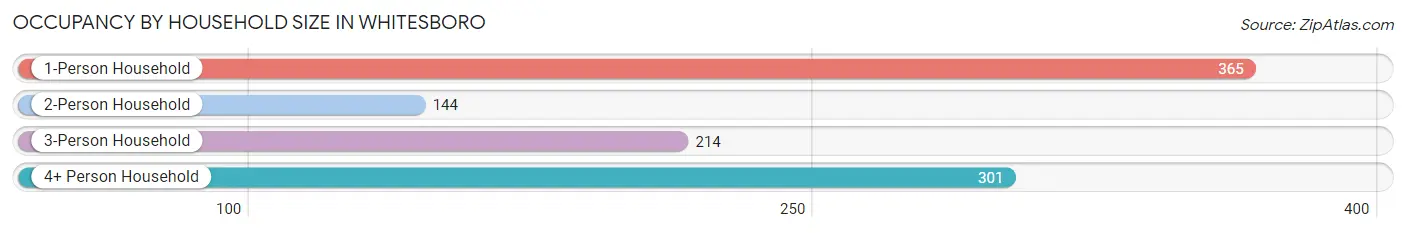
| Household Size | # Housing Units | % Housing Units |
| 1-Person Household | 365 | 35.6% |
| 2-Person Household | 144 | 14.1% |
| 3-Person Household | 214 | 20.9% |
| 4+ Person Household | 301 | 29.4% |
| Total Housing Units | 1,024 | 100.0% |
Occupancy by Ownership by Household Size in Whitesboro
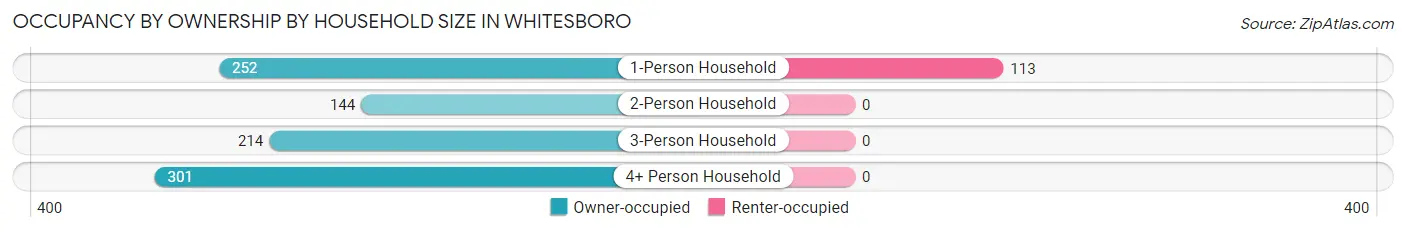
| Household Size | Owner-occupied | Renter-occupied |
| 1-Person Household | 252 (69.0%) | 113 (31.0%) |
| 2-Person Household | 144 (100.0%) | 0 (0.0%) |
| 3-Person Household | 214 (100.0%) | 0 (0.0%) |
| 4+ Person Household | 301 (100.0%) | 0 (0.0%) |
| Total Housing Units | 911 (89.0%) | 113 (11.0%) |
Occupancy by Educational Attainment in Whitesboro
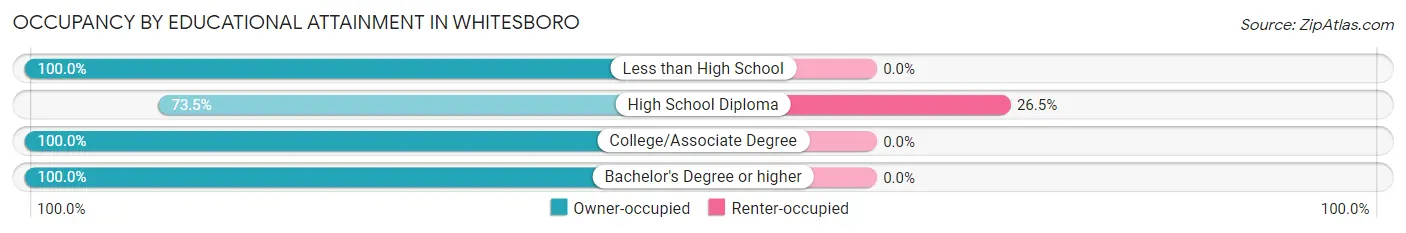
| Household Size | Owner-occupied | Renter-occupied |
| Less than High School | 61 (100.0%) | 0 (0.0%) |
| High School Diploma | 313 (73.5%) | 113 (26.5%) |
| College/Associate Degree | 367 (100.0%) | 0 (0.0%) |
| Bachelor's Degree or higher | 170 (100.0%) | 0 (0.0%) |
Occupancy by Age of Householder in Whitesboro
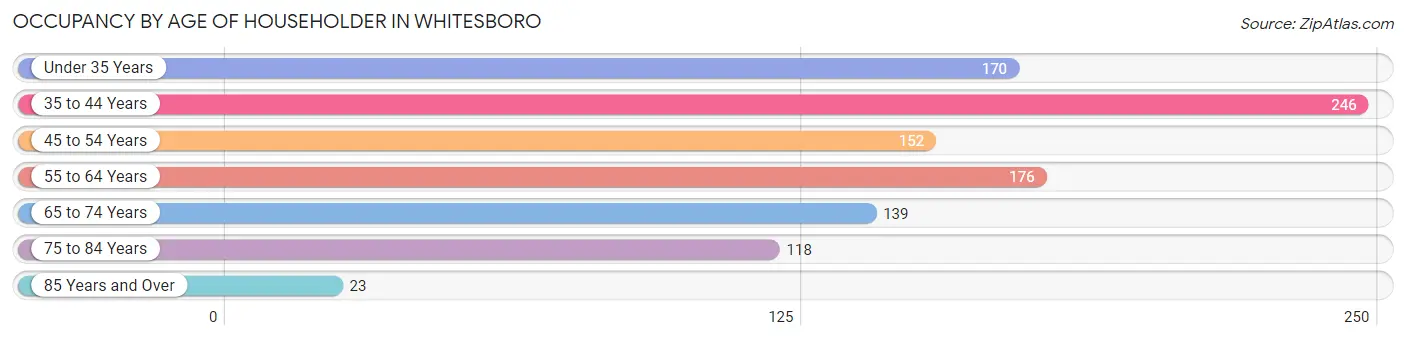
| Age Bracket | # Households | % Households |
| Under 35 Years | 170 | 16.6% |
| 35 to 44 Years | 246 | 24.0% |
| 45 to 54 Years | 152 | 14.8% |
| 55 to 64 Years | 176 | 17.2% |
| 65 to 74 Years | 139 | 13.6% |
| 75 to 84 Years | 118 | 11.5% |
| 85 Years and Over | 23 | 2.2% |
| Total | 1,024 | 100.0% |
Housing Finances in Whitesboro
Median Income by Occupancy in Whitesboro
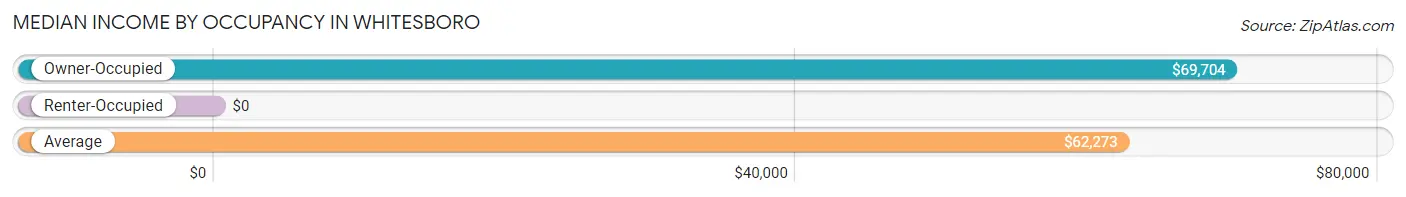
| Occupancy Type | # Households | Median Income |
| Owner-Occupied | 911 (89.0%) | $69,704 |
| Renter-Occupied | 113 (11.0%) | $0 |
| Average | 1,024 (100.0%) | $62,273 |
Occupancy by Householder Income Bracket in Whitesboro
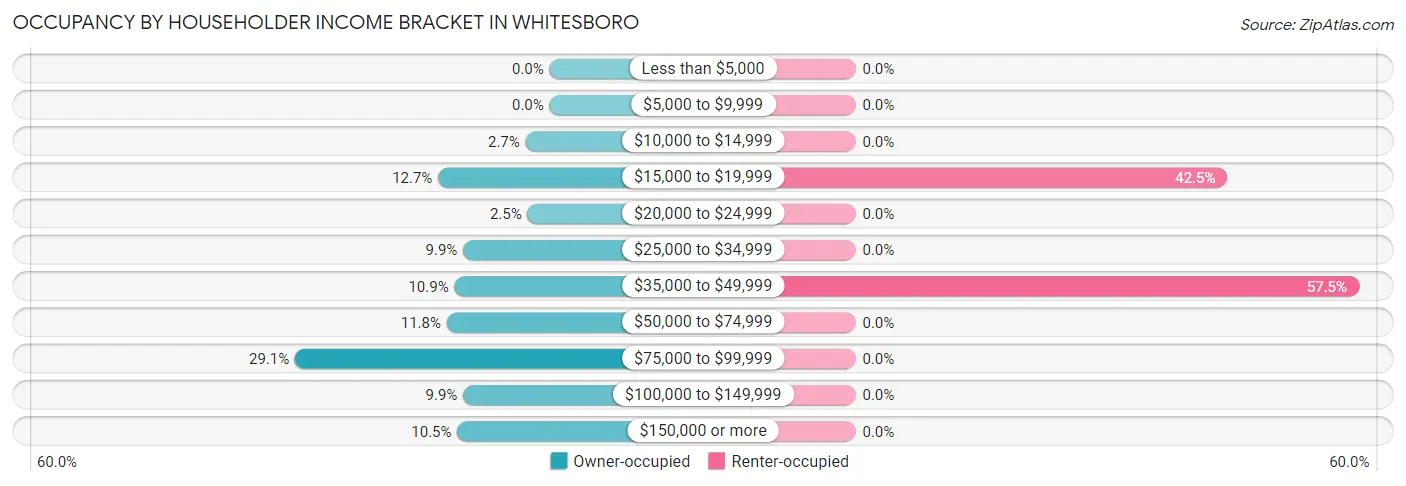
| Income Bracket | Owner-occupied | Renter-occupied |
| Less than $5,000 | 0 (0.0%) | 0 (0.0%) |
| $5,000 to $9,999 | 0 (0.0%) | 0 (0.0%) |
| $10,000 to $14,999 | 25 (2.7%) | 0 (0.0%) |
| $15,000 to $19,999 | 116 (12.7%) | 48 (42.5%) |
| $20,000 to $24,999 | 23 (2.5%) | 0 (0.0%) |
| $25,000 to $34,999 | 90 (9.9%) | 0 (0.0%) |
| $35,000 to $49,999 | 99 (10.9%) | 65 (57.5%) |
| $50,000 to $74,999 | 107 (11.7%) | 0 (0.0%) |
| $75,000 to $99,999 | 265 (29.1%) | 0 (0.0%) |
| $100,000 to $149,999 | 90 (9.9%) | 0 (0.0%) |
| $150,000 or more | 96 (10.5%) | 0 (0.0%) |
| Total | 911 (100.0%) | 113 (100.0%) |
Monthly Housing Cost Tiers in Whitesboro
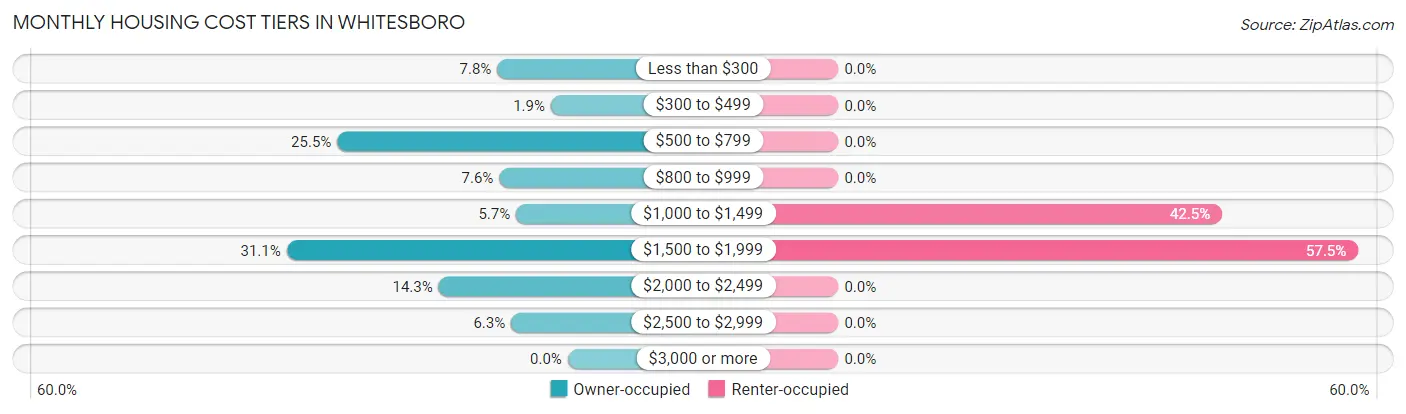
| Monthly Cost | Owner-occupied | Renter-occupied |
| Less than $300 | 71 (7.8%) | 0 (0.0%) |
| $300 to $499 | 17 (1.9%) | 0 (0.0%) |
| $500 to $799 | 232 (25.5%) | 0 (0.0%) |
| $800 to $999 | 69 (7.6%) | 0 (0.0%) |
| $1,000 to $1,499 | 52 (5.7%) | 48 (42.5%) |
| $1,500 to $1,999 | 283 (31.1%) | 65 (57.5%) |
| $2,000 to $2,499 | 130 (14.3%) | 0 (0.0%) |
| $2,500 to $2,999 | 57 (6.3%) | 0 (0.0%) |
| $3,000 or more | 0 (0.0%) | 0 (0.0%) |
| Total | 911 (100.0%) | 113 (100.0%) |
Physical Housing Characteristics in Whitesboro
Housing Structures in Whitesboro
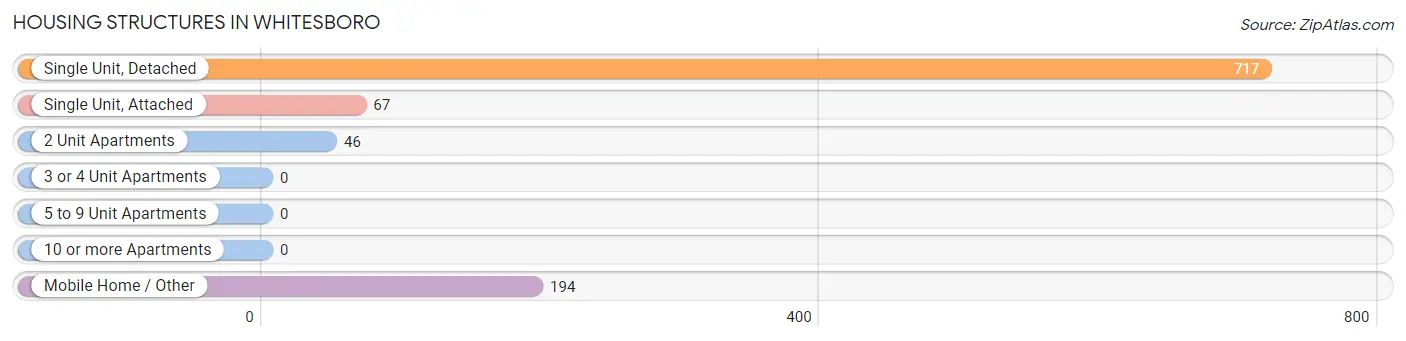
| Structure Type | # Housing Units | % Housing Units |
| Single Unit, Detached | 717 | 70.0% |
| Single Unit, Attached | 67 | 6.5% |
| 2 Unit Apartments | 46 | 4.5% |
| 3 or 4 Unit Apartments | 0 | 0.0% |
| 5 to 9 Unit Apartments | 0 | 0.0% |
| 10 or more Apartments | 0 | 0.0% |
| Mobile Home / Other | 194 | 19.0% |
| Total | 1,024 | 100.0% |
Housing Structures by Occupancy in Whitesboro
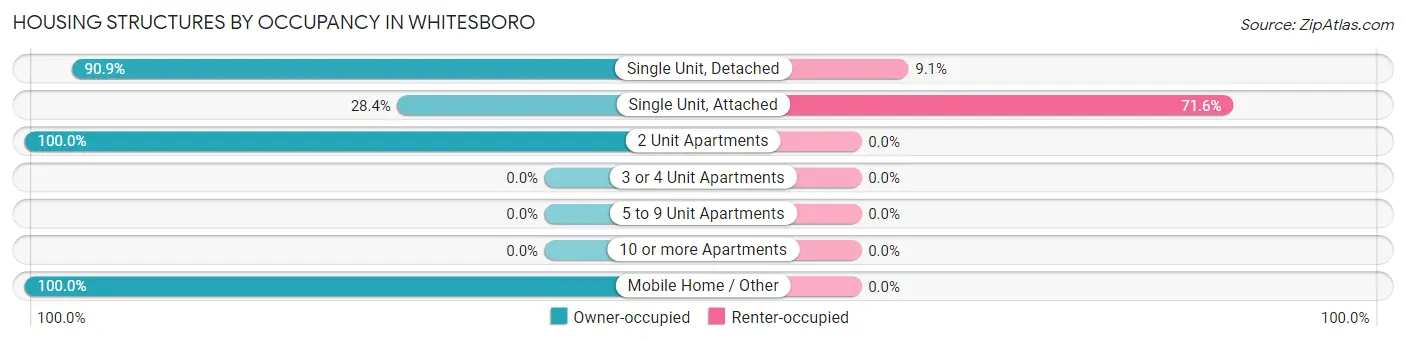
| Structure Type | Owner-occupied | Renter-occupied |
| Single Unit, Detached | 652 (90.9%) | 65 (9.1%) |
| Single Unit, Attached | 19 (28.4%) | 48 (71.6%) |
| 2 Unit Apartments | 46 (100.0%) | 0 (0.0%) |
| 3 or 4 Unit Apartments | 0 (0.0%) | 0 (0.0%) |
| 5 to 9 Unit Apartments | 0 (0.0%) | 0 (0.0%) |
| 10 or more Apartments | 0 (0.0%) | 0 (0.0%) |
| Mobile Home / Other | 194 (100.0%) | 0 (0.0%) |
| Total | 911 (89.0%) | 113 (11.0%) |
Housing Structures by Number of Rooms in Whitesboro
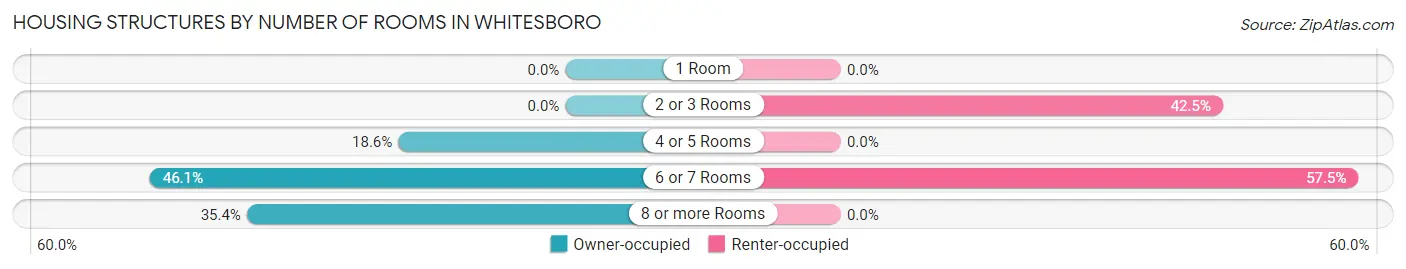
| Number of Rooms | Owner-occupied | Renter-occupied |
| 1 Room | 0 (0.0%) | 0 (0.0%) |
| 2 or 3 Rooms | 0 (0.0%) | 48 (42.5%) |
| 4 or 5 Rooms | 169 (18.5%) | 0 (0.0%) |
| 6 or 7 Rooms | 420 (46.1%) | 65 (57.5%) |
| 8 or more Rooms | 322 (35.3%) | 0 (0.0%) |
| Total | 911 (100.0%) | 113 (100.0%) |
Housing Structure by Heating Type in Whitesboro
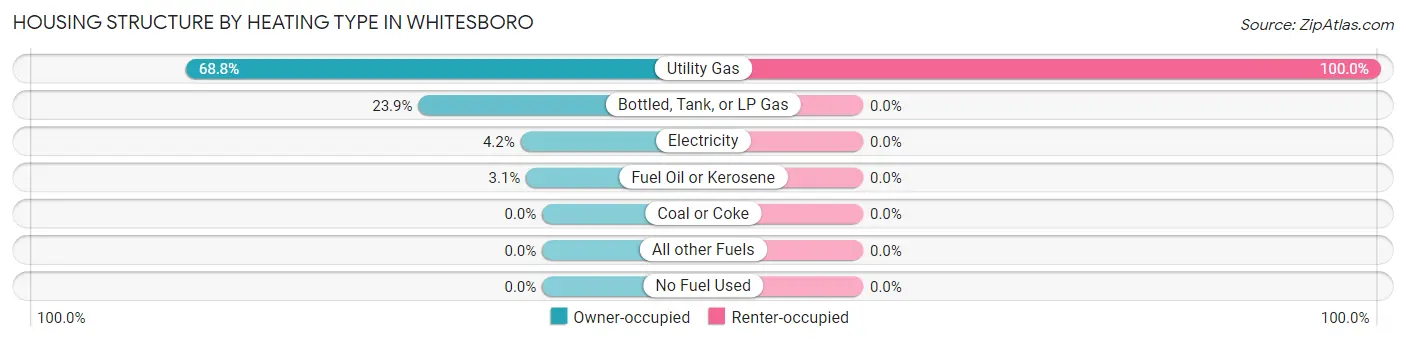
| Heating Type | Owner-occupied | Renter-occupied |
| Utility Gas | 627 (68.8%) | 113 (100.0%) |
| Bottled, Tank, or LP Gas | 218 (23.9%) | 0 (0.0%) |
| Electricity | 38 (4.2%) | 0 (0.0%) |
| Fuel Oil or Kerosene | 28 (3.1%) | 0 (0.0%) |
| Coal or Coke | 0 (0.0%) | 0 (0.0%) |
| All other Fuels | 0 (0.0%) | 0 (0.0%) |
| No Fuel Used | 0 (0.0%) | 0 (0.0%) |
| Total | 911 (100.0%) | 113 (100.0%) |
Household Vehicle Usage in Whitesboro
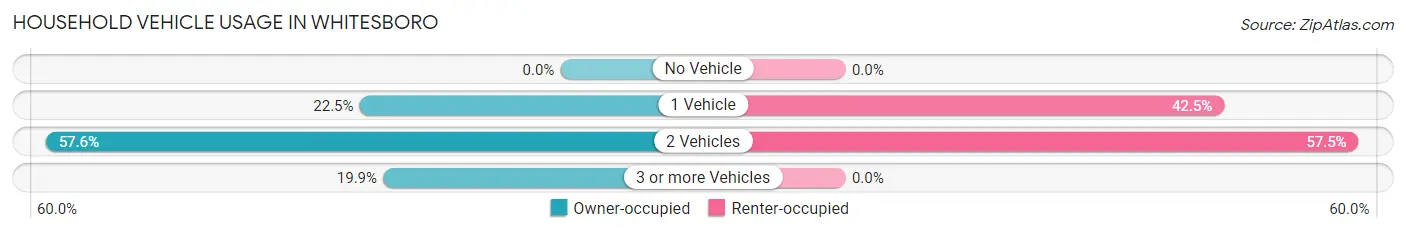
| Vehicles per Household | Owner-occupied | Renter-occupied |
| No Vehicle | 0 (0.0%) | 0 (0.0%) |
| 1 Vehicle | 205 (22.5%) | 48 (42.5%) |
| 2 Vehicles | 525 (57.6%) | 65 (57.5%) |
| 3 or more Vehicles | 181 (19.9%) | 0 (0.0%) |
| Total | 911 (100.0%) | 113 (100.0%) |
Real Estate & Mortgages in Whitesboro
Real Estate and Mortgage Overview in Whitesboro
| Characteristic | Without Mortgage | With Mortgage |
| Housing Units | 395 | 516 |
| Median Property Value | $196,700 | $226,500 |
| Median Household Income | $50,817 | $50 |
| Monthly Housing Costs | $691 | $0 |
| Real Estate Taxes | $4,391 | $69 |
Property Value by Mortgage Status in Whitesboro
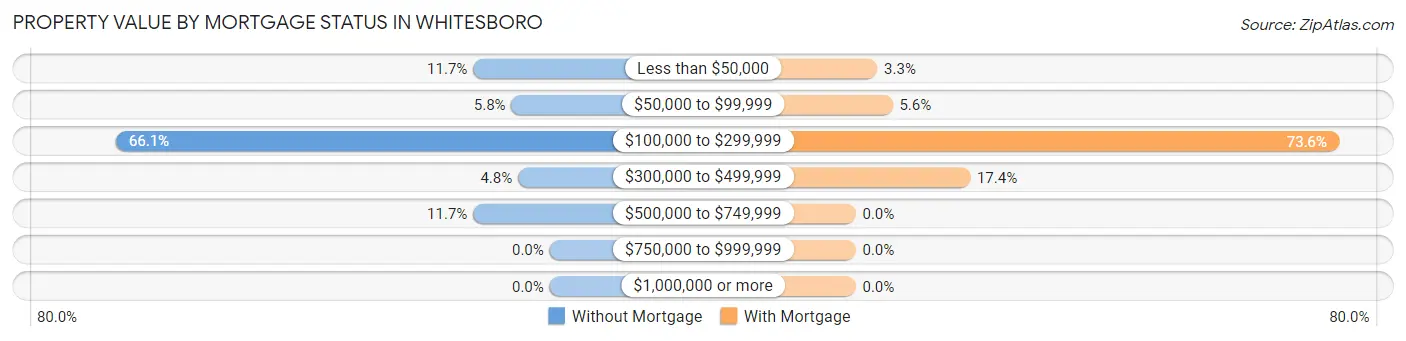
| Property Value | Without Mortgage | With Mortgage |
| Less than $50,000 | 46 (11.7%) | 17 (3.3%) |
| $50,000 to $99,999 | 23 (5.8%) | 29 (5.6%) |
| $100,000 to $299,999 | 261 (66.1%) | 380 (73.6%) |
| $300,000 to $499,999 | 19 (4.8%) | 90 (17.4%) |
| $500,000 to $749,999 | 46 (11.7%) | 0 (0.0%) |
| $750,000 to $999,999 | 0 (0.0%) | 0 (0.0%) |
| $1,000,000 or more | 0 (0.0%) | 0 (0.0%) |
| Total | 395 (100.0%) | 516 (100.0%) |
Household Income by Mortgage Status in Whitesboro
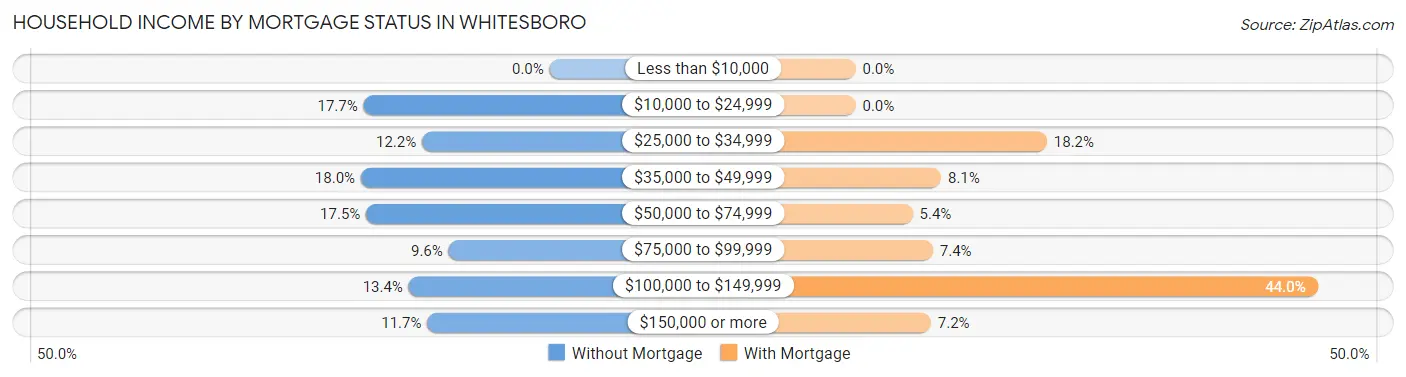
| Household Income | Without Mortgage | With Mortgage |
| Less than $10,000 | 0 (0.0%) | 0 (0.0%) |
| $10,000 to $24,999 | 70 (17.7%) | 0 (0.0%) |
| $25,000 to $34,999 | 48 (12.1%) | 94 (18.2%) |
| $35,000 to $49,999 | 71 (18.0%) | 42 (8.1%) |
| $50,000 to $74,999 | 69 (17.5%) | 28 (5.4%) |
| $75,000 to $99,999 | 38 (9.6%) | 38 (7.4%) |
| $100,000 to $149,999 | 53 (13.4%) | 227 (44.0%) |
| $150,000 or more | 46 (11.7%) | 37 (7.2%) |
| Total | 395 (100.0%) | 516 (100.0%) |
Property Value to Household Income Ratio in Whitesboro
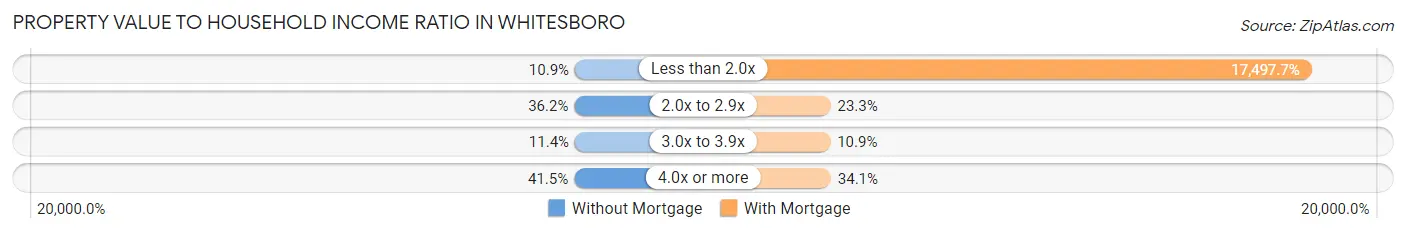
| Value-to-Income Ratio | Without Mortgage | With Mortgage |
| Less than 2.0x | 43 (10.9%) | 90,288 (17,497.7%) |
| 2.0x to 2.9x | 143 (36.2%) | 120 (23.3%) |
| 3.0x to 3.9x | 45 (11.4%) | 56 (10.8%) |
| 4.0x or more | 164 (41.5%) | 176 (34.1%) |
| Total | 395 (100.0%) | 516 (100.0%) |
Real Estate Taxes by Mortgage Status in Whitesboro
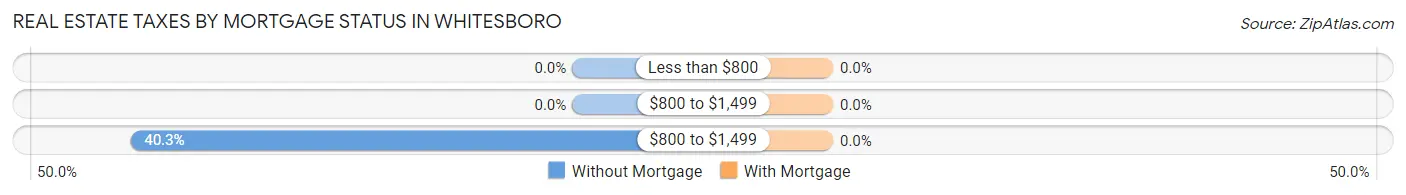
| Property Taxes | Without Mortgage | With Mortgage |
| Less than $800 | 0 (0.0%) | 0 (0.0%) |
| $800 to $1,499 | 0 (0.0%) | 0 (0.0%) |
| $800 to $1,499 | 159 (40.3%) | 0 (0.0%) |
| Total | 395 (100.0%) | 516 (100.0%) |
Health & Disability in Whitesboro
Health Insurance Coverage by Age in Whitesboro
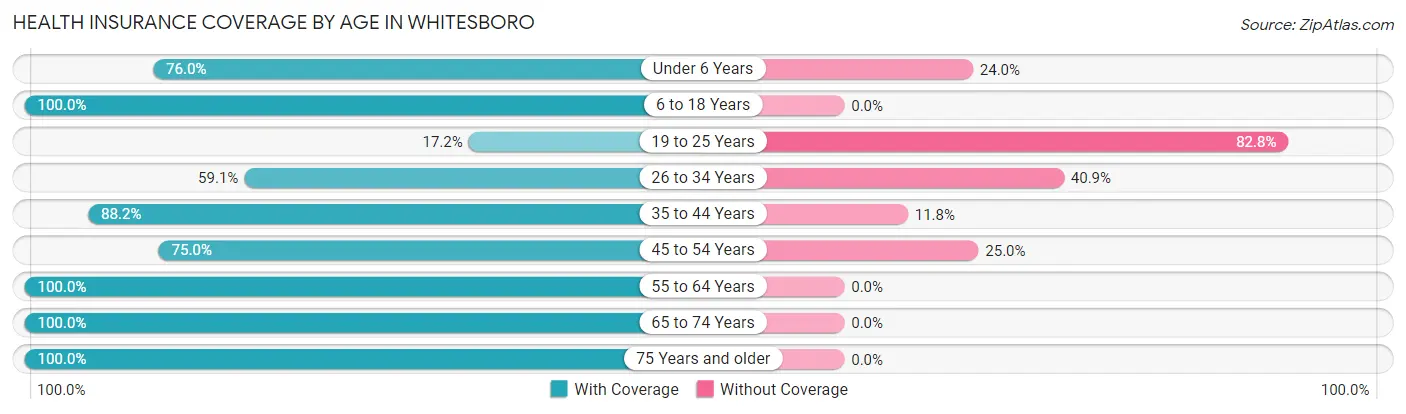
| Age Bracket | With Coverage | Without Coverage |
| Under 6 Years | 187 (76.0%) | 59 (24.0%) |
| 6 to 18 Years | 399 (100.0%) | 0 (0.0%) |
| 19 to 25 Years | 26 (17.2%) | 125 (82.8%) |
| 26 to 34 Years | 202 (59.1%) | 140 (40.9%) |
| 35 to 44 Years | 365 (88.2%) | 49 (11.8%) |
| 45 to 54 Years | 195 (75.0%) | 65 (25.0%) |
| 55 to 64 Years | 338 (100.0%) | 0 (0.0%) |
| 65 to 74 Years | 181 (100.0%) | 0 (0.0%) |
| 75 Years and older | 166 (100.0%) | 0 (0.0%) |
| Total | 2,059 (82.5%) | 438 (17.5%) |
Health Insurance Coverage by Citizenship Status in Whitesboro
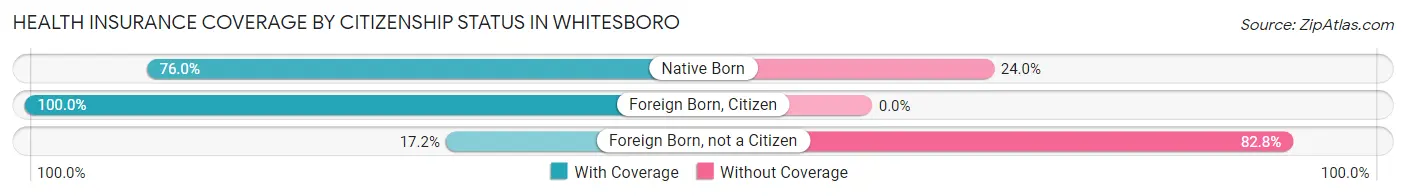
| Citizenship Status | With Coverage | Without Coverage |
| Native Born | 187 (76.0%) | 59 (24.0%) |
| Foreign Born, Citizen | 399 (100.0%) | 0 (0.0%) |
| Foreign Born, not a Citizen | 26 (17.2%) | 125 (82.8%) |
Health Insurance Coverage by Household Income in Whitesboro
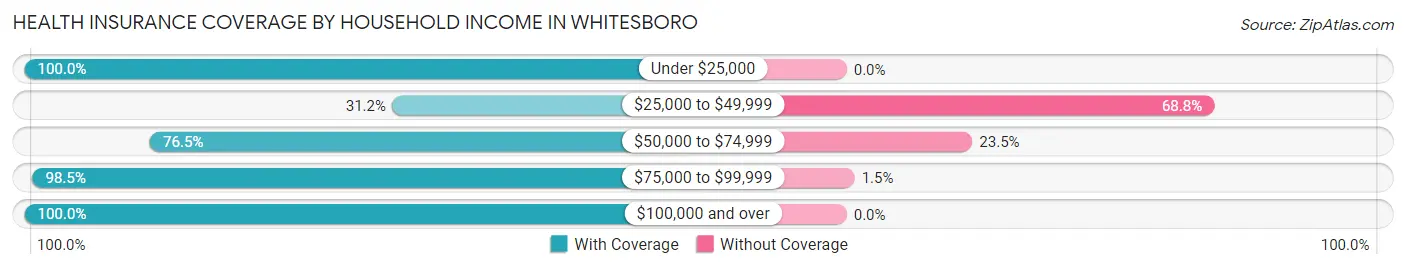
| Household Income | With Coverage | Without Coverage |
| Under $25,000 | 325 (100.0%) | 0 (0.0%) |
| $25,000 to $49,999 | 152 (31.2%) | 335 (68.8%) |
| $50,000 to $74,999 | 299 (76.5%) | 92 (23.5%) |
| $75,000 to $99,999 | 733 (98.5%) | 11 (1.5%) |
| $100,000 and over | 550 (100.0%) | 0 (0.0%) |
Public vs Private Health Insurance Coverage by Age in Whitesboro
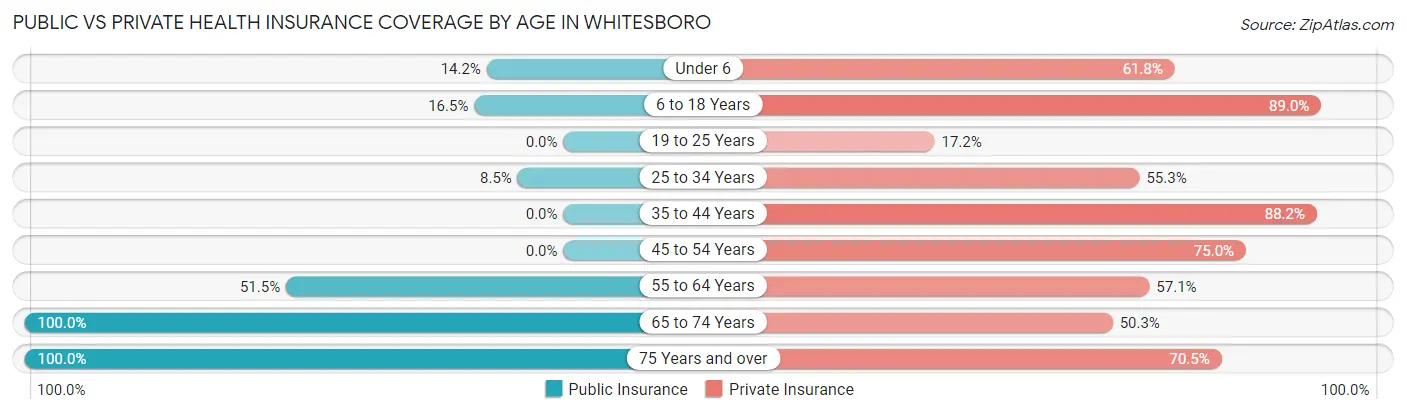
| Age Bracket | Public Insurance | Private Insurance |
| Under 6 | 35 (14.2%) | 152 (61.8%) |
| 6 to 18 Years | 66 (16.5%) | 355 (89.0%) |
| 19 to 25 Years | 0 (0.0%) | 26 (17.2%) |
| 25 to 34 Years | 29 (8.5%) | 189 (55.3%) |
| 35 to 44 Years | 0 (0.0%) | 365 (88.2%) |
| 45 to 54 Years | 0 (0.0%) | 195 (75.0%) |
| 55 to 64 Years | 174 (51.5%) | 193 (57.1%) |
| 65 to 74 Years | 181 (100.0%) | 91 (50.3%) |
| 75 Years and over | 166 (100.0%) | 117 (70.5%) |
| Total | 651 (26.1%) | 1,683 (67.4%) |
Disability Status by Sex by Age in Whitesboro
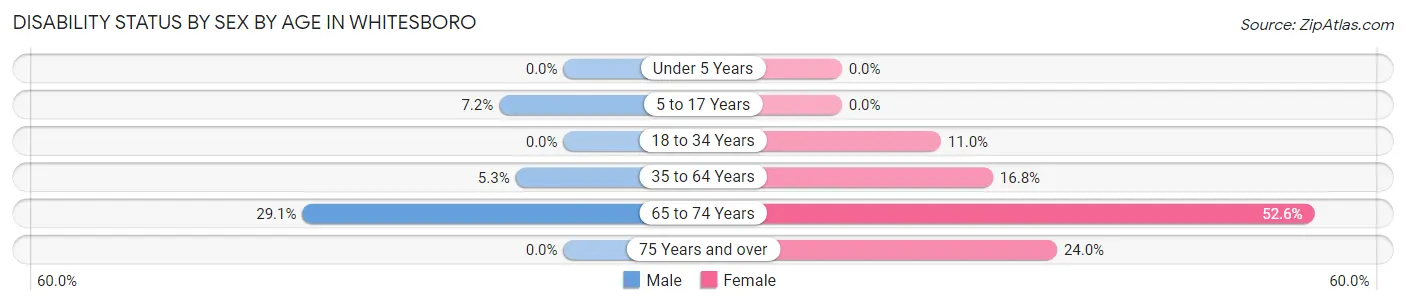
| Age Bracket | Male | Female |
| Under 5 Years | 0 (0.0%) | 0 (0.0%) |
| 5 to 17 Years | 26 (7.2%) | 0 (0.0%) |
| 18 to 34 Years | 0 (0.0%) | 17 (11.0%) |
| 35 to 64 Years | 27 (5.3%) | 85 (16.8%) |
| 65 to 74 Years | 25 (29.1%) | 50 (52.6%) |
| 75 Years and over | 0 (0.0%) | 23 (24.0%) |
Disability Class by Sex by Age in Whitesboro
Disability Class: Hearing Difficulty
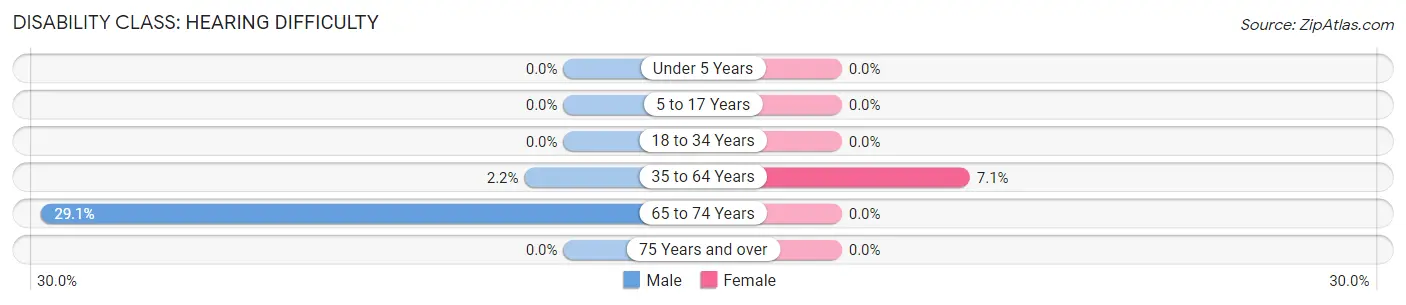
| Age Bracket | Male | Female |
| Under 5 Years | 0 (0.0%) | 0 (0.0%) |
| 5 to 17 Years | 0 (0.0%) | 0 (0.0%) |
| 18 to 34 Years | 0 (0.0%) | 0 (0.0%) |
| 35 to 64 Years | 11 (2.2%) | 36 (7.1%) |
| 65 to 74 Years | 25 (29.1%) | 0 (0.0%) |
| 75 Years and over | 0 (0.0%) | 0 (0.0%) |
Disability Class: Vision Difficulty
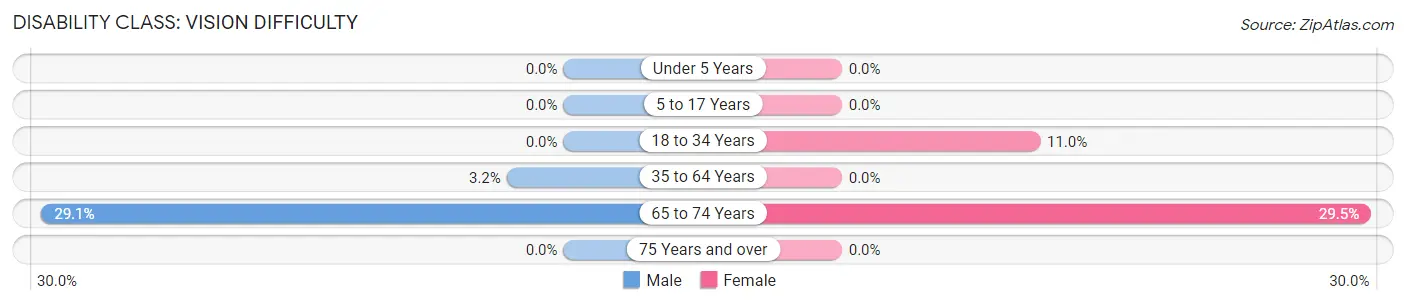
| Age Bracket | Male | Female |
| Under 5 Years | 0 (0.0%) | 0 (0.0%) |
| 5 to 17 Years | 0 (0.0%) | 0 (0.0%) |
| 18 to 34 Years | 0 (0.0%) | 17 (11.0%) |
| 35 to 64 Years | 16 (3.2%) | 0 (0.0%) |
| 65 to 74 Years | 25 (29.1%) | 28 (29.5%) |
| 75 Years and over | 0 (0.0%) | 0 (0.0%) |
Disability Class: Cognitive Difficulty
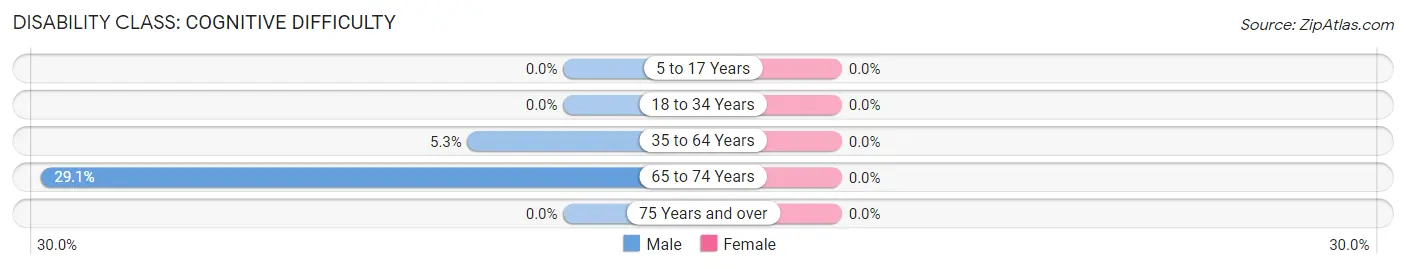
| Age Bracket | Male | Female |
| 5 to 17 Years | 0 (0.0%) | 0 (0.0%) |
| 18 to 34 Years | 0 (0.0%) | 0 (0.0%) |
| 35 to 64 Years | 27 (5.3%) | 0 (0.0%) |
| 65 to 74 Years | 25 (29.1%) | 0 (0.0%) |
| 75 Years and over | 0 (0.0%) | 0 (0.0%) |
Disability Class: Ambulatory Difficulty
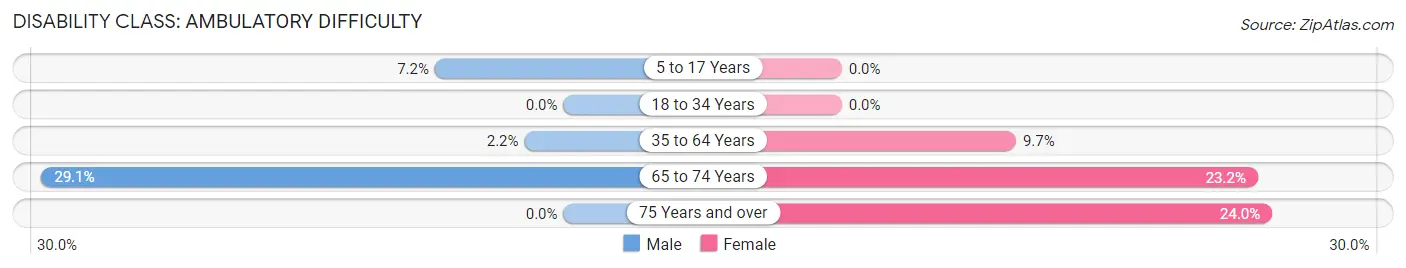
| Age Bracket | Male | Female |
| 5 to 17 Years | 26 (7.2%) | 0 (0.0%) |
| 18 to 34 Years | 0 (0.0%) | 0 (0.0%) |
| 35 to 64 Years | 11 (2.2%) | 49 (9.7%) |
| 65 to 74 Years | 25 (29.1%) | 22 (23.2%) |
| 75 Years and over | 0 (0.0%) | 23 (24.0%) |
Disability Class: Self-Care Difficulty
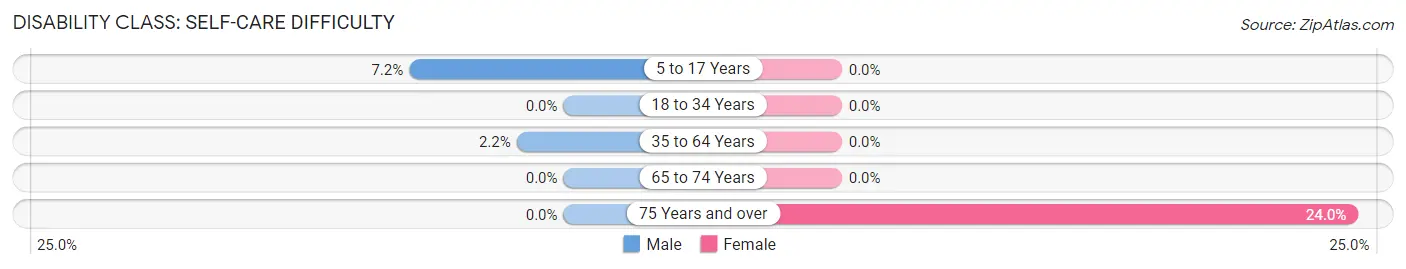
| Age Bracket | Male | Female |
| 5 to 17 Years | 26 (7.2%) | 0 (0.0%) |
| 18 to 34 Years | 0 (0.0%) | 0 (0.0%) |
| 35 to 64 Years | 11 (2.2%) | 0 (0.0%) |
| 65 to 74 Years | 0 (0.0%) | 0 (0.0%) |
| 75 Years and over | 0 (0.0%) | 23 (24.0%) |
Technology Access in Whitesboro
Computing Device Access in Whitesboro
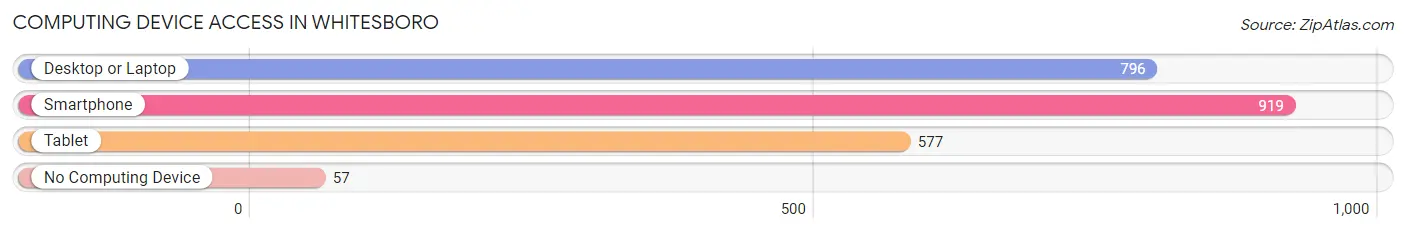
| Device Type | # Households | % Households |
| Desktop or Laptop | 796 | 77.7% |
| Smartphone | 919 | 89.7% |
| Tablet | 577 | 56.4% |
| No Computing Device | 57 | 5.6% |
| Total | 1,024 | 100.0% |
Internet Access in Whitesboro
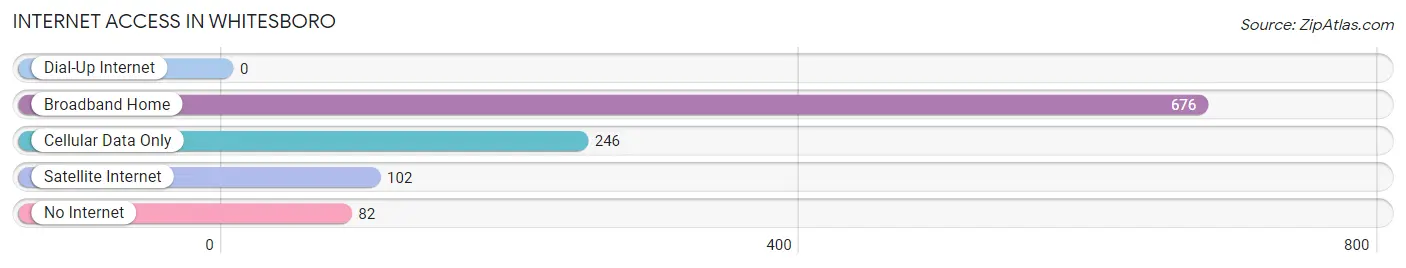
| Internet Type | # Households | % Households |
| Dial-Up Internet | 0 | 0.0% |
| Broadband Home | 676 | 66.0% |
| Cellular Data Only | 246 | 24.0% |
| Satellite Internet | 102 | 10.0% |
| No Internet | 82 | 8.0% |
| Total | 1,024 | 100.0% |
Whitesboro Summary
Whitesboro is a small unincorporated community located in the northern part of New Jersey, in the United States. It is situated in the northern part of Morris County, and is part of the Greater New York City metropolitan area. The community is located on the banks of the Musconetcong River, and is bordered by the towns of Washington Township, Mount Olive Township, and Roxbury Township.
History
Whitesboro was first settled in the late 1700s by a group of Dutch settlers. The community was originally known as “White’s Mill”, named after the first settler, John White. The community was later renamed to “Whitesboro” in 1845. The community was primarily an agricultural community, with the main crops being corn, wheat, and oats. The community also had a few small businesses, such as a general store, a blacksmith, and a sawmill.
In the late 1800s, the community began to grow and develop. The Morris Canal was built through the area, and the community became a popular stop for travelers. The community also had a post office, a school, and a church. The community continued to grow and develop throughout the 20th century, and today it is a small, quiet community.
Geography
Whitesboro is located in the northern part of Morris County, in the state of New Jersey. The community is situated on the banks of the Musconetcong River, and is bordered by the towns of Washington Township, Mount Olive Township, and Roxbury Township. The community is located approximately 40 miles from New York City, and is part of the Greater New York City metropolitan area.
The community has a total area of 0.7 square miles, all of which is land. The community is located at an elevation of approximately 500 feet above sea level. The climate in the area is classified as humid continental, with hot, humid summers and cold, snowy winters.
Economy
Whitesboro is a small, rural community, and the economy is primarily based on agriculture. The main crops grown in the area are corn, wheat, and oats. The community also has a few small businesses, such as a general store, a blacksmith, and a sawmill.
The community is also home to a few small manufacturing companies, such as a plastics manufacturer and a metal fabrication company. The community is also home to a few small retail stores, such as a grocery store and a hardware store.
Demographics
As of the 2010 census, the population of Whitesboro was 1,845. The racial makeup of the community was 94.3% White, 2.2% African American, 0.3% Native American, 0.7% Asian, 0.1% Pacific Islander, and 2.4% from other races. The median household income in the community was $60,938, and the median family income was $68,750. The per capita income in the community was $25,945.
Conclusion
Whitesboro is a small, rural community located in the northern part of Morris County, New Jersey. The community was first settled in the late 1700s by a group of Dutch settlers, and was originally known as “White’s Mill”. The community has a total area of 0.7 square miles, and is located approximately 40 miles from New York City. The economy of the community is primarily based on agriculture, and the community also has a few small businesses and manufacturing companies. As of the 2010 census, the population of Whitesboro was 1,845, with a median household income of $60,938 and a median family income of $68,750.
Common Questions
What is Per Capita Income in Whitesboro?
Per Capita income in Whitesboro is $34,248.
What is the Median Family Income in Whitesboro?
Median Family Income in Whitesboro is $88,281.
What is the Median Household income in Whitesboro?
Median Household Income in Whitesboro is $62,273.
What is Income or Wage Gap in Whitesboro?
Income or Wage Gap in Whitesboro is 42.0%.
Women in Whitesboro earn 58.0 cents for every dollar earned by a man.
What is Inequality or Gini Index in Whitesboro?
Inequality or Gini Index in Whitesboro is 0.44.
What is the Total Population of Whitesboro?
Total Population of Whitesboro is 2,497.
What is the Total Male Population of Whitesboro?
Total Male Population of Whitesboro is 1,473.
What is the Total Female Population of Whitesboro?
Total Female Population of Whitesboro is 1,024.
What is the Ratio of Males per 100 Females in Whitesboro?
There are 143.85 Males per 100 Females in Whitesboro.
What is the Ratio of Females per 100 Males in Whitesboro?
There are 69.52 Females per 100 Males in Whitesboro.
What is the Median Population Age in Whitesboro?
Median Population Age in Whitesboro is 37.8 Years.
What is the Average Family Size in Whitesboro
Average Family Size in Whitesboro is 3.3 People.
What is the Average Household Size in Whitesboro
Average Household Size in Whitesboro is 2.4 People.
How Large is the Labor Force in Whitesboro?
There are 1,124 People in the Labor Forcein in Whitesboro.
What is the Percentage of People in the Labor Force in Whitesboro?
59.2% of People are in the Labor Force in Whitesboro.
What is the Unemployment Rate in Whitesboro?
Unemployment Rate in Whitesboro is 9.6%.