Port Monmouth, NJ Map & Demographics
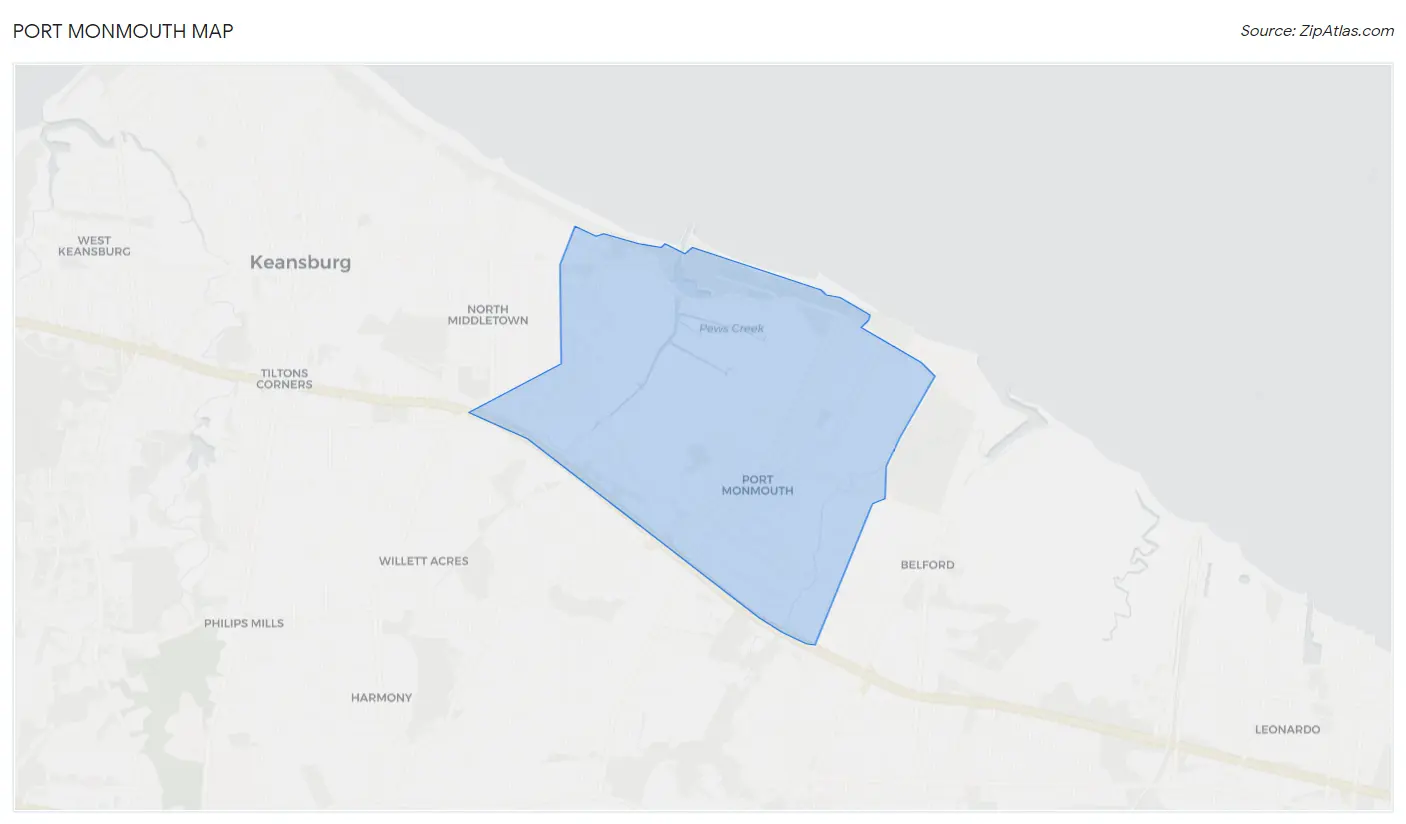
Port Monmouth Map
Port Monmouth Overview
$52,776
PER CAPITA INCOME
$141,157
AVG FAMILY INCOME
$95,268
AVG HOUSEHOLD INCOME
15.8%
WAGE / INCOME GAP [ % ]
84.2¢/ $1
WAGE / INCOME GAP [ $ ]
0.43
INEQUALITY / GINI INDEX
3,173
TOTAL POPULATION
1,402
MALE POPULATION
1,771
FEMALE POPULATION
79.16
MALES / 100 FEMALES
126.32
FEMALES / 100 MALES
47.3
MEDIAN AGE
3.0
AVG FAMILY SIZE
2.4
AVG HOUSEHOLD SIZE
1,919
LABOR FORCE [ PEOPLE ]
68.6%
PERCENT IN LABOR FORCE
7.3%
UNEMPLOYMENT RATE
Port Monmouth Zip Codes
Income in Port Monmouth
Income Overview in Port Monmouth
Per Capita Income in Port Monmouth is $52,776, while median incomes of families and households are $141,157 and $95,268 respectively.
| Characteristic | Number | Measure |
| Per Capita Income | 3,173 | $52,776 |
| Median Family Income | 827 | $141,157 |
| Mean Family Income | 827 | $158,053 |
| Median Household Income | 1,303 | $95,268 |
| Mean Household Income | 1,303 | $126,255 |
| Income Deficit | 827 | $0 |
| Wage / Income Gap (%) | 3,173 | 15.77% |
| Wage / Income Gap ($) | 3,173 | 84.23¢ per $1 |
| Gini / Inequality Index | 3,173 | 0.43 |
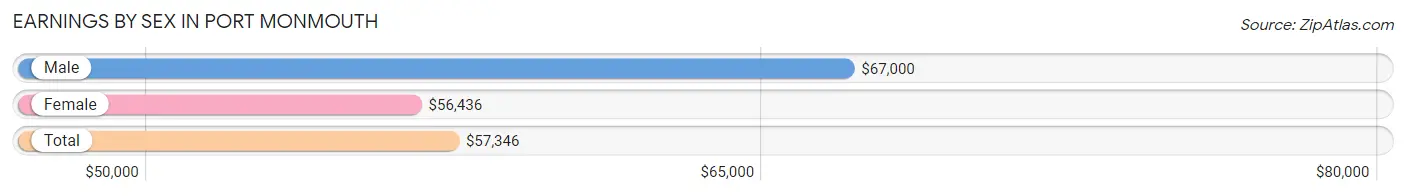
Earnings by Sex in Port Monmouth
Average Earnings in Port Monmouth are $57,346, $67,000 for men and $56,436 for women, a difference of 15.8%.
| Sex | Number | Average Earnings |
| Male | 894 (47.4%) | $67,000 |
| Female | 993 (52.6%) | $56,436 |
| Total | 1,887 (100.0%) | $57,346 |
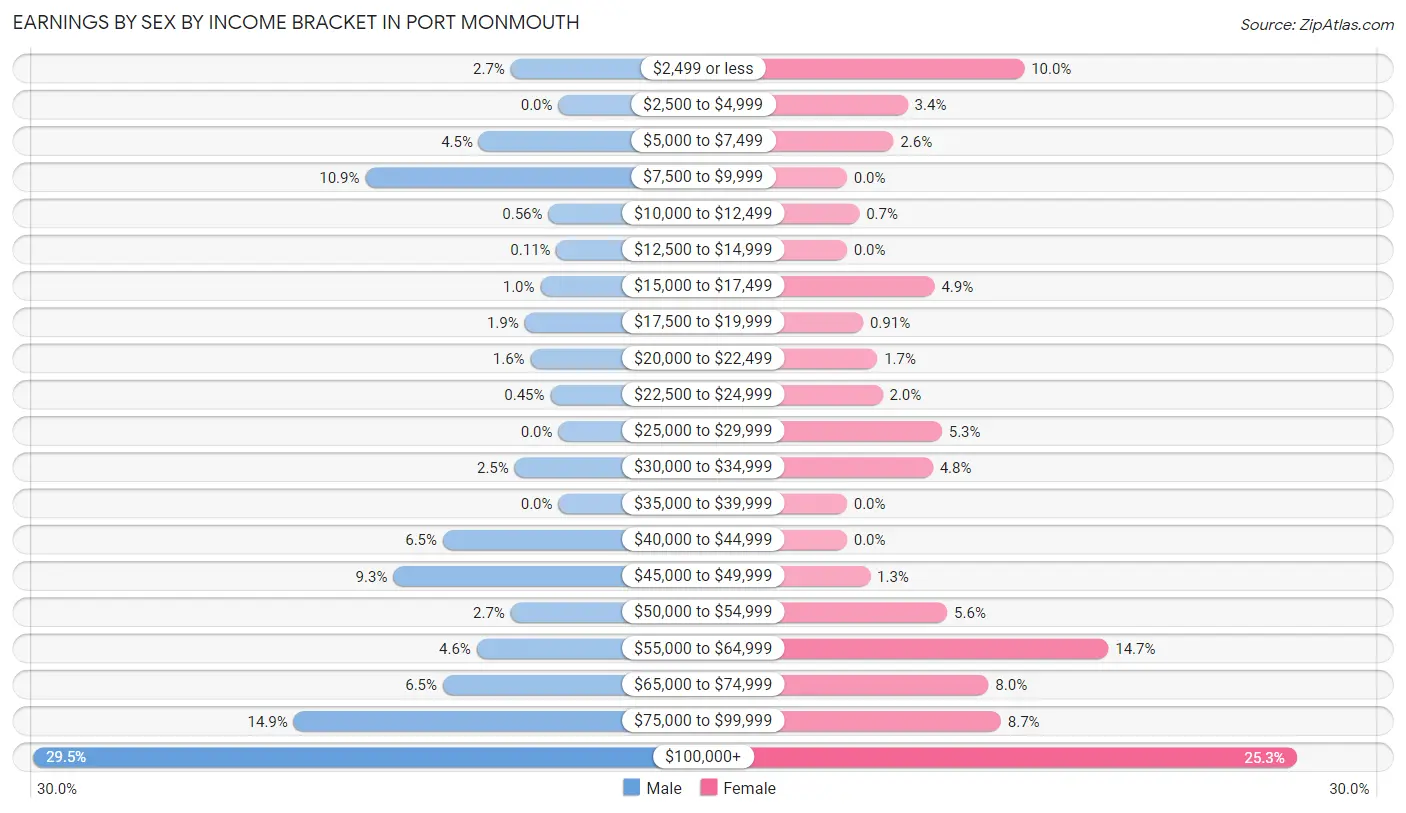
Earnings by Sex by Income Bracket in Port Monmouth
The most common earnings brackets in Port Monmouth are $100,000+ for men (264 | 29.5%) and $100,000+ for women (251 | 25.3%).
| Income | Male | Female |
| $2,499 or less | 24 (2.7%) | 99 (10.0%) |
| $2,500 to $4,999 | 0 (0.0%) | 34 (3.4%) |
| $5,000 to $7,499 | 40 (4.5%) | 26 (2.6%) |
| $7,500 to $9,999 | 97 (10.8%) | 0 (0.0%) |
| $10,000 to $12,499 | 5 (0.6%) | 7 (0.7%) |
| $12,500 to $14,999 | 1 (0.1%) | 0 (0.0%) |
| $15,000 to $17,499 | 9 (1.0%) | 49 (4.9%) |
| $17,500 to $19,999 | 17 (1.9%) | 9 (0.9%) |
| $20,000 to $22,499 | 14 (1.6%) | 17 (1.7%) |
| $22,500 to $24,999 | 4 (0.4%) | 20 (2.0%) |
| $25,000 to $29,999 | 0 (0.0%) | 53 (5.3%) |
| $30,000 to $34,999 | 22 (2.5%) | 48 (4.8%) |
| $35,000 to $39,999 | 0 (0.0%) | 0 (0.0%) |
| $40,000 to $44,999 | 58 (6.5%) | 0 (0.0%) |
| $45,000 to $49,999 | 83 (9.3%) | 13 (1.3%) |
| $50,000 to $54,999 | 24 (2.7%) | 56 (5.6%) |
| $55,000 to $64,999 | 41 (4.6%) | 146 (14.7%) |
| $65,000 to $74,999 | 58 (6.5%) | 79 (8.0%) |
| $75,000 to $99,999 | 133 (14.9%) | 86 (8.7%) |
| $100,000+ | 264 (29.5%) | 251 (25.3%) |
| Total | 894 (100.0%) | 993 (100.0%) |
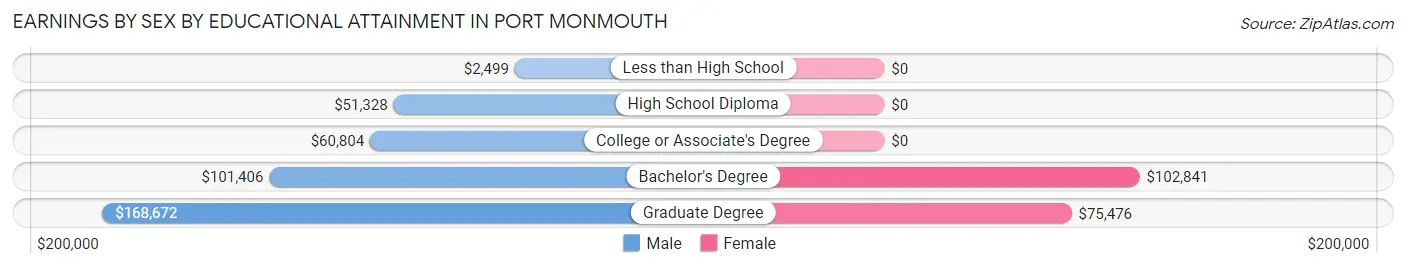
Earnings by Sex by Educational Attainment in Port Monmouth
Average earnings in Port Monmouth are $76,944 for men and $71,932 for women, a difference of 6.5%. Men with an educational attainment of graduate degree enjoy the highest average annual earnings of $168,672, while those with less than high school education earn the least with $2,499. Women with an educational attainment of bachelor's degree earn the most with the average annual earnings of $102,841, while those with graduate degree education have the smallest earnings of $75,476.
| Educational Attainment | Male Income | Female Income |
| Less than High School | $2,499 | $0 |
| High School Diploma | $51,328 | $0 |
| College or Associate's Degree | $60,804 | $0 |
| Bachelor's Degree | $101,406 | $102,841 |
| Graduate Degree | $168,672 | $75,476 |
| Total | $76,944 | $71,932 |
Family Income in Port Monmouth
Family Income Brackets in Port Monmouth
According to the Port Monmouth family income data, there are 209 families falling into the $200,000+ income range, which is the most common income bracket and makes up 25.3% of all families.
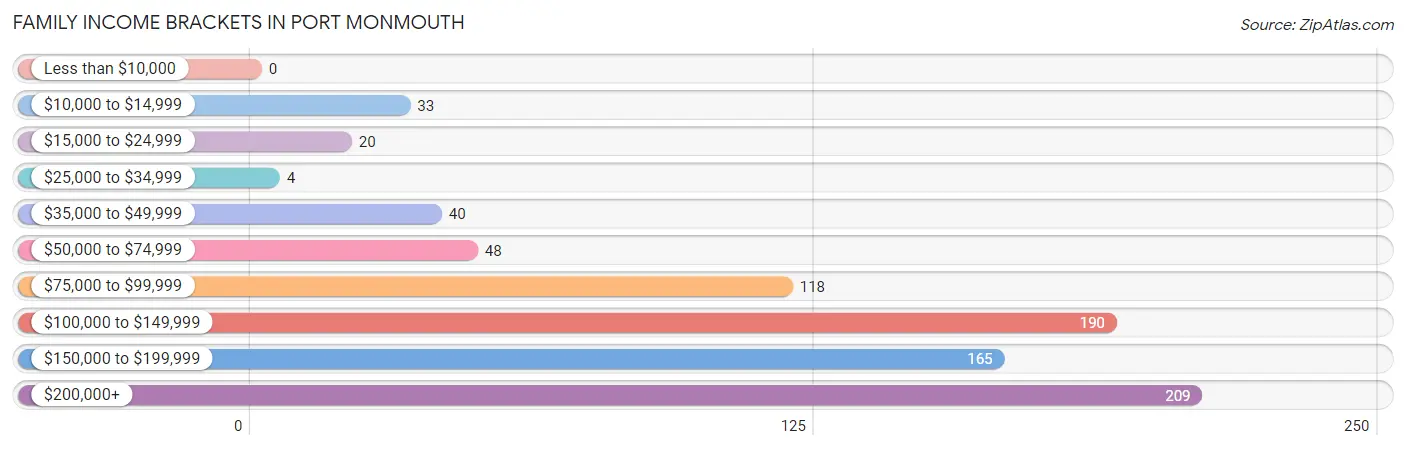
| Income Bracket | # Families | % Families |
| Less than $10,000 | 0 | 0.0% |
| $10,000 to $14,999 | 33 | 4.0% |
| $15,000 to $24,999 | 20 | 2.4% |
| $25,000 to $34,999 | 4 | 0.5% |
| $35,000 to $49,999 | 40 | 4.8% |
| $50,000 to $74,999 | 48 | 5.8% |
| $75,000 to $99,999 | 118 | 14.3% |
| $100,000 to $149,999 | 190 | 23.0% |
| $150,000 to $199,999 | 165 | 20.0% |
| $200,000+ | 209 | 25.3% |
Family Income by Famaliy Size in Port Monmouth
4-person families (127 | 15.4%) account for the highest median family income in Port Monmouth with $250,001 per family, while 2-person families (394 | 47.6%) have the highest median income of $68,125 per family member.
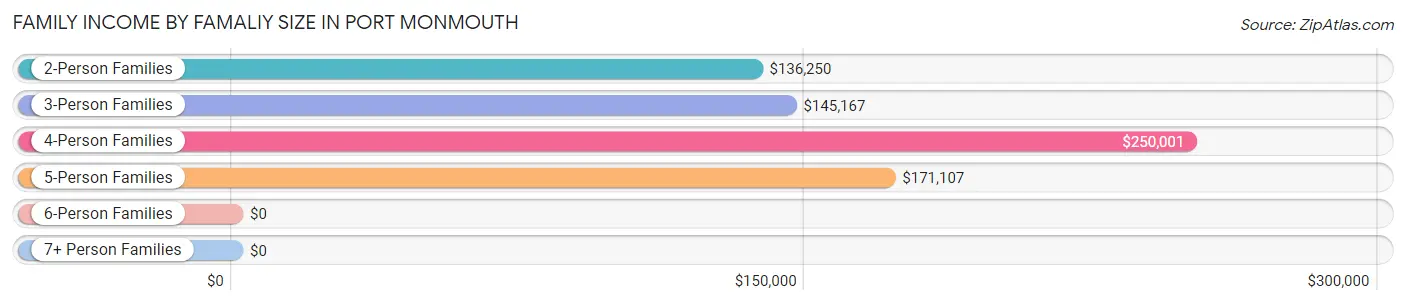
| Income Bracket | # Families | Median Income |
| 2-Person Families | 394 (47.6%) | $136,250 |
| 3-Person Families | 200 (24.2%) | $145,167 |
| 4-Person Families | 127 (15.4%) | $250,001 |
| 5-Person Families | 87 (10.5%) | $171,107 |
| 6-Person Families | 19 (2.3%) | $0 |
| 7+ Person Families | 0 (0.0%) | $0 |
| Total | 827 (100.0%) | $141,157 |
Family Income by Number of Earners in Port Monmouth
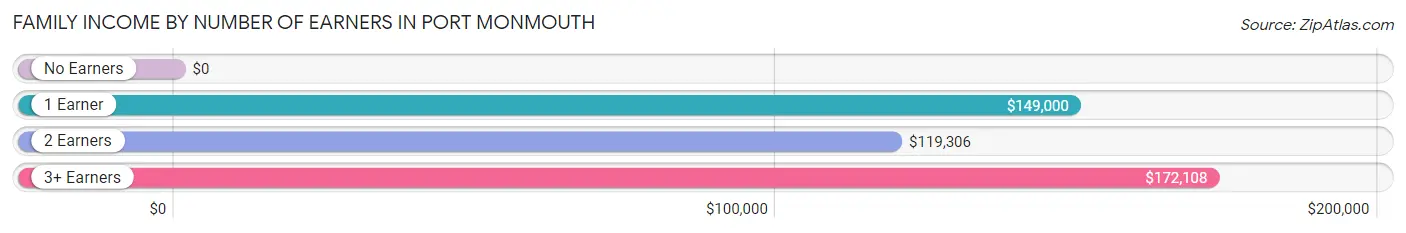
| Number of Earners | # Families | Median Income |
| No Earners | 61 (7.4%) | $0 |
| 1 Earner | 162 (19.6%) | $149,000 |
| 2 Earners | 439 (53.1%) | $119,306 |
| 3+ Earners | 165 (20.0%) | $172,108 |
| Total | 827 (100.0%) | $141,157 |
Household Income in Port Monmouth
Household Income Brackets in Port Monmouth
With 267 households falling in the category, the $200,000+ income range is the most frequent in Port Monmouth, accounting for 20.5% of all households. In contrast, only 21 households (1.6%) fall into the less than $10,000 income bracket, making it the least populous group.
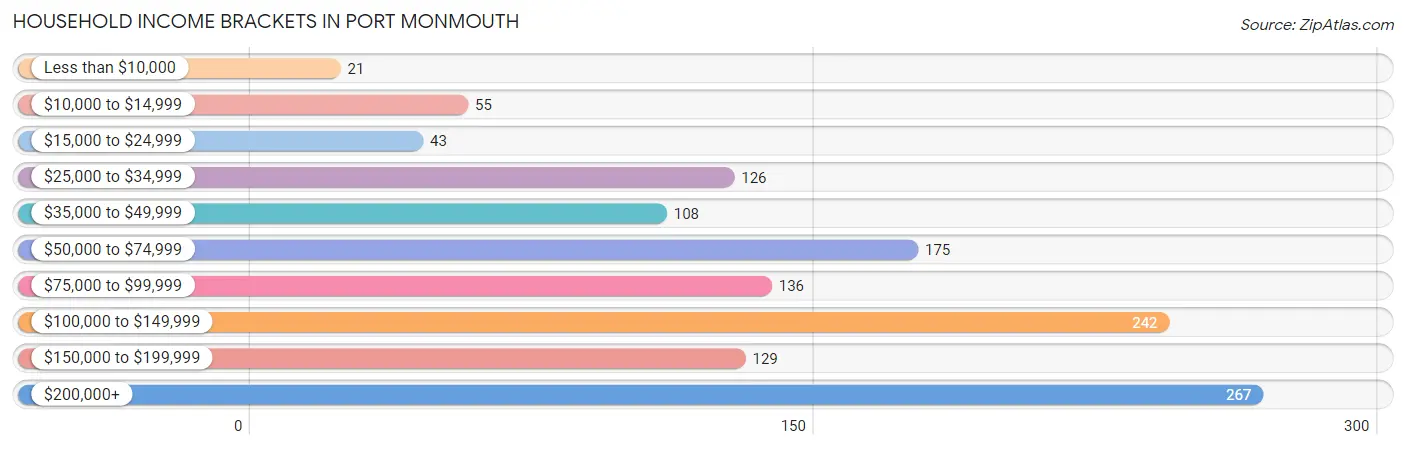
| Income Bracket | # Households | % Households |
| Less than $10,000 | 21 | 1.6% |
| $10,000 to $14,999 | 55 | 4.2% |
| $15,000 to $24,999 | 43 | 3.3% |
| $25,000 to $34,999 | 126 | 9.7% |
| $35,000 to $49,999 | 108 | 8.3% |
| $50,000 to $74,999 | 175 | 13.4% |
| $75,000 to $99,999 | 136 | 10.4% |
| $100,000 to $149,999 | 242 | 18.6% |
| $150,000 to $199,999 | 129 | 9.9% |
| $200,000+ | 267 | 20.5% |
Household Income by Householder Age in Port Monmouth
The median household income in Port Monmouth is $95,268, with the highest median household income of $136,364 found in the 25 to 44 years age bracket for the primary householder. A total of 262 households (20.1%) fall into this category.
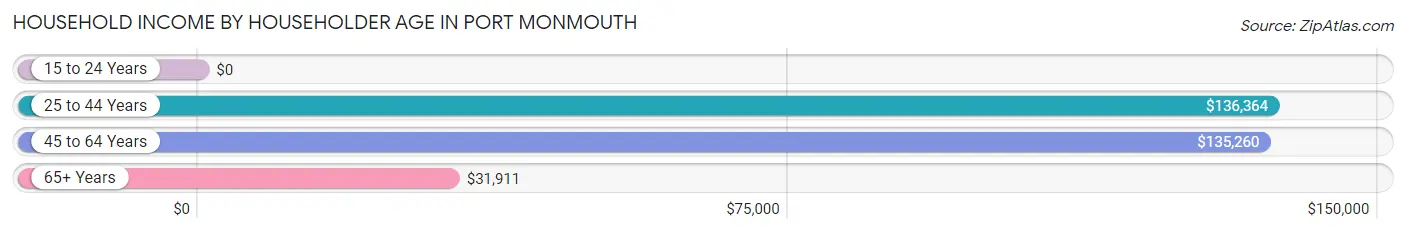
| Income Bracket | # Households | Median Income |
| 15 to 24 Years | 0 (0.0%) | $0 |
| 25 to 44 Years | 262 (20.1%) | $136,364 |
| 45 to 64 Years | 673 (51.6%) | $135,260 |
| 65+ Years | 368 (28.2%) | $31,911 |
| Total | 1,303 (100.0%) | $95,268 |
Poverty in Port Monmouth
Income Below Poverty by Sex and Age in Port Monmouth
With 5.6% poverty level for males and 5.5% for females among the residents of Port Monmouth, 65 to 74 year old males and 75 year old and over females are the most vulnerable to poverty, with 51 males (32.9%) and 45 females (34.4%) in their respective age groups living below the poverty level.
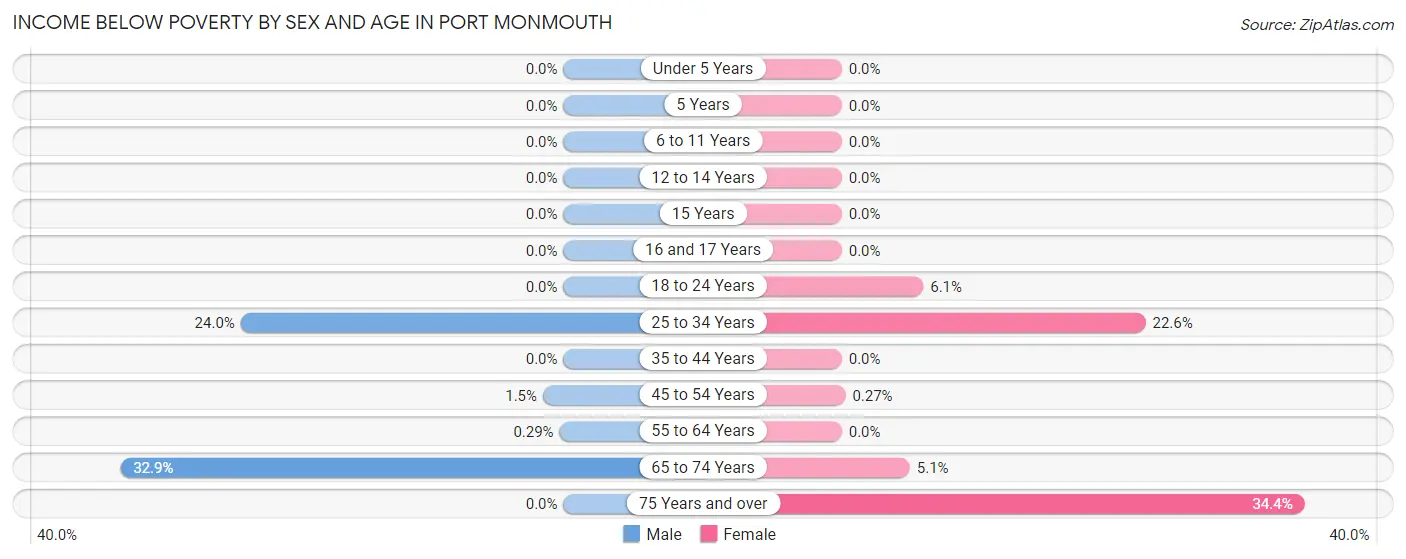
| Age Bracket | Male | Female |
| Under 5 Years | 0 (0.0%) | 0 (0.0%) |
| 5 Years | 0 (0.0%) | 0 (0.0%) |
| 6 to 11 Years | 0 (0.0%) | 0 (0.0%) |
| 12 to 14 Years | 0 (0.0%) | 0 (0.0%) |
| 15 Years | 0 (0.0%) | 0 (0.0%) |
| 16 and 17 Years | 0 (0.0%) | 0 (0.0%) |
| 18 to 24 Years | 0 (0.0%) | 17 (6.0%) |
| 25 to 34 Years | 23 (24.0%) | 23 (22.6%) |
| 35 to 44 Years | 0 (0.0%) | 0 (0.0%) |
| 45 to 54 Years | 3 (1.5%) | 1 (0.3%) |
| 55 to 64 Years | 1 (0.3%) | 0 (0.0%) |
| 65 to 74 Years | 51 (32.9%) | 11 (5.1%) |
| 75 Years and over | 0 (0.0%) | 45 (34.4%) |
| Total | 78 (5.6%) | 97 (5.5%) |
Income Above Poverty by Sex and Age in Port Monmouth
According to the poverty statistics in Port Monmouth, males aged under 5 years and females aged under 5 years are the age groups that are most secure financially, with 100.0% of males and 100.0% of females in these age groups living above the poverty line.
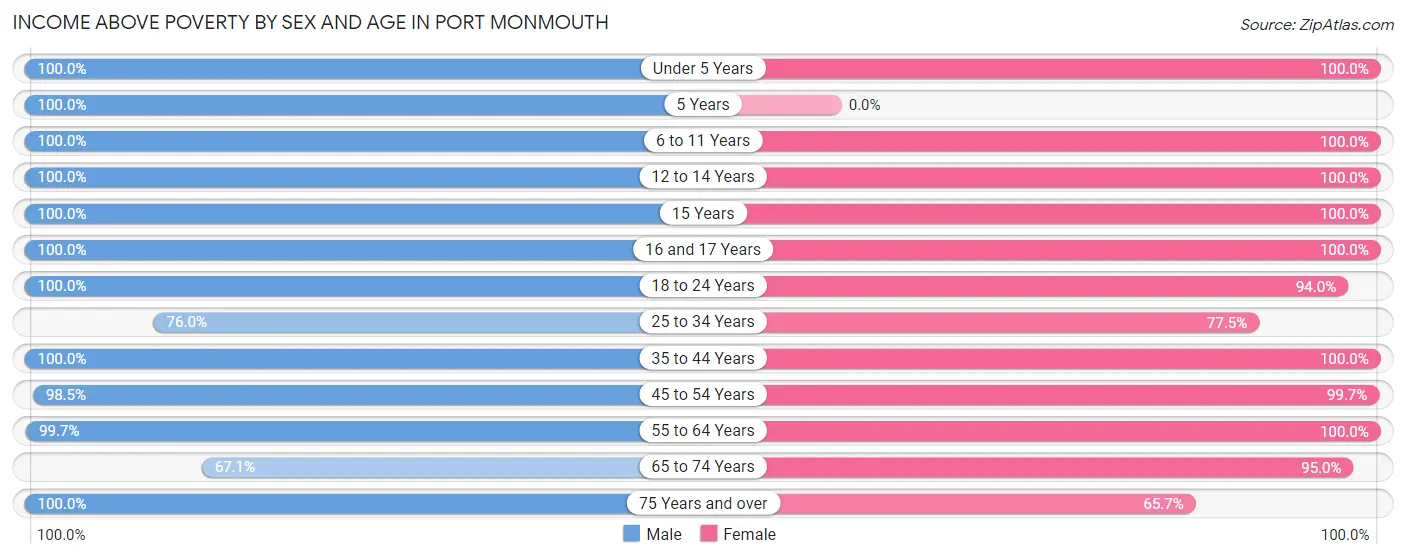
| Age Bracket | Male | Female |
| Under 5 Years | 43 (100.0%) | 44 (100.0%) |
| 5 Years | 12 (100.0%) | 0 (0.0%) |
| 6 to 11 Years | 37 (100.0%) | 79 (100.0%) |
| 12 to 14 Years | 22 (100.0%) | 51 (100.0%) |
| 15 Years | 68 (100.0%) | 20 (100.0%) |
| 16 and 17 Years | 67 (100.0%) | 24 (100.0%) |
| 18 to 24 Years | 123 (100.0%) | 264 (94.0%) |
| 25 to 34 Years | 73 (76.0%) | 79 (77.4%) |
| 35 to 44 Years | 204 (100.0%) | 220 (100.0%) |
| 45 to 54 Years | 194 (98.5%) | 363 (99.7%) |
| 55 to 64 Years | 340 (99.7%) | 237 (100.0%) |
| 65 to 74 Years | 104 (67.1%) | 207 (95.0%) |
| 75 Years and over | 37 (100.0%) | 86 (65.6%) |
| Total | 1,324 (94.4%) | 1,674 (94.5%) |
Income Below Poverty Among Married-Couple Families in Port Monmouth
The poverty statistics for married-couple families in Port Monmouth show that 5.3% or 33 of the total 619 families live below the poverty line. Families with no children have the highest poverty rate of 8.7%, comprising of 33 families. On the other hand, families with 1 or 2 children have the lowest poverty rate of 0.0%, which includes 0 families.
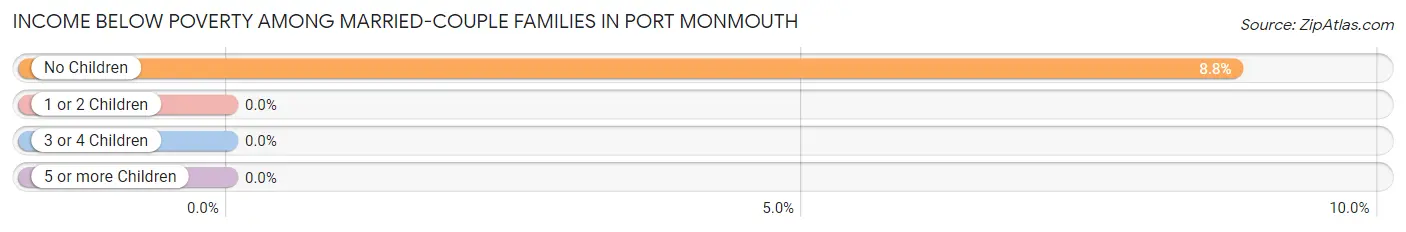
| Children | Above Poverty | Below Poverty |
| No Children | 344 (91.2%) | 33 (8.7%) |
| 1 or 2 Children | 234 (100.0%) | 0 (0.0%) |
| 3 or 4 Children | 8 (100.0%) | 0 (0.0%) |
| 5 or more Children | 0 (0.0%) | 0 (0.0%) |
| Total | 586 (94.7%) | 33 (5.3%) |
Income Below Poverty Among Single-Parent Households in Port Monmouth
| Children | Single Father | Single Mother |
| No Children | 0 (0.0%) | 0 (0.0%) |
| 1 or 2 Children | 0 (0.0%) | 0 (0.0%) |
| 3 or 4 Children | 0 (0.0%) | 0 (0.0%) |
| 5 or more Children | 0 (0.0%) | 0 (0.0%) |
| Total | 0 (0.0%) | 0 (0.0%) |
Income Below Poverty Among Married-Couple vs Single-Parent Households in Port Monmouth
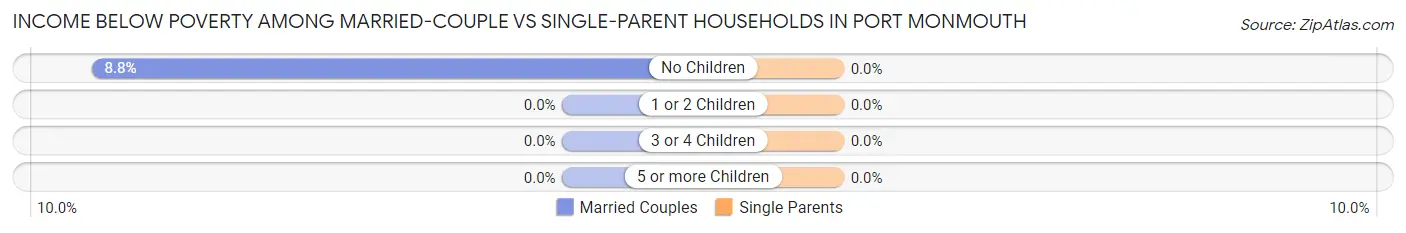
| Children | Married-Couple Families | Single-Parent Households |
| No Children | 33 (8.7%) | 0 (0.0%) |
| 1 or 2 Children | 0 (0.0%) | 0 (0.0%) |
| 3 or 4 Children | 0 (0.0%) | 0 (0.0%) |
| 5 or more Children | 0 (0.0%) | 0 (0.0%) |
| Total | 33 (5.3%) | 0 (0.0%) |
Race in Port Monmouth
The most populous races in Port Monmouth are White / Caucasian (2,716 | 85.6%), Hispanic or Latino (293 | 9.2%), and Two or more Races (170 | 5.4%).
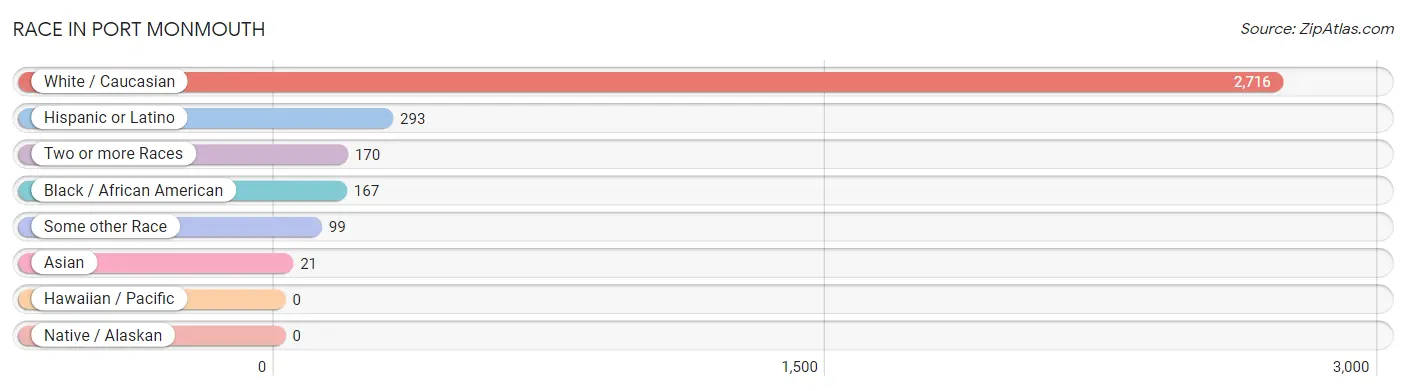
| Race | # Population | % Population |
| Asian | 21 | 0.7% |
| Black / African American | 167 | 5.3% |
| Hawaiian / Pacific | 0 | 0.0% |
| Hispanic or Latino | 293 | 9.2% |
| Native / Alaskan | 0 | 0.0% |
| White / Caucasian | 2,716 | 85.6% |
| Two or more Races | 170 | 5.4% |
| Some other Race | 99 | 3.1% |
| Total | 3,173 | 100.0% |
Ancestry in Port Monmouth
The most populous ancestries reported in Port Monmouth are Irish (1,044 | 32.9%), Italian (638 | 20.1%), German (427 | 13.5%), Puerto Rican (252 | 7.9%), and Polish (237 | 7.5%), together accounting for 81.9% of all Port Monmouth residents.
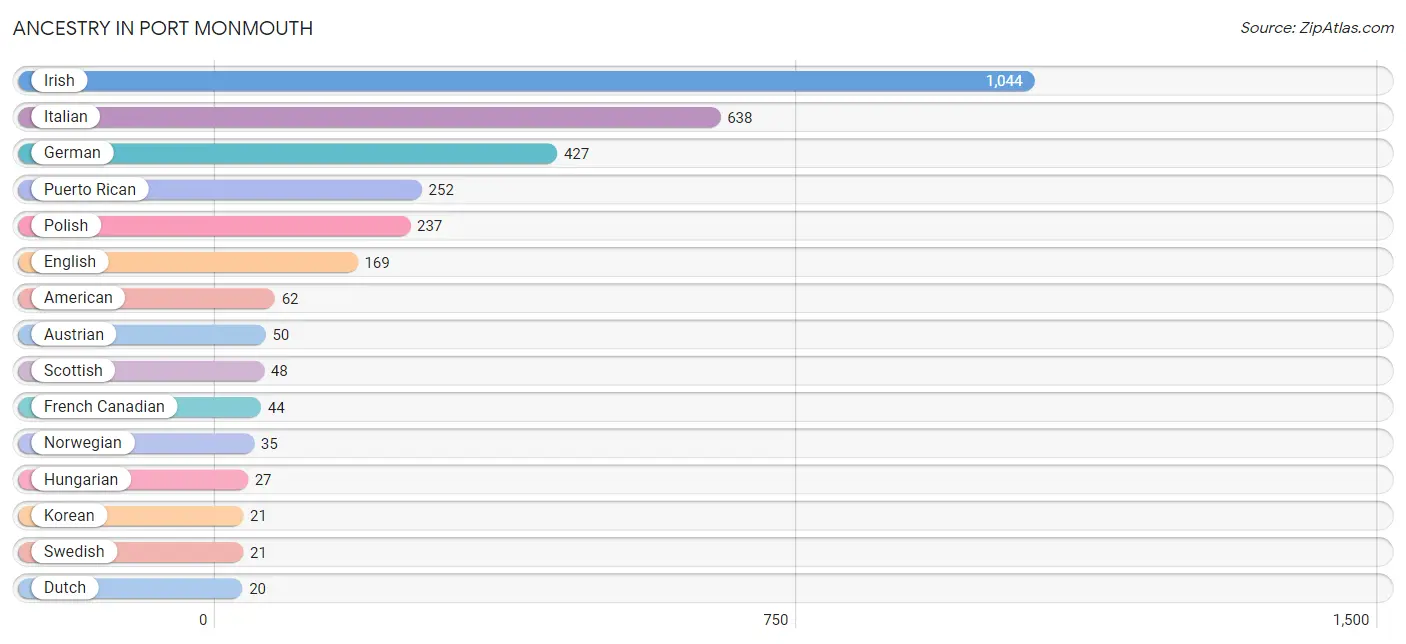
| Ancestry | # Population | % Population |
| American | 62 | 1.9% |
| Austrian | 50 | 1.6% |
| Dominican | 7 | 0.2% |
| Dutch | 20 | 0.6% |
| Eastern European | 13 | 0.4% |
| English | 169 | 5.3% |
| Estonian | 6 | 0.2% |
| French | 12 | 0.4% |
| French Canadian | 44 | 1.4% |
| German | 427 | 13.5% |
| Hungarian | 27 | 0.9% |
| Irish | 1,044 | 32.9% |
| Italian | 638 | 20.1% |
| Korean | 21 | 0.7% |
| Lithuanian | 5 | 0.2% |
| Northern European | 10 | 0.3% |
| Norwegian | 35 | 1.1% |
| Peruvian | 17 | 0.5% |
| Polish | 237 | 7.5% |
| Puerto Rican | 252 | 7.9% |
| Russian | 12 | 0.4% |
| Scottish | 48 | 1.5% |
| South American | 17 | 0.5% |
| South American Indian | 17 | 0.5% |
| Spaniard | 17 | 0.5% |
| Swedish | 21 | 0.7% |
| Ukrainian | 1 | 0.0% | View All 27 Rows |
Immigrants in Port Monmouth
The most numerous immigrant groups reported in Port Monmouth came from Europe (56 | 1.8%), Eastern Europe (25 | 0.8%), Latin America (24 | 0.8%), Asia (21 | 0.7%), and Philippines (21 | 0.7%), together accounting for 4.6% of all Port Monmouth residents.
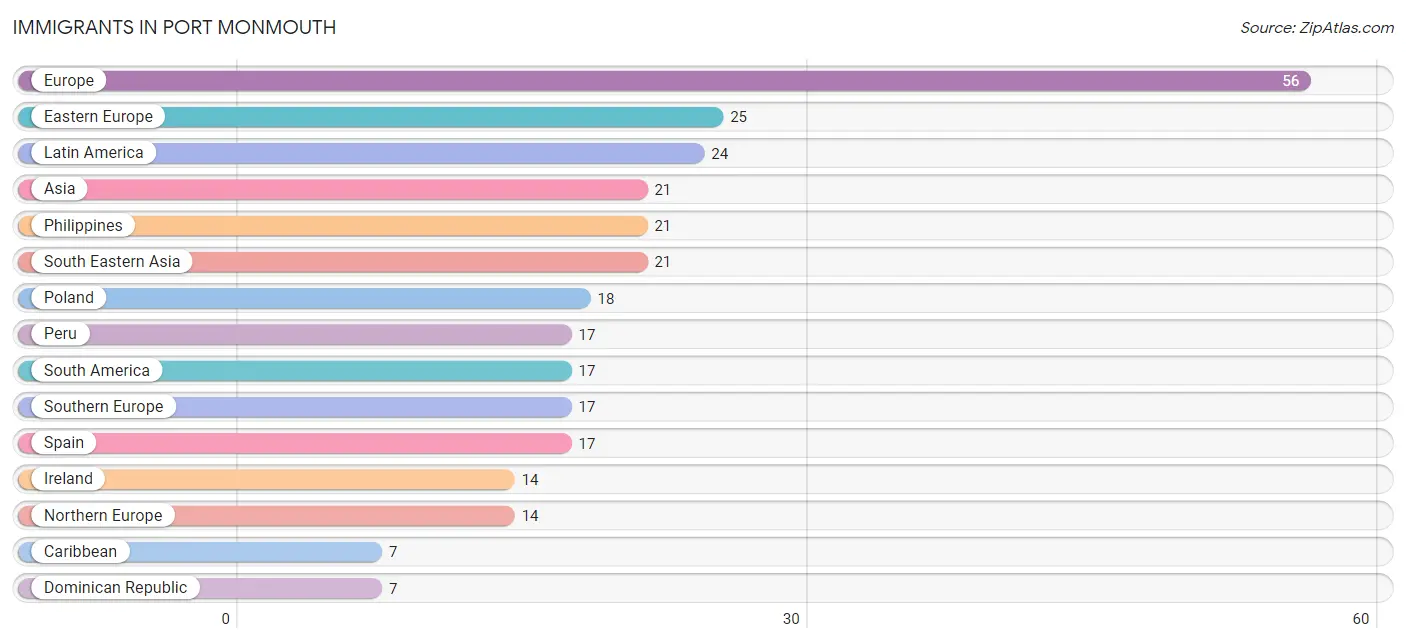
| Immigration Origin | # Population | % Population |
| Asia | 21 | 0.7% |
| Caribbean | 7 | 0.2% |
| Dominican Republic | 7 | 0.2% |
| Eastern Europe | 25 | 0.8% |
| Europe | 56 | 1.8% |
| Ireland | 14 | 0.4% |
| Latin America | 24 | 0.8% |
| Northern Europe | 14 | 0.4% |
| Peru | 17 | 0.5% |
| Philippines | 21 | 0.7% |
| Poland | 18 | 0.6% |
| South America | 17 | 0.5% |
| South Eastern Asia | 21 | 0.7% |
| Southern Europe | 17 | 0.5% |
| Spain | 17 | 0.5% |
| Ukraine | 1 | 0.0% | View All 16 Rows |
Sex and Age in Port Monmouth
Sex and Age in Port Monmouth
The most populous age groups in Port Monmouth are 60 to 64 Years (251 | 17.9%) for men and 50 to 54 Years (220 | 12.4%) for women.
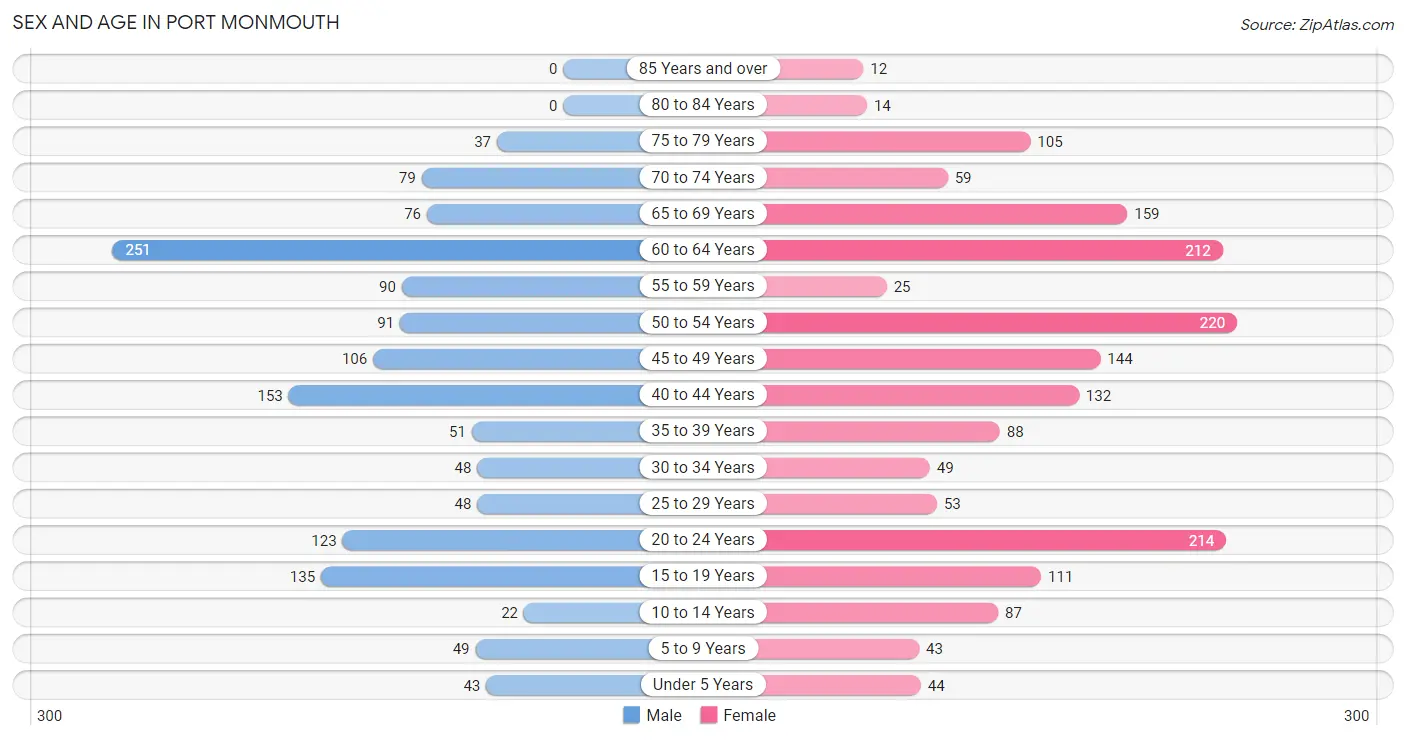
| Age Bracket | Male | Female |
| Under 5 Years | 43 (3.1%) | 44 (2.5%) |
| 5 to 9 Years | 49 (3.5%) | 43 (2.4%) |
| 10 to 14 Years | 22 (1.6%) | 87 (4.9%) |
| 15 to 19 Years | 135 (9.6%) | 111 (6.3%) |
| 20 to 24 Years | 123 (8.8%) | 214 (12.1%) |
| 25 to 29 Years | 48 (3.4%) | 53 (3.0%) |
| 30 to 34 Years | 48 (3.4%) | 49 (2.8%) |
| 35 to 39 Years | 51 (3.6%) | 88 (5.0%) |
| 40 to 44 Years | 153 (10.9%) | 132 (7.4%) |
| 45 to 49 Years | 106 (7.6%) | 144 (8.1%) |
| 50 to 54 Years | 91 (6.5%) | 220 (12.4%) |
| 55 to 59 Years | 90 (6.4%) | 25 (1.4%) |
| 60 to 64 Years | 251 (17.9%) | 212 (12.0%) |
| 65 to 69 Years | 76 (5.4%) | 159 (9.0%) |
| 70 to 74 Years | 79 (5.6%) | 59 (3.3%) |
| 75 to 79 Years | 37 (2.6%) | 105 (5.9%) |
| 80 to 84 Years | 0 (0.0%) | 14 (0.8%) |
| 85 Years and over | 0 (0.0%) | 12 (0.7%) |
| Total | 1,402 (100.0%) | 1,771 (100.0%) |
Families and Households in Port Monmouth
Median Family Size in Port Monmouth
The median family size in Port Monmouth is 2.98 persons per family, with single female/mother families (177 | 21.4%) accounting for the largest median family size of 3.24 persons per family. On the other hand, married-couple families (619 | 74.9%) represent the smallest median family size with 2.90 persons per family.
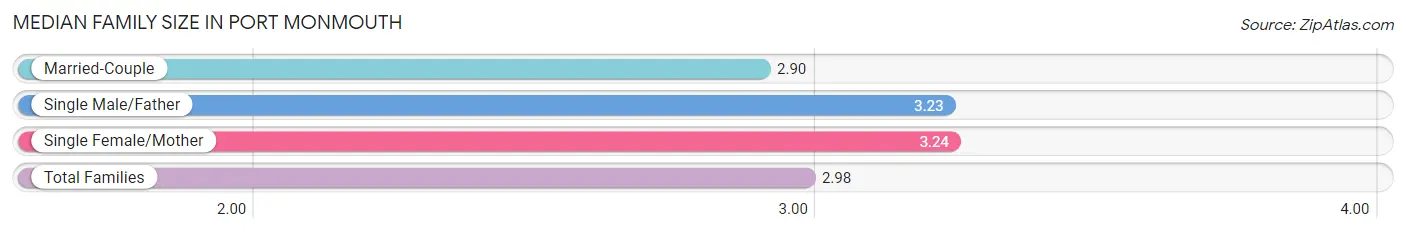
| Family Type | # Families | Family Size |
| Married-Couple | 619 (74.9%) | 2.90 |
| Single Male/Father | 31 (3.7%) | 3.23 |
| Single Female/Mother | 177 (21.4%) | 3.24 |
| Total Families | 827 (100.0%) | 2.98 |
Median Household Size in Port Monmouth
The median household size in Port Monmouth is 2.43 persons per household, with single female/mother households (177 | 13.6%) accounting for the largest median household size of 3.84 persons per household. non-family households (476 | 36.5%) represent the smallest median household size with 1.21 persons per household.
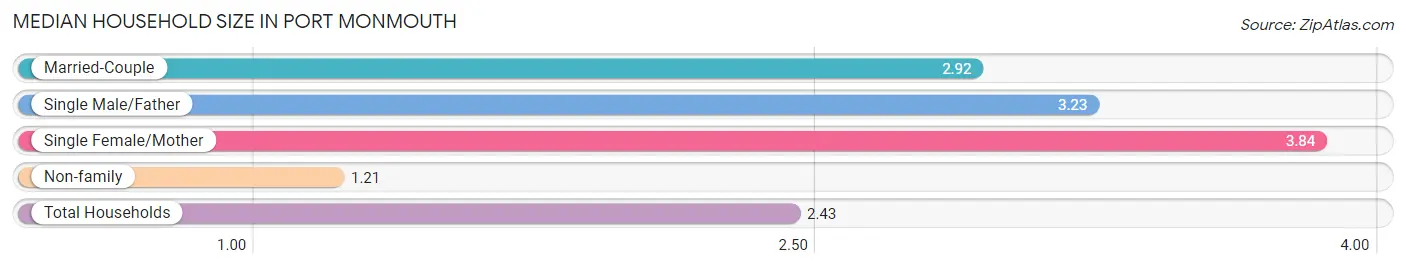
| Household Type | # Households | Household Size |
| Married-Couple | 619 (47.5%) | 2.92 |
| Single Male/Father | 31 (2.4%) | 3.23 |
| Single Female/Mother | 177 (13.6%) | 3.84 |
| Non-family | 476 (36.5%) | 1.21 |
| Total Households | 1,303 (100.0%) | 2.43 |
Household Size by Marriage Status in Port Monmouth
Out of a total of 1,303 households in Port Monmouth, 827 (63.5%) are family households, while 476 (36.5%) are nonfamily households. The most numerous type of family households are 2-person households, comprising 318, and the most common type of nonfamily households are 1-person households, comprising 380.
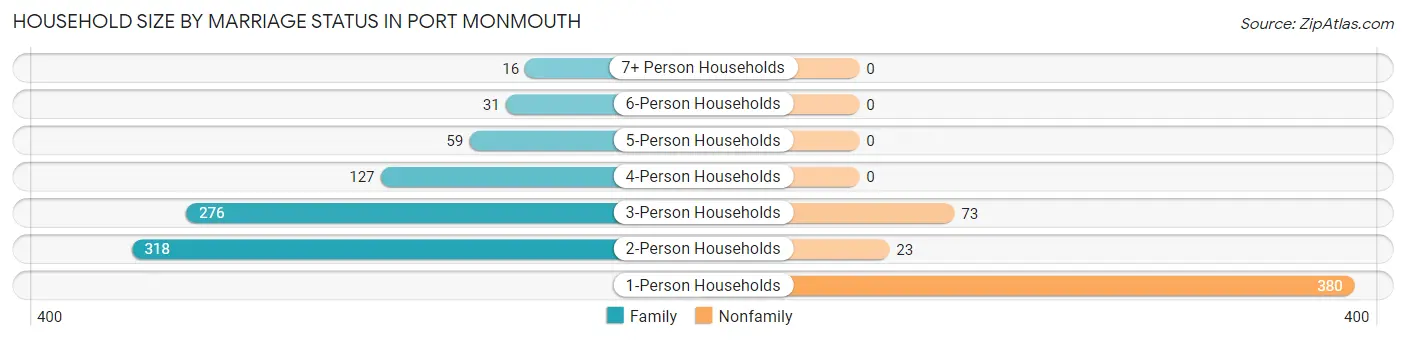
| Household Size | Family Households | Nonfamily Households |
| 1-Person Households | - | 380 (29.2%) |
| 2-Person Households | 318 (24.4%) | 23 (1.8%) |
| 3-Person Households | 276 (21.2%) | 73 (5.6%) |
| 4-Person Households | 127 (9.8%) | 0 (0.0%) |
| 5-Person Households | 59 (4.5%) | 0 (0.0%) |
| 6-Person Households | 31 (2.4%) | 0 (0.0%) |
| 7+ Person Households | 16 (1.2%) | 0 (0.0%) |
| Total | 827 (63.5%) | 476 (36.5%) |
Female Fertility in Port Monmouth
Fertility by Age in Port Monmouth
Average fertility rate in Port Monmouth is 25.0 births per 1,000 women. Women in the age bracket of 20 to 34 years have the highest fertility rate with 70.0 births per 1,000 women. Women in the age bracket of 20 to 34 years acount for 100.0% of all women with births.
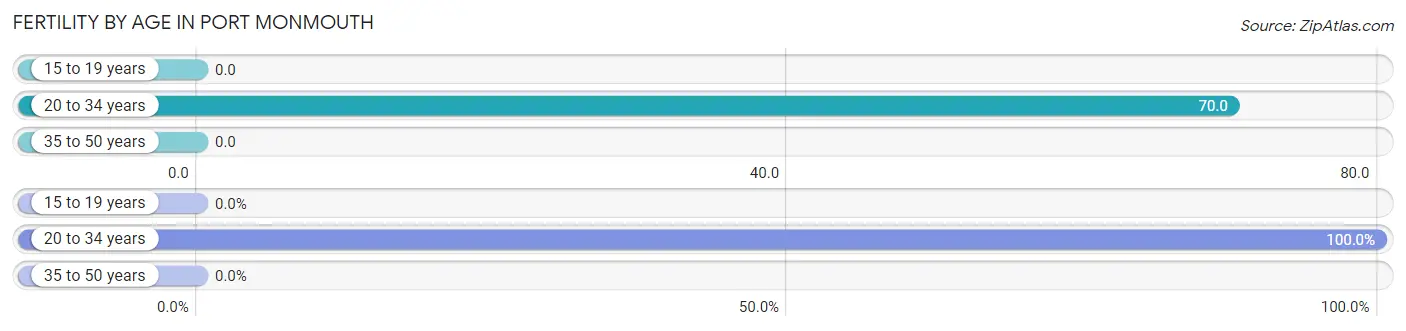
| Age Bracket | Women with Births | Births / 1,000 Women |
| 15 to 19 years | 0 (0.0%) | 0.0 |
| 20 to 34 years | 22 (100.0%) | 70.0 |
| 35 to 50 years | 0 (0.0%) | 0.0 |
| Total | 22 (100.0%) | 25.0 |
Fertility by Age by Marriage Status in Port Monmouth
40.9% of women with births (22) in Port Monmouth are married. The highest percentage of unmarried women with births falls into 20 to 34 years age bracket with 59.1% of them unmarried at the time of birth, while the lowest percentage of unmarried women with births belong to 20 to 34 years age bracket with 59.1% of them unmarried.
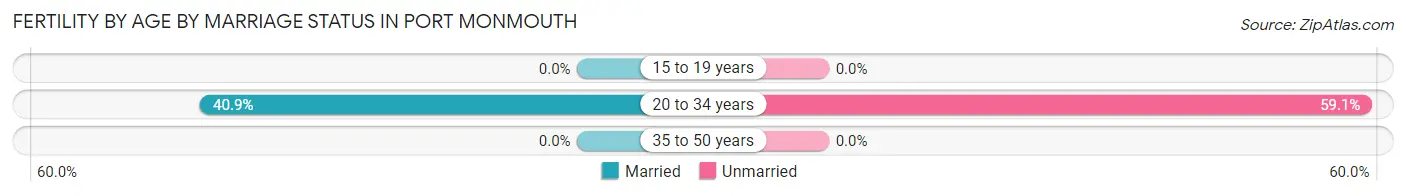
| Age Bracket | Married | Unmarried |
| 15 to 19 years | 0 (0.0%) | 0 (0.0%) |
| 20 to 34 years | 9 (40.9%) | 13 (59.1%) |
| 35 to 50 years | 0 (0.0%) | 0 (0.0%) |
| Total | 9 (40.9%) | 13 (59.1%) |
Fertility by Education in Port Monmouth

| Educational Attainment | Women with Births | Births / 1,000 Women |
| Less than High School | 0 (0.0%) | 0.0 |
| High School Diploma | 0 (0.0%) | 0.0 |
| College or Associate's Degree | 9 (40.9%) | 26.0 |
| Bachelor's Degree | 13 (59.1%) | 100.0 |
| Graduate Degree | 0 (0.0%) | 0.0 |
| Total | 22 (100.0%) | 25.0 |
Fertility by Education by Marriage Status in Port Monmouth
59.1% of women with births in Port Monmouth are unmarried. Women with the educational attainment of college or associate's degree are most likely to be married with 100.0% of them married at childbirth, while women with the educational attainment of bachelor's degree are least likely to be married with 100.0% of them unmarried at childbirth.
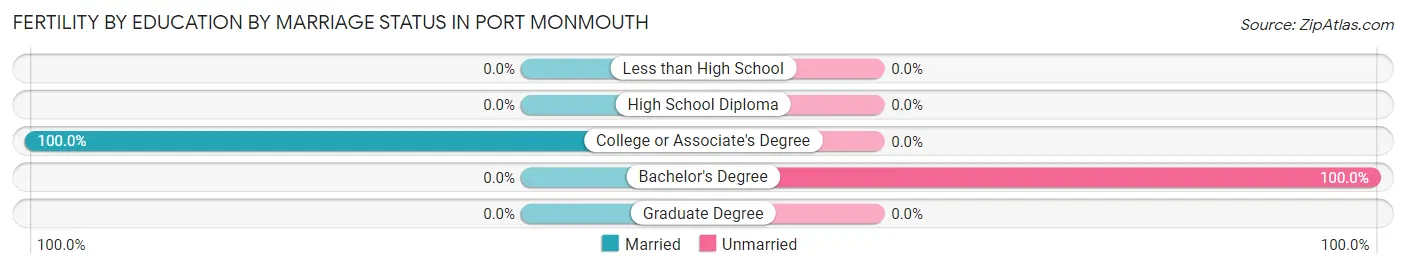
| Educational Attainment | Married | Unmarried |
| Less than High School | 0 (0.0%) | 0 (0.0%) |
| High School Diploma | 0 (0.0%) | 0 (0.0%) |
| College or Associate's Degree | 9 (100.0%) | 0 (0.0%) |
| Bachelor's Degree | 0 (0.0%) | 13 (100.0%) |
| Graduate Degree | 0 (0.0%) | 0 (0.0%) |
| Total | 9 (40.9%) | 13 (59.1%) |
Employment Characteristics in Port Monmouth
Employment by Class of Employer in Port Monmouth
Among the 1,747 employed individuals in Port Monmouth, private company employees (1,368 | 78.3%), local government employees (135 | 7.7%), and not-for-profit organizations (93 | 5.3%) make up the most common classes of employment.
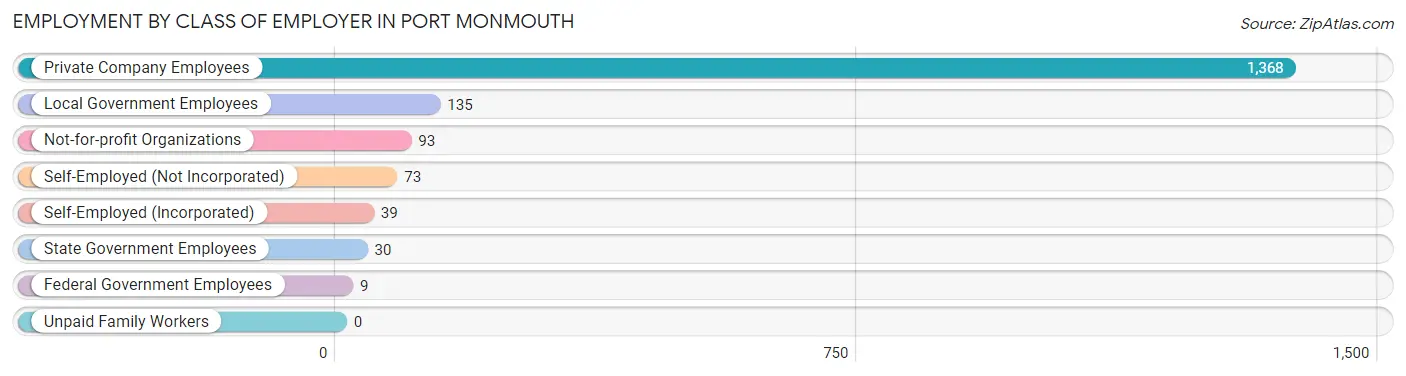
| Employer Class | # Employees | % Employees |
| Private Company Employees | 1,368 | 78.3% |
| Self-Employed (Incorporated) | 39 | 2.2% |
| Self-Employed (Not Incorporated) | 73 | 4.2% |
| Not-for-profit Organizations | 93 | 5.3% |
| Local Government Employees | 135 | 7.7% |
| State Government Employees | 30 | 1.7% |
| Federal Government Employees | 9 | 0.5% |
| Unpaid Family Workers | 0 | 0.0% |
| Total | 1,747 | 100.0% |
Employment Status by Age in Port Monmouth
According to the labor force statistics for Port Monmouth, out of the total population over 16 years of age (2,797), 68.6% or 1,919 individuals are in the labor force, with 7.3% or 140 of them unemployed. The age group with the highest labor force participation rate is 25 to 29 years, with 100.0% or 101 individuals in the labor force. Within the labor force, the 16 to 19 years age range has the highest percentage of unemployed individuals, with 20.5% or 16 of them being unemployed.
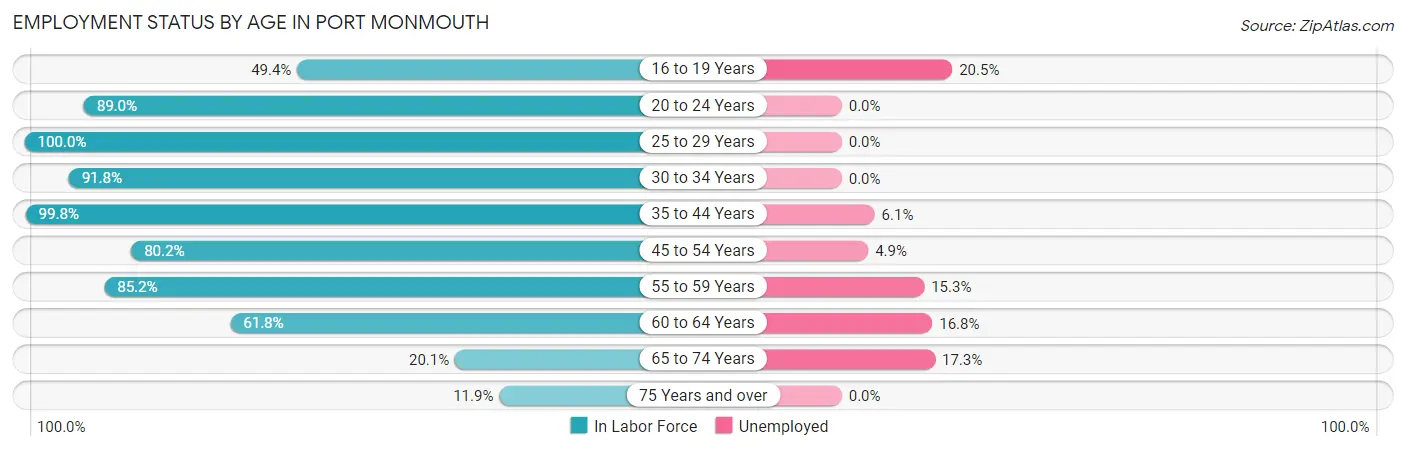
| Age Bracket | In Labor Force | Unemployed |
| 16 to 19 Years | 78 (49.4%) | 16 (20.5%) |
| 20 to 24 Years | 300 (89.0%) | 0 (0.0%) |
| 25 to 29 Years | 101 (100.0%) | 0 (0.0%) |
| 30 to 34 Years | 89 (91.8%) | 0 (0.0%) |
| 35 to 44 Years | 423 (99.8%) | 26 (6.1%) |
| 45 to 54 Years | 450 (80.2%) | 22 (4.9%) |
| 55 to 59 Years | 98 (85.2%) | 15 (15.3%) |
| 60 to 64 Years | 286 (61.8%) | 48 (16.8%) |
| 65 to 74 Years | 75 (20.1%) | 13 (17.3%) |
| 75 Years and over | 20 (11.9%) | 0 (0.0%) |
| Total | 1,919 (68.6%) | 140 (7.3%) |
Employment Status by Educational Attainment in Port Monmouth
According to labor force statistics for Port Monmouth, 82.2% of individuals (1,448) out of the total population between 25 and 64 years of age (1,761) are in the labor force, with 7.7% or 111 of them being unemployed. The group with the highest labor force participation rate are those with the educational attainment of bachelor's degree or higher, with 95.4% or 495 individuals in the labor force. Within the labor force, individuals with college / associate degree education have the highest percentage of unemployment, with 15.3% or 68 of them being unemployed.
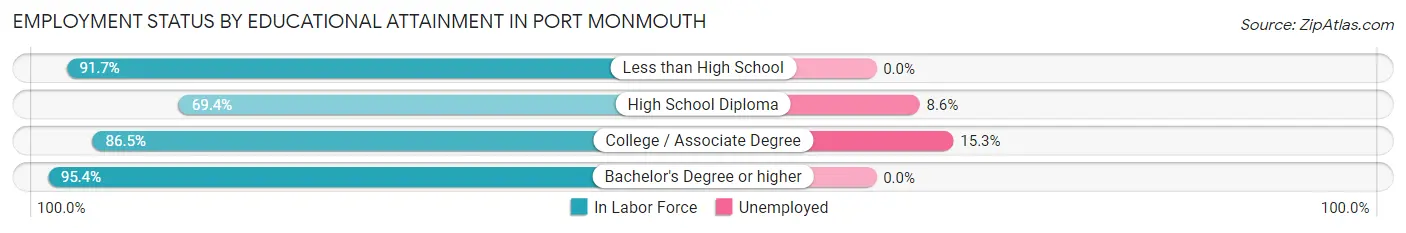
| Educational Attainment | In Labor Force | Unemployed |
| Less than High School | 11 (91.7%) | 0 (0.0%) |
| High School Diploma | 498 (69.4%) | 62 (8.6%) |
| College / Associate Degree | 443 (86.5%) | 78 (15.3%) |
| Bachelor's Degree or higher | 495 (95.4%) | 0 (0.0%) |
| Total | 1,448 (82.2%) | 136 (7.7%) |
Employment Occupations by Sex in Port Monmouth
Management, Business, Science and Arts Occupations
The most common Management, Business, Science and Arts occupations in Port Monmouth are Health Diagnosing & Treating (175 | 9.8%), Management (163 | 9.2%), Community & Social Service (145 | 8.2%), Computers, Engineering & Science (122 | 6.9%), and Business & Financial (105 | 5.9%).
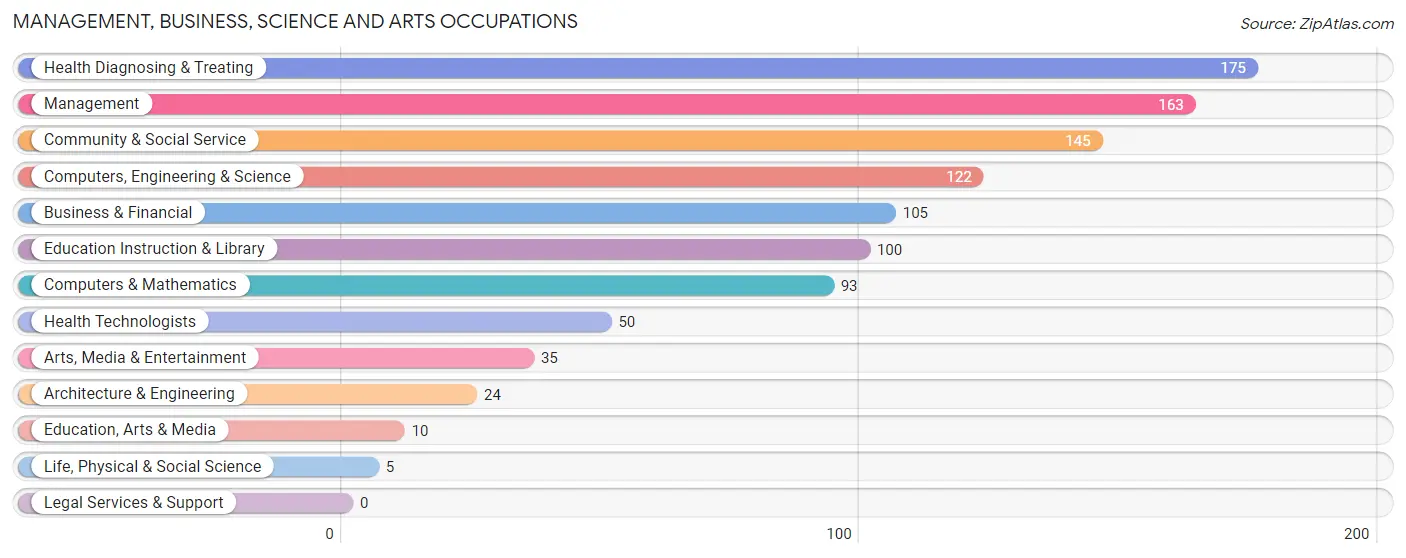
Management, Business, Science and Arts Occupations by Sex
Within the Management, Business, Science and Arts occupations in Port Monmouth, the most male-oriented occupations are Architecture & Engineering (100.0%), Arts, Media & Entertainment (65.7%), and Computers, Engineering & Science (57.4%), while the most female-oriented occupations are Life, Physical & Social Science (100.0%), Education, Arts & Media (100.0%), and Health Diagnosing & Treating (85.1%).
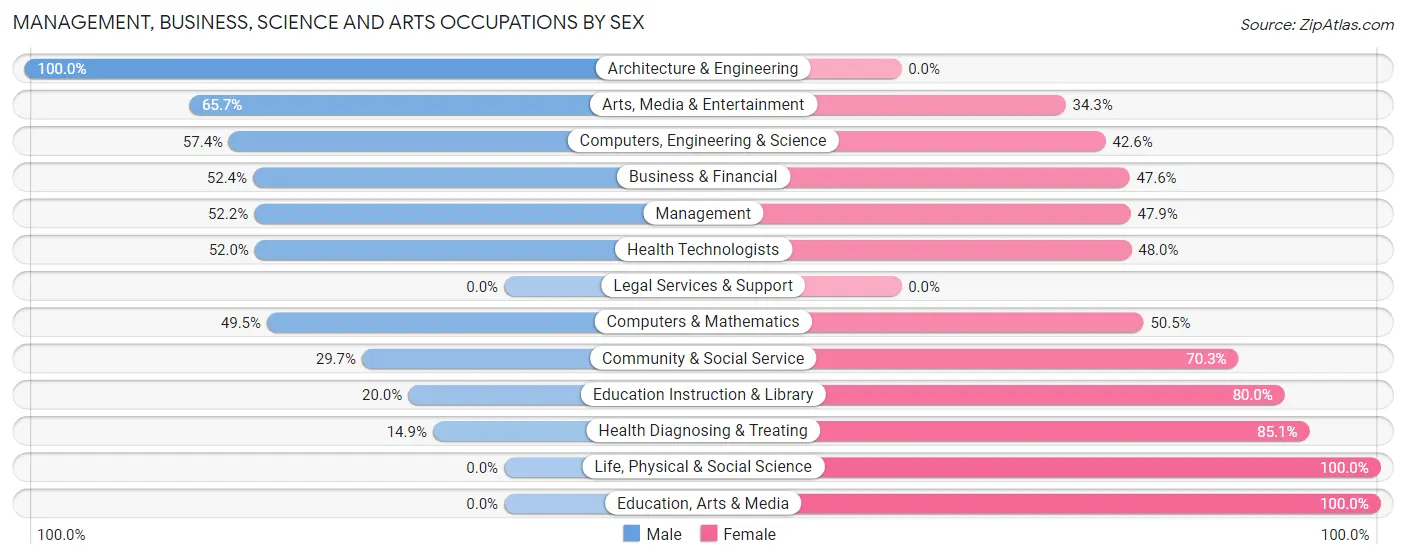
| Occupation | Male | Female |
| Management | 85 (52.1%) | 78 (47.8%) |
| Business & Financial | 55 (52.4%) | 50 (47.6%) |
| Computers, Engineering & Science | 70 (57.4%) | 52 (42.6%) |
| Computers & Mathematics | 46 (49.5%) | 47 (50.5%) |
| Architecture & Engineering | 24 (100.0%) | 0 (0.0%) |
| Life, Physical & Social Science | 0 (0.0%) | 5 (100.0%) |
| Community & Social Service | 43 (29.7%) | 102 (70.3%) |
| Education, Arts & Media | 0 (0.0%) | 10 (100.0%) |
| Legal Services & Support | 0 (0.0%) | 0 (0.0%) |
| Education Instruction & Library | 20 (20.0%) | 80 (80.0%) |
| Arts, Media & Entertainment | 23 (65.7%) | 12 (34.3%) |
| Health Diagnosing & Treating | 26 (14.9%) | 149 (85.1%) |
| Health Technologists | 26 (52.0%) | 24 (48.0%) |
| Total (Category) | 279 (39.3%) | 431 (60.7%) |
| Total (Overall) | 853 (47.9%) | 927 (52.1%) |
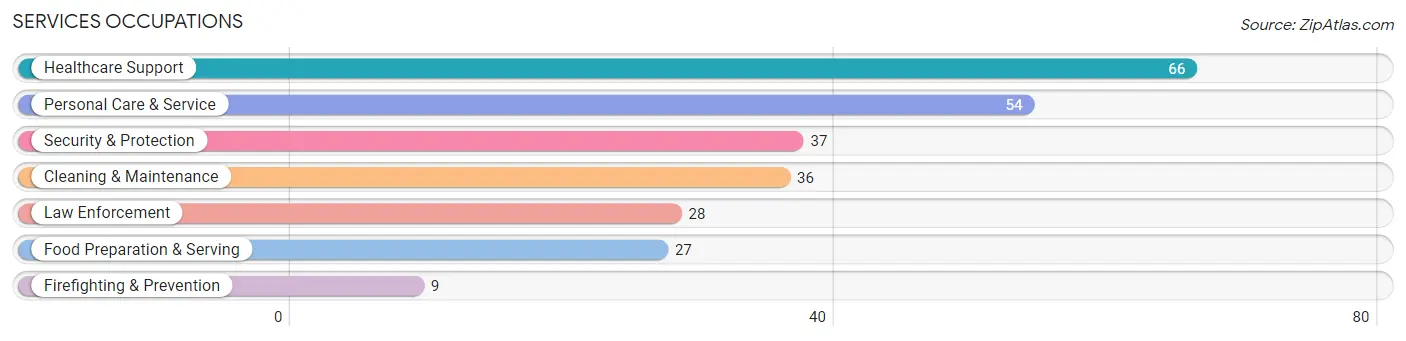
Services Occupations
The most common Services occupations in Port Monmouth are Healthcare Support (66 | 3.7%), Personal Care & Service (54 | 3.0%), Security & Protection (37 | 2.1%), Cleaning & Maintenance (36 | 2.0%), and Law Enforcement (28 | 1.6%).
Services Occupations by Sex
Within the Services occupations in Port Monmouth, the most male-oriented occupations are Firefighting & Prevention (100.0%), Food Preparation & Serving (100.0%), and Cleaning & Maintenance (100.0%), while the most female-oriented occupations are Healthcare Support (100.0%), Personal Care & Service (64.8%), and Law Enforcement (28.6%).
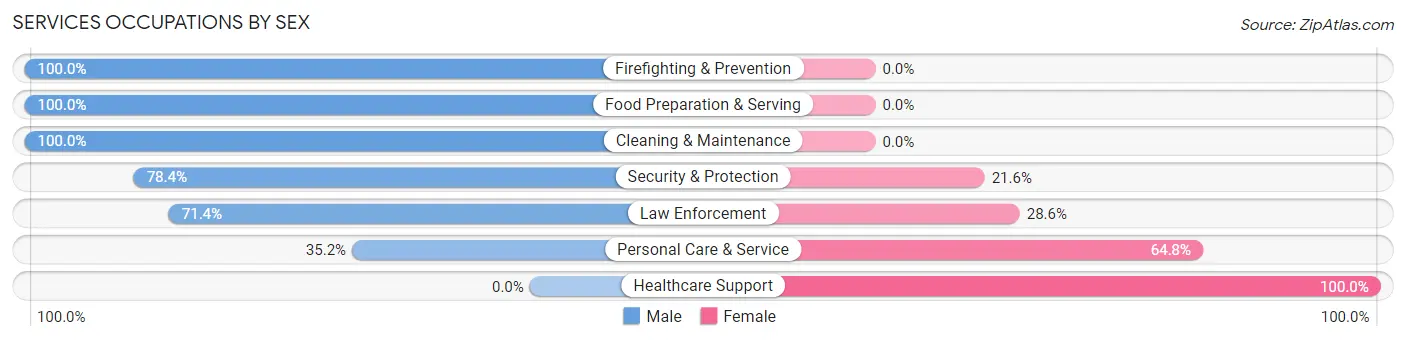
| Occupation | Male | Female |
| Healthcare Support | 0 (0.0%) | 66 (100.0%) |
| Security & Protection | 29 (78.4%) | 8 (21.6%) |
| Firefighting & Prevention | 9 (100.0%) | 0 (0.0%) |
| Law Enforcement | 20 (71.4%) | 8 (28.6%) |
| Food Preparation & Serving | 27 (100.0%) | 0 (0.0%) |
| Cleaning & Maintenance | 36 (100.0%) | 0 (0.0%) |
| Personal Care & Service | 19 (35.2%) | 35 (64.8%) |
| Total (Category) | 111 (50.4%) | 109 (49.5%) |
| Total (Overall) | 853 (47.9%) | 927 (52.1%) |
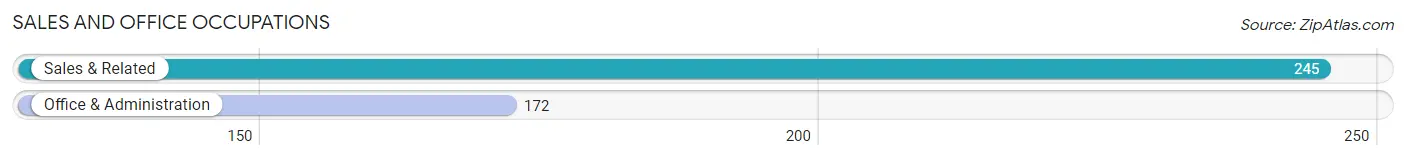
Sales and Office Occupations
The most common Sales and Office occupations in Port Monmouth are Sales & Related (245 | 13.8%), and Office & Administration (172 | 9.7%).
Sales and Office Occupations by Sex
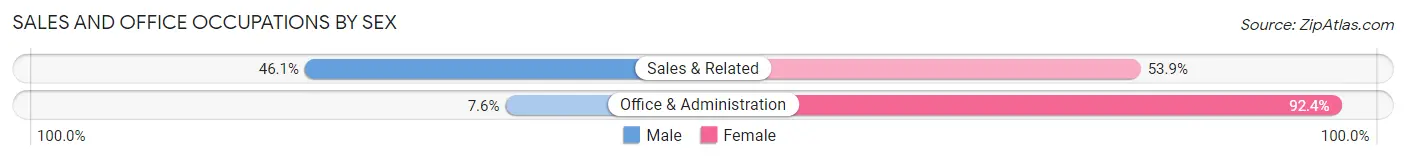
| Occupation | Male | Female |
| Sales & Related | 113 (46.1%) | 132 (53.9%) |
| Office & Administration | 13 (7.6%) | 159 (92.4%) |
| Total (Category) | 126 (30.2%) | 291 (69.8%) |
| Total (Overall) | 853 (47.9%) | 927 (52.1%) |
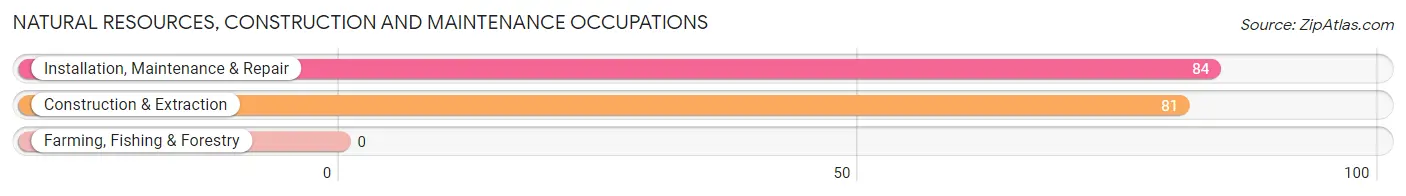
Natural Resources, Construction and Maintenance Occupations
The most common Natural Resources, Construction and Maintenance occupations in Port Monmouth are Installation, Maintenance & Repair (84 | 4.7%), and Construction & Extraction (81 | 4.5%).
Natural Resources, Construction and Maintenance Occupations by Sex
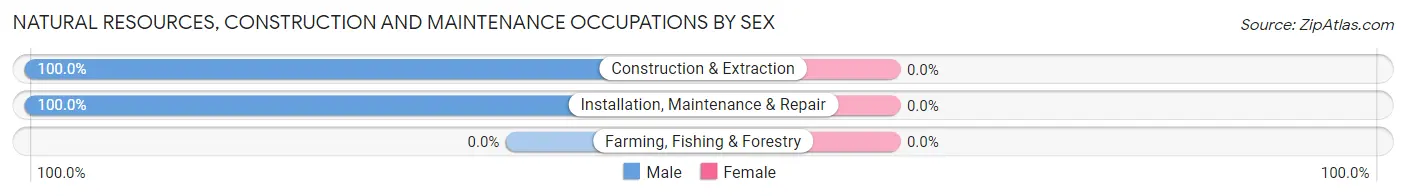
| Occupation | Male | Female |
| Farming, Fishing & Forestry | 0 (0.0%) | 0 (0.0%) |
| Construction & Extraction | 81 (100.0%) | 0 (0.0%) |
| Installation, Maintenance & Repair | 84 (100.0%) | 0 (0.0%) |
| Total (Category) | 165 (100.0%) | 0 (0.0%) |
| Total (Overall) | 853 (47.9%) | 927 (52.1%) |
Production, Transportation and Moving Occupations
The most common Production, Transportation and Moving occupations in Port Monmouth are Material Moving (132 | 7.4%), Production (76 | 4.3%), and Transportation (60 | 3.4%).
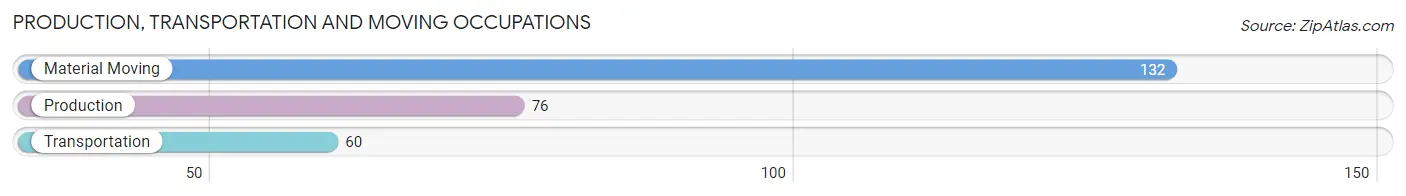
Production, Transportation and Moving Occupations by Sex
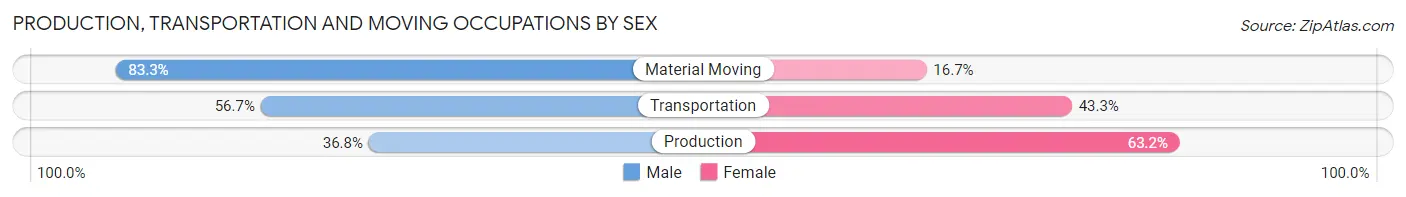
| Occupation | Male | Female |
| Production | 28 (36.8%) | 48 (63.2%) |
| Transportation | 34 (56.7%) | 26 (43.3%) |
| Material Moving | 110 (83.3%) | 22 (16.7%) |
| Total (Category) | 172 (64.2%) | 96 (35.8%) |
| Total (Overall) | 853 (47.9%) | 927 (52.1%) |
Employment Industries by Sex in Port Monmouth
Employment Industries in Port Monmouth
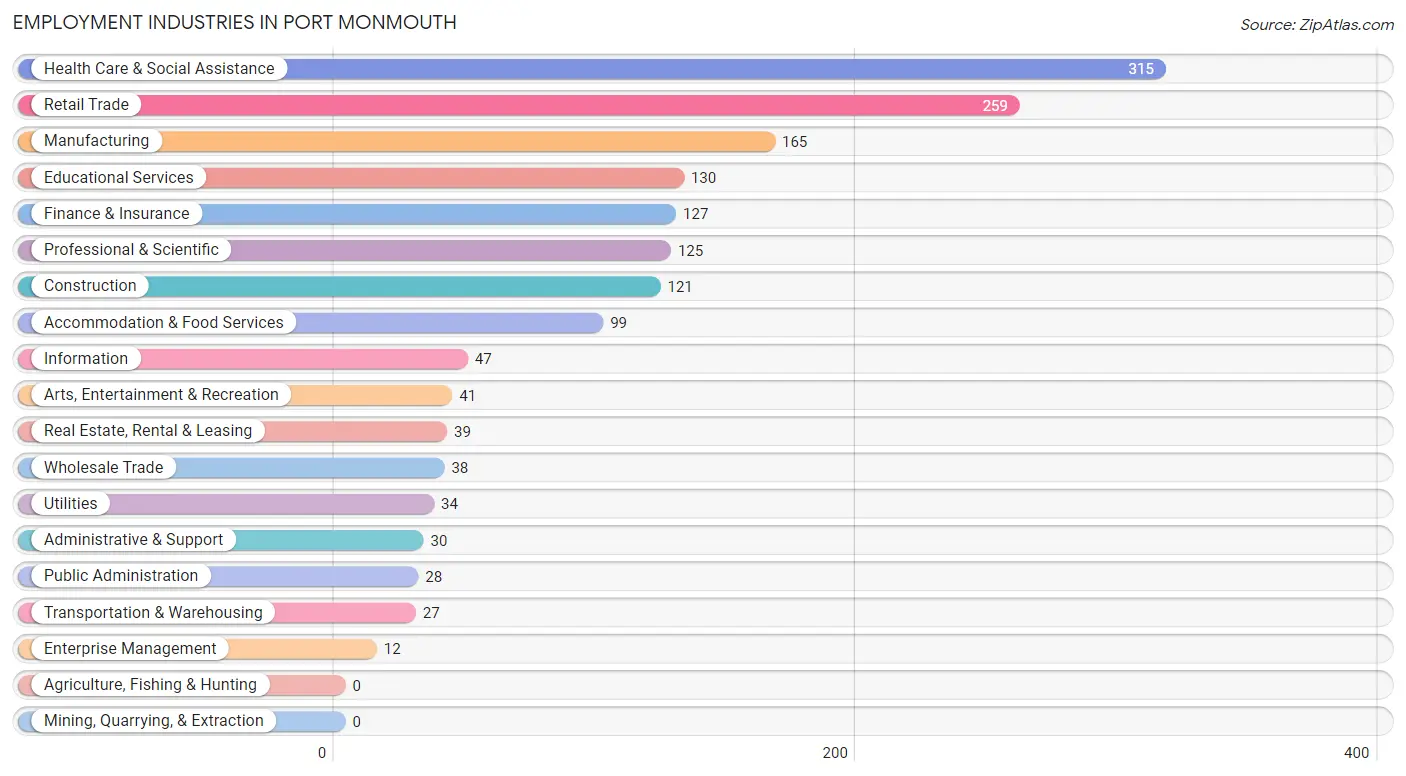
The major employment industries in Port Monmouth include Health Care & Social Assistance (315 | 17.7%), Retail Trade (259 | 14.5%), Manufacturing (165 | 9.3%), Educational Services (130 | 7.3%), and Finance & Insurance (127 | 7.1%).
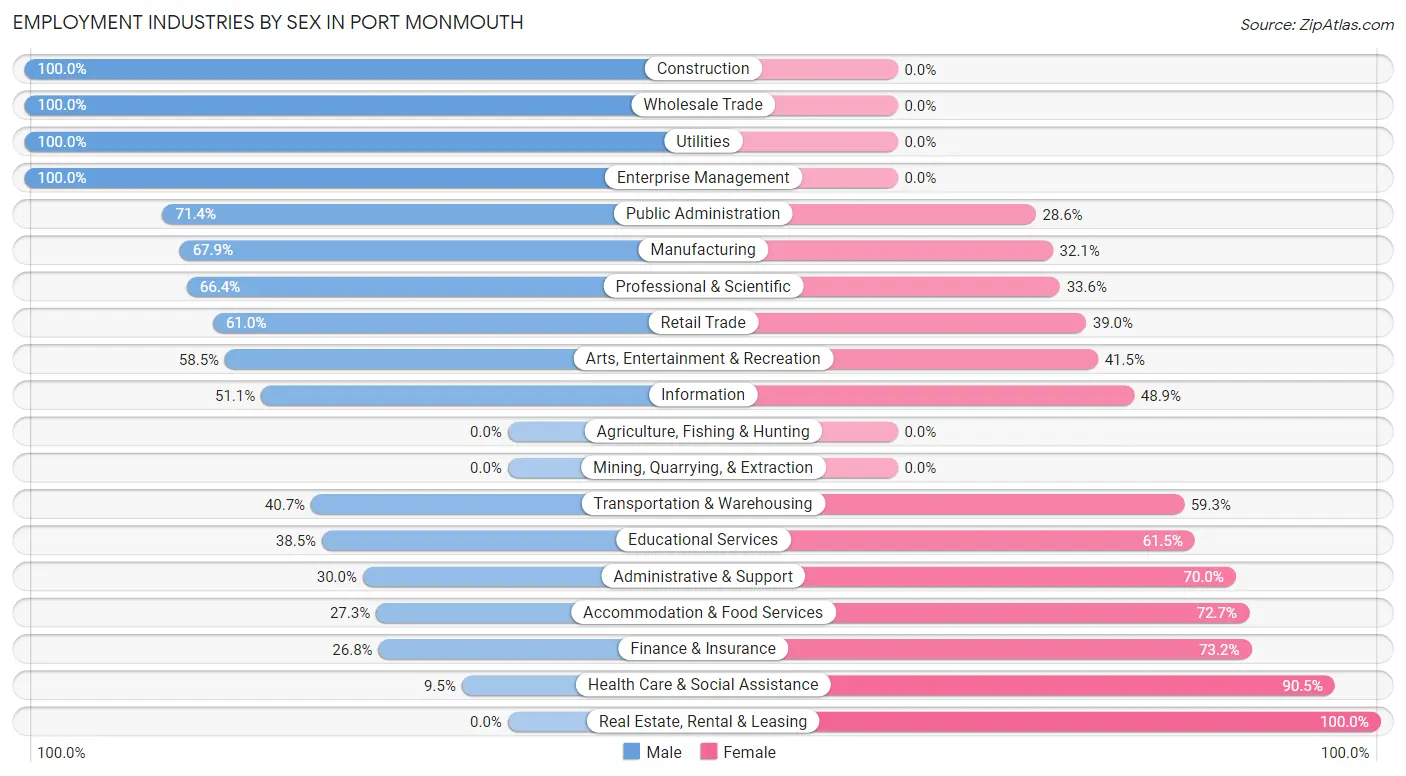
Employment Industries by Sex in Port Monmouth
The Port Monmouth industries that see more men than women are Construction (100.0%), Wholesale Trade (100.0%), and Utilities (100.0%), whereas the industries that tend to have a higher number of women are Real Estate, Rental & Leasing (100.0%), Health Care & Social Assistance (90.5%), and Finance & Insurance (73.2%).
| Industry | Male | Female |
| Agriculture, Fishing & Hunting | 0 (0.0%) | 0 (0.0%) |
| Mining, Quarrying, & Extraction | 0 (0.0%) | 0 (0.0%) |
| Construction | 121 (100.0%) | 0 (0.0%) |
| Manufacturing | 112 (67.9%) | 53 (32.1%) |
| Wholesale Trade | 38 (100.0%) | 0 (0.0%) |
| Retail Trade | 158 (61.0%) | 101 (39.0%) |
| Transportation & Warehousing | 11 (40.7%) | 16 (59.3%) |
| Utilities | 34 (100.0%) | 0 (0.0%) |
| Information | 24 (51.1%) | 23 (48.9%) |
| Finance & Insurance | 34 (26.8%) | 93 (73.2%) |
| Real Estate, Rental & Leasing | 0 (0.0%) | 39 (100.0%) |
| Professional & Scientific | 83 (66.4%) | 42 (33.6%) |
| Enterprise Management | 12 (100.0%) | 0 (0.0%) |
| Administrative & Support | 9 (30.0%) | 21 (70.0%) |
| Educational Services | 50 (38.5%) | 80 (61.5%) |
| Health Care & Social Assistance | 30 (9.5%) | 285 (90.5%) |
| Arts, Entertainment & Recreation | 24 (58.5%) | 17 (41.5%) |
| Accommodation & Food Services | 27 (27.3%) | 72 (72.7%) |
| Public Administration | 20 (71.4%) | 8 (28.6%) |
| Total | 853 (47.9%) | 927 (52.1%) |
Education in Port Monmouth
School Enrollment in Port Monmouth
The most common levels of schooling among the 498 students in Port Monmouth are high school (191 | 38.4%), elementary school (88 | 17.7%), and middle school (81 | 16.3%).
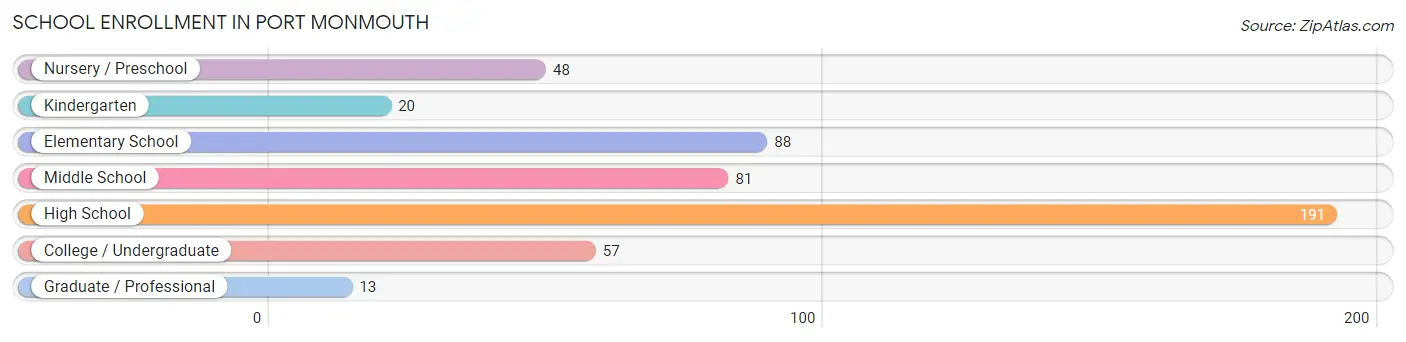
| School Level | # Students | % Students |
| Nursery / Preschool | 48 | 9.6% |
| Kindergarten | 20 | 4.0% |
| Elementary School | 88 | 17.7% |
| Middle School | 81 | 16.3% |
| High School | 191 | 38.4% |
| College / Undergraduate | 57 | 11.5% |
| Graduate / Professional | 13 | 2.6% |
| Total | 498 | 100.0% |
School Enrollment by Age by Funding Source in Port Monmouth
Out of a total of 498 students who are enrolled in schools in Port Monmouth, 101 (20.3%) attend a private institution, while the remaining 397 (79.7%) are enrolled in public schools. The age group of 25 to 34 year olds has the highest likelihood of being enrolled in private schools, with 22 (100.0% in the age bracket) enrolled. Conversely, the age group of 3 to 4 year olds has the lowest likelihood of being enrolled in a private school, with 48 (100.0% in the age bracket) attending a public institution.
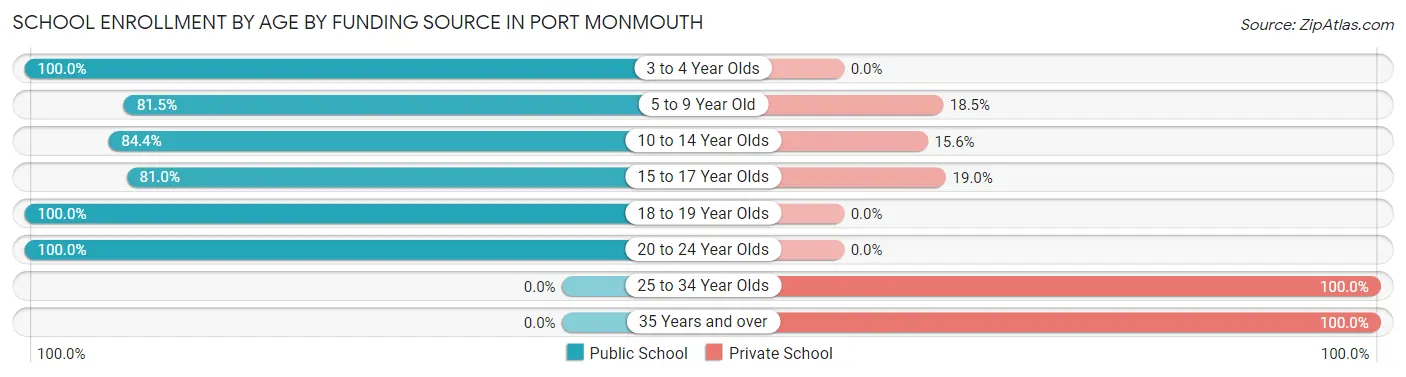
| Age Bracket | Public School | Private School |
| 3 to 4 Year Olds | 48 (100.0%) | 0 (0.0%) |
| 5 to 9 Year Old | 75 (81.5%) | 17 (18.5%) |
| 10 to 14 Year Olds | 92 (84.4%) | 17 (15.6%) |
| 15 to 17 Year Olds | 145 (81.0%) | 34 (19.0%) |
| 18 to 19 Year Olds | 16 (100.0%) | 0 (0.0%) |
| 20 to 24 Year Olds | 21 (100.0%) | 0 (0.0%) |
| 25 to 34 Year Olds | 0 (0.0%) | 22 (100.0%) |
| 35 Years and over | 0 (0.0%) | 11 (100.0%) |
| Total | 397 (79.7%) | 101 (20.3%) |
Educational Attainment by Field of Study in Port Monmouth
Psychology (145 | 21.2%), business (122 | 17.8%), arts & humanities (87 | 12.7%), communications (66 | 9.7%), and social sciences (58 | 8.5%) are the most common fields of study among 684 individuals in Port Monmouth who have obtained a bachelor's degree or higher.
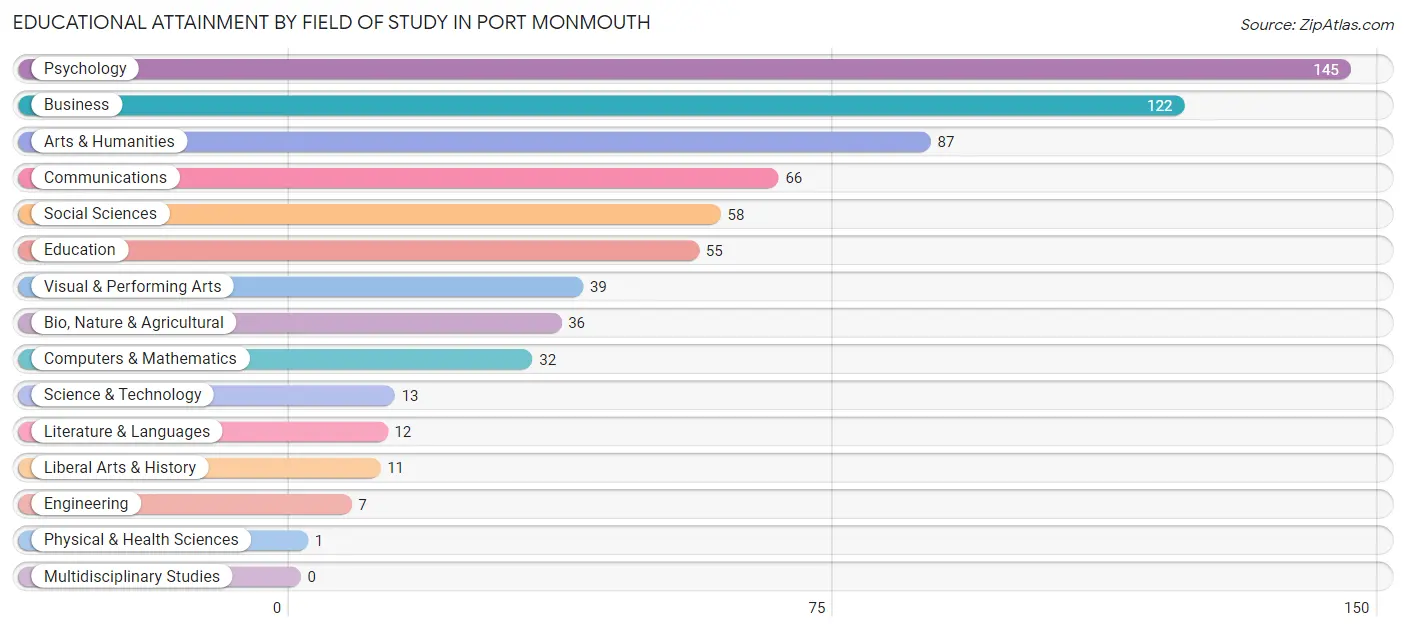
| Field of Study | # Graduates | % Graduates |
| Computers & Mathematics | 32 | 4.7% |
| Bio, Nature & Agricultural | 36 | 5.3% |
| Physical & Health Sciences | 1 | 0.2% |
| Psychology | 145 | 21.2% |
| Social Sciences | 58 | 8.5% |
| Engineering | 7 | 1.0% |
| Multidisciplinary Studies | 0 | 0.0% |
| Science & Technology | 13 | 1.9% |
| Business | 122 | 17.8% |
| Education | 55 | 8.0% |
| Literature & Languages | 12 | 1.8% |
| Liberal Arts & History | 11 | 1.6% |
| Visual & Performing Arts | 39 | 5.7% |
| Communications | 66 | 9.7% |
| Arts & Humanities | 87 | 12.7% |
| Total | 684 | 100.0% |
Transportation & Commute in Port Monmouth
Vehicle Availability by Sex in Port Monmouth
The most prevalent vehicle ownership categories in Port Monmouth are males with 3 vehicles (375, accounting for 46.0%) and females with 3 vehicles (406, making up 40.5%).
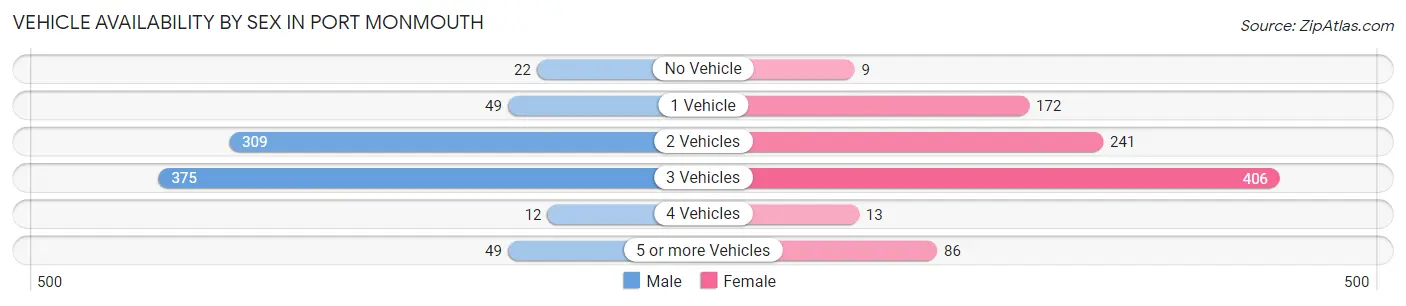
| Vehicles Available | Male | Female |
| No Vehicle | 22 (2.7%) | 9 (1.0%) |
| 1 Vehicle | 49 (6.0%) | 172 (18.5%) |
| 2 Vehicles | 309 (37.9%) | 241 (26.0%) |
| 3 Vehicles | 375 (46.0%) | 406 (43.8%) |
| 4 Vehicles | 12 (1.5%) | 13 (1.4%) |
| 5 or more Vehicles | 49 (6.0%) | 86 (9.3%) |
| Total | 816 (100.0%) | 927 (100.0%) |
Commute Time in Port Monmouth
The most frequently occuring commute durations in Port Monmouth are 60 to 89 minutes (270 commuters, 17.3%), 30 to 34 minutes (249 commuters, 15.9%), and 45 to 59 minutes (247 commuters, 15.8%).
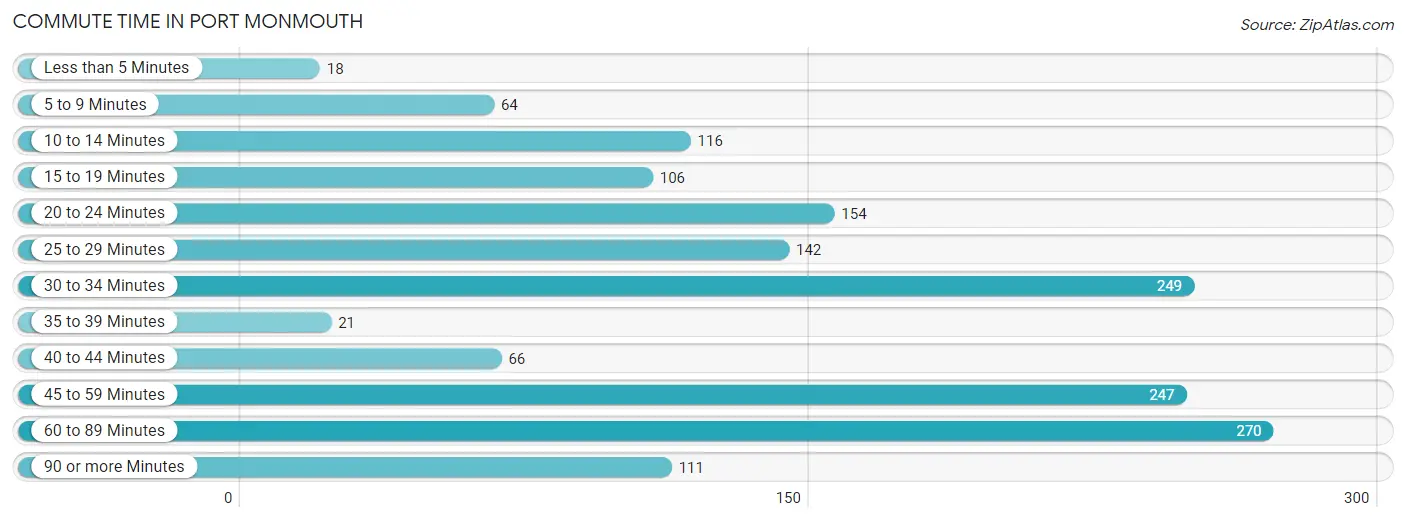
| Commute Time | # Commuters | % Commuters |
| Less than 5 Minutes | 18 | 1.1% |
| 5 to 9 Minutes | 64 | 4.1% |
| 10 to 14 Minutes | 116 | 7.4% |
| 15 to 19 Minutes | 106 | 6.8% |
| 20 to 24 Minutes | 154 | 9.9% |
| 25 to 29 Minutes | 142 | 9.1% |
| 30 to 34 Minutes | 249 | 15.9% |
| 35 to 39 Minutes | 21 | 1.3% |
| 40 to 44 Minutes | 66 | 4.2% |
| 45 to 59 Minutes | 247 | 15.8% |
| 60 to 89 Minutes | 270 | 17.3% |
| 90 or more Minutes | 111 | 7.1% |
Commute Time by Sex in Port Monmouth
The most common commute times in Port Monmouth are 60 to 89 minutes (166 commuters, 21.5%) for males and 30 to 34 minutes (136 commuters, 17.2%) for females.
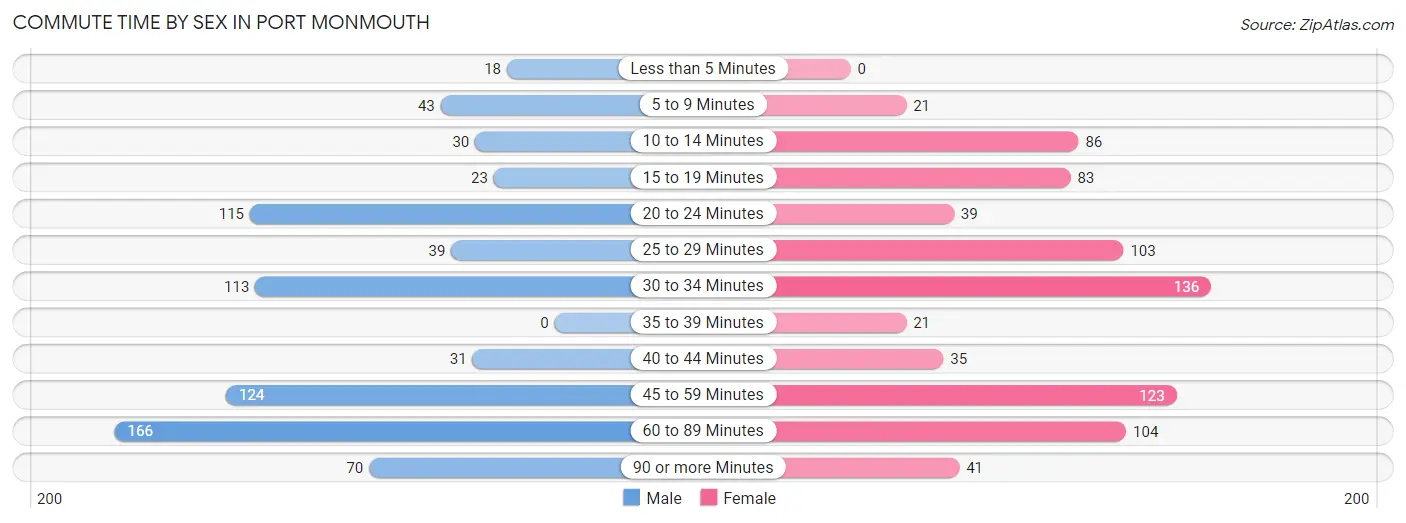
| Commute Time | Male | Female |
| Less than 5 Minutes | 18 (2.3%) | 0 (0.0%) |
| 5 to 9 Minutes | 43 (5.6%) | 21 (2.6%) |
| 10 to 14 Minutes | 30 (3.9%) | 86 (10.9%) |
| 15 to 19 Minutes | 23 (3.0%) | 83 (10.5%) |
| 20 to 24 Minutes | 115 (14.9%) | 39 (4.9%) |
| 25 to 29 Minutes | 39 (5.1%) | 103 (13.0%) |
| 30 to 34 Minutes | 113 (14.6%) | 136 (17.2%) |
| 35 to 39 Minutes | 0 (0.0%) | 21 (2.6%) |
| 40 to 44 Minutes | 31 (4.0%) | 35 (4.4%) |
| 45 to 59 Minutes | 124 (16.1%) | 123 (15.5%) |
| 60 to 89 Minutes | 166 (21.5%) | 104 (13.1%) |
| 90 or more Minutes | 70 (9.1%) | 41 (5.2%) |
Time of Departure to Work by Sex in Port Monmouth
The most frequent times of departure to work in Port Monmouth are 7:30 AM to 7:59 AM (156, 20.2%) for males and 6:30 AM to 6:59 AM (134, 16.9%) for females.
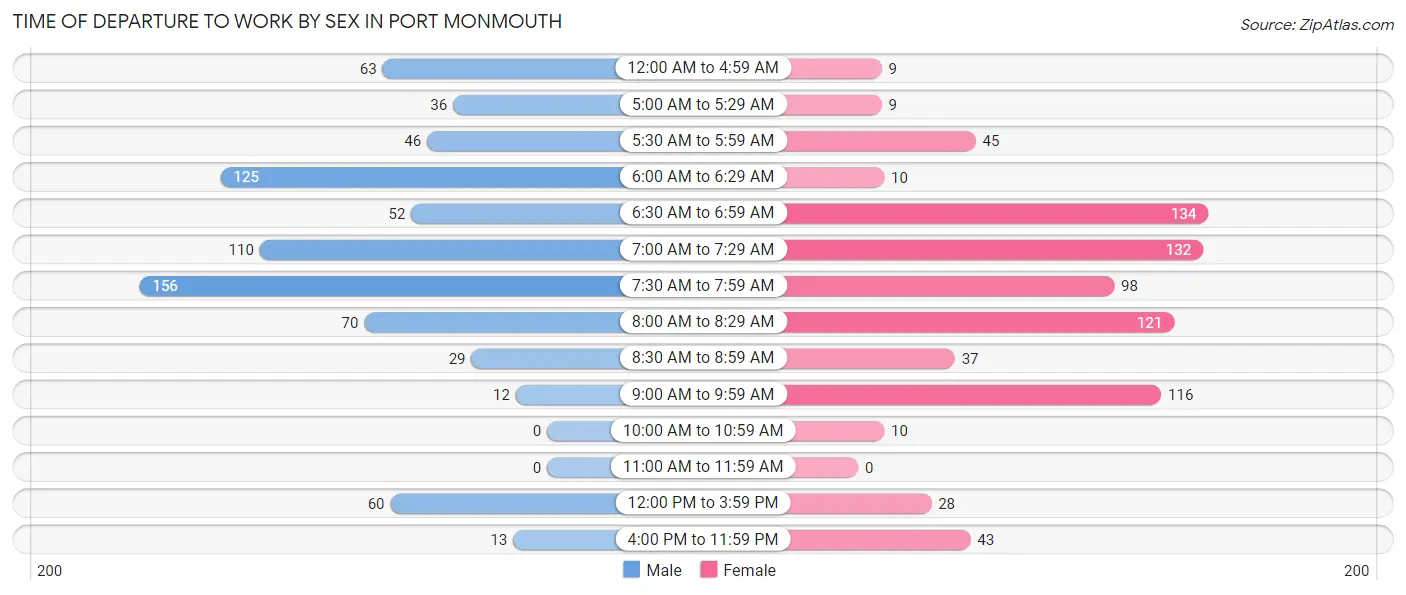
| Time of Departure | Male | Female |
| 12:00 AM to 4:59 AM | 63 (8.2%) | 9 (1.1%) |
| 5:00 AM to 5:29 AM | 36 (4.7%) | 9 (1.1%) |
| 5:30 AM to 5:59 AM | 46 (6.0%) | 45 (5.7%) |
| 6:00 AM to 6:29 AM | 125 (16.2%) | 10 (1.3%) |
| 6:30 AM to 6:59 AM | 52 (6.7%) | 134 (16.9%) |
| 7:00 AM to 7:29 AM | 110 (14.2%) | 132 (16.7%) |
| 7:30 AM to 7:59 AM | 156 (20.2%) | 98 (12.4%) |
| 8:00 AM to 8:29 AM | 70 (9.1%) | 121 (15.3%) |
| 8:30 AM to 8:59 AM | 29 (3.8%) | 37 (4.7%) |
| 9:00 AM to 9:59 AM | 12 (1.5%) | 116 (14.6%) |
| 10:00 AM to 10:59 AM | 0 (0.0%) | 10 (1.3%) |
| 11:00 AM to 11:59 AM | 0 (0.0%) | 0 (0.0%) |
| 12:00 PM to 3:59 PM | 60 (7.8%) | 28 (3.5%) |
| 4:00 PM to 11:59 PM | 13 (1.7%) | 43 (5.4%) |
| Total | 772 (100.0%) | 792 (100.0%) |
Housing Occupancy in Port Monmouth
Occupancy by Ownership in Port Monmouth
Of the total 1,303 dwellings in Port Monmouth, owner-occupied units account for 1,020 (78.3%), while renter-occupied units make up 283 (21.7%).
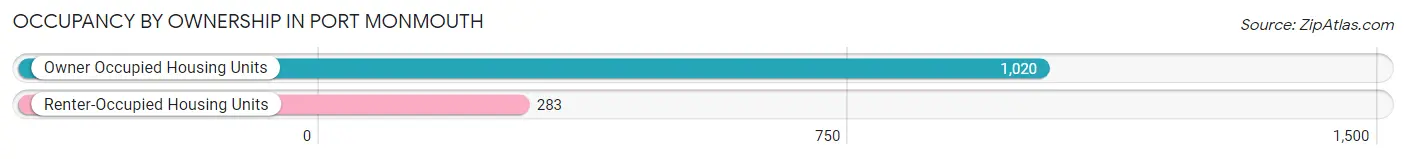
| Occupancy | # Housing Units | % Housing Units |
| Owner Occupied Housing Units | 1,020 | 78.3% |
| Renter-Occupied Housing Units | 283 | 21.7% |
| Total Occupied Housing Units | 1,303 | 100.0% |
Occupancy by Household Size in Port Monmouth
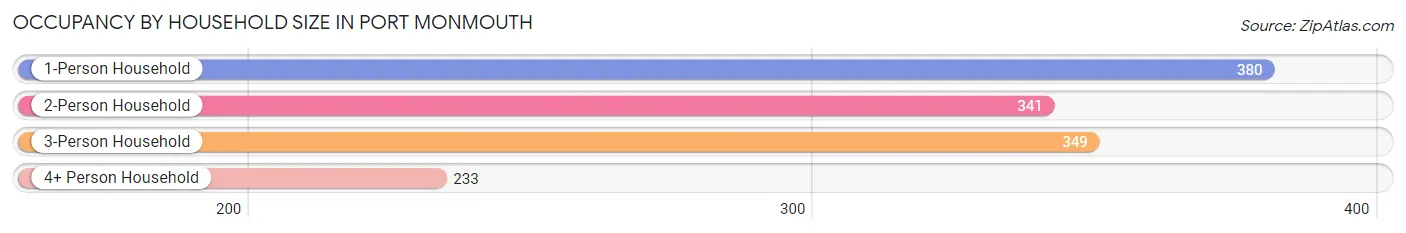
| Household Size | # Housing Units | % Housing Units |
| 1-Person Household | 380 | 29.2% |
| 2-Person Household | 341 | 26.2% |
| 3-Person Household | 349 | 26.8% |
| 4+ Person Household | 233 | 17.9% |
| Total Housing Units | 1,303 | 100.0% |
Occupancy by Ownership by Household Size in Port Monmouth
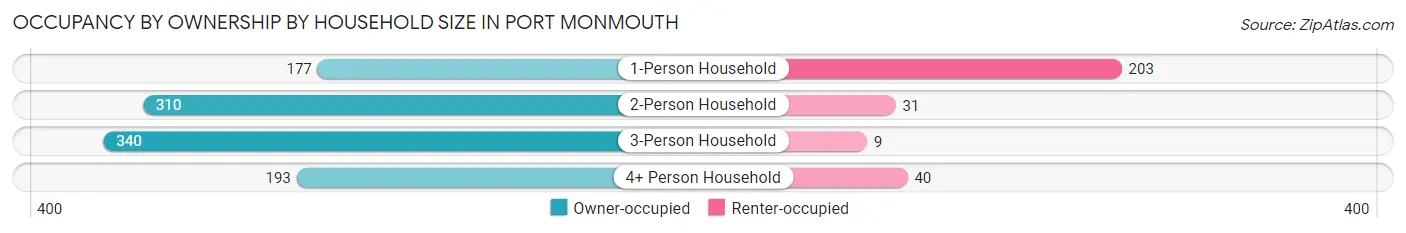
| Household Size | Owner-occupied | Renter-occupied |
| 1-Person Household | 177 (46.6%) | 203 (53.4%) |
| 2-Person Household | 310 (90.9%) | 31 (9.1%) |
| 3-Person Household | 340 (97.4%) | 9 (2.6%) |
| 4+ Person Household | 193 (82.8%) | 40 (17.2%) |
| Total Housing Units | 1,020 (78.3%) | 283 (21.7%) |
Occupancy by Educational Attainment in Port Monmouth
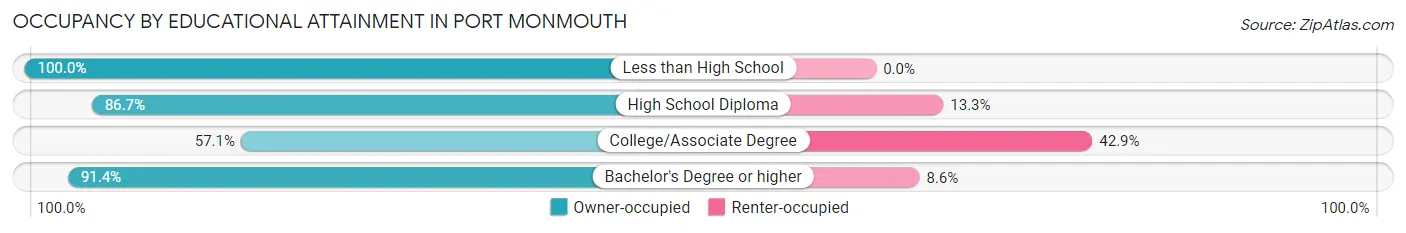
| Household Size | Owner-occupied | Renter-occupied |
| Less than High School | 28 (100.0%) | 0 (0.0%) |
| High School Diploma | 410 (86.7%) | 63 (13.3%) |
| College/Associate Degree | 252 (57.1%) | 189 (42.9%) |
| Bachelor's Degree or higher | 330 (91.4%) | 31 (8.6%) |
Occupancy by Age of Householder in Port Monmouth
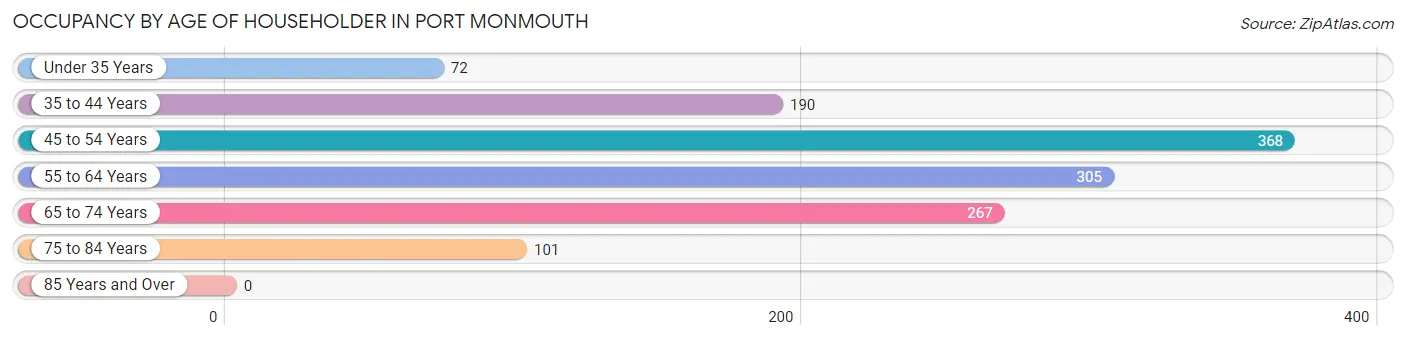
| Age Bracket | # Households | % Households |
| Under 35 Years | 72 | 5.5% |
| 35 to 44 Years | 190 | 14.6% |
| 45 to 54 Years | 368 | 28.2% |
| 55 to 64 Years | 305 | 23.4% |
| 65 to 74 Years | 267 | 20.5% |
| 75 to 84 Years | 101 | 7.7% |
| 85 Years and Over | 0 | 0.0% |
| Total | 1,303 | 100.0% |
Housing Finances in Port Monmouth
Median Income by Occupancy in Port Monmouth
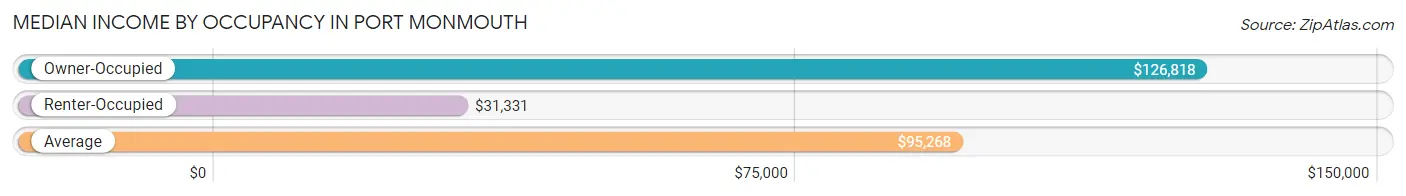
| Occupancy Type | # Households | Median Income |
| Owner-Occupied | 1,020 (78.3%) | $126,818 |
| Renter-Occupied | 283 (21.7%) | $31,331 |
| Average | 1,303 (100.0%) | $95,268 |
Occupancy by Householder Income Bracket in Port Monmouth
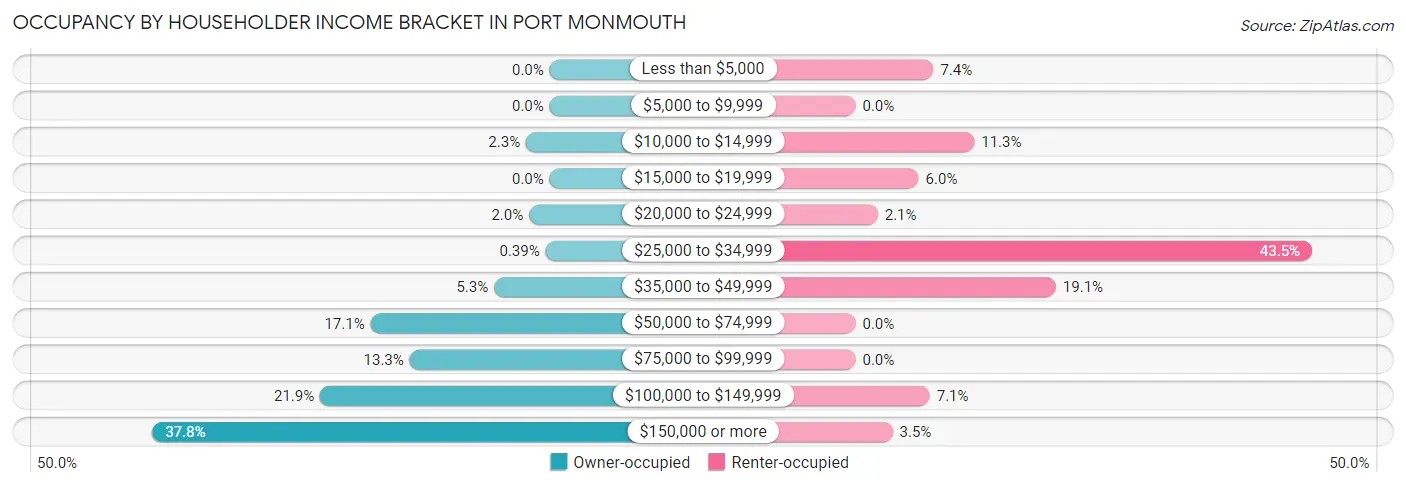
| Income Bracket | Owner-occupied | Renter-occupied |
| Less than $5,000 | 0 (0.0%) | 21 (7.4%) |
| $5,000 to $9,999 | 0 (0.0%) | 0 (0.0%) |
| $10,000 to $14,999 | 23 (2.2%) | 32 (11.3%) |
| $15,000 to $19,999 | 0 (0.0%) | 17 (6.0%) |
| $20,000 to $24,999 | 20 (2.0%) | 6 (2.1%) |
| $25,000 to $34,999 | 4 (0.4%) | 123 (43.5%) |
| $35,000 to $49,999 | 54 (5.3%) | 54 (19.1%) |
| $50,000 to $74,999 | 174 (17.1%) | 0 (0.0%) |
| $75,000 to $99,999 | 136 (13.3%) | 0 (0.0%) |
| $100,000 to $149,999 | 223 (21.9%) | 20 (7.1%) |
| $150,000 or more | 386 (37.8%) | 10 (3.5%) |
| Total | 1,020 (100.0%) | 283 (100.0%) |
Monthly Housing Cost Tiers in Port Monmouth
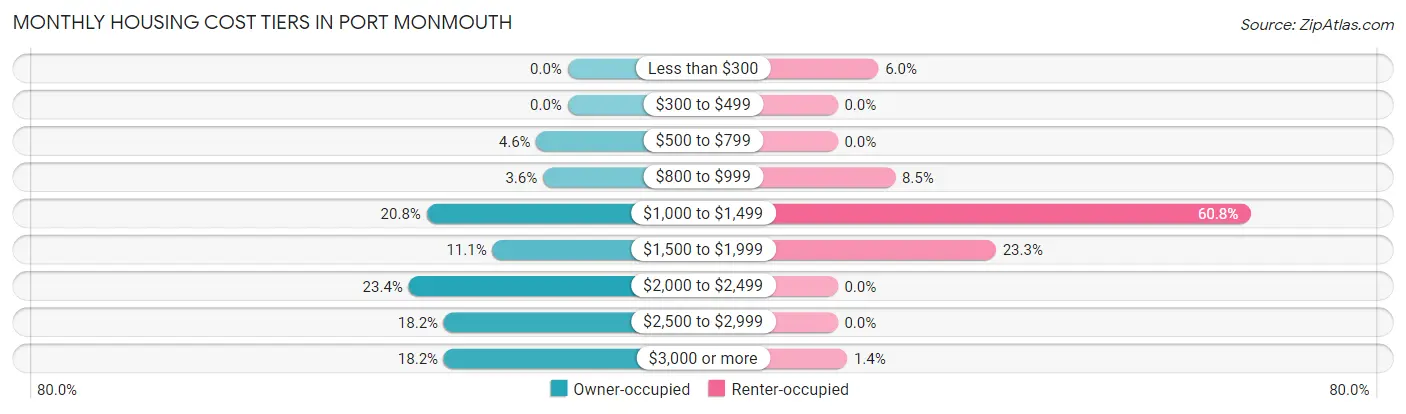
| Monthly Cost | Owner-occupied | Renter-occupied |
| Less than $300 | 0 (0.0%) | 17 (6.0%) |
| $300 to $499 | 0 (0.0%) | 0 (0.0%) |
| $500 to $799 | 47 (4.6%) | 0 (0.0%) |
| $800 to $999 | 37 (3.6%) | 24 (8.5%) |
| $1,000 to $1,499 | 212 (20.8%) | 172 (60.8%) |
| $1,500 to $1,999 | 113 (11.1%) | 66 (23.3%) |
| $2,000 to $2,499 | 239 (23.4%) | 0 (0.0%) |
| $2,500 to $2,999 | 186 (18.2%) | 0 (0.0%) |
| $3,000 or more | 186 (18.2%) | 4 (1.4%) |
| Total | 1,020 (100.0%) | 283 (100.0%) |
Physical Housing Characteristics in Port Monmouth
Housing Structures in Port Monmouth
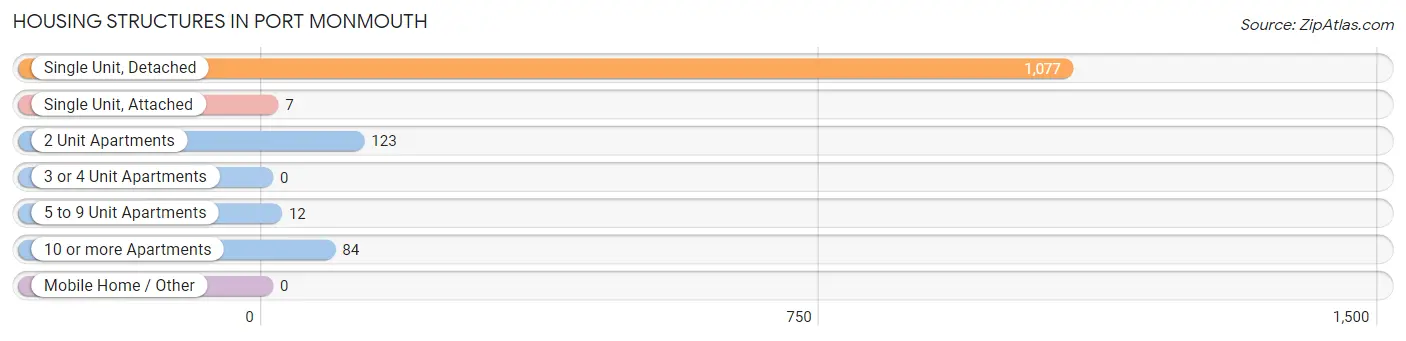
| Structure Type | # Housing Units | % Housing Units |
| Single Unit, Detached | 1,077 | 82.7% |
| Single Unit, Attached | 7 | 0.5% |
| 2 Unit Apartments | 123 | 9.4% |
| 3 or 4 Unit Apartments | 0 | 0.0% |
| 5 to 9 Unit Apartments | 12 | 0.9% |
| 10 or more Apartments | 84 | 6.5% |
| Mobile Home / Other | 0 | 0.0% |
| Total | 1,303 | 100.0% |
Housing Structures by Occupancy in Port Monmouth
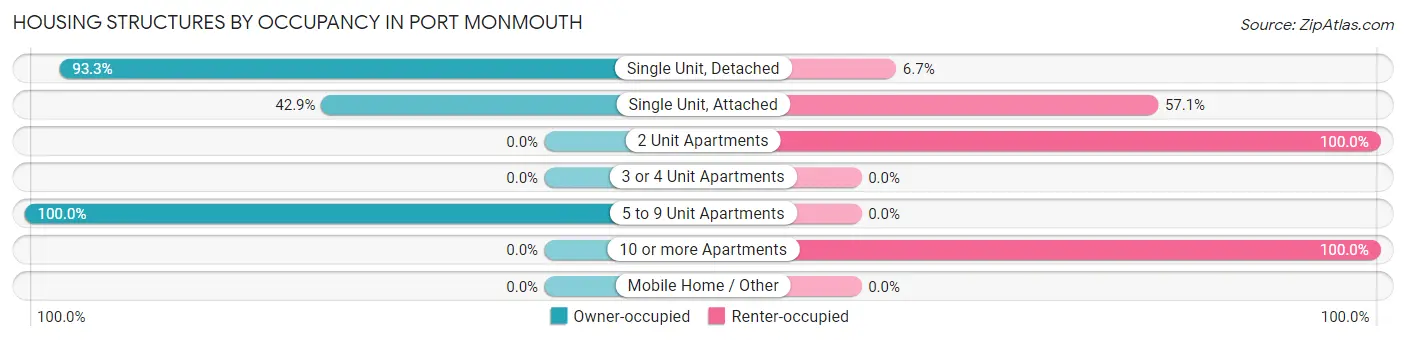
| Structure Type | Owner-occupied | Renter-occupied |
| Single Unit, Detached | 1,005 (93.3%) | 72 (6.7%) |
| Single Unit, Attached | 3 (42.9%) | 4 (57.1%) |
| 2 Unit Apartments | 0 (0.0%) | 123 (100.0%) |
| 3 or 4 Unit Apartments | 0 (0.0%) | 0 (0.0%) |
| 5 to 9 Unit Apartments | 12 (100.0%) | 0 (0.0%) |
| 10 or more Apartments | 0 (0.0%) | 84 (100.0%) |
| Mobile Home / Other | 0 (0.0%) | 0 (0.0%) |
| Total | 1,020 (78.3%) | 283 (21.7%) |
Housing Structures by Number of Rooms in Port Monmouth
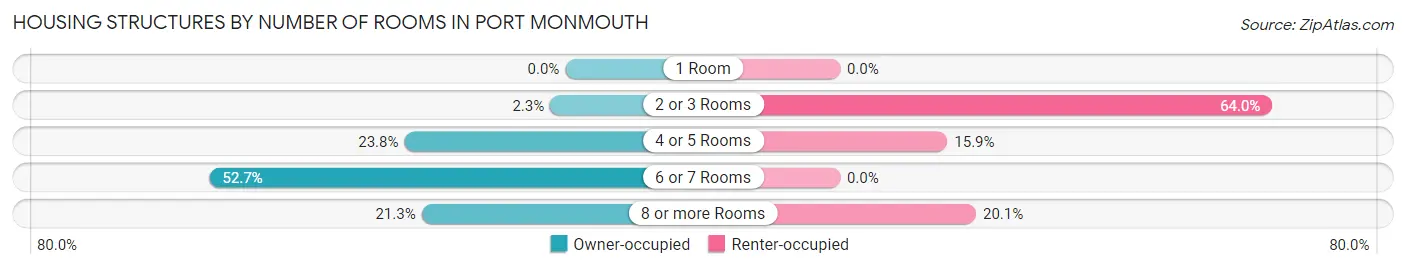
| Number of Rooms | Owner-occupied | Renter-occupied |
| 1 Room | 0 (0.0%) | 0 (0.0%) |
| 2 or 3 Rooms | 23 (2.2%) | 181 (64.0%) |
| 4 or 5 Rooms | 243 (23.8%) | 45 (15.9%) |
| 6 or 7 Rooms | 537 (52.6%) | 0 (0.0%) |
| 8 or more Rooms | 217 (21.3%) | 57 (20.1%) |
| Total | 1,020 (100.0%) | 283 (100.0%) |
Housing Structure by Heating Type in Port Monmouth
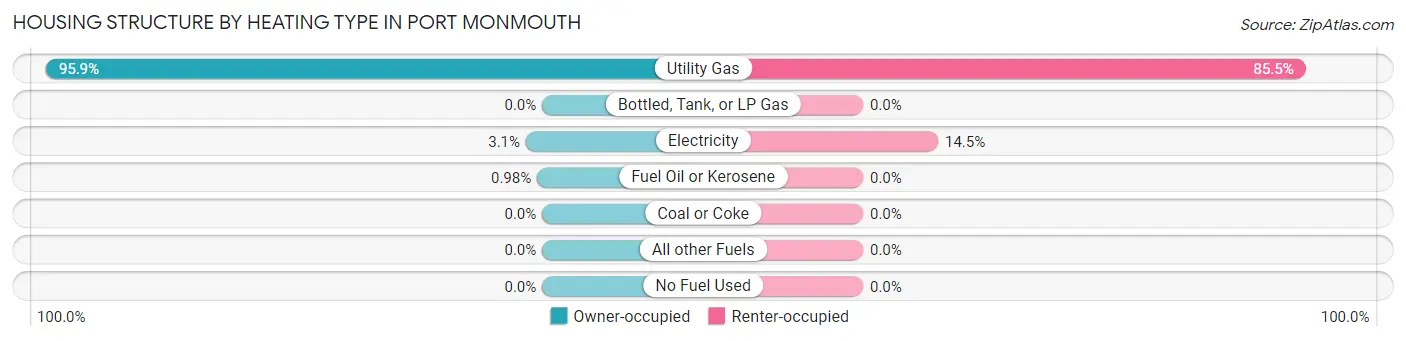
| Heating Type | Owner-occupied | Renter-occupied |
| Utility Gas | 978 (95.9%) | 242 (85.5%) |
| Bottled, Tank, or LP Gas | 0 (0.0%) | 0 (0.0%) |
| Electricity | 32 (3.1%) | 41 (14.5%) |
| Fuel Oil or Kerosene | 10 (1.0%) | 0 (0.0%) |
| Coal or Coke | 0 (0.0%) | 0 (0.0%) |
| All other Fuels | 0 (0.0%) | 0 (0.0%) |
| No Fuel Used | 0 (0.0%) | 0 (0.0%) |
| Total | 1,020 (100.0%) | 283 (100.0%) |
Household Vehicle Usage in Port Monmouth
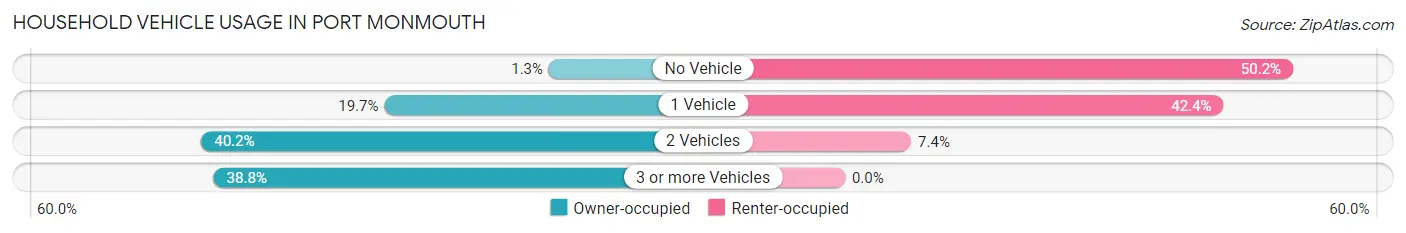
| Vehicles per Household | Owner-occupied | Renter-occupied |
| No Vehicle | 13 (1.3%) | 142 (50.2%) |
| 1 Vehicle | 201 (19.7%) | 120 (42.4%) |
| 2 Vehicles | 410 (40.2%) | 21 (7.4%) |
| 3 or more Vehicles | 396 (38.8%) | 0 (0.0%) |
| Total | 1,020 (100.0%) | 283 (100.0%) |
Real Estate & Mortgages in Port Monmouth
Real Estate and Mortgage Overview in Port Monmouth
| Characteristic | Without Mortgage | With Mortgage |
| Housing Units | 270 | 750 |
| Median Property Value | $421,500 | $395,800 |
| Median Household Income | $106,786 | $296 |
| Monthly Housing Costs | $1,132 | $186 |
| Real Estate Taxes | $6,949 | $0 |
Property Value by Mortgage Status in Port Monmouth
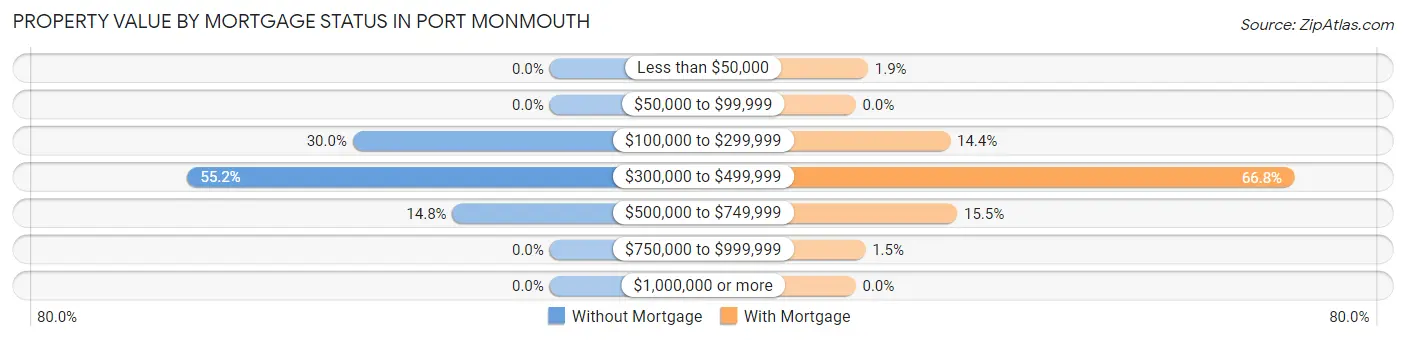
| Property Value | Without Mortgage | With Mortgage |
| Less than $50,000 | 0 (0.0%) | 14 (1.9%) |
| $50,000 to $99,999 | 0 (0.0%) | 0 (0.0%) |
| $100,000 to $299,999 | 81 (30.0%) | 108 (14.4%) |
| $300,000 to $499,999 | 149 (55.2%) | 501 (66.8%) |
| $500,000 to $749,999 | 40 (14.8%) | 116 (15.5%) |
| $750,000 to $999,999 | 0 (0.0%) | 11 (1.5%) |
| $1,000,000 or more | 0 (0.0%) | 0 (0.0%) |
| Total | 270 (100.0%) | 750 (100.0%) |
Household Income by Mortgage Status in Port Monmouth
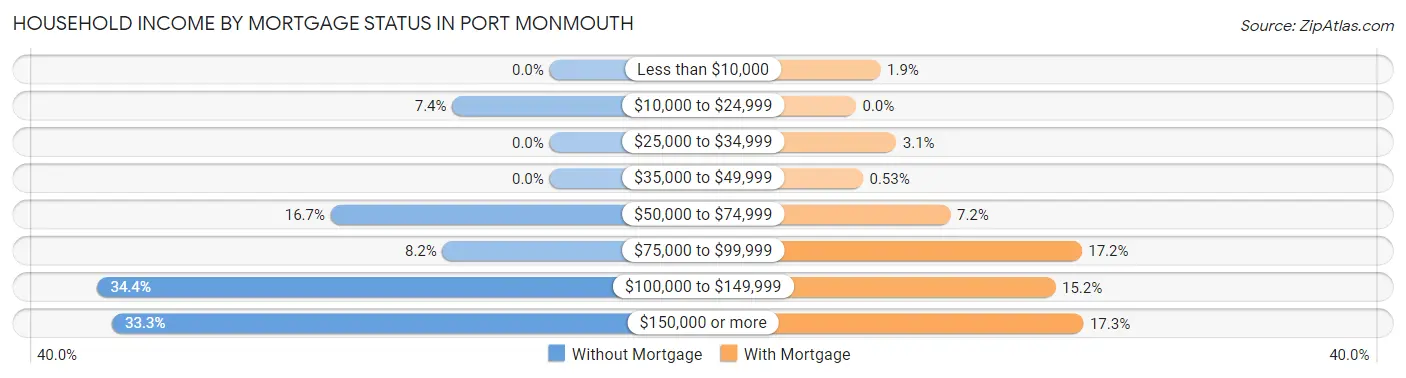
| Household Income | Without Mortgage | With Mortgage |
| Less than $10,000 | 0 (0.0%) | 14 (1.9%) |
| $10,000 to $24,999 | 20 (7.4%) | 0 (0.0%) |
| $25,000 to $34,999 | 0 (0.0%) | 23 (3.1%) |
| $35,000 to $49,999 | 0 (0.0%) | 4 (0.5%) |
| $50,000 to $74,999 | 45 (16.7%) | 54 (7.2%) |
| $75,000 to $99,999 | 22 (8.2%) | 129 (17.2%) |
| $100,000 to $149,999 | 93 (34.4%) | 114 (15.2%) |
| $150,000 or more | 90 (33.3%) | 130 (17.3%) |
| Total | 270 (100.0%) | 750 (100.0%) |
Property Value to Household Income Ratio in Port Monmouth
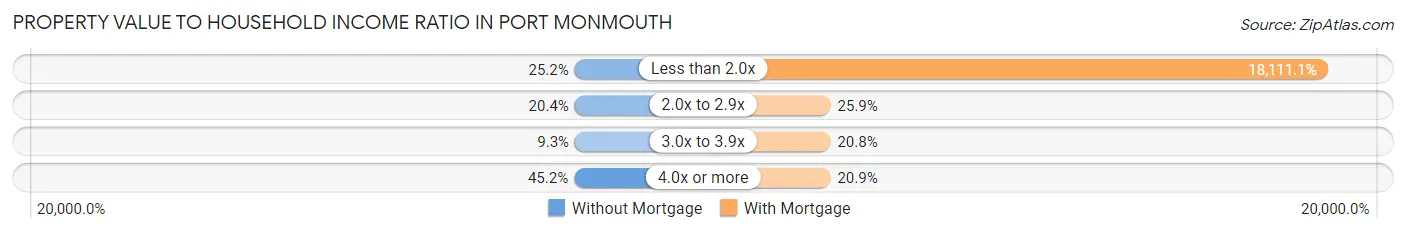
| Value-to-Income Ratio | Without Mortgage | With Mortgage |
| Less than 2.0x | 68 (25.2%) | 135,833 (18,111.1%) |
| 2.0x to 2.9x | 55 (20.4%) | 194 (25.9%) |
| 3.0x to 3.9x | 25 (9.3%) | 156 (20.8%) |
| 4.0x or more | 122 (45.2%) | 157 (20.9%) |
| Total | 270 (100.0%) | 750 (100.0%) |
Real Estate Taxes by Mortgage Status in Port Monmouth
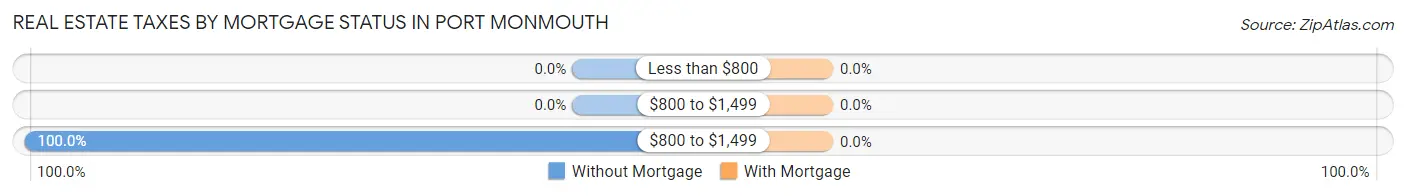
| Property Taxes | Without Mortgage | With Mortgage |
| Less than $800 | 0 (0.0%) | 0 (0.0%) |
| $800 to $1,499 | 0 (0.0%) | 0 (0.0%) |
| $800 to $1,499 | 270 (100.0%) | 0 (0.0%) |
| Total | 270 (100.0%) | 750 (100.0%) |
Health & Disability in Port Monmouth
Health Insurance Coverage by Age in Port Monmouth
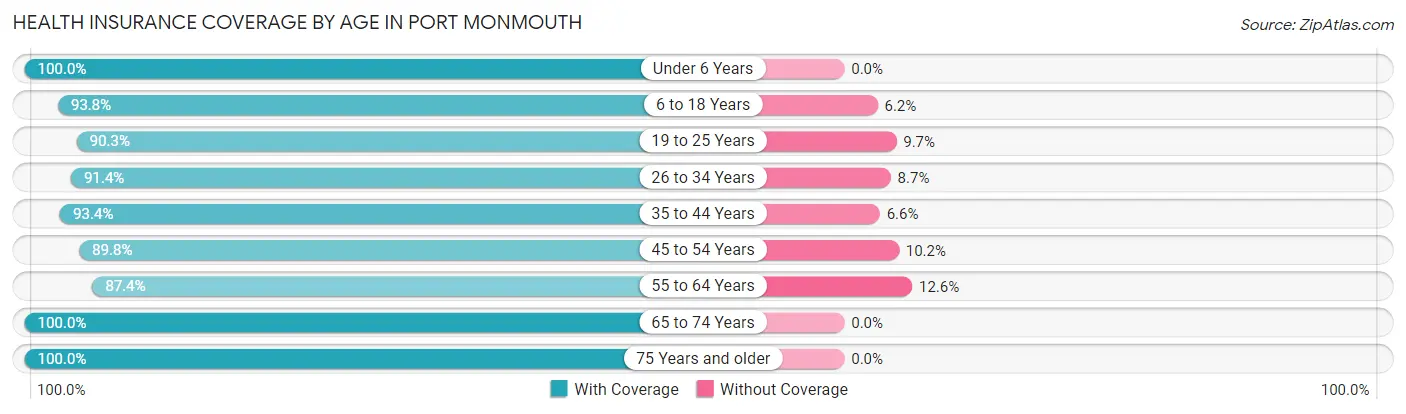
| Age Bracket | With Coverage | Without Coverage |
| Under 6 Years | 99 (100.0%) | 0 (0.0%) |
| 6 to 18 Years | 378 (93.8%) | 25 (6.2%) |
| 19 to 25 Years | 345 (90.3%) | 37 (9.7%) |
| 26 to 34 Years | 169 (91.3%) | 16 (8.6%) |
| 35 to 44 Years | 396 (93.4%) | 28 (6.6%) |
| 45 to 54 Years | 504 (89.8%) | 57 (10.2%) |
| 55 to 64 Years | 505 (87.4%) | 73 (12.6%) |
| 65 to 74 Years | 373 (100.0%) | 0 (0.0%) |
| 75 Years and older | 168 (100.0%) | 0 (0.0%) |
| Total | 2,937 (92.6%) | 236 (7.4%) |
Health Insurance Coverage by Citizenship Status in Port Monmouth
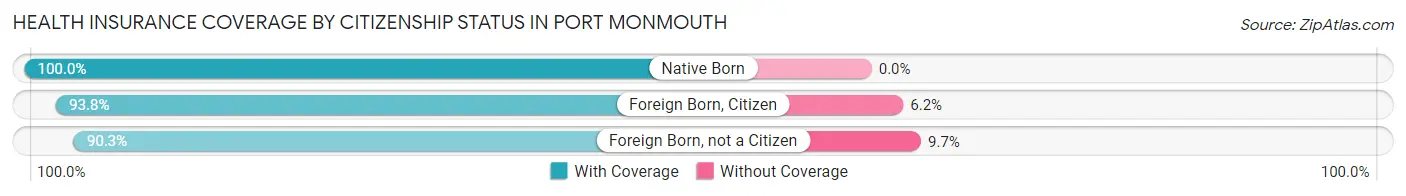
| Citizenship Status | With Coverage | Without Coverage |
| Native Born | 99 (100.0%) | 0 (0.0%) |
| Foreign Born, Citizen | 378 (93.8%) | 25 (6.2%) |
| Foreign Born, not a Citizen | 345 (90.3%) | 37 (9.7%) |
Health Insurance Coverage by Household Income in Port Monmouth
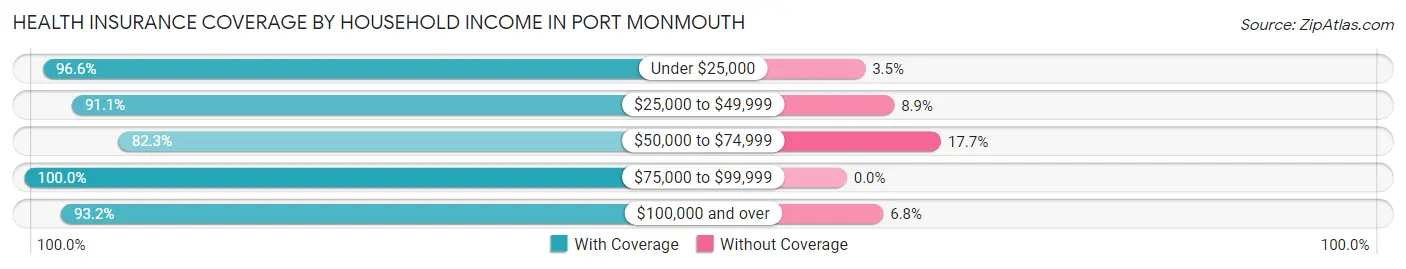
| Household Income | With Coverage | Without Coverage |
| Under $25,000 | 168 (96.6%) | 6 (3.5%) |
| $25,000 to $49,999 | 308 (91.1%) | 30 (8.9%) |
| $50,000 to $74,999 | 303 (82.3%) | 65 (17.7%) |
| $75,000 to $99,999 | 309 (100.0%) | 0 (0.0%) |
| $100,000 and over | 1,840 (93.2%) | 135 (6.8%) |
Public vs Private Health Insurance Coverage by Age in Port Monmouth
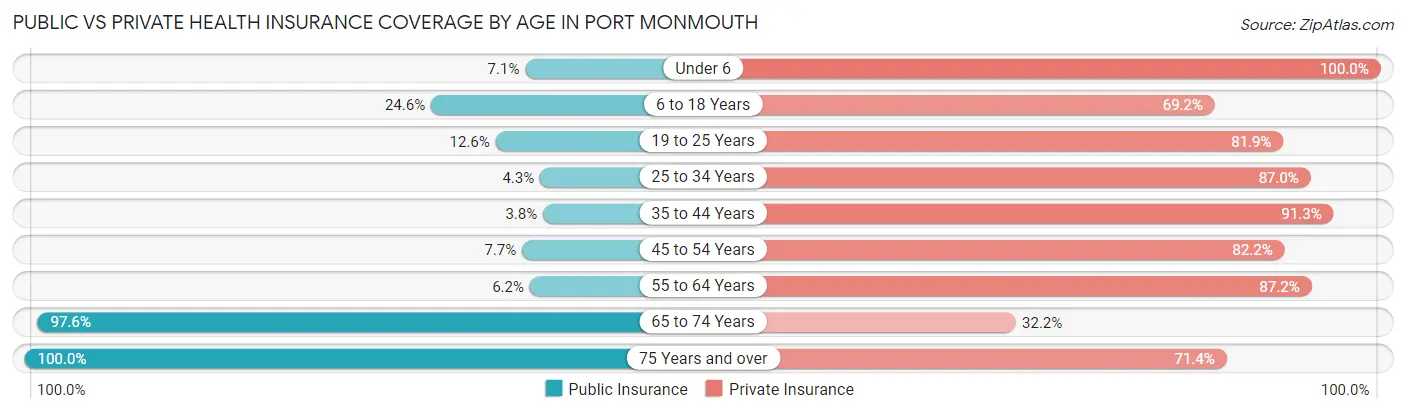
| Age Bracket | Public Insurance | Private Insurance |
| Under 6 | 7 (7.1%) | 99 (100.0%) |
| 6 to 18 Years | 99 (24.6%) | 279 (69.2%) |
| 19 to 25 Years | 48 (12.6%) | 313 (81.9%) |
| 25 to 34 Years | 8 (4.3%) | 161 (87.0%) |
| 35 to 44 Years | 16 (3.8%) | 387 (91.3%) |
| 45 to 54 Years | 43 (7.7%) | 461 (82.2%) |
| 55 to 64 Years | 36 (6.2%) | 504 (87.2%) |
| 65 to 74 Years | 364 (97.6%) | 120 (32.2%) |
| 75 Years and over | 168 (100.0%) | 120 (71.4%) |
| Total | 789 (24.9%) | 2,444 (77.0%) |
Disability Status by Sex by Age in Port Monmouth
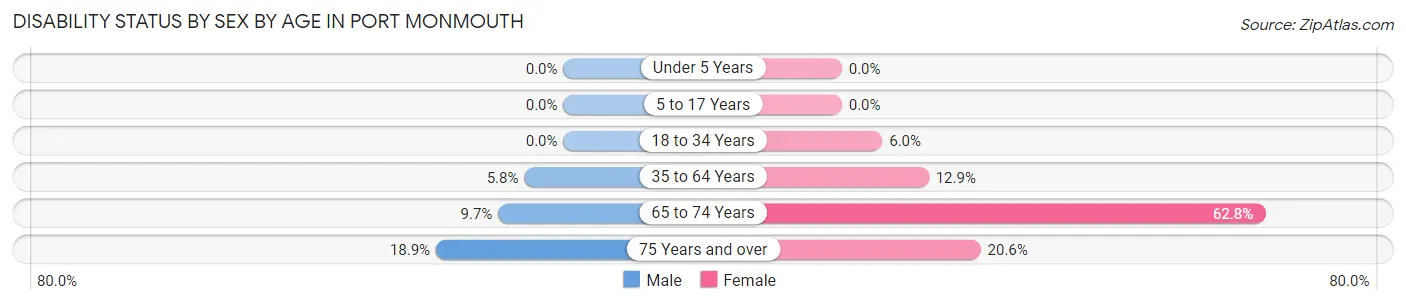
| Age Bracket | Male | Female |
| Under 5 Years | 0 (0.0%) | 0 (0.0%) |
| 5 to 17 Years | 0 (0.0%) | 0 (0.0%) |
| 18 to 34 Years | 0 (0.0%) | 23 (6.0%) |
| 35 to 64 Years | 43 (5.8%) | 106 (12.9%) |
| 65 to 74 Years | 15 (9.7%) | 137 (62.8%) |
| 75 Years and over | 7 (18.9%) | 27 (20.6%) |
Disability Class by Sex by Age in Port Monmouth
Disability Class: Hearing Difficulty
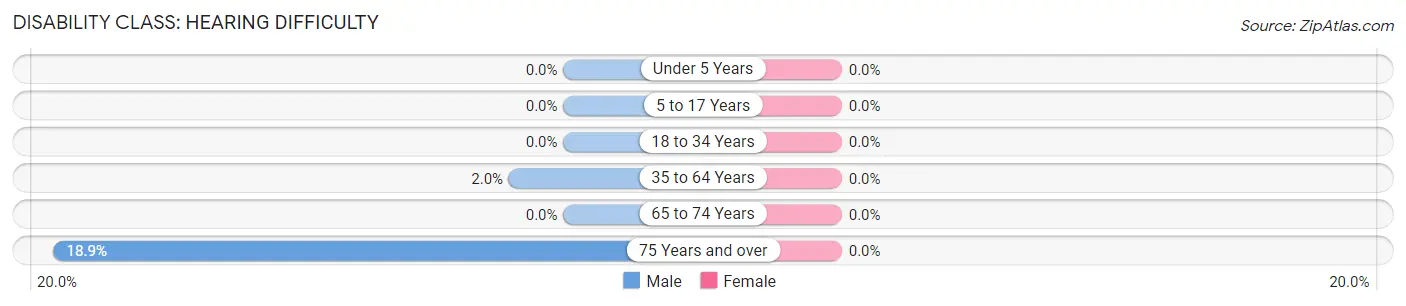
| Age Bracket | Male | Female |
| Under 5 Years | 0 (0.0%) | 0 (0.0%) |
| 5 to 17 Years | 0 (0.0%) | 0 (0.0%) |
| 18 to 34 Years | 0 (0.0%) | 0 (0.0%) |
| 35 to 64 Years | 15 (2.0%) | 0 (0.0%) |
| 65 to 74 Years | 0 (0.0%) | 0 (0.0%) |
| 75 Years and over | 7 (18.9%) | 0 (0.0%) |
Disability Class: Vision Difficulty
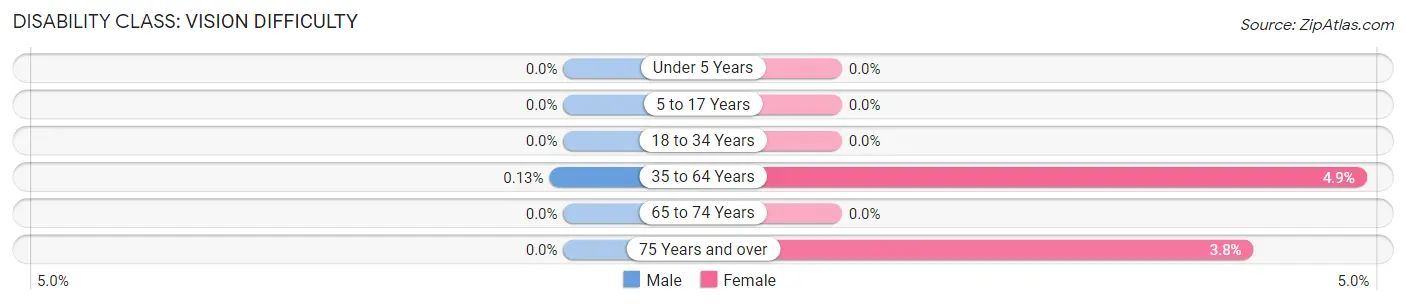
| Age Bracket | Male | Female |
| Under 5 Years | 0 (0.0%) | 0 (0.0%) |
| 5 to 17 Years | 0 (0.0%) | 0 (0.0%) |
| 18 to 34 Years | 0 (0.0%) | 0 (0.0%) |
| 35 to 64 Years | 1 (0.1%) | 40 (4.9%) |
| 65 to 74 Years | 0 (0.0%) | 0 (0.0%) |
| 75 Years and over | 0 (0.0%) | 5 (3.8%) |
Disability Class: Cognitive Difficulty
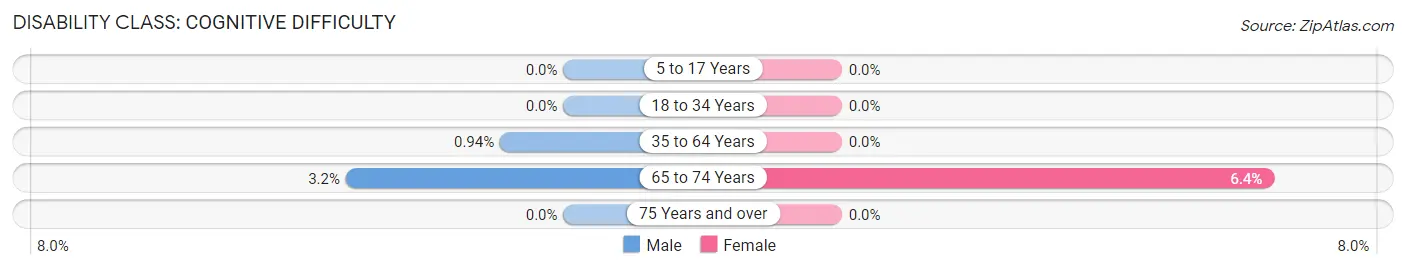
| Age Bracket | Male | Female |
| 5 to 17 Years | 0 (0.0%) | 0 (0.0%) |
| 18 to 34 Years | 0 (0.0%) | 0 (0.0%) |
| 35 to 64 Years | 7 (0.9%) | 0 (0.0%) |
| 65 to 74 Years | 5 (3.2%) | 14 (6.4%) |
| 75 Years and over | 0 (0.0%) | 0 (0.0%) |
Disability Class: Ambulatory Difficulty
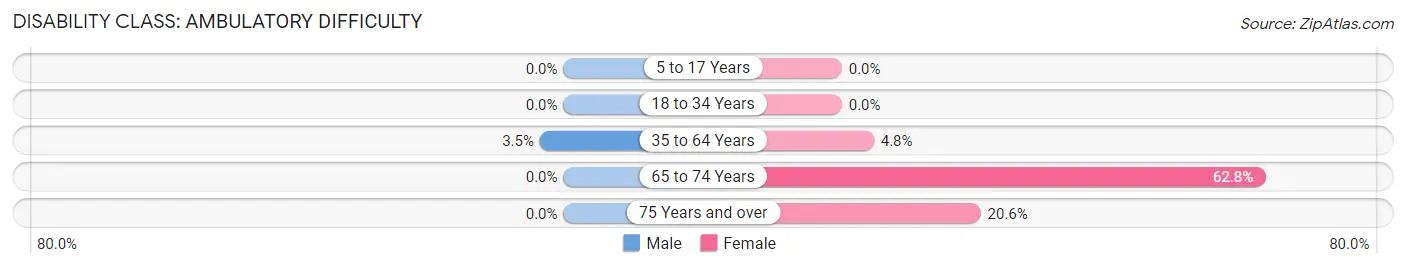
| Age Bracket | Male | Female |
| 5 to 17 Years | 0 (0.0%) | 0 (0.0%) |
| 18 to 34 Years | 0 (0.0%) | 0 (0.0%) |
| 35 to 64 Years | 26 (3.5%) | 39 (4.8%) |
| 65 to 74 Years | 0 (0.0%) | 137 (62.8%) |
| 75 Years and over | 0 (0.0%) | 27 (20.6%) |
Disability Class: Self-Care Difficulty
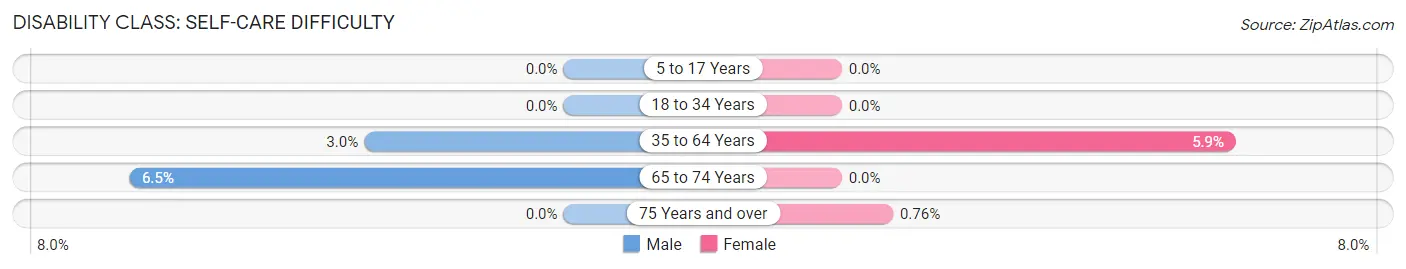
| Age Bracket | Male | Female |
| 5 to 17 Years | 0 (0.0%) | 0 (0.0%) |
| 18 to 34 Years | 0 (0.0%) | 0 (0.0%) |
| 35 to 64 Years | 22 (3.0%) | 48 (5.9%) |
| 65 to 74 Years | 10 (6.5%) | 0 (0.0%) |
| 75 Years and over | 0 (0.0%) | 1 (0.8%) |
Technology Access in Port Monmouth
Computing Device Access in Port Monmouth
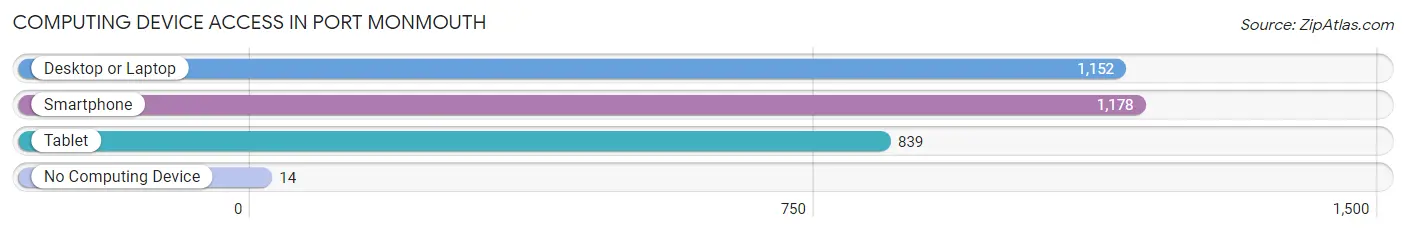
| Device Type | # Households | % Households |
| Desktop or Laptop | 1,152 | 88.4% |
| Smartphone | 1,178 | 90.4% |
| Tablet | 839 | 64.4% |
| No Computing Device | 14 | 1.1% |
| Total | 1,303 | 100.0% |
Internet Access in Port Monmouth
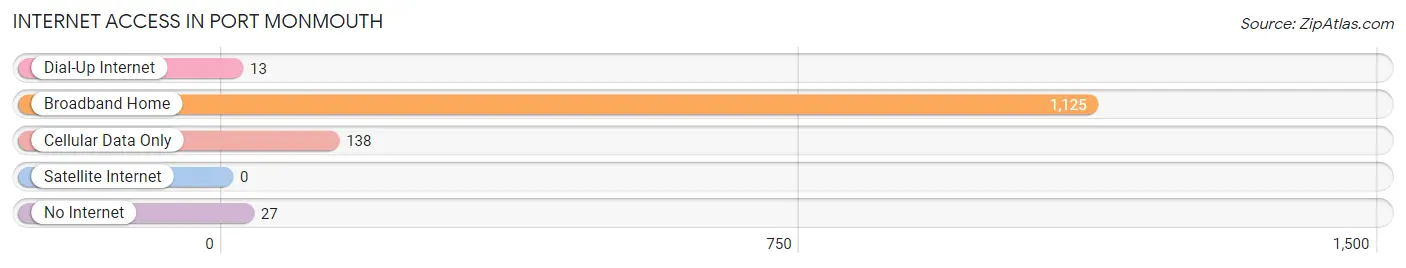
| Internet Type | # Households | % Households |
| Dial-Up Internet | 13 | 1.0% |
| Broadband Home | 1,125 | 86.3% |
| Cellular Data Only | 138 | 10.6% |
| Satellite Internet | 0 | 0.0% |
| No Internet | 27 | 2.1% |
| Total | 1,303 | 100.0% |
Port Monmouth Summary
Port Monmouth is a small unincorporated community located in Monmouth County, New Jersey. It is situated on the banks of the Raritan River, just south of the borough of Middletown. The area was first settled in the late 1600s and has a rich history of fishing, farming, and industry.
Geography
Port Monmouth is located at 40°21'25"N 74°04'45"W (40.356944, -74.079167). It is situated on the banks of the Raritan River, just south of the borough of Middletown. The area is mostly flat, with some low hills in the northern part of the community. The soil is mostly sandy loam, with some clay and gravel. The climate is humid subtropical, with hot, humid summers and cold, wet winters.
Economy
Port Monmouth has a diverse economy, with a mix of industries and businesses. The area is home to several marinas, which provide services to recreational boaters. There are also several small businesses, including restaurants, retail stores, and professional services. The area is also home to a number of light industrial businesses, including a plastics manufacturer and a metal fabrication shop.
Demographics
As of the 2010 census, Port Monmouth had a population of 1,845. The racial makeup of the community was 87.3% White, 5.2% African American, 0.3% Native American, 2.2% Asian, and 4.9% from other races. Hispanic or Latino of any race were 8.2% of the population.
The median household income in Port Monmouth was $63,958, and the median family income was $76,944. The per capita income was $30,945. About 5.2% of families and 7.2% of the population were below the poverty line, including 8.3% of those under age 18 and 5.2% of those age 65 or over.
History
Port Monmouth was first settled in the late 1600s by Dutch and English settlers. The area was originally known as "Middletown Point," and was part of Middletown Township. In the early 1800s, the area was renamed "Port Monmouth" after the nearby port of Monmouth.
The area was primarily a fishing and farming community until the late 1800s, when the Central Railroad of New Jersey built a line through the area. This brought industry to the area, and the population began to grow. In the early 1900s, the area was home to several factories, including a glassworks, a paper mill, and a brickyard.
In the mid-1900s, the area began to decline as industry moved away. The population decreased, and the area became mostly residential. In the late 1900s, the area began to experience a resurgence, as new businesses moved in and the population began to grow again.
Today, Port Monmouth is a small, unincorporated community with a diverse economy. The area is home to several marinas, small businesses, and light industrial businesses. The population is growing, and the area is becoming increasingly popular with recreational boaters.
Common Questions
What is Per Capita Income in Port Monmouth?
Per Capita income in Port Monmouth is $52,776.
What is the Median Family Income in Port Monmouth?
Median Family Income in Port Monmouth is $141,157.
What is the Median Household income in Port Monmouth?
Median Household Income in Port Monmouth is $95,268.
What is Income or Wage Gap in Port Monmouth?
Income or Wage Gap in Port Monmouth is 15.8%.
Women in Port Monmouth earn 84.2 cents for every dollar earned by a man.
What is Inequality or Gini Index in Port Monmouth?
Inequality or Gini Index in Port Monmouth is 0.43.
What is the Total Population of Port Monmouth?
Total Population of Port Monmouth is 3,173.
What is the Total Male Population of Port Monmouth?
Total Male Population of Port Monmouth is 1,402.
What is the Total Female Population of Port Monmouth?
Total Female Population of Port Monmouth is 1,771.
What is the Ratio of Males per 100 Females in Port Monmouth?
There are 79.16 Males per 100 Females in Port Monmouth.
What is the Ratio of Females per 100 Males in Port Monmouth?
There are 126.32 Females per 100 Males in Port Monmouth.
What is the Median Population Age in Port Monmouth?
Median Population Age in Port Monmouth is 47.3 Years.
What is the Average Family Size in Port Monmouth
Average Family Size in Port Monmouth is 3.0 People.
What is the Average Household Size in Port Monmouth
Average Household Size in Port Monmouth is 2.4 People.
How Large is the Labor Force in Port Monmouth?
There are 1,919 People in the Labor Forcein in Port Monmouth.
What is the Percentage of People in the Labor Force in Port Monmouth?
68.6% of People are in the Labor Force in Port Monmouth.
What is the Unemployment Rate in Port Monmouth?
Unemployment Rate in Port Monmouth is 7.3%.