Ocean Gate borough, NJ Map & Demographics
Ocean Gate borough Overview
$42,958
PER CAPITA INCOME
$82,500
AVG FAMILY INCOME
$67,788
AVG HOUSEHOLD INCOME
20.7%
WAGE / INCOME GAP [ % ]
79.3¢/ $1
WAGE / INCOME GAP [ $ ]
0.46
INEQUALITY / GINI INDEX
1,682
TOTAL POPULATION
816
MALE POPULATION
866
FEMALE POPULATION
94.23
MALES / 100 FEMALES
106.13
FEMALES / 100 MALES
46.1
MEDIAN AGE
3.0
AVG FAMILY SIZE
2.3
AVG HOUSEHOLD SIZE
828
LABOR FORCE [ PEOPLE ]
60.0%
PERCENT IN LABOR FORCE
3.4%
UNEMPLOYMENT RATE
Income in Ocean Gate borough
Income Overview in Ocean Gate borough
Per Capita Income in Ocean Gate borough is $42,958, while median incomes of families and households are $82,500 and $67,788 respectively.
| Characteristic | Number | Measure |
| Per Capita Income | 1,682 | $42,958 |
| Median Family Income | 402 | $82,500 |
| Mean Family Income | 402 | $97,310 |
| Median Household Income | 743 | $67,788 |
| Mean Household Income | 743 | $95,009 |
| Income Deficit | 402 | $0 |
| Wage / Income Gap (%) | 1,682 | 20.73% |
| Wage / Income Gap ($) | 1,682 | 79.27¢ per $1 |
| Gini / Inequality Index | 1,682 | 0.46 |
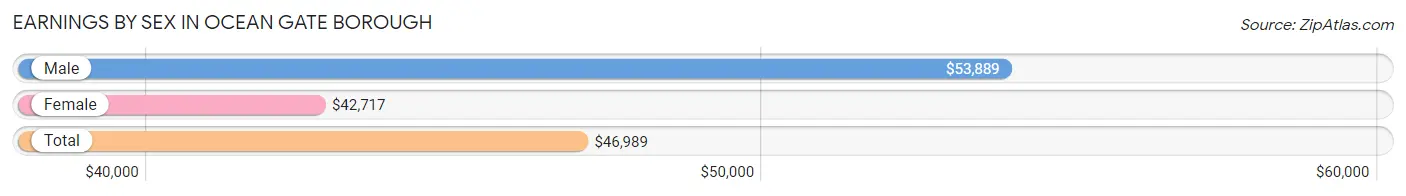
Earnings by Sex in Ocean Gate borough
Average Earnings in Ocean Gate borough are $46,989, $53,889 for men and $42,717 for women, a difference of 20.7%.
| Sex | Number | Average Earnings |
| Male | 432 (48.2%) | $53,889 |
| Female | 464 (51.8%) | $42,717 |
| Total | 896 (100.0%) | $46,989 |
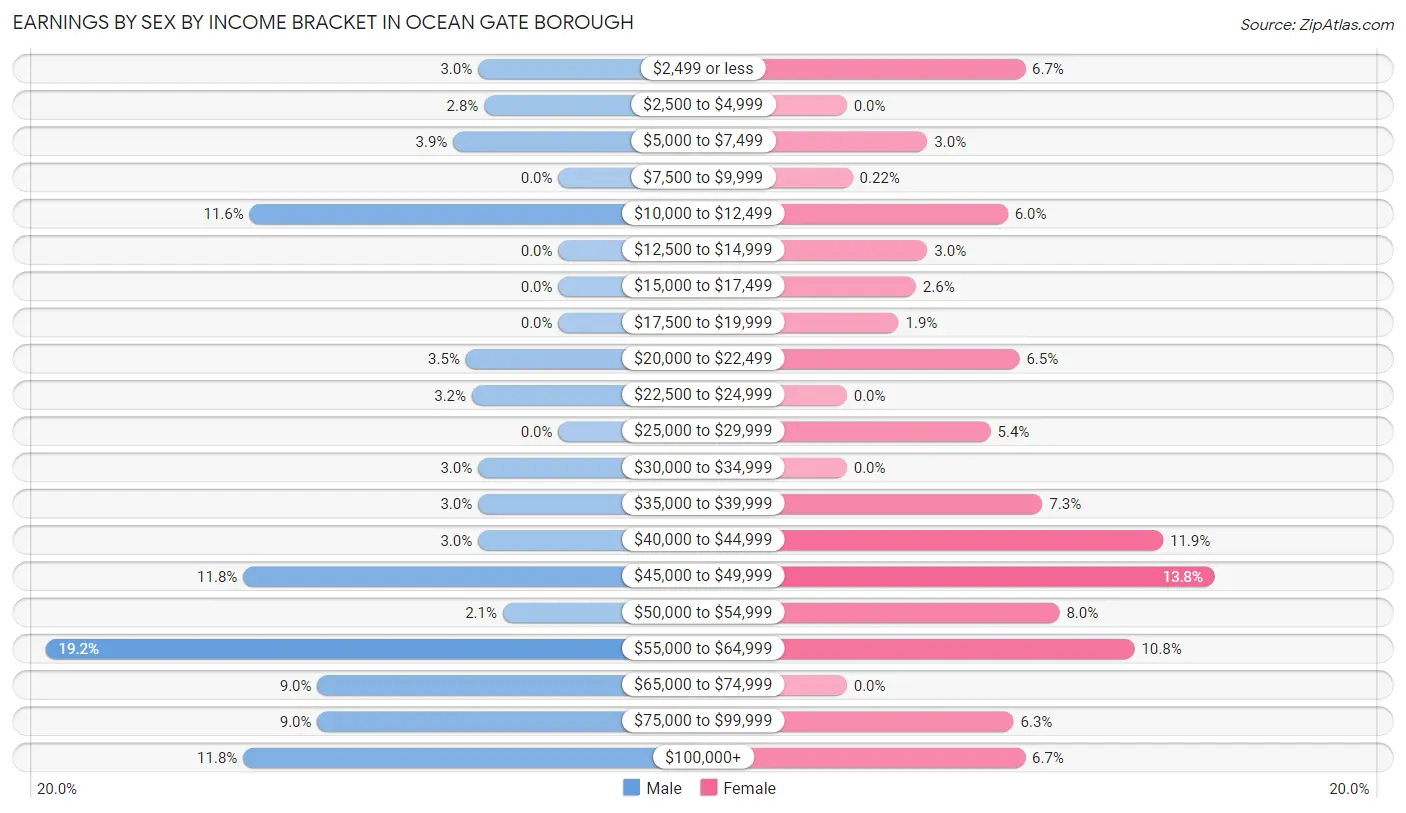
Earnings by Sex by Income Bracket in Ocean Gate borough
The most common earnings brackets in Ocean Gate borough are $55,000 to $64,999 for men (83 | 19.2%) and $45,000 to $49,999 for women (64 | 13.8%).
| Income | Male | Female |
| $2,499 or less | 13 (3.0%) | 31 (6.7%) |
| $2,500 to $4,999 | 12 (2.8%) | 0 (0.0%) |
| $5,000 to $7,499 | 17 (3.9%) | 14 (3.0%) |
| $7,500 to $9,999 | 0 (0.0%) | 1 (0.2%) |
| $10,000 to $12,499 | 50 (11.6%) | 28 (6.0%) |
| $12,500 to $14,999 | 0 (0.0%) | 14 (3.0%) |
| $15,000 to $17,499 | 0 (0.0%) | 12 (2.6%) |
| $17,500 to $19,999 | 0 (0.0%) | 9 (1.9%) |
| $20,000 to $22,499 | 15 (3.5%) | 30 (6.5%) |
| $22,500 to $24,999 | 14 (3.2%) | 0 (0.0%) |
| $25,000 to $29,999 | 0 (0.0%) | 25 (5.4%) |
| $30,000 to $34,999 | 13 (3.0%) | 0 (0.0%) |
| $35,000 to $39,999 | 13 (3.0%) | 34 (7.3%) |
| $40,000 to $44,999 | 13 (3.0%) | 55 (11.8%) |
| $45,000 to $49,999 | 51 (11.8%) | 64 (13.8%) |
| $50,000 to $54,999 | 9 (2.1%) | 37 (8.0%) |
| $55,000 to $64,999 | 83 (19.2%) | 50 (10.8%) |
| $65,000 to $74,999 | 39 (9.0%) | 0 (0.0%) |
| $75,000 to $99,999 | 39 (9.0%) | 29 (6.2%) |
| $100,000+ | 51 (11.8%) | 31 (6.7%) |
| Total | 432 (100.0%) | 464 (100.0%) |
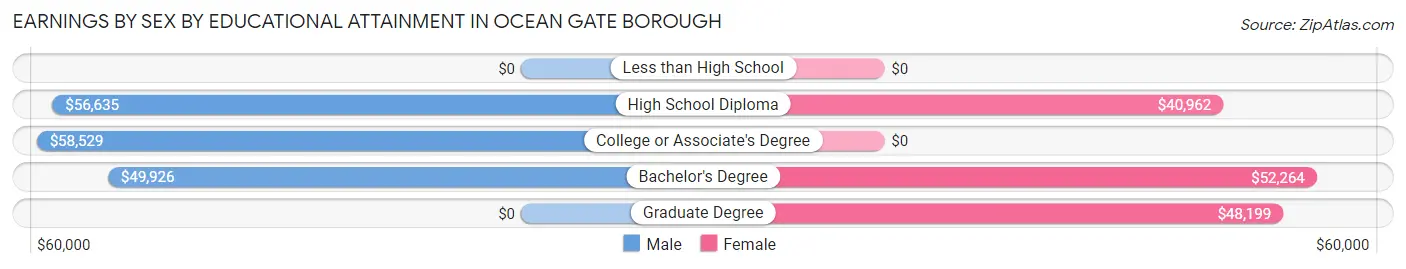
Earnings by Sex by Educational Attainment in Ocean Gate borough
Average earnings in Ocean Gate borough are $56,950 for men and $47,250 for women, a difference of 17.0%. Men with an educational attainment of college or associate's degree enjoy the highest average annual earnings of $58,529, while those with bachelor's degree education earn the least with $49,926. Women with an educational attainment of bachelor's degree earn the most with the average annual earnings of $52,264, while those with high school diploma education have the smallest earnings of $40,962.
| Educational Attainment | Male Income | Female Income |
| Less than High School | - | - |
| High School Diploma | $56,635 | $40,962 |
| College or Associate's Degree | $58,529 | $0 |
| Bachelor's Degree | $49,926 | $52,264 |
| Graduate Degree | - | - |
| Total | $56,950 | $47,250 |
Family Income in Ocean Gate borough
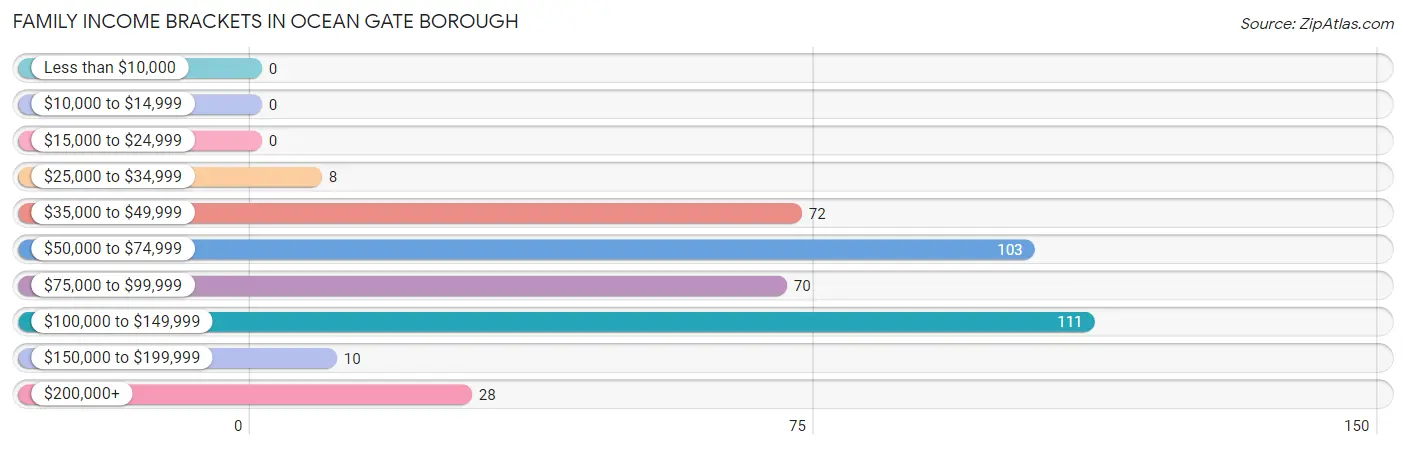
Family Income Brackets in Ocean Gate borough
According to the Ocean Gate borough family income data, there are 111 families falling into the $100,000 to $149,999 income range, which is the most common income bracket and makes up 27.6% of all families.
| Income Bracket | # Families | % Families |
| Less than $10,000 | 0 | 0.0% |
| $10,000 to $14,999 | 0 | 0.0% |
| $15,000 to $24,999 | 0 | 0.0% |
| $25,000 to $34,999 | 8 | 2.0% |
| $35,000 to $49,999 | 72 | 17.9% |
| $50,000 to $74,999 | 103 | 25.6% |
| $75,000 to $99,999 | 70 | 17.4% |
| $100,000 to $149,999 | 111 | 27.6% |
| $150,000 to $199,999 | 10 | 2.5% |
| $200,000+ | 28 | 7.0% |
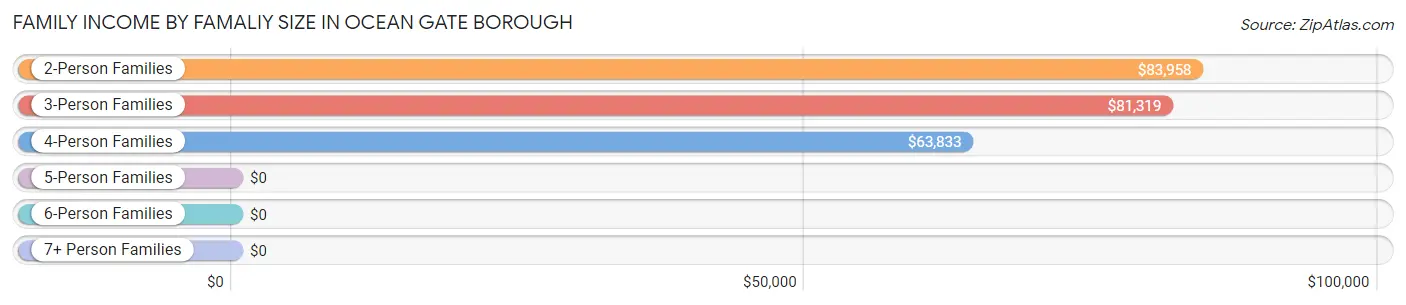
Family Income by Famaliy Size in Ocean Gate borough
2-person families (198 | 49.2%) account for the highest median family income in Ocean Gate borough with $83,958 per family, while 2-person families (198 | 49.2%) have the highest median income of $41,979 per family member.
| Income Bracket | # Families | Median Income |
| 2-Person Families | 198 (49.2%) | $83,958 |
| 3-Person Families | 105 (26.1%) | $81,319 |
| 4-Person Families | 56 (13.9%) | $63,833 |
| 5-Person Families | 19 (4.7%) | $0 |
| 6-Person Families | 24 (6.0%) | $0 |
| 7+ Person Families | 0 (0.0%) | $0 |
| Total | 402 (100.0%) | $82,500 |
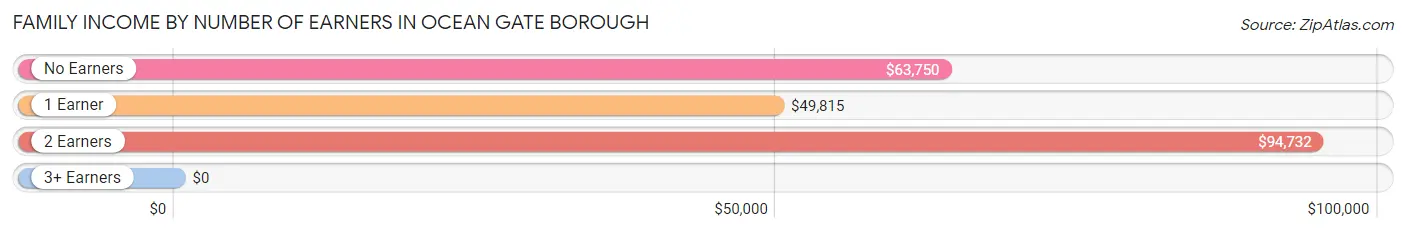
Family Income by Number of Earners in Ocean Gate borough
| Number of Earners | # Families | Median Income |
| No Earners | 70 (17.4%) | $63,750 |
| 1 Earner | 136 (33.8%) | $49,815 |
| 2 Earners | 153 (38.1%) | $94,732 |
| 3+ Earners | 43 (10.7%) | $0 |
| Total | 402 (100.0%) | $82,500 |
Household Income in Ocean Gate borough
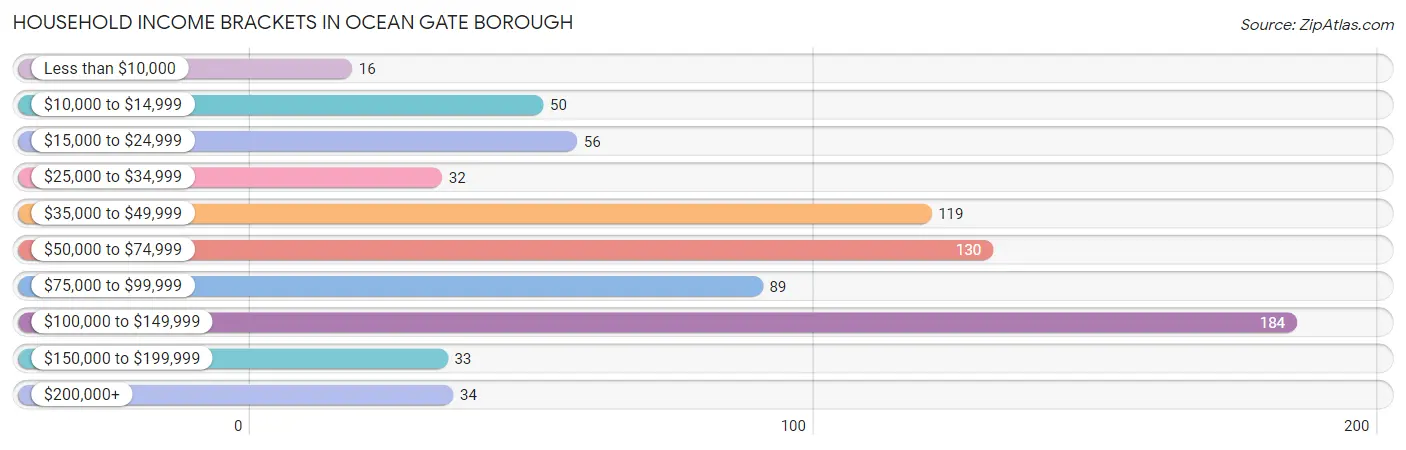
Household Income Brackets in Ocean Gate borough
With 184 households falling in the category, the $100,000 to $149,999 income range is the most frequent in Ocean Gate borough, accounting for 24.8% of all households. In contrast, only 16 households (2.1%) fall into the less than $10,000 income bracket, making it the least populous group.
| Income Bracket | # Households | % Households |
| Less than $10,000 | 16 | 2.2% |
| $10,000 to $14,999 | 50 | 6.7% |
| $15,000 to $24,999 | 56 | 7.5% |
| $25,000 to $34,999 | 32 | 4.3% |
| $35,000 to $49,999 | 119 | 16.0% |
| $50,000 to $74,999 | 130 | 17.5% |
| $75,000 to $99,999 | 89 | 12.0% |
| $100,000 to $149,999 | 184 | 24.8% |
| $150,000 to $199,999 | 33 | 4.4% |
| $200,000+ | 34 | 4.6% |
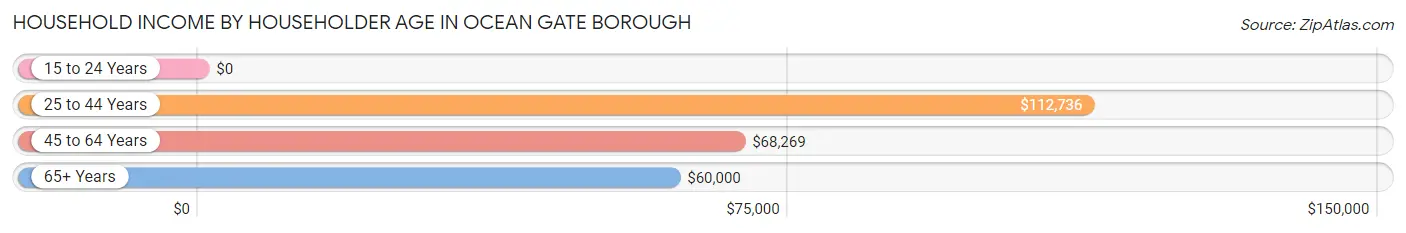
Household Income by Householder Age in Ocean Gate borough
The median household income in Ocean Gate borough is $67,788, with the highest median household income of $112,736 found in the 25 to 44 years age bracket for the primary householder. A total of 151 households (20.3%) fall into this category. Meanwhile, the 15 to 24 years age bracket for the primary householder has the lowest median household income of $0, with 16 households (2.1%) in this group.
| Income Bracket | # Households | Median Income |
| 15 to 24 Years | 16 (2.1%) | $0 |
| 25 to 44 Years | 151 (20.3%) | $112,736 |
| 45 to 64 Years | 238 (32.0%) | $68,269 |
| 65+ Years | 338 (45.5%) | $60,000 |
| Total | 743 (100.0%) | $67,788 |
Poverty in Ocean Gate borough
Income Below Poverty by Sex and Age in Ocean Gate borough
With 1.7% poverty level for males and 2.7% for females among the residents of Ocean Gate borough, 18 to 24 year old males and 55 to 64 year old females are the most vulnerable to poverty, with 13 males (14.6%) and 23 females (12.9%) in their respective age groups living below the poverty level.
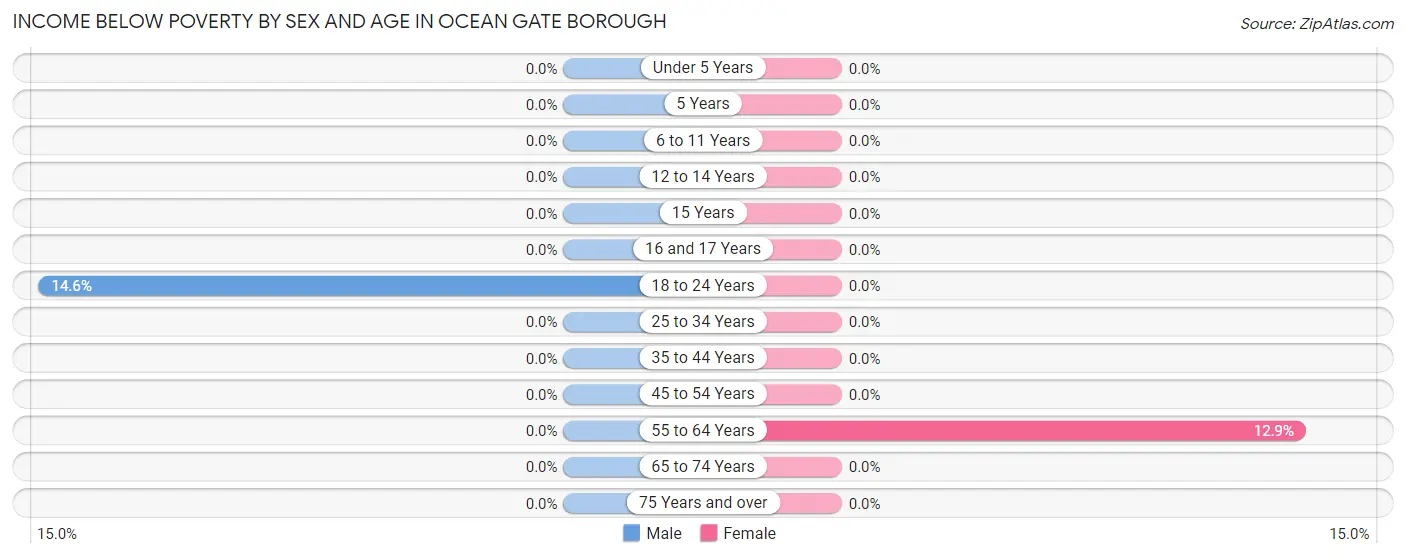
| Age Bracket | Male | Female |
| Under 5 Years | 0 (0.0%) | 0 (0.0%) |
| 5 Years | 0 (0.0%) | 0 (0.0%) |
| 6 to 11 Years | 0 (0.0%) | 0 (0.0%) |
| 12 to 14 Years | 0 (0.0%) | 0 (0.0%) |
| 15 Years | 0 (0.0%) | 0 (0.0%) |
| 16 and 17 Years | 0 (0.0%) | 0 (0.0%) |
| 18 to 24 Years | 13 (14.6%) | 0 (0.0%) |
| 25 to 34 Years | 0 (0.0%) | 0 (0.0%) |
| 35 to 44 Years | 0 (0.0%) | 0 (0.0%) |
| 45 to 54 Years | 0 (0.0%) | 0 (0.0%) |
| 55 to 64 Years | 0 (0.0%) | 23 (12.9%) |
| 65 to 74 Years | 0 (0.0%) | 0 (0.0%) |
| 75 Years and over | 0 (0.0%) | 0 (0.0%) |
| Total | 13 (1.7%) | 23 (2.7%) |
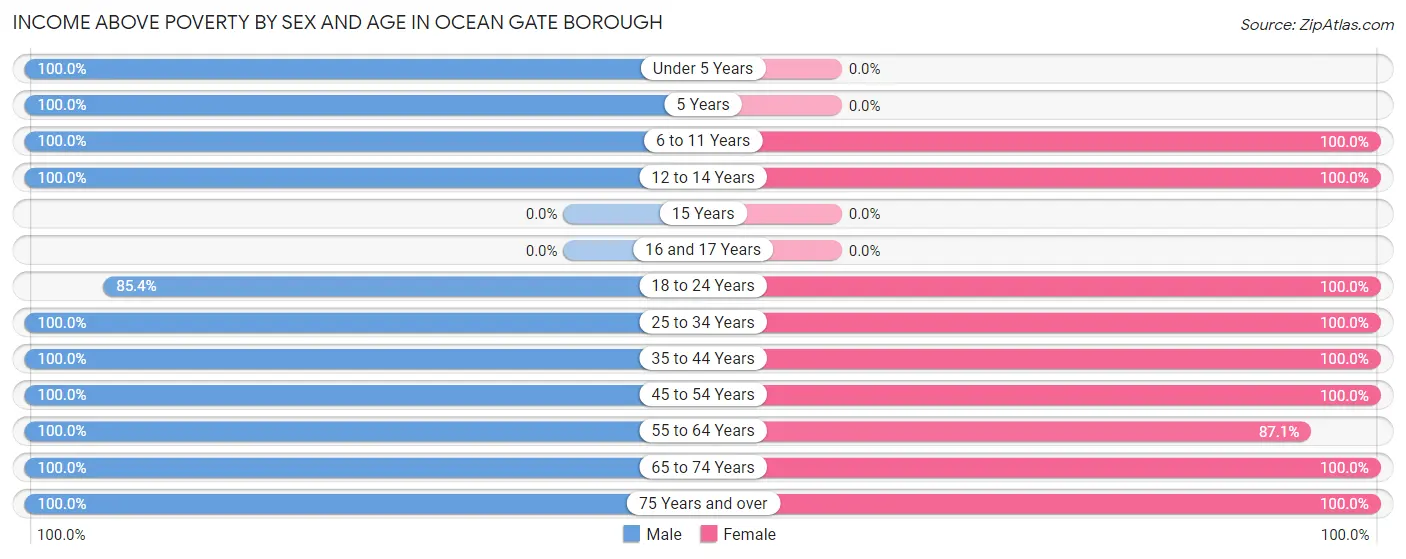
Income Above Poverty by Sex and Age in Ocean Gate borough
According to the poverty statistics in Ocean Gate borough, males aged under 5 years and females aged 6 to 11 years are the age groups that are most secure financially, with 100.0% of males and 100.0% of females in these age groups living above the poverty line.
| Age Bracket | Male | Female |
| Under 5 Years | 28 (100.0%) | 0 (0.0%) |
| 5 Years | 25 (100.0%) | 0 (0.0%) |
| 6 to 11 Years | 54 (100.0%) | 72 (100.0%) |
| 12 to 14 Years | 24 (100.0%) | 65 (100.0%) |
| 15 Years | 0 (0.0%) | 0 (0.0%) |
| 16 and 17 Years | 0 (0.0%) | 0 (0.0%) |
| 18 to 24 Years | 76 (85.4%) | 88 (100.0%) |
| 25 to 34 Years | 92 (100.0%) | 73 (100.0%) |
| 35 to 44 Years | 79 (100.0%) | 114 (100.0%) |
| 45 to 54 Years | 72 (100.0%) | 62 (100.0%) |
| 55 to 64 Years | 139 (100.0%) | 155 (87.1%) |
| 65 to 74 Years | 145 (100.0%) | 142 (100.0%) |
| 75 Years and over | 35 (100.0%) | 72 (100.0%) |
| Total | 769 (98.3%) | 843 (97.3%) |
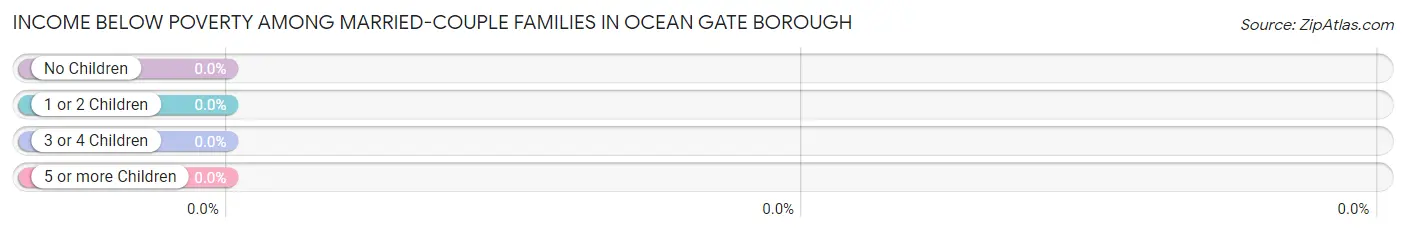
Income Below Poverty Among Married-Couple Families in Ocean Gate borough
| Children | Above Poverty | Below Poverty |
| No Children | 172 (100.0%) | 0 (0.0%) |
| 1 or 2 Children | 89 (100.0%) | 0 (0.0%) |
| 3 or 4 Children | 11 (100.0%) | 0 (0.0%) |
| 5 or more Children | 0 (0.0%) | 0 (0.0%) |
| Total | 272 (100.0%) | 0 (0.0%) |
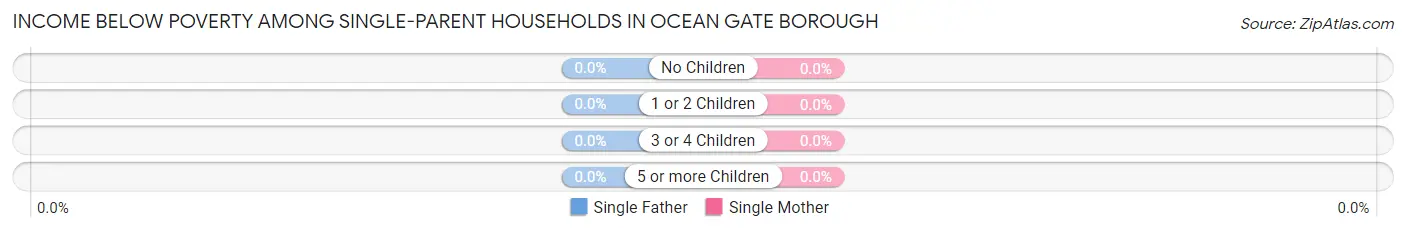
Income Below Poverty Among Single-Parent Households in Ocean Gate borough
| Children | Single Father | Single Mother |
| No Children | 0 (0.0%) | 0 (0.0%) |
| 1 or 2 Children | 0 (0.0%) | 0 (0.0%) |
| 3 or 4 Children | 0 (0.0%) | 0 (0.0%) |
| 5 or more Children | 0 (0.0%) | 0 (0.0%) |
| Total | 0 (0.0%) | 0 (0.0%) |
Income Below Poverty Among Married-Couple vs Single-Parent Households in Ocean Gate borough
| Children | Married-Couple Families | Single-Parent Households |
| No Children | 0 (0.0%) | 0 (0.0%) |
| 1 or 2 Children | 0 (0.0%) | 0 (0.0%) |
| 3 or 4 Children | 0 (0.0%) | 0 (0.0%) |
| 5 or more Children | 0 (0.0%) | 0 (0.0%) |
| Total | 0 (0.0%) | 0 (0.0%) |
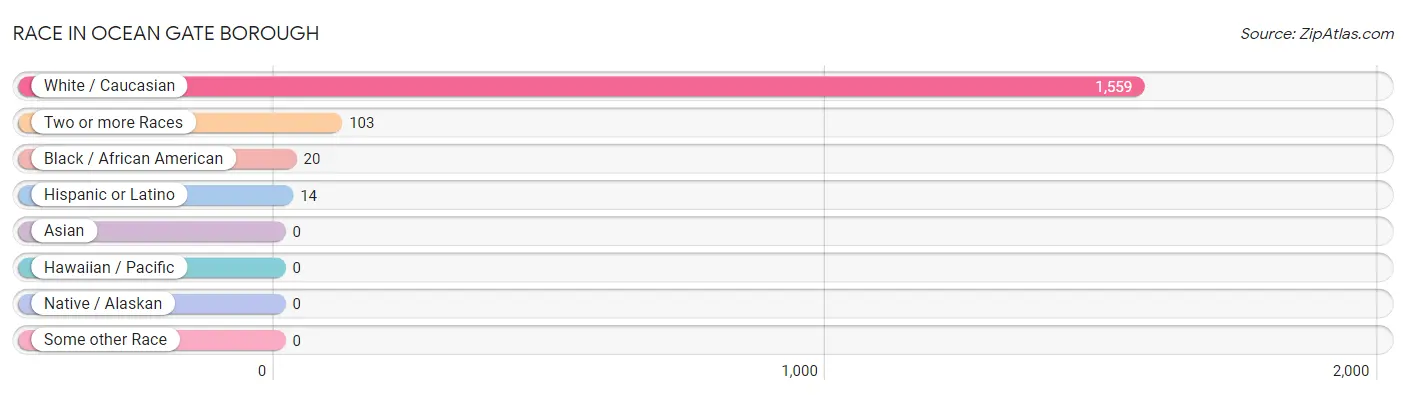
Race in Ocean Gate borough
The most populous races in Ocean Gate borough are White / Caucasian (1,559 | 92.7%), Two or more Races (103 | 6.1%), and Black / African American (20 | 1.2%).
| Race | # Population | % Population |
| Asian | 0 | 0.0% |
| Black / African American | 20 | 1.2% |
| Hawaiian / Pacific | 0 | 0.0% |
| Hispanic or Latino | 14 | 0.8% |
| Native / Alaskan | 0 | 0.0% |
| White / Caucasian | 1,559 | 92.7% |
| Two or more Races | 103 | 6.1% |
| Some other Race | 0 | 0.0% |
| Total | 1,682 | 100.0% |
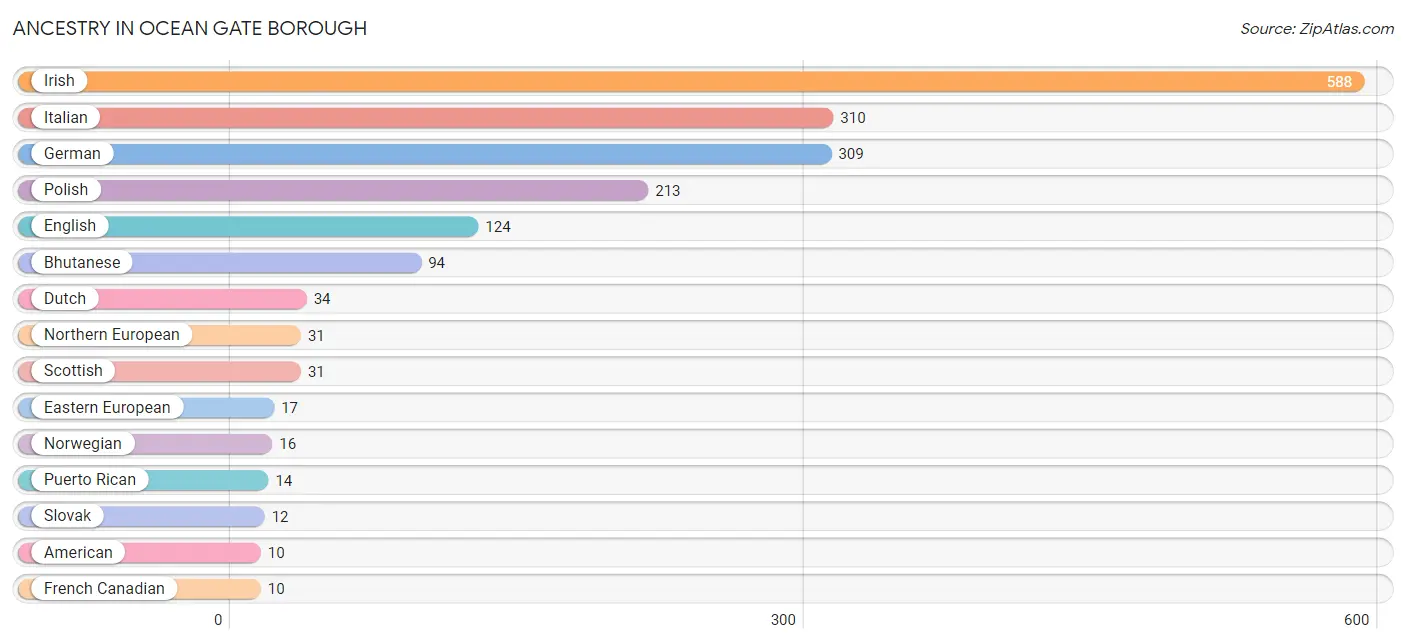
Ancestry in Ocean Gate borough
The most populous ancestries reported in Ocean Gate borough are Irish (588 | 35.0%), Italian (310 | 18.4%), German (309 | 18.4%), Polish (213 | 12.7%), and English (124 | 7.4%), together accounting for 91.8% of all Ocean Gate borough residents.
| Ancestry | # Population | % Population |
| American | 10 | 0.6% |
| Bhutanese | 94 | 5.6% |
| Dutch | 34 | 2.0% |
| Eastern European | 17 | 1.0% |
| English | 124 | 7.4% |
| French Canadian | 10 | 0.6% |
| German | 309 | 18.4% |
| Greek | 6 | 0.4% |
| Hungarian | 10 | 0.6% |
| Irish | 588 | 35.0% |
| Italian | 310 | 18.4% |
| Northern European | 31 | 1.8% |
| Norwegian | 16 | 0.9% |
| Pennsylvania German | 9 | 0.5% |
| Polish | 213 | 12.7% |
| Portuguese | 10 | 0.6% |
| Puerto Rican | 14 | 0.8% |
| Scottish | 31 | 1.8% |
| Slovak | 12 | 0.7% |
| Swedish | 1 | 0.1% |
| Yugoslavian | 7 | 0.4% | View All 21 Rows |
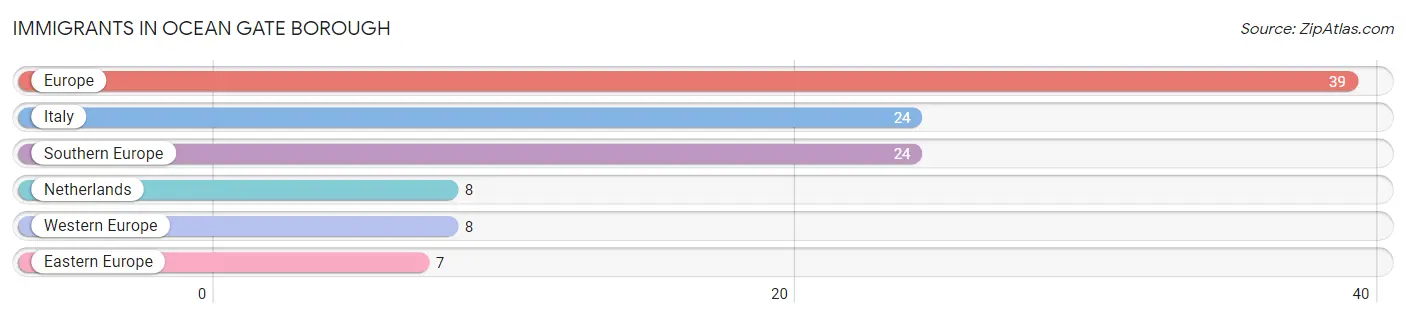
Immigrants in Ocean Gate borough
The most numerous immigrant groups reported in Ocean Gate borough came from Europe (39 | 2.3%), Italy (24 | 1.4%), Southern Europe (24 | 1.4%), Netherlands (8 | 0.5%), and Western Europe (8 | 0.5%), together accounting for 6.1% of all Ocean Gate borough residents.
| Immigration Origin | # Population | % Population |
| Eastern Europe | 7 | 0.4% |
| Europe | 39 | 2.3% |
| Italy | 24 | 1.4% |
| Netherlands | 8 | 0.5% |
| Southern Europe | 24 | 1.4% |
| Western Europe | 8 | 0.5% | View All 6 Rows |
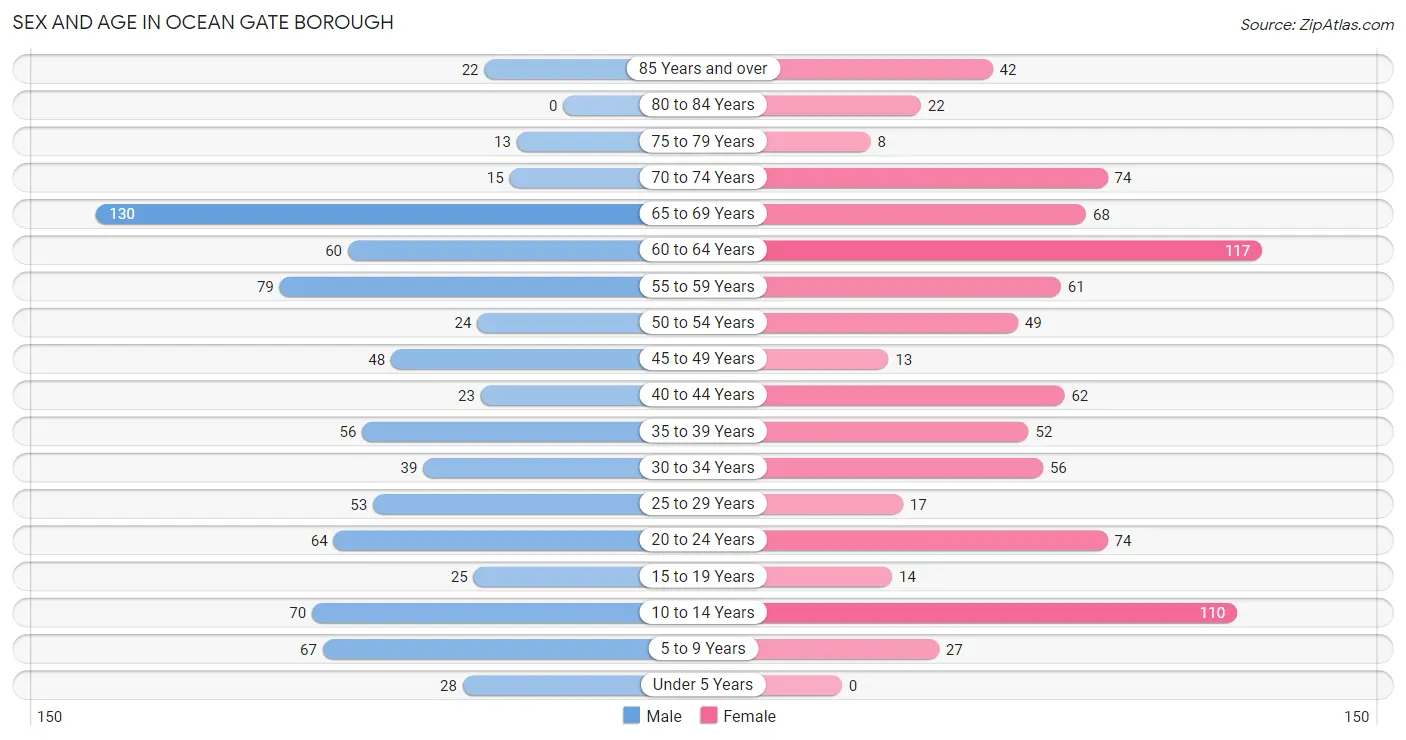
Sex and Age in Ocean Gate borough
Sex and Age in Ocean Gate borough
The most populous age groups in Ocean Gate borough are 65 to 69 Years (130 | 15.9%) for men and 60 to 64 Years (117 | 13.5%) for women.
| Age Bracket | Male | Female |
| Under 5 Years | 28 (3.4%) | 0 (0.0%) |
| 5 to 9 Years | 67 (8.2%) | 27 (3.1%) |
| 10 to 14 Years | 70 (8.6%) | 110 (12.7%) |
| 15 to 19 Years | 25 (3.1%) | 14 (1.6%) |
| 20 to 24 Years | 64 (7.8%) | 74 (8.6%) |
| 25 to 29 Years | 53 (6.5%) | 17 (2.0%) |
| 30 to 34 Years | 39 (4.8%) | 56 (6.5%) |
| 35 to 39 Years | 56 (6.9%) | 52 (6.0%) |
| 40 to 44 Years | 23 (2.8%) | 62 (7.2%) |
| 45 to 49 Years | 48 (5.9%) | 13 (1.5%) |
| 50 to 54 Years | 24 (2.9%) | 49 (5.7%) |
| 55 to 59 Years | 79 (9.7%) | 61 (7.0%) |
| 60 to 64 Years | 60 (7.3%) | 117 (13.5%) |
| 65 to 69 Years | 130 (15.9%) | 68 (7.9%) |
| 70 to 74 Years | 15 (1.8%) | 74 (8.6%) |
| 75 to 79 Years | 13 (1.6%) | 8 (0.9%) |
| 80 to 84 Years | 0 (0.0%) | 22 (2.5%) |
| 85 Years and over | 22 (2.7%) | 42 (4.9%) |
| Total | 816 (100.0%) | 866 (100.0%) |
Families and Households in Ocean Gate borough
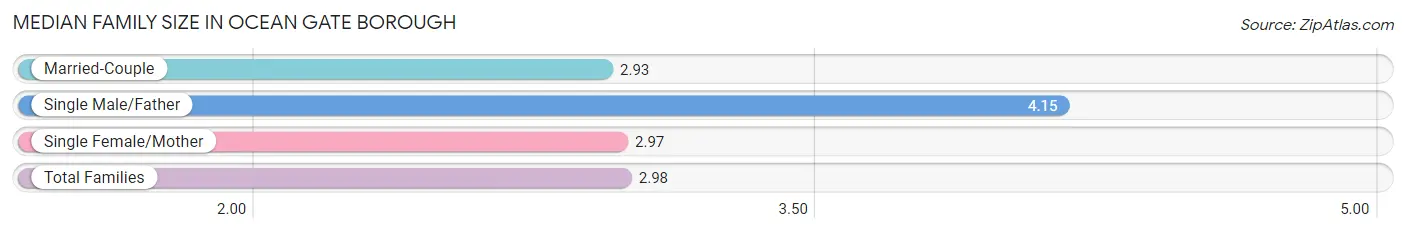
Median Family Size in Ocean Gate borough
The median family size in Ocean Gate borough is 2.98 persons per family, with single male/father families (13 | 3.2%) accounting for the largest median family size of 4.15 persons per family. On the other hand, married-couple families (272 | 67.7%) represent the smallest median family size with 2.93 persons per family.
| Family Type | # Families | Family Size |
| Married-Couple | 272 (67.7%) | 2.93 |
| Single Male/Father | 13 (3.2%) | 4.15 |
| Single Female/Mother | 117 (29.1%) | 2.97 |
| Total Families | 402 (100.0%) | 2.98 |
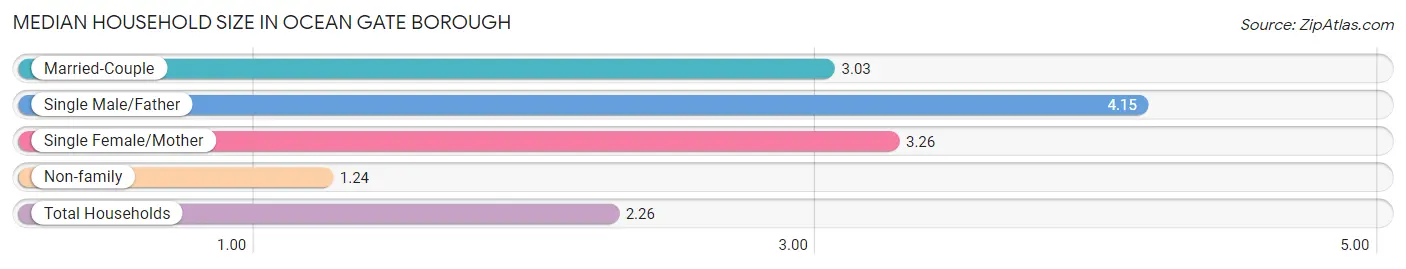
Median Household Size in Ocean Gate borough
The median household size in Ocean Gate borough is 2.26 persons per household, with single male/father households (13 | 1.8%) accounting for the largest median household size of 4.15 persons per household. non-family households (341 | 45.9%) represent the smallest median household size with 1.24 persons per household.
| Household Type | # Households | Household Size |
| Married-Couple | 272 (36.6%) | 3.03 |
| Single Male/Father | 13 (1.8%) | 4.15 |
| Single Female/Mother | 117 (15.8%) | 3.26 |
| Non-family | 341 (45.9%) | 1.24 |
| Total Households | 743 (100.0%) | 2.26 |
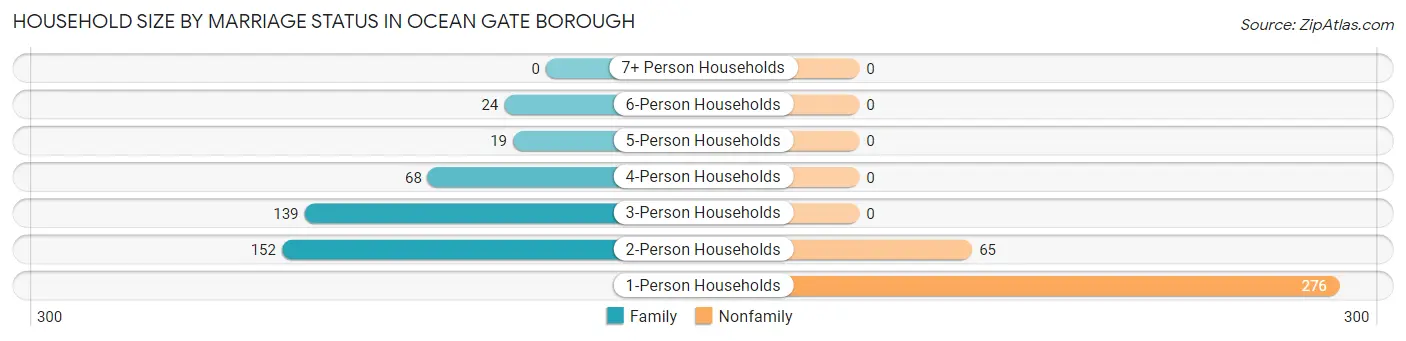
Household Size by Marriage Status in Ocean Gate borough
Out of a total of 743 households in Ocean Gate borough, 402 (54.1%) are family households, while 341 (45.9%) are nonfamily households. The most numerous type of family households are 2-person households, comprising 152, and the most common type of nonfamily households are 1-person households, comprising 276.
| Household Size | Family Households | Nonfamily Households |
| 1-Person Households | - | 276 (37.1%) |
| 2-Person Households | 152 (20.5%) | 65 (8.7%) |
| 3-Person Households | 139 (18.7%) | 0 (0.0%) |
| 4-Person Households | 68 (9.1%) | 0 (0.0%) |
| 5-Person Households | 19 (2.6%) | 0 (0.0%) |
| 6-Person Households | 24 (3.2%) | 0 (0.0%) |
| 7+ Person Households | 0 (0.0%) | 0 (0.0%) |
| Total | 402 (54.1%) | 341 (45.9%) |
Female Fertility in Ocean Gate borough
Fertility by Age in Ocean Gate borough
| Age Bracket | Women with Births | Births / 1,000 Women |
| 15 to 19 years | 0 (0.0%) | 0.0 |
| 20 to 34 years | 0 (0.0%) | 0.0 |
| 35 to 50 years | 0 (0.0%) | 0.0 |
| Total | 0 (0.0%) | 0.0 |
Fertility by Age by Marriage Status in Ocean Gate borough
| Age Bracket | Married | Unmarried |
| 15 to 19 years | 0 (0.0%) | 0 (0.0%) |
| 20 to 34 years | 0 (0.0%) | 0 (0.0%) |
| 35 to 50 years | 0 (0.0%) | 0 (0.0%) |
| Total | 0 (0.0%) | 0 (0.0%) |
Fertility by Education in Ocean Gate borough
| Educational Attainment | Women with Births | Births / 1,000 Women |
| Less than High School | 0 (0.0%) | 0.0 |
| High School Diploma | 0 (0.0%) | 0.0 |
| College or Associate's Degree | 0 (0.0%) | 0.0 |
| Bachelor's Degree | 0 (0.0%) | 0.0 |
| Graduate Degree | 0 (0.0%) | 0.0 |
| Total | 0 (0.0%) | 0.0 |
Fertility by Education by Marriage Status in Ocean Gate borough
| Educational Attainment | Married | Unmarried |
| Less than High School | 0 (0.0%) | 0 (0.0%) |
| High School Diploma | 0 (0.0%) | 0 (0.0%) |
| College or Associate's Degree | 0 (0.0%) | 0 (0.0%) |
| Bachelor's Degree | 0 (0.0%) | 0 (0.0%) |
| Graduate Degree | 0 (0.0%) | 0 (0.0%) |
| Total | 0 (0.0%) | 0 (0.0%) |
Employment Characteristics in Ocean Gate borough
Employment by Class of Employer in Ocean Gate borough
Among the 784 employed individuals in Ocean Gate borough, private company employees (632 | 80.6%), self-employed (not incorporated) (54 | 6.9%), and not-for-profit organizations (46 | 5.9%) make up the most common classes of employment.
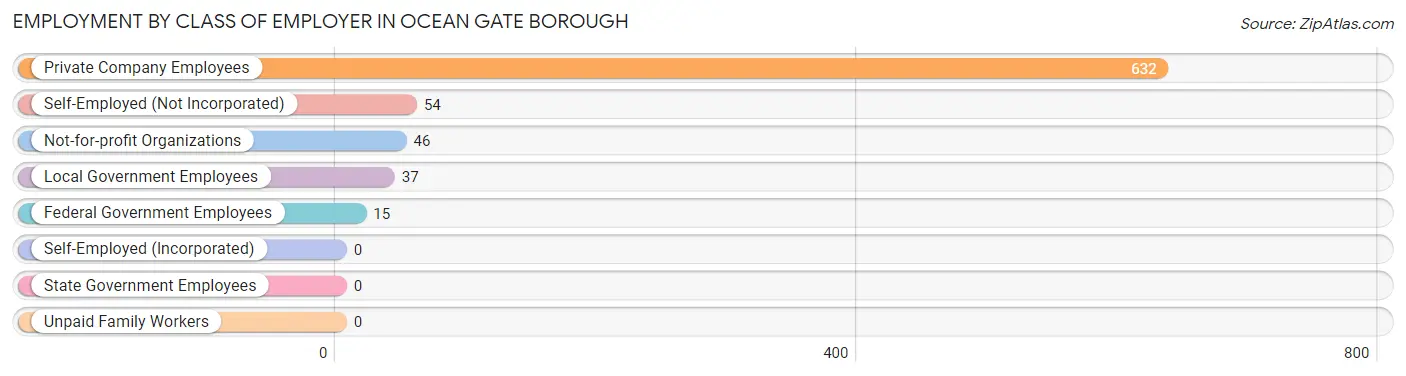
| Employer Class | # Employees | % Employees |
| Private Company Employees | 632 | 80.6% |
| Self-Employed (Incorporated) | 0 | 0.0% |
| Self-Employed (Not Incorporated) | 54 | 6.9% |
| Not-for-profit Organizations | 46 | 5.9% |
| Local Government Employees | 37 | 4.7% |
| State Government Employees | 0 | 0.0% |
| Federal Government Employees | 15 | 1.9% |
| Unpaid Family Workers | 0 | 0.0% |
| Total | 784 | 100.0% |
Employment Status by Age in Ocean Gate borough
According to the labor force statistics for Ocean Gate borough, out of the total population over 16 years of age (1,380), 60.0% or 828 individuals are in the labor force, with 3.4% or 28 of them unemployed. The age group with the highest labor force participation rate is 25 to 29 years, with 100.0% or 70 individuals in the labor force. Within the labor force, the 20 to 24 years age range has the highest percentage of unemployed individuals, with 12.3% or 14 of them being unemployed.
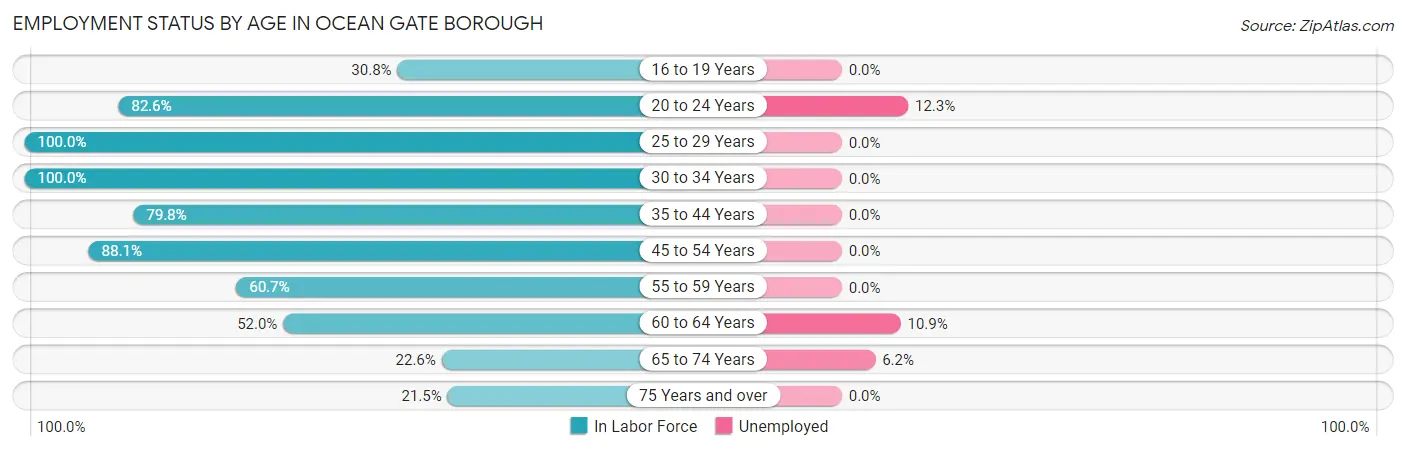
| Age Bracket | In Labor Force | Unemployed |
| 16 to 19 Years | 12 (30.8%) | 0 (0.0%) |
| 20 to 24 Years | 114 (82.6%) | 14 (12.3%) |
| 25 to 29 Years | 70 (100.0%) | 0 (0.0%) |
| 30 to 34 Years | 95 (100.0%) | 0 (0.0%) |
| 35 to 44 Years | 154 (79.8%) | 0 (0.0%) |
| 45 to 54 Years | 118 (88.1%) | 0 (0.0%) |
| 55 to 59 Years | 85 (60.7%) | 0 (0.0%) |
| 60 to 64 Years | 92 (52.0%) | 10 (10.9%) |
| 65 to 74 Years | 65 (22.6%) | 4 (6.2%) |
| 75 Years and over | 23 (21.5%) | 0 (0.0%) |
| Total | 828 (60.0%) | 28 (3.4%) |
Employment Status by Educational Attainment in Ocean Gate borough
According to labor force statistics for Ocean Gate borough, 75.9% of individuals (614) out of the total population between 25 and 64 years of age (809) are in the labor force, with 1.6% or 10 of them being unemployed. The group with the highest labor force participation rate are those with the educational attainment of high school diploma, with 83.5% or 284 individuals in the labor force. Within the labor force, individuals with high school diploma education have the highest percentage of unemployment, with 3.5% or 10 of them being unemployed.
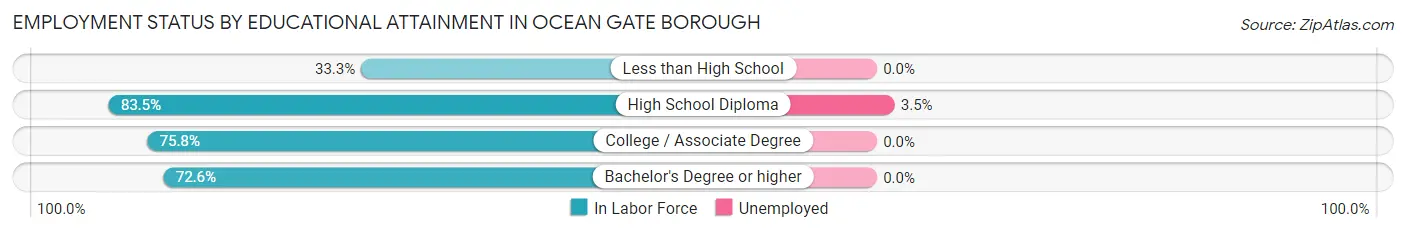
| Educational Attainment | In Labor Force | Unemployed |
| Less than High School | 13 (33.3%) | 0 (0.0%) |
| High School Diploma | 284 (83.5%) | 12 (3.5%) |
| College / Associate Degree | 113 (75.8%) | 0 (0.0%) |
| Bachelor's Degree or higher | 204 (72.6%) | 0 (0.0%) |
| Total | 614 (75.9%) | 13 (1.6%) |
Employment Occupations by Sex in Ocean Gate borough
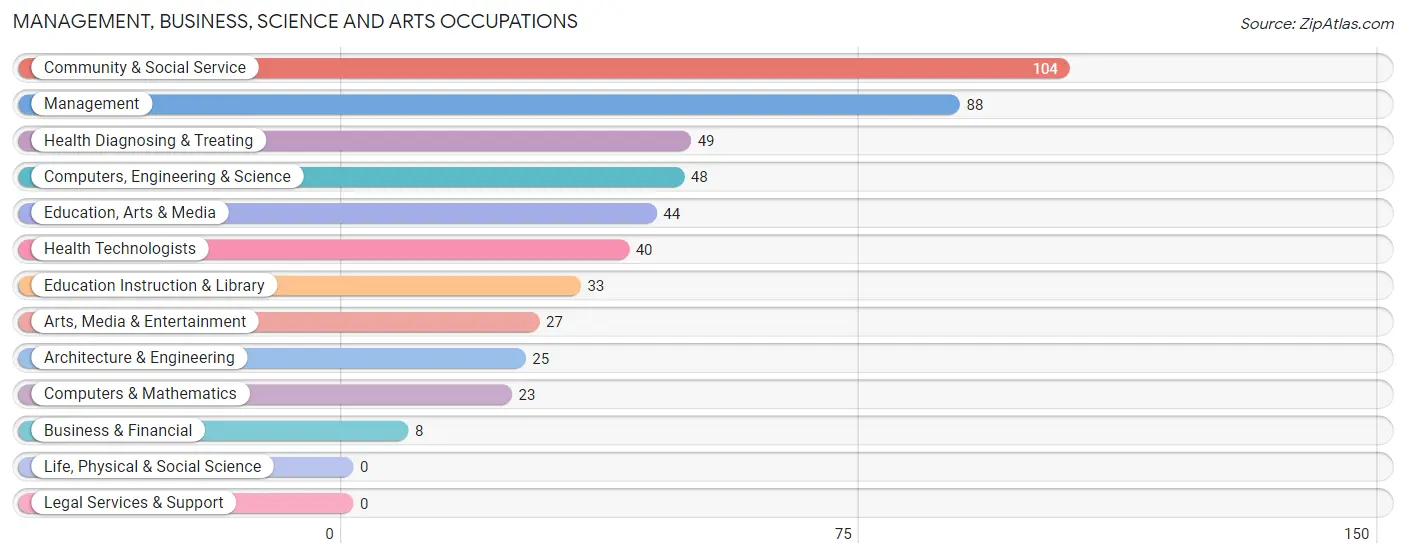
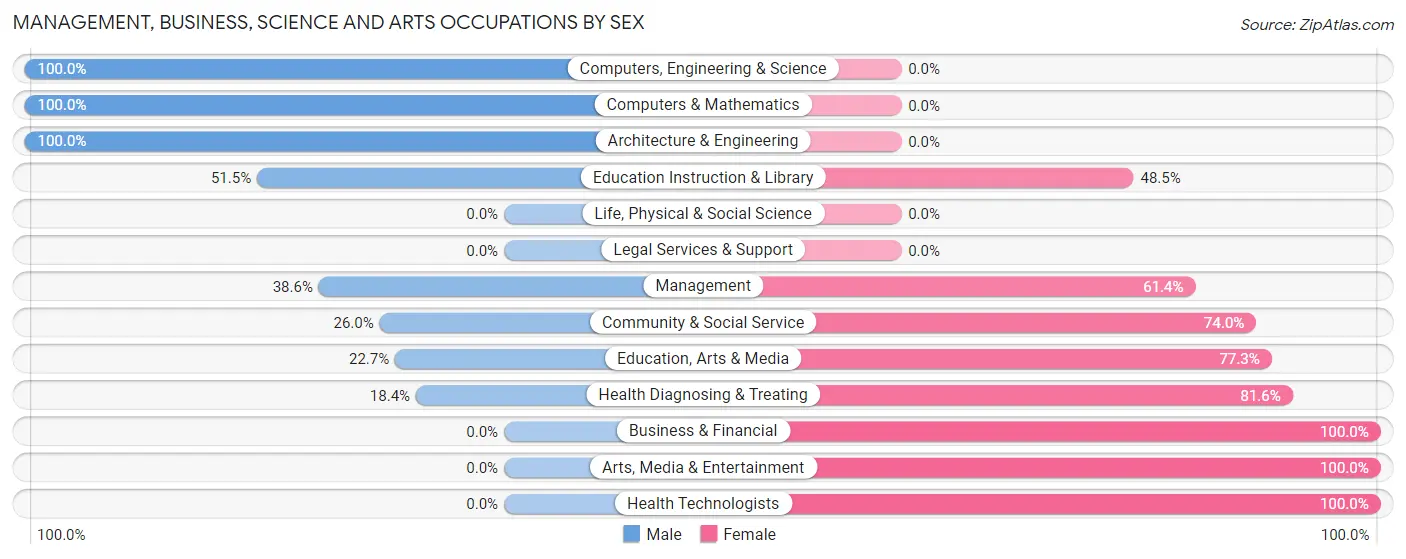
Management, Business, Science and Arts Occupations
The most common Management, Business, Science and Arts occupations in Ocean Gate borough are Community & Social Service (104 | 13.0%), Management (88 | 11.0%), Health Diagnosing & Treating (49 | 6.1%), Computers, Engineering & Science (48 | 6.0%), and Education, Arts & Media (44 | 5.5%).
Management, Business, Science and Arts Occupations by Sex
Within the Management, Business, Science and Arts occupations in Ocean Gate borough, the most male-oriented occupations are Computers, Engineering & Science (100.0%), Computers & Mathematics (100.0%), and Architecture & Engineering (100.0%), while the most female-oriented occupations are Business & Financial (100.0%), Arts, Media & Entertainment (100.0%), and Health Technologists (100.0%).
| Occupation | Male | Female |
| Management | 34 (38.6%) | 54 (61.4%) |
| Business & Financial | 0 (0.0%) | 8 (100.0%) |
| Computers, Engineering & Science | 48 (100.0%) | 0 (0.0%) |
| Computers & Mathematics | 23 (100.0%) | 0 (0.0%) |
| Architecture & Engineering | 25 (100.0%) | 0 (0.0%) |
| Life, Physical & Social Science | 0 (0.0%) | 0 (0.0%) |
| Community & Social Service | 27 (26.0%) | 77 (74.0%) |
| Education, Arts & Media | 10 (22.7%) | 34 (77.3%) |
| Legal Services & Support | 0 (0.0%) | 0 (0.0%) |
| Education Instruction & Library | 17 (51.5%) | 16 (48.5%) |
| Arts, Media & Entertainment | 0 (0.0%) | 27 (100.0%) |
| Health Diagnosing & Treating | 9 (18.4%) | 40 (81.6%) |
| Health Technologists | 0 (0.0%) | 40 (100.0%) |
| Total (Category) | 118 (39.7%) | 179 (60.3%) |
| Total (Overall) | 394 (49.2%) | 406 (50.7%) |
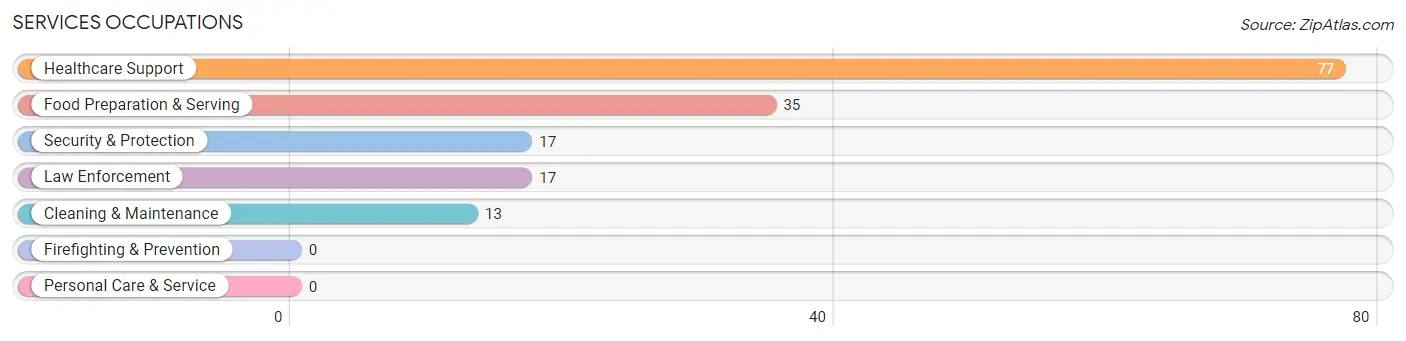
Services Occupations
The most common Services occupations in Ocean Gate borough are Healthcare Support (77 | 9.6%), Food Preparation & Serving (35 | 4.4%), Security & Protection (17 | 2.1%), Law Enforcement (17 | 2.1%), and Cleaning & Maintenance (13 | 1.6%).
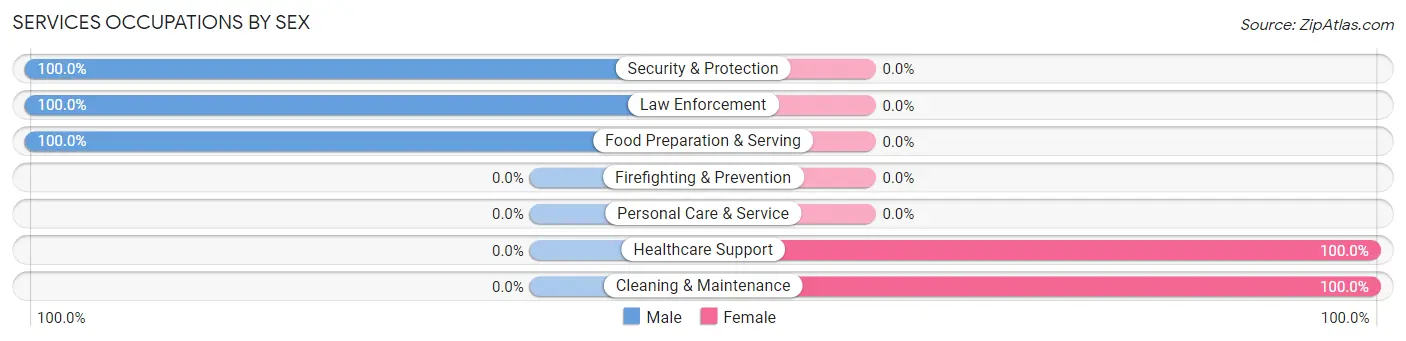
Services Occupations by Sex
Within the Services occupations in Ocean Gate borough, the most male-oriented occupations are Security & Protection (100.0%), Law Enforcement (100.0%), and Food Preparation & Serving (100.0%), while the most female-oriented occupations are Healthcare Support (100.0%), and Cleaning & Maintenance (100.0%).
| Occupation | Male | Female |
| Healthcare Support | 0 (0.0%) | 77 (100.0%) |
| Security & Protection | 17 (100.0%) | 0 (0.0%) |
| Firefighting & Prevention | 0 (0.0%) | 0 (0.0%) |
| Law Enforcement | 17 (100.0%) | 0 (0.0%) |
| Food Preparation & Serving | 35 (100.0%) | 0 (0.0%) |
| Cleaning & Maintenance | 0 (0.0%) | 13 (100.0%) |
| Personal Care & Service | 0 (0.0%) | 0 (0.0%) |
| Total (Category) | 52 (36.6%) | 90 (63.4%) |
| Total (Overall) | 394 (49.2%) | 406 (50.7%) |
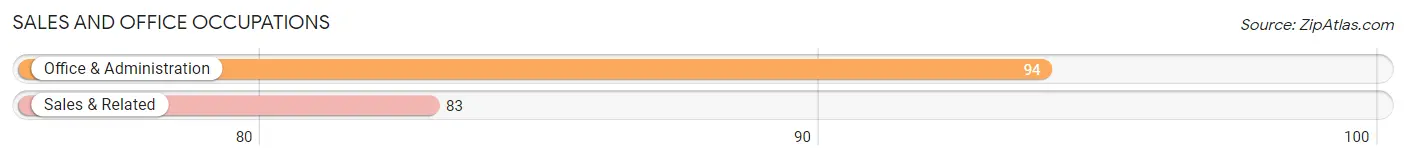
Sales and Office Occupations
The most common Sales and Office occupations in Ocean Gate borough are Office & Administration (94 | 11.7%), and Sales & Related (83 | 10.4%).
Sales and Office Occupations by Sex
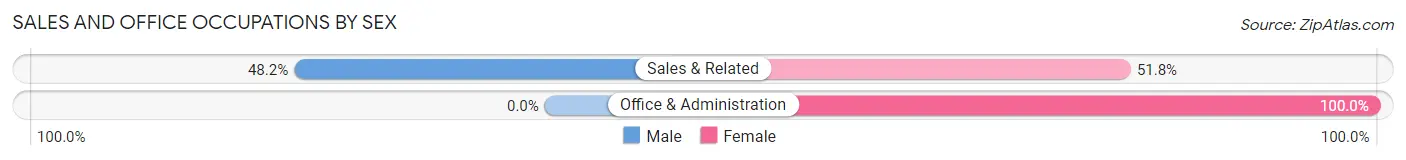
| Occupation | Male | Female |
| Sales & Related | 40 (48.2%) | 43 (51.8%) |
| Office & Administration | 0 (0.0%) | 94 (100.0%) |
| Total (Category) | 40 (22.6%) | 137 (77.4%) |
| Total (Overall) | 394 (49.2%) | 406 (50.7%) |
Natural Resources, Construction and Maintenance Occupations
The most common Natural Resources, Construction and Maintenance occupations in Ocean Gate borough are Construction & Extraction (61 | 7.6%), and Installation, Maintenance & Repair (26 | 3.3%).
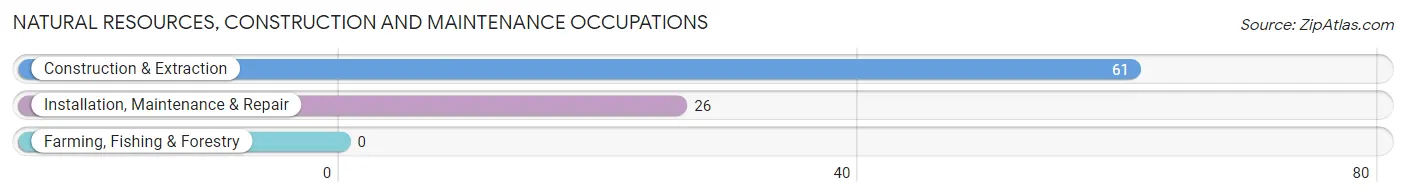
Natural Resources, Construction and Maintenance Occupations by Sex

| Occupation | Male | Female |
| Farming, Fishing & Forestry | 0 (0.0%) | 0 (0.0%) |
| Construction & Extraction | 61 (100.0%) | 0 (0.0%) |
| Installation, Maintenance & Repair | 26 (100.0%) | 0 (0.0%) |
| Total (Category) | 87 (100.0%) | 0 (0.0%) |
| Total (Overall) | 394 (49.2%) | 406 (50.7%) |
Production, Transportation and Moving Occupations
The most common Production, Transportation and Moving occupations in Ocean Gate borough are Material Moving (51 | 6.4%), Production (33 | 4.1%), and Transportation (13 | 1.6%).
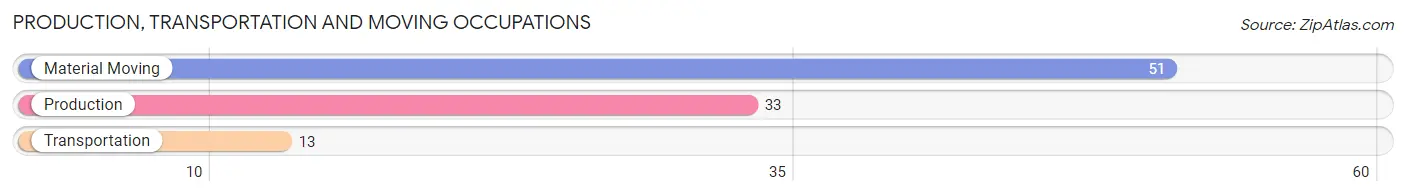
Production, Transportation and Moving Occupations by Sex
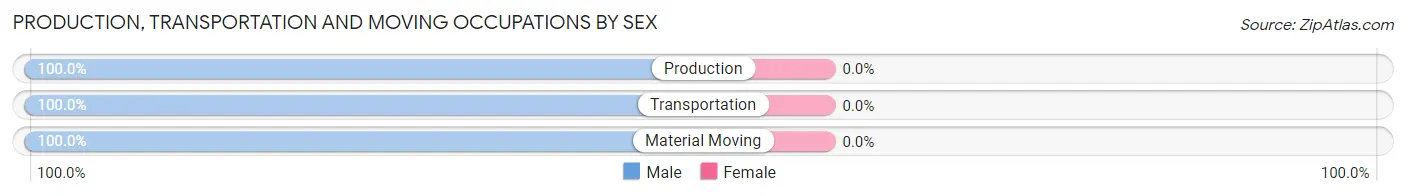
| Occupation | Male | Female |
| Production | 33 (100.0%) | 0 (0.0%) |
| Transportation | 13 (100.0%) | 0 (0.0%) |
| Material Moving | 51 (100.0%) | 0 (0.0%) |
| Total (Category) | 97 (100.0%) | 0 (0.0%) |
| Total (Overall) | 394 (49.2%) | 406 (50.7%) |
Employment Industries by Sex in Ocean Gate borough
Employment Industries in Ocean Gate borough
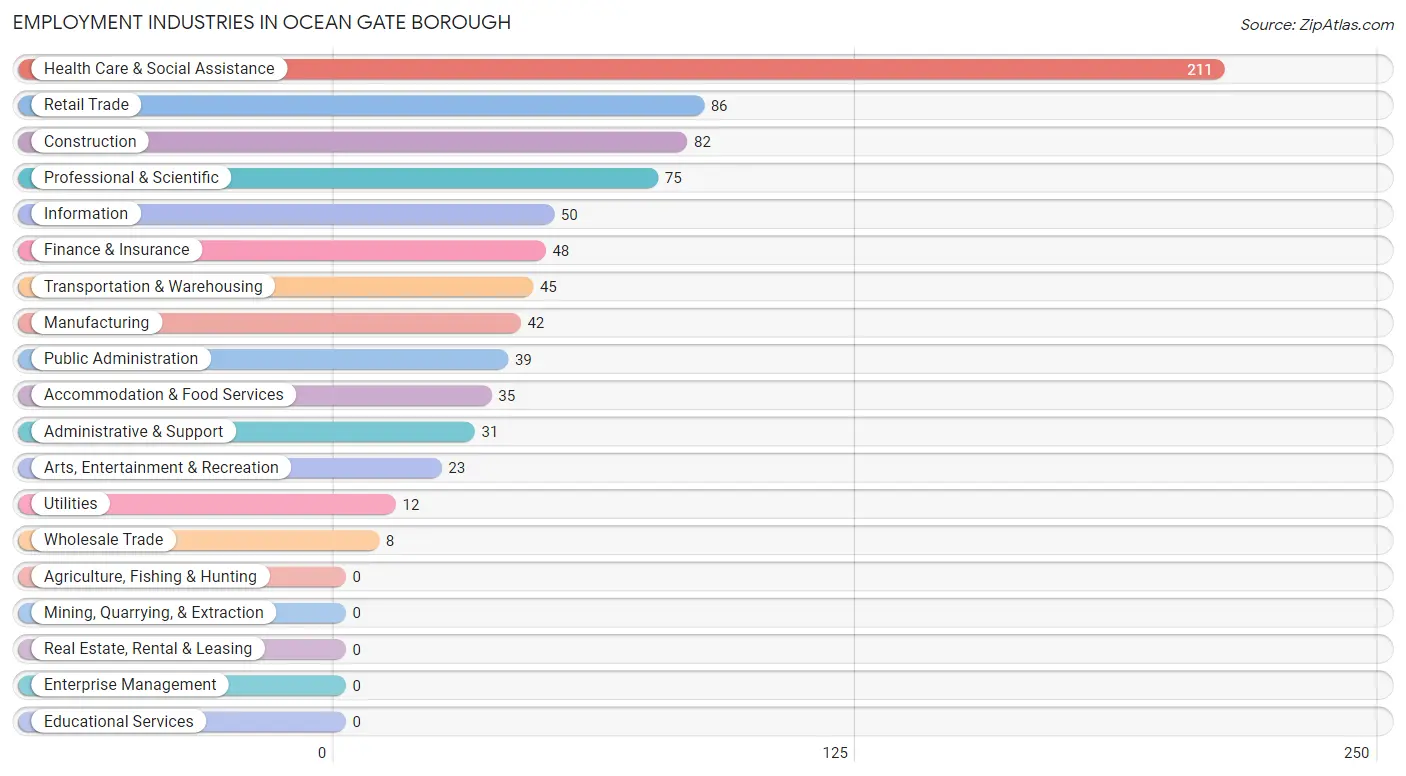
The major employment industries in Ocean Gate borough include Health Care & Social Assistance (211 | 26.4%), Retail Trade (86 | 10.7%), Construction (82 | 10.2%), Professional & Scientific (75 | 9.4%), and Information (50 | 6.2%).
Employment Industries by Sex in Ocean Gate borough
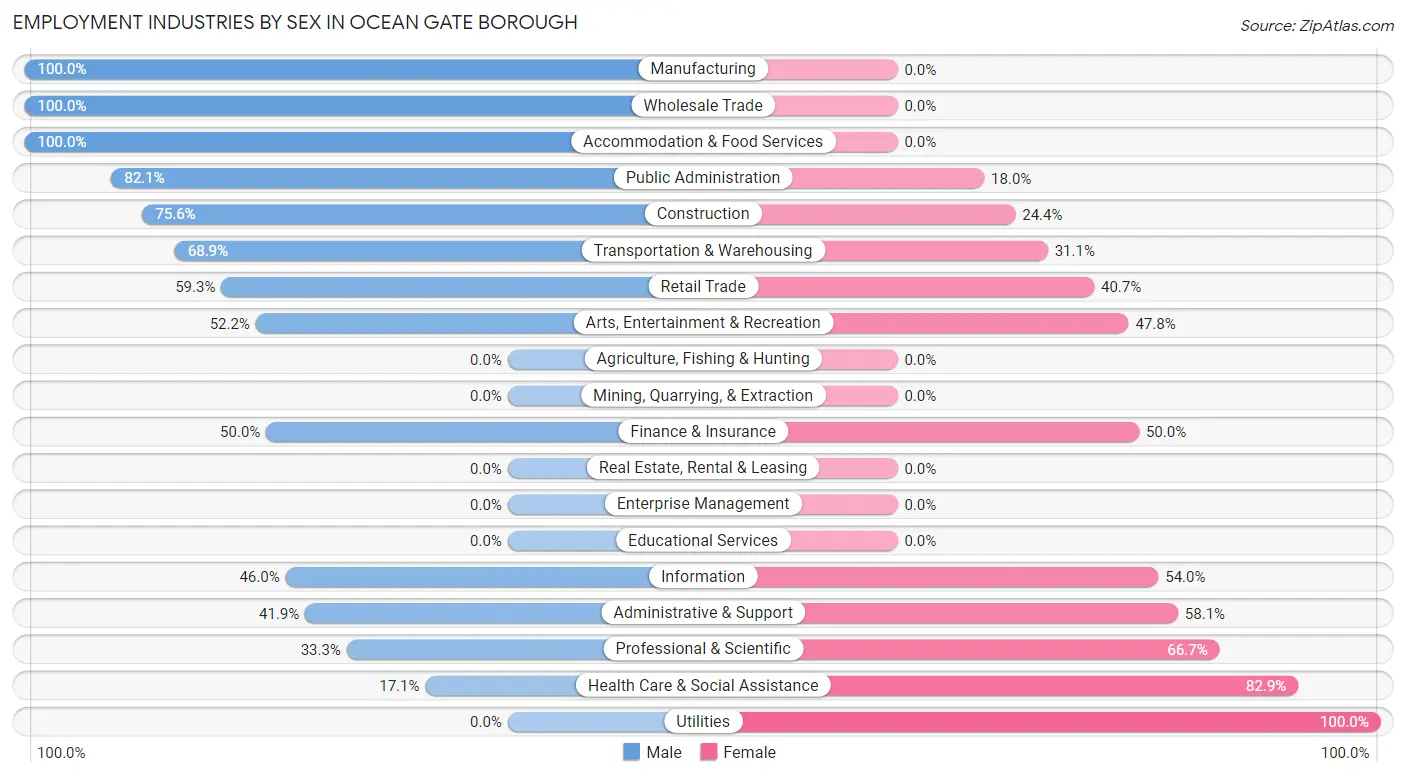
The Ocean Gate borough industries that see more men than women are Manufacturing (100.0%), Wholesale Trade (100.0%), and Accommodation & Food Services (100.0%), whereas the industries that tend to have a higher number of women are Utilities (100.0%), Health Care & Social Assistance (82.9%), and Professional & Scientific (66.7%).
| Industry | Male | Female |
| Agriculture, Fishing & Hunting | 0 (0.0%) | 0 (0.0%) |
| Mining, Quarrying, & Extraction | 0 (0.0%) | 0 (0.0%) |
| Construction | 62 (75.6%) | 20 (24.4%) |
| Manufacturing | 42 (100.0%) | 0 (0.0%) |
| Wholesale Trade | 8 (100.0%) | 0 (0.0%) |
| Retail Trade | 51 (59.3%) | 35 (40.7%) |
| Transportation & Warehousing | 31 (68.9%) | 14 (31.1%) |
| Utilities | 0 (0.0%) | 12 (100.0%) |
| Information | 23 (46.0%) | 27 (54.0%) |
| Finance & Insurance | 24 (50.0%) | 24 (50.0%) |
| Real Estate, Rental & Leasing | 0 (0.0%) | 0 (0.0%) |
| Professional & Scientific | 25 (33.3%) | 50 (66.7%) |
| Enterprise Management | 0 (0.0%) | 0 (0.0%) |
| Administrative & Support | 13 (41.9%) | 18 (58.1%) |
| Educational Services | 0 (0.0%) | 0 (0.0%) |
| Health Care & Social Assistance | 36 (17.1%) | 175 (82.9%) |
| Arts, Entertainment & Recreation | 12 (52.2%) | 11 (47.8%) |
| Accommodation & Food Services | 35 (100.0%) | 0 (0.0%) |
| Public Administration | 32 (82.1%) | 7 (17.9%) |
| Total | 394 (49.2%) | 406 (50.7%) |
Education in Ocean Gate borough
School Enrollment in Ocean Gate borough
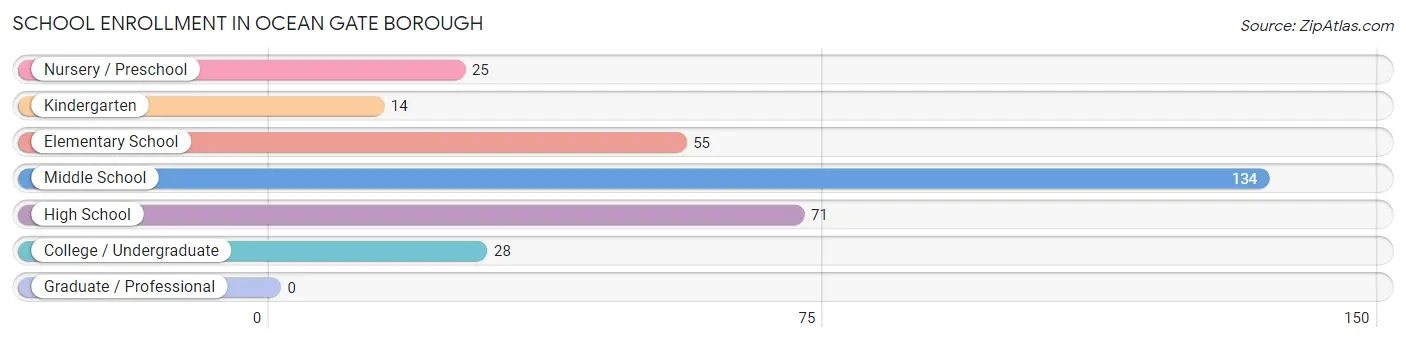
The most common levels of schooling among the 327 students in Ocean Gate borough are middle school (134 | 41.0%), high school (71 | 21.7%), and elementary school (55 | 16.8%).
| School Level | # Students | % Students |
| Nursery / Preschool | 25 | 7.6% |
| Kindergarten | 14 | 4.3% |
| Elementary School | 55 | 16.8% |
| Middle School | 134 | 41.0% |
| High School | 71 | 21.7% |
| College / Undergraduate | 28 | 8.6% |
| Graduate / Professional | 0 | 0.0% |
| Total | 327 | 100.0% |
School Enrollment by Age by Funding Source in Ocean Gate borough
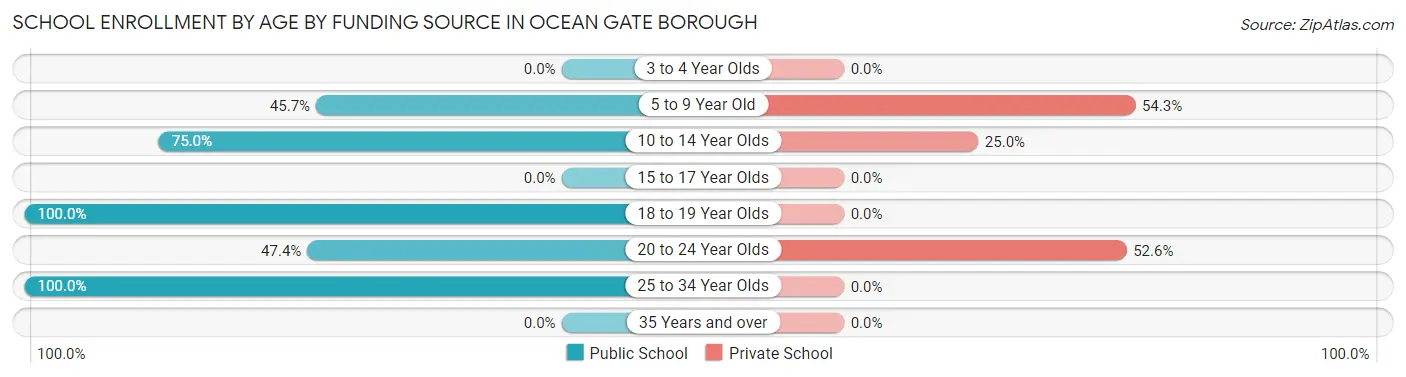
Out of a total of 327 students who are enrolled in schools in Ocean Gate borough, 106 (32.4%) attend a private institution, while the remaining 221 (67.6%) are enrolled in public schools. The age group of 5 to 9 year old has the highest likelihood of being enrolled in private schools, with 51 (54.3% in the age bracket) enrolled. Conversely, the age group of 18 to 19 year olds has the lowest likelihood of being enrolled in a private school, with 25 (100.0% in the age bracket) attending a public institution.
| Age Bracket | Public School | Private School |
| 3 to 4 Year Olds | 0 (0.0%) | 0 (0.0%) |
| 5 to 9 Year Old | 43 (45.7%) | 51 (54.3%) |
| 10 to 14 Year Olds | 135 (75.0%) | 45 (25.0%) |
| 15 to 17 Year Olds | 0 (0.0%) | 0 (0.0%) |
| 18 to 19 Year Olds | 25 (100.0%) | 0 (0.0%) |
| 20 to 24 Year Olds | 9 (47.4%) | 10 (52.6%) |
| 25 to 34 Year Olds | 9 (100.0%) | 0 (0.0%) |
| 35 Years and over | 0 (0.0%) | 0 (0.0%) |
| Total | 221 (67.6%) | 106 (32.4%) |
Educational Attainment by Field of Study in Ocean Gate borough
Business (78 | 19.4%), science & technology (77 | 19.1%), visual & performing arts (61 | 15.1%), liberal arts & history (42 | 10.4%), and arts & humanities (41 | 10.2%) are the most common fields of study among 403 individuals in Ocean Gate borough who have obtained a bachelor's degree or higher.
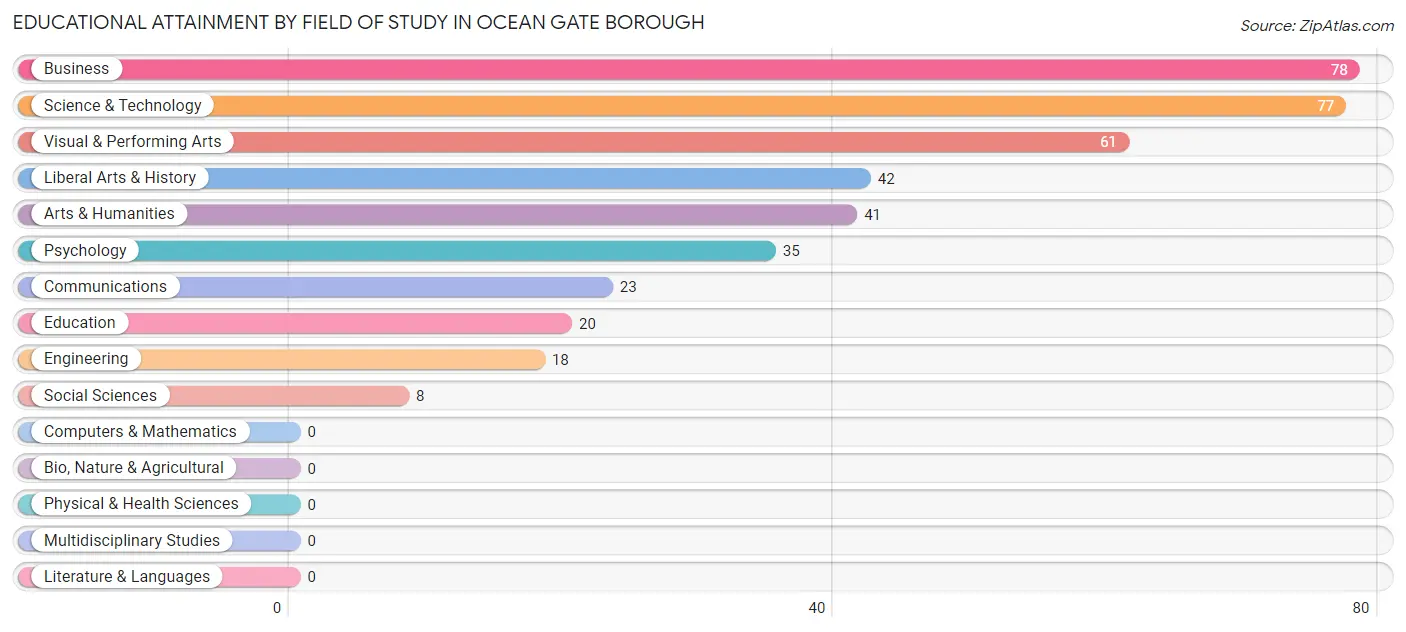
| Field of Study | # Graduates | % Graduates |
| Computers & Mathematics | 0 | 0.0% |
| Bio, Nature & Agricultural | 0 | 0.0% |
| Physical & Health Sciences | 0 | 0.0% |
| Psychology | 35 | 8.7% |
| Social Sciences | 8 | 2.0% |
| Engineering | 18 | 4.5% |
| Multidisciplinary Studies | 0 | 0.0% |
| Science & Technology | 77 | 19.1% |
| Business | 78 | 19.4% |
| Education | 20 | 5.0% |
| Literature & Languages | 0 | 0.0% |
| Liberal Arts & History | 42 | 10.4% |
| Visual & Performing Arts | 61 | 15.1% |
| Communications | 23 | 5.7% |
| Arts & Humanities | 41 | 10.2% |
| Total | 403 | 100.0% |
Transportation & Commute in Ocean Gate borough
Vehicle Availability by Sex in Ocean Gate borough
The most prevalent vehicle ownership categories in Ocean Gate borough are males with 2 vehicles (145, accounting for 38.4%) and females with 2 vehicles (150, making up 35.7%).
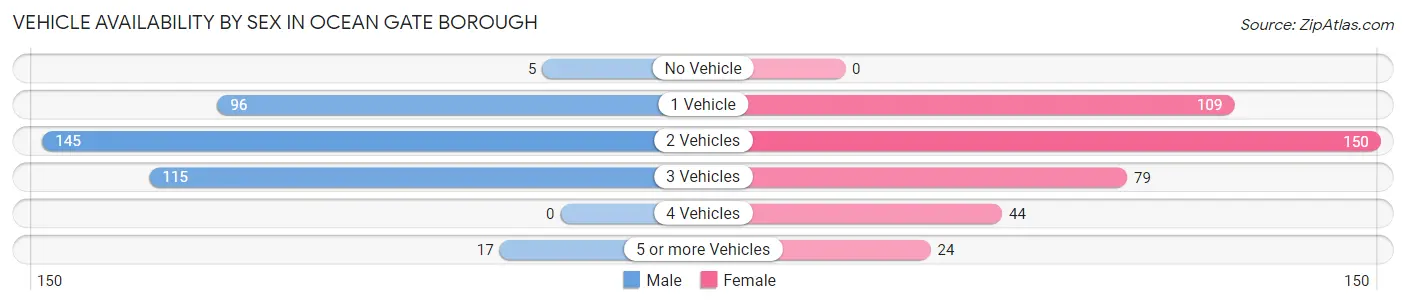
| Vehicles Available | Male | Female |
| No Vehicle | 5 (1.3%) | 0 (0.0%) |
| 1 Vehicle | 96 (25.4%) | 109 (26.9%) |
| 2 Vehicles | 145 (38.4%) | 150 (36.9%) |
| 3 Vehicles | 115 (30.4%) | 79 (19.5%) |
| 4 Vehicles | 0 (0.0%) | 44 (10.8%) |
| 5 or more Vehicles | 17 (4.5%) | 24 (5.9%) |
| Total | 378 (100.0%) | 406 (100.0%) |
Commute Time in Ocean Gate borough
The most frequently occuring commute durations in Ocean Gate borough are 20 to 24 minutes (218 commuters, 30.2%), 45 to 59 minutes (104 commuters, 14.4%), and 30 to 34 minutes (102 commuters, 14.1%).
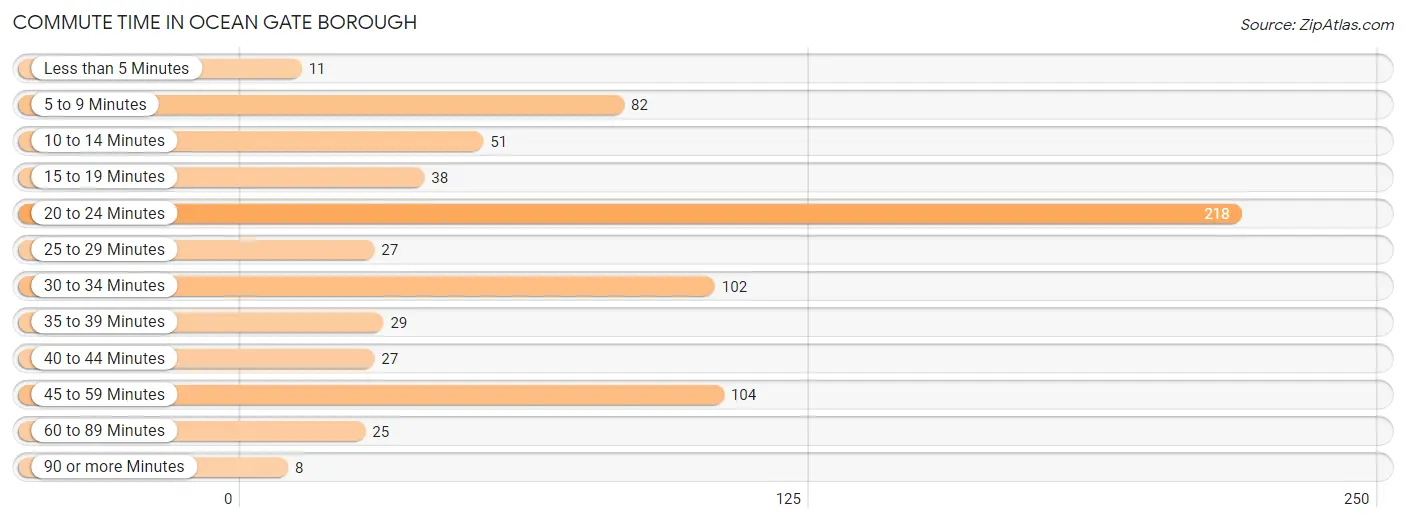
| Commute Time | # Commuters | % Commuters |
| Less than 5 Minutes | 11 | 1.5% |
| 5 to 9 Minutes | 82 | 11.4% |
| 10 to 14 Minutes | 51 | 7.1% |
| 15 to 19 Minutes | 38 | 5.3% |
| 20 to 24 Minutes | 218 | 30.2% |
| 25 to 29 Minutes | 27 | 3.7% |
| 30 to 34 Minutes | 102 | 14.1% |
| 35 to 39 Minutes | 29 | 4.0% |
| 40 to 44 Minutes | 27 | 3.7% |
| 45 to 59 Minutes | 104 | 14.4% |
| 60 to 89 Minutes | 25 | 3.5% |
| 90 or more Minutes | 8 | 1.1% |
Commute Time by Sex in Ocean Gate borough
The most common commute times in Ocean Gate borough are 30 to 34 minutes (68 commuters, 20.1%) for males and 20 to 24 minutes (163 commuters, 42.4%) for females.
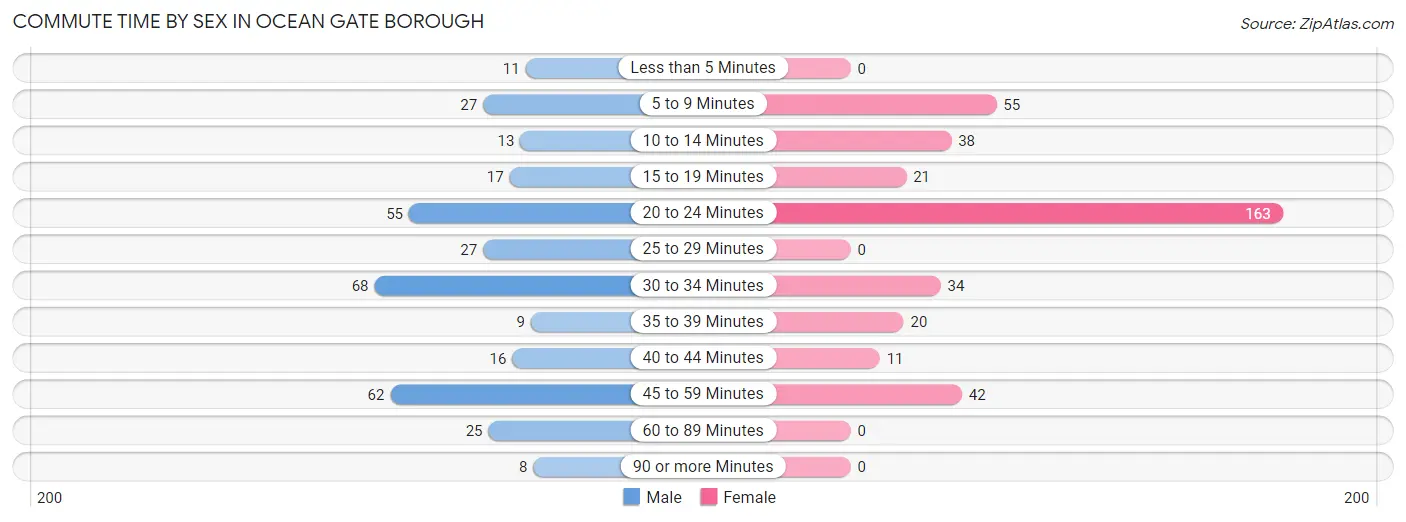
| Commute Time | Male | Female |
| Less than 5 Minutes | 11 (3.3%) | 0 (0.0%) |
| 5 to 9 Minutes | 27 (8.0%) | 55 (14.3%) |
| 10 to 14 Minutes | 13 (3.8%) | 38 (9.9%) |
| 15 to 19 Minutes | 17 (5.0%) | 21 (5.5%) |
| 20 to 24 Minutes | 55 (16.3%) | 163 (42.4%) |
| 25 to 29 Minutes | 27 (8.0%) | 0 (0.0%) |
| 30 to 34 Minutes | 68 (20.1%) | 34 (8.8%) |
| 35 to 39 Minutes | 9 (2.7%) | 20 (5.2%) |
| 40 to 44 Minutes | 16 (4.7%) | 11 (2.9%) |
| 45 to 59 Minutes | 62 (18.3%) | 42 (10.9%) |
| 60 to 89 Minutes | 25 (7.4%) | 0 (0.0%) |
| 90 or more Minutes | 8 (2.4%) | 0 (0.0%) |
Time of Departure to Work by Sex in Ocean Gate borough
The most frequent times of departure to work in Ocean Gate borough are 6:00 AM to 6:29 AM (74, 21.9%) for males and 7:30 AM to 7:59 AM (114, 29.7%) for females.
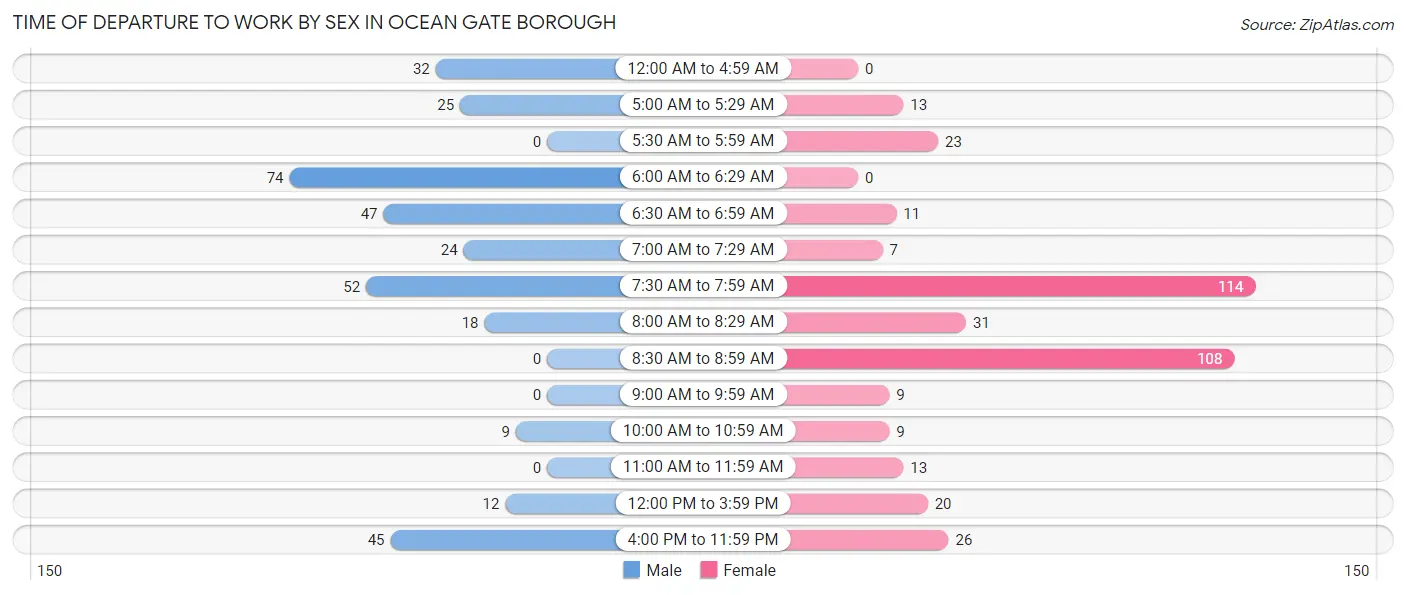
| Time of Departure | Male | Female |
| 12:00 AM to 4:59 AM | 32 (9.5%) | 0 (0.0%) |
| 5:00 AM to 5:29 AM | 25 (7.4%) | 13 (3.4%) |
| 5:30 AM to 5:59 AM | 0 (0.0%) | 23 (6.0%) |
| 6:00 AM to 6:29 AM | 74 (21.9%) | 0 (0.0%) |
| 6:30 AM to 6:59 AM | 47 (13.9%) | 11 (2.9%) |
| 7:00 AM to 7:29 AM | 24 (7.1%) | 7 (1.8%) |
| 7:30 AM to 7:59 AM | 52 (15.4%) | 114 (29.7%) |
| 8:00 AM to 8:29 AM | 18 (5.3%) | 31 (8.1%) |
| 8:30 AM to 8:59 AM | 0 (0.0%) | 108 (28.1%) |
| 9:00 AM to 9:59 AM | 0 (0.0%) | 9 (2.3%) |
| 10:00 AM to 10:59 AM | 9 (2.7%) | 9 (2.3%) |
| 11:00 AM to 11:59 AM | 0 (0.0%) | 13 (3.4%) |
| 12:00 PM to 3:59 PM | 12 (3.5%) | 20 (5.2%) |
| 4:00 PM to 11:59 PM | 45 (13.3%) | 26 (6.8%) |
| Total | 338 (100.0%) | 384 (100.0%) |
Housing Occupancy in Ocean Gate borough
Occupancy by Ownership in Ocean Gate borough
Of the total 743 dwellings in Ocean Gate borough, owner-occupied units account for 594 (79.9%), while renter-occupied units make up 149 (20.1%).
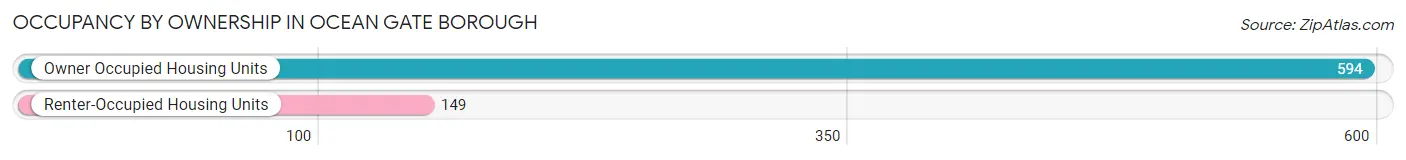
| Occupancy | # Housing Units | % Housing Units |
| Owner Occupied Housing Units | 594 | 79.9% |
| Renter-Occupied Housing Units | 149 | 20.1% |
| Total Occupied Housing Units | 743 | 100.0% |
Occupancy by Household Size in Ocean Gate borough
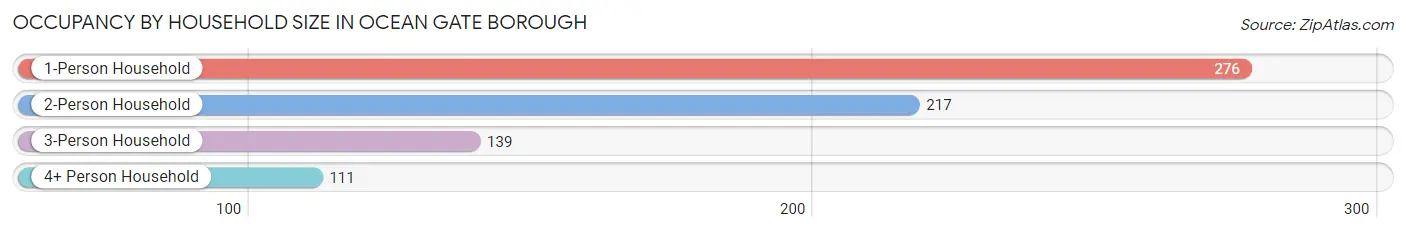
| Household Size | # Housing Units | % Housing Units |
| 1-Person Household | 276 | 37.1% |
| 2-Person Household | 217 | 29.2% |
| 3-Person Household | 139 | 18.7% |
| 4+ Person Household | 111 | 14.9% |
| Total Housing Units | 743 | 100.0% |
Occupancy by Ownership by Household Size in Ocean Gate borough
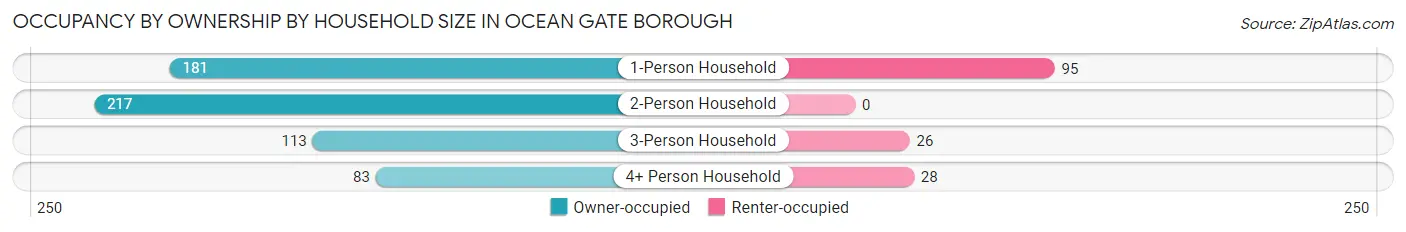
| Household Size | Owner-occupied | Renter-occupied |
| 1-Person Household | 181 (65.6%) | 95 (34.4%) |
| 2-Person Household | 217 (100.0%) | 0 (0.0%) |
| 3-Person Household | 113 (81.3%) | 26 (18.7%) |
| 4+ Person Household | 83 (74.8%) | 28 (25.2%) |
| Total Housing Units | 594 (79.9%) | 149 (20.1%) |
Occupancy by Educational Attainment in Ocean Gate borough
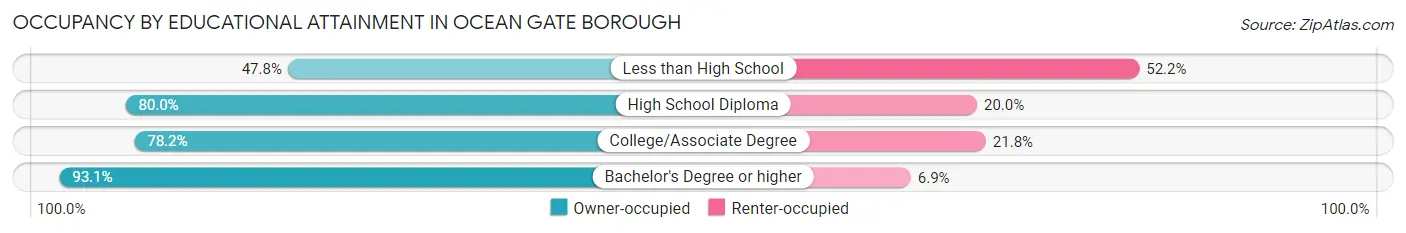
| Household Size | Owner-occupied | Renter-occupied |
| Less than High School | 33 (47.8%) | 36 (52.2%) |
| High School Diploma | 252 (80.0%) | 63 (20.0%) |
| College/Associate Degree | 133 (78.2%) | 37 (21.8%) |
| Bachelor's Degree or higher | 176 (93.1%) | 13 (6.9%) |
Occupancy by Age of Householder in Ocean Gate borough
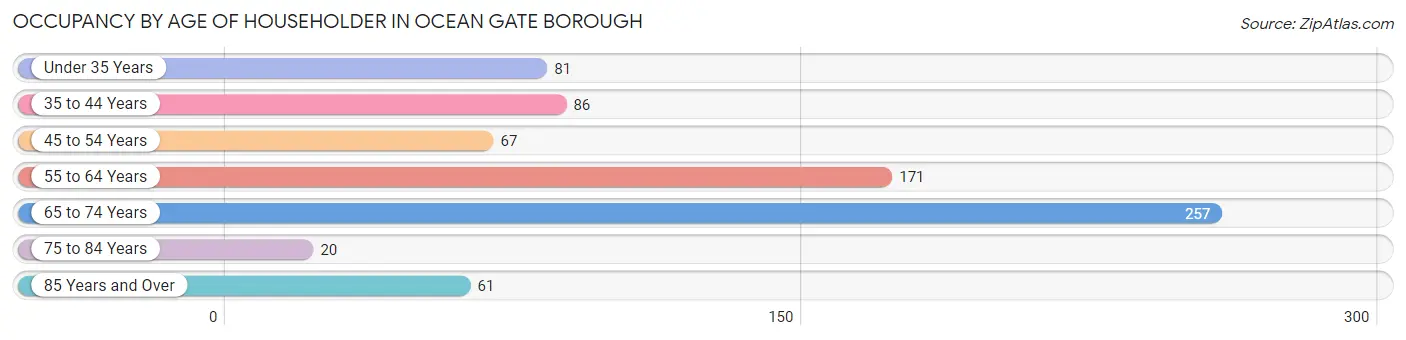
| Age Bracket | # Households | % Households |
| Under 35 Years | 81 | 10.9% |
| 35 to 44 Years | 86 | 11.6% |
| 45 to 54 Years | 67 | 9.0% |
| 55 to 64 Years | 171 | 23.0% |
| 65 to 74 Years | 257 | 34.6% |
| 75 to 84 Years | 20 | 2.7% |
| 85 Years and Over | 61 | 8.2% |
| Total | 743 | 100.0% |
Housing Finances in Ocean Gate borough
Median Income by Occupancy in Ocean Gate borough
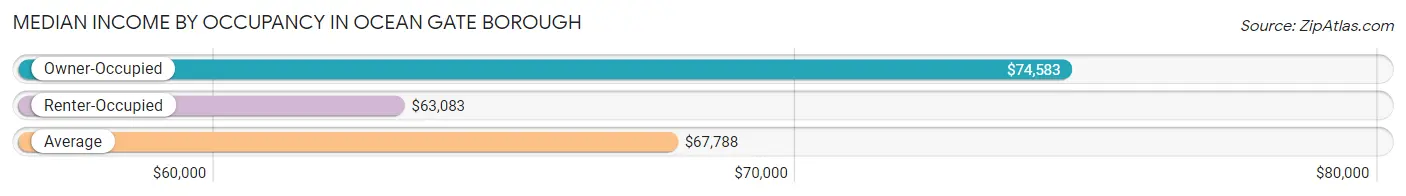
| Occupancy Type | # Households | Median Income |
| Owner-Occupied | 594 (79.9%) | $74,583 |
| Renter-Occupied | 149 (20.1%) | $63,083 |
| Average | 743 (100.0%) | $67,788 |
Occupancy by Householder Income Bracket in Ocean Gate borough
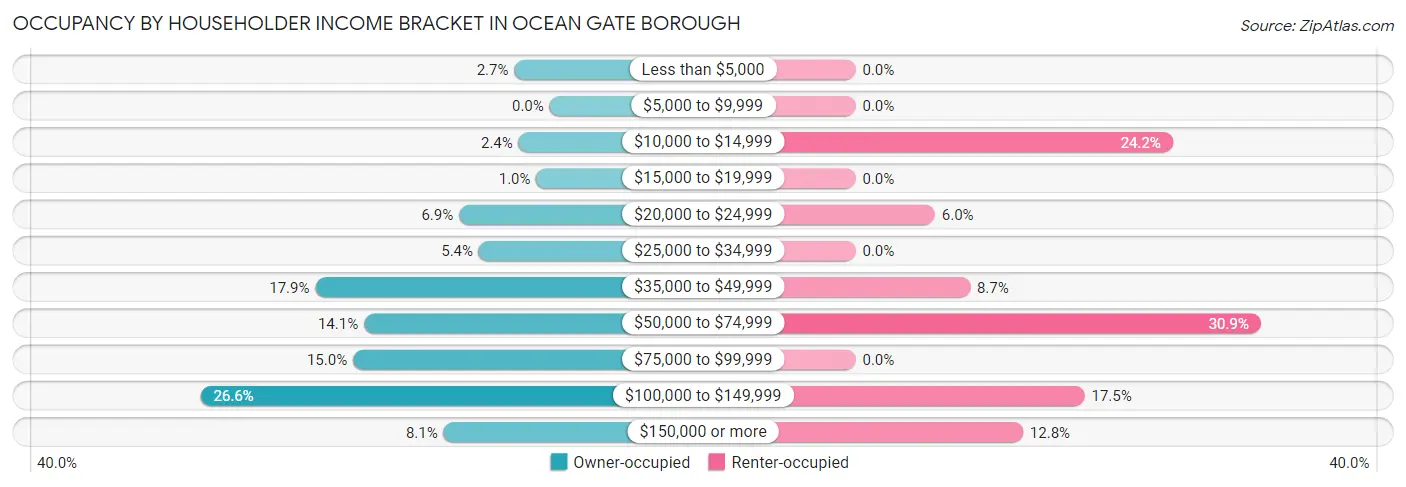
| Income Bracket | Owner-occupied | Renter-occupied |
| Less than $5,000 | 16 (2.7%) | 0 (0.0%) |
| $5,000 to $9,999 | 0 (0.0%) | 0 (0.0%) |
| $10,000 to $14,999 | 14 (2.4%) | 36 (24.2%) |
| $15,000 to $19,999 | 6 (1.0%) | 0 (0.0%) |
| $20,000 to $24,999 | 41 (6.9%) | 9 (6.0%) |
| $25,000 to $34,999 | 32 (5.4%) | 0 (0.0%) |
| $35,000 to $49,999 | 106 (17.8%) | 13 (8.7%) |
| $50,000 to $74,999 | 84 (14.1%) | 46 (30.9%) |
| $75,000 to $99,999 | 89 (15.0%) | 0 (0.0%) |
| $100,000 to $149,999 | 158 (26.6%) | 26 (17.4%) |
| $150,000 or more | 48 (8.1%) | 19 (12.8%) |
| Total | 594 (100.0%) | 149 (100.0%) |
Monthly Housing Cost Tiers in Ocean Gate borough
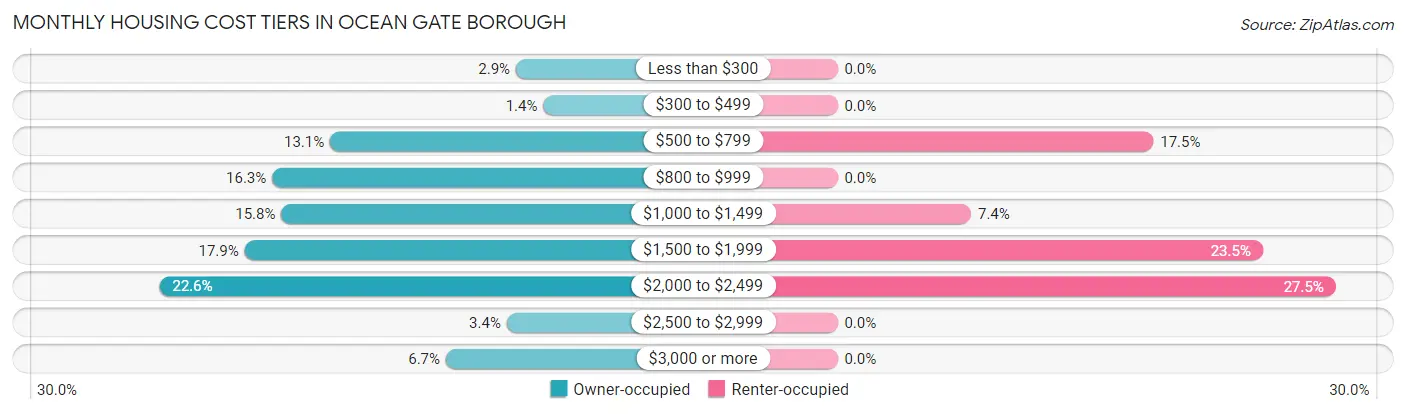
| Monthly Cost | Owner-occupied | Renter-occupied |
| Less than $300 | 17 (2.9%) | 0 (0.0%) |
| $300 to $499 | 8 (1.3%) | 0 (0.0%) |
| $500 to $799 | 78 (13.1%) | 26 (17.4%) |
| $800 to $999 | 97 (16.3%) | 0 (0.0%) |
| $1,000 to $1,499 | 94 (15.8%) | 11 (7.4%) |
| $1,500 to $1,999 | 106 (17.8%) | 35 (23.5%) |
| $2,000 to $2,499 | 134 (22.6%) | 41 (27.5%) |
| $2,500 to $2,999 | 20 (3.4%) | 0 (0.0%) |
| $3,000 or more | 40 (6.7%) | 0 (0.0%) |
| Total | 594 (100.0%) | 149 (100.0%) |
Physical Housing Characteristics in Ocean Gate borough
Housing Structures in Ocean Gate borough
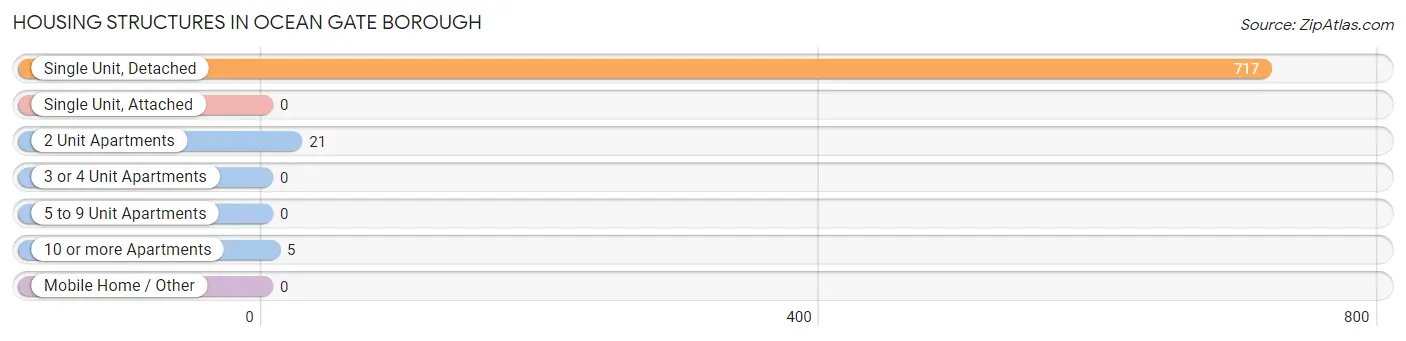
| Structure Type | # Housing Units | % Housing Units |
| Single Unit, Detached | 717 | 96.5% |
| Single Unit, Attached | 0 | 0.0% |
| 2 Unit Apartments | 21 | 2.8% |
| 3 or 4 Unit Apartments | 0 | 0.0% |
| 5 to 9 Unit Apartments | 0 | 0.0% |
| 10 or more Apartments | 5 | 0.7% |
| Mobile Home / Other | 0 | 0.0% |
| Total | 743 | 100.0% |
Housing Structures by Occupancy in Ocean Gate borough
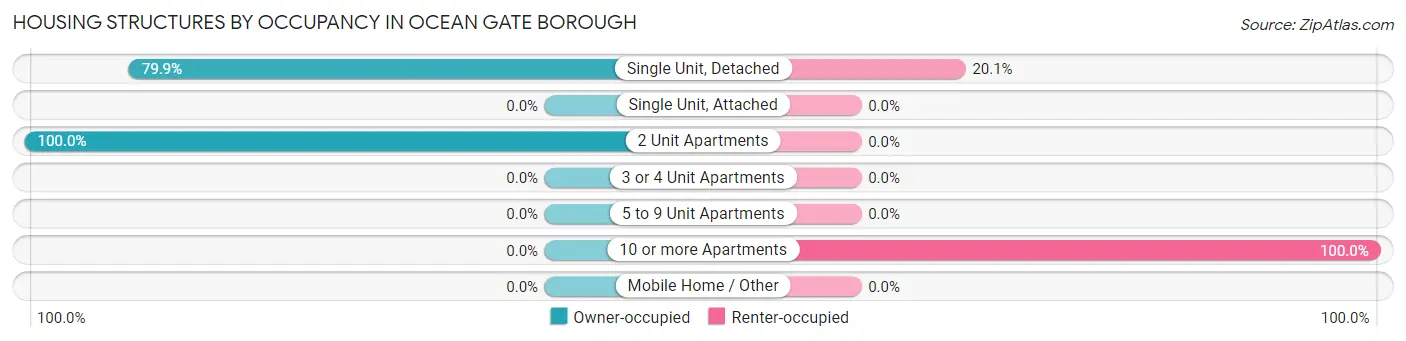
| Structure Type | Owner-occupied | Renter-occupied |
| Single Unit, Detached | 573 (79.9%) | 144 (20.1%) |
| Single Unit, Attached | 0 (0.0%) | 0 (0.0%) |
| 2 Unit Apartments | 21 (100.0%) | 0 (0.0%) |
| 3 or 4 Unit Apartments | 0 (0.0%) | 0 (0.0%) |
| 5 to 9 Unit Apartments | 0 (0.0%) | 0 (0.0%) |
| 10 or more Apartments | 0 (0.0%) | 5 (100.0%) |
| Mobile Home / Other | 0 (0.0%) | 0 (0.0%) |
| Total | 594 (79.9%) | 149 (20.1%) |
Housing Structures by Number of Rooms in Ocean Gate borough
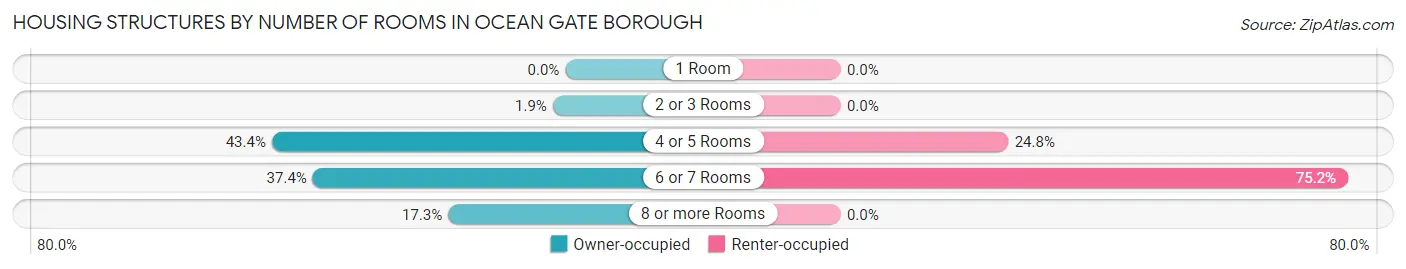
| Number of Rooms | Owner-occupied | Renter-occupied |
| 1 Room | 0 (0.0%) | 0 (0.0%) |
| 2 or 3 Rooms | 11 (1.8%) | 0 (0.0%) |
| 4 or 5 Rooms | 258 (43.4%) | 37 (24.8%) |
| 6 or 7 Rooms | 222 (37.4%) | 112 (75.2%) |
| 8 or more Rooms | 103 (17.3%) | 0 (0.0%) |
| Total | 594 (100.0%) | 149 (100.0%) |
Housing Structure by Heating Type in Ocean Gate borough
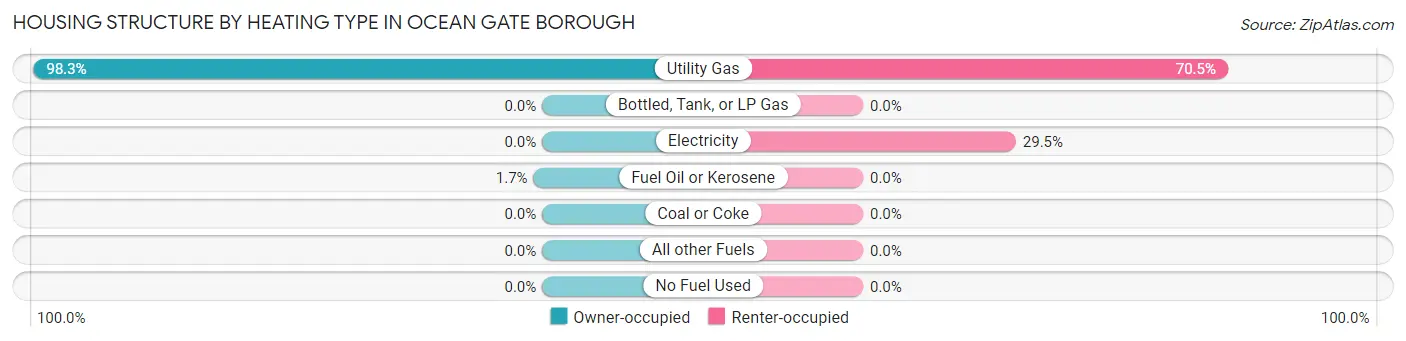
| Heating Type | Owner-occupied | Renter-occupied |
| Utility Gas | 584 (98.3%) | 105 (70.5%) |
| Bottled, Tank, or LP Gas | 0 (0.0%) | 0 (0.0%) |
| Electricity | 0 (0.0%) | 44 (29.5%) |
| Fuel Oil or Kerosene | 10 (1.7%) | 0 (0.0%) |
| Coal or Coke | 0 (0.0%) | 0 (0.0%) |
| All other Fuels | 0 (0.0%) | 0 (0.0%) |
| No Fuel Used | 0 (0.0%) | 0 (0.0%) |
| Total | 594 (100.0%) | 149 (100.0%) |
Household Vehicle Usage in Ocean Gate borough
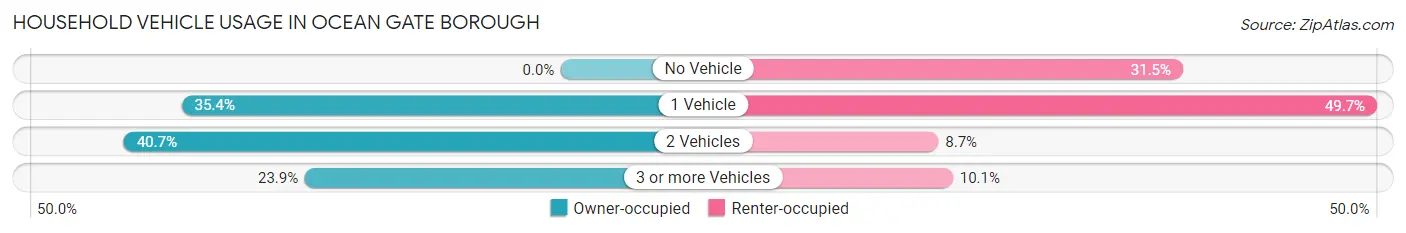
| Vehicles per Household | Owner-occupied | Renter-occupied |
| No Vehicle | 0 (0.0%) | 47 (31.5%) |
| 1 Vehicle | 210 (35.3%) | 74 (49.7%) |
| 2 Vehicles | 242 (40.7%) | 13 (8.7%) |
| 3 or more Vehicles | 142 (23.9%) | 15 (10.1%) |
| Total | 594 (100.0%) | 149 (100.0%) |
Real Estate & Mortgages in Ocean Gate borough
Real Estate and Mortgage Overview in Ocean Gate borough
| Characteristic | Without Mortgage | With Mortgage |
| Housing Units | 212 | 382 |
| Median Property Value | $301,300 | $330,900 |
| Median Household Income | $47,222 | $38 |
| Monthly Housing Costs | $808 | $40 |
| Real Estate Taxes | $5,826 | $0 |
Property Value by Mortgage Status in Ocean Gate borough

| Property Value | Without Mortgage | With Mortgage |
| Less than $50,000 | 17 (8.0%) | 0 (0.0%) |
| $50,000 to $99,999 | 0 (0.0%) | 0 (0.0%) |
| $100,000 to $299,999 | 88 (41.5%) | 123 (32.2%) |
| $300,000 to $499,999 | 80 (37.7%) | 240 (62.8%) |
| $500,000 to $749,999 | 19 (9.0%) | 3 (0.8%) |
| $750,000 to $999,999 | 0 (0.0%) | 16 (4.2%) |
| $1,000,000 or more | 8 (3.8%) | 0 (0.0%) |
| Total | 212 (100.0%) | 382 (100.0%) |
Household Income by Mortgage Status in Ocean Gate borough
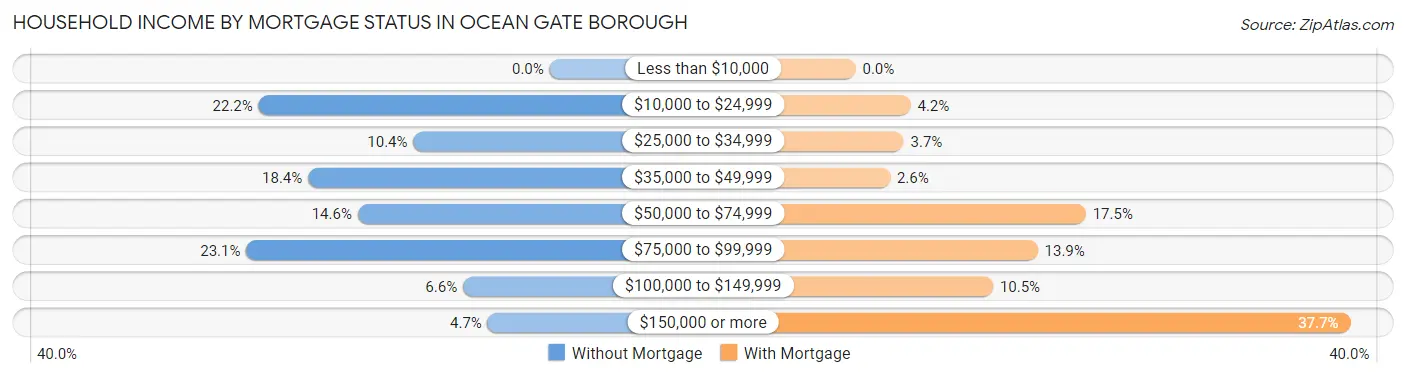
| Household Income | Without Mortgage | With Mortgage |
| Less than $10,000 | 0 (0.0%) | 0 (0.0%) |
| $10,000 to $24,999 | 47 (22.2%) | 16 (4.2%) |
| $25,000 to $34,999 | 22 (10.4%) | 14 (3.7%) |
| $35,000 to $49,999 | 39 (18.4%) | 10 (2.6%) |
| $50,000 to $74,999 | 31 (14.6%) | 67 (17.5%) |
| $75,000 to $99,999 | 49 (23.1%) | 53 (13.9%) |
| $100,000 to $149,999 | 14 (6.6%) | 40 (10.5%) |
| $150,000 or more | 10 (4.7%) | 144 (37.7%) |
| Total | 212 (100.0%) | 382 (100.0%) |
Property Value to Household Income Ratio in Ocean Gate borough
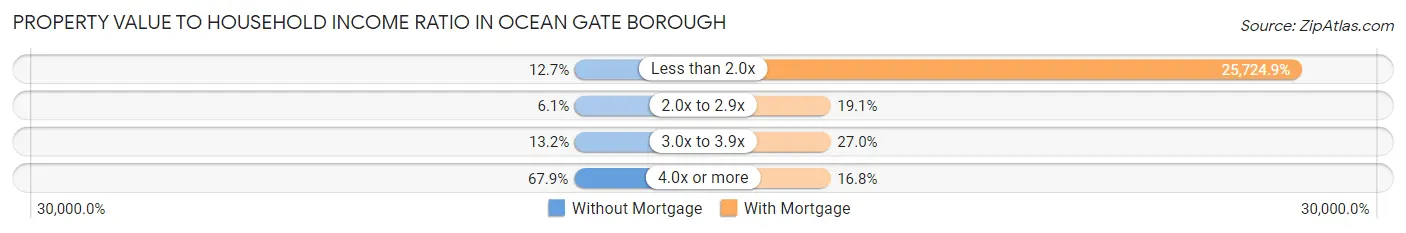
| Value-to-Income Ratio | Without Mortgage | With Mortgage |
| Less than 2.0x | 27 (12.7%) | 98,269 (25,724.9%) |
| 2.0x to 2.9x | 13 (6.1%) | 73 (19.1%) |
| 3.0x to 3.9x | 28 (13.2%) | 103 (27.0%) |
| 4.0x or more | 144 (67.9%) | 64 (16.8%) |
| Total | 212 (100.0%) | 382 (100.0%) |
Real Estate Taxes by Mortgage Status in Ocean Gate borough
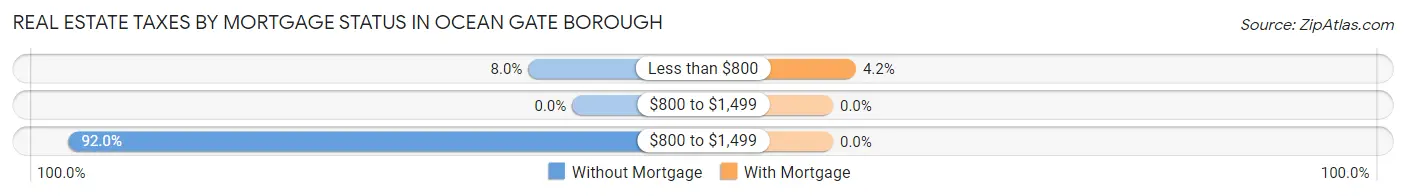
| Property Taxes | Without Mortgage | With Mortgage |
| Less than $800 | 17 (8.0%) | 16 (4.2%) |
| $800 to $1,499 | 0 (0.0%) | 0 (0.0%) |
| $800 to $1,499 | 195 (92.0%) | 0 (0.0%) |
| Total | 212 (100.0%) | 382 (100.0%) |
Health & Disability in Ocean Gate borough
Health Insurance Coverage by Age in Ocean Gate borough
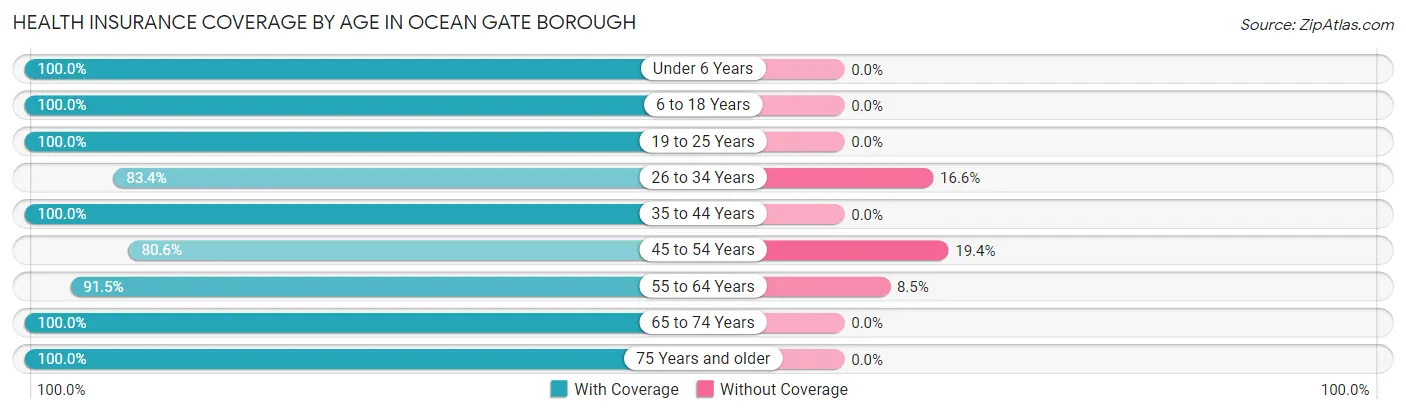
| Age Bracket | With Coverage | Without Coverage |
| Under 6 Years | 53 (100.0%) | 0 (0.0%) |
| 6 to 18 Years | 274 (100.0%) | 0 (0.0%) |
| 19 to 25 Years | 160 (100.0%) | 0 (0.0%) |
| 26 to 34 Years | 131 (83.4%) | 26 (16.6%) |
| 35 to 44 Years | 193 (100.0%) | 0 (0.0%) |
| 45 to 54 Years | 108 (80.6%) | 26 (19.4%) |
| 55 to 64 Years | 290 (91.5%) | 27 (8.5%) |
| 65 to 74 Years | 287 (100.0%) | 0 (0.0%) |
| 75 Years and older | 107 (100.0%) | 0 (0.0%) |
| Total | 1,603 (95.3%) | 79 (4.7%) |
Health Insurance Coverage by Citizenship Status in Ocean Gate borough
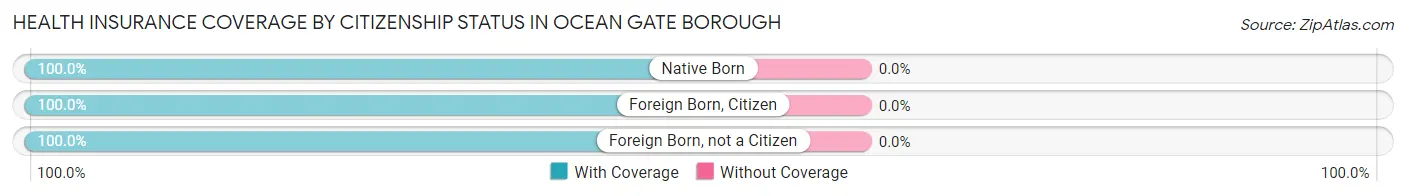
| Citizenship Status | With Coverage | Without Coverage |
| Native Born | 53 (100.0%) | 0 (0.0%) |
| Foreign Born, Citizen | 274 (100.0%) | 0 (0.0%) |
| Foreign Born, not a Citizen | 160 (100.0%) | 0 (0.0%) |
Health Insurance Coverage by Household Income in Ocean Gate borough
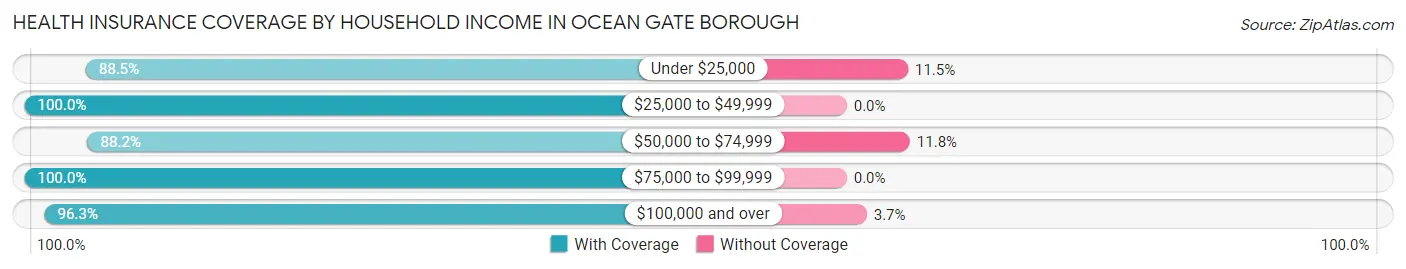
| Household Income | With Coverage | Without Coverage |
| Under $25,000 | 108 (88.5%) | 14 (11.5%) |
| $25,000 to $49,999 | 313 (100.0%) | 0 (0.0%) |
| $50,000 to $74,999 | 291 (88.2%) | 39 (11.8%) |
| $75,000 to $99,999 | 221 (100.0%) | 0 (0.0%) |
| $100,000 and over | 670 (96.3%) | 26 (3.7%) |
Public vs Private Health Insurance Coverage by Age in Ocean Gate borough
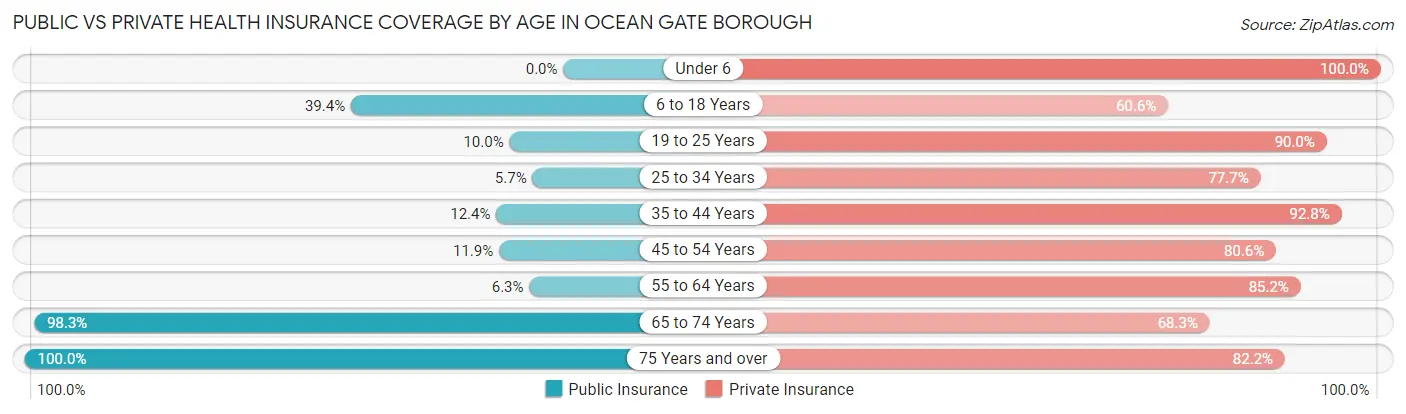
| Age Bracket | Public Insurance | Private Insurance |
| Under 6 | 0 (0.0%) | 53 (100.0%) |
| 6 to 18 Years | 108 (39.4%) | 166 (60.6%) |
| 19 to 25 Years | 16 (10.0%) | 144 (90.0%) |
| 25 to 34 Years | 9 (5.7%) | 122 (77.7%) |
| 35 to 44 Years | 24 (12.4%) | 179 (92.7%) |
| 45 to 54 Years | 16 (11.9%) | 108 (80.6%) |
| 55 to 64 Years | 20 (6.3%) | 270 (85.2%) |
| 65 to 74 Years | 282 (98.3%) | 196 (68.3%) |
| 75 Years and over | 107 (100.0%) | 88 (82.2%) |
| Total | 582 (34.6%) | 1,326 (78.8%) |
Disability Status by Sex by Age in Ocean Gate borough
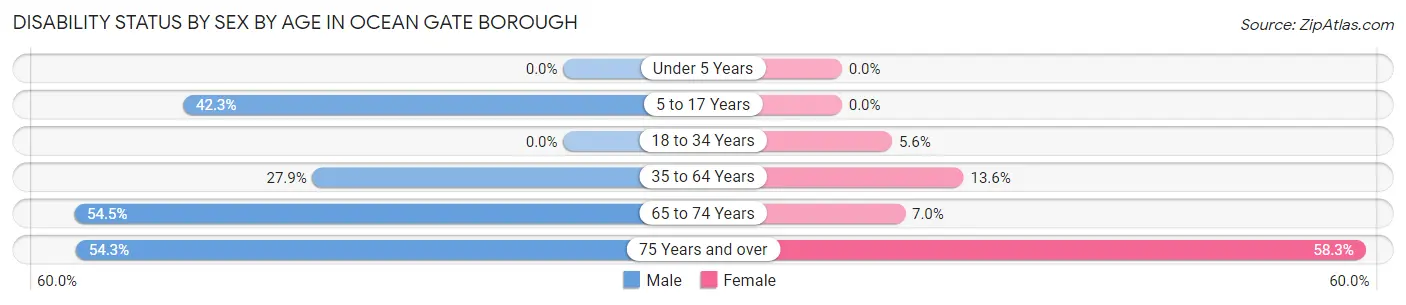
| Age Bracket | Male | Female |
| Under 5 Years | 0 (0.0%) | 0 (0.0%) |
| 5 to 17 Years | 58 (42.3%) | 0 (0.0%) |
| 18 to 34 Years | 0 (0.0%) | 9 (5.6%) |
| 35 to 64 Years | 81 (27.9%) | 48 (13.6%) |
| 65 to 74 Years | 79 (54.5%) | 10 (7.0%) |
| 75 Years and over | 19 (54.3%) | 42 (58.3%) |
Disability Class by Sex by Age in Ocean Gate borough
Disability Class: Hearing Difficulty
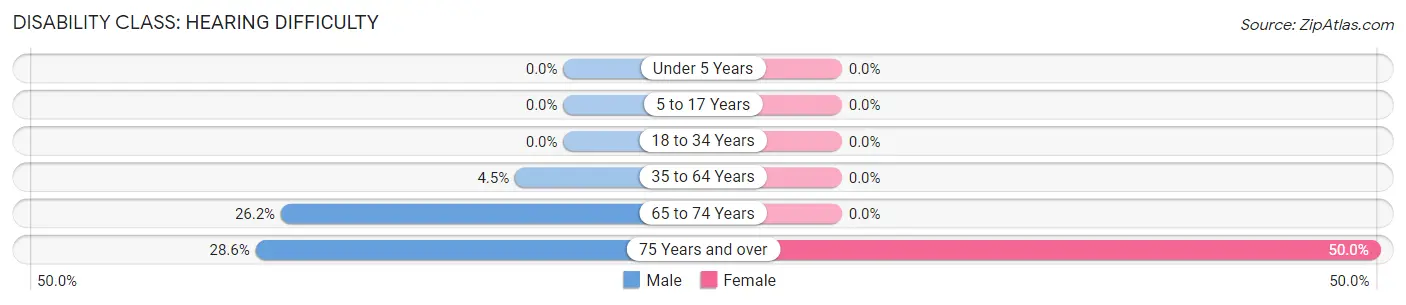
| Age Bracket | Male | Female |
| Under 5 Years | 0 (0.0%) | 0 (0.0%) |
| 5 to 17 Years | 0 (0.0%) | 0 (0.0%) |
| 18 to 34 Years | 0 (0.0%) | 0 (0.0%) |
| 35 to 64 Years | 13 (4.5%) | 0 (0.0%) |
| 65 to 74 Years | 38 (26.2%) | 0 (0.0%) |
| 75 Years and over | 10 (28.6%) | 36 (50.0%) |
Disability Class: Vision Difficulty
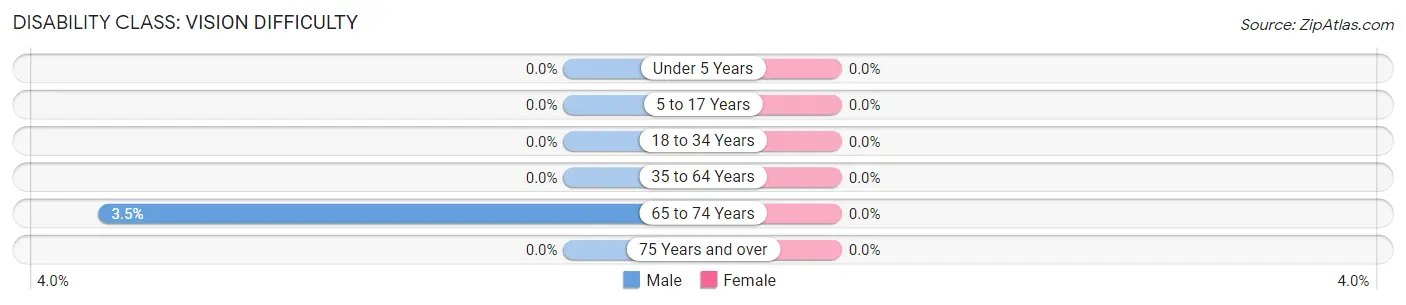
| Age Bracket | Male | Female |
| Under 5 Years | 0 (0.0%) | 0 (0.0%) |
| 5 to 17 Years | 0 (0.0%) | 0 (0.0%) |
| 18 to 34 Years | 0 (0.0%) | 0 (0.0%) |
| 35 to 64 Years | 0 (0.0%) | 0 (0.0%) |
| 65 to 74 Years | 5 (3.5%) | 0 (0.0%) |
| 75 Years and over | 0 (0.0%) | 0 (0.0%) |
Disability Class: Cognitive Difficulty
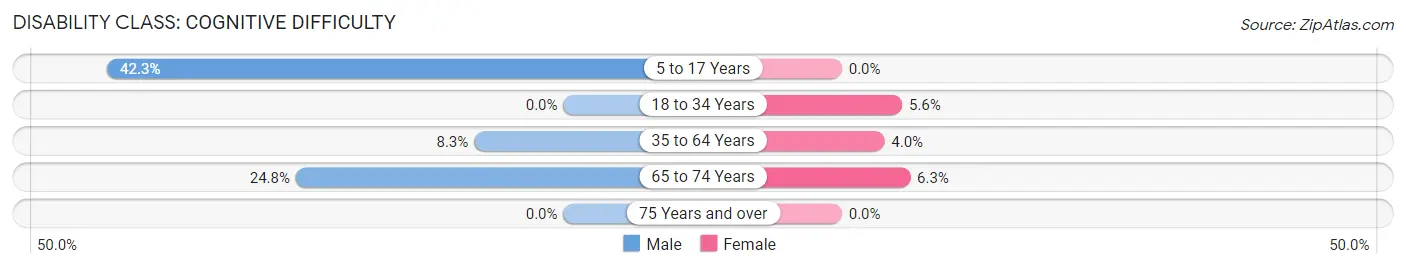
| Age Bracket | Male | Female |
| 5 to 17 Years | 58 (42.3%) | 0 (0.0%) |
| 18 to 34 Years | 0 (0.0%) | 9 (5.6%) |
| 35 to 64 Years | 24 (8.3%) | 14 (4.0%) |
| 65 to 74 Years | 36 (24.8%) | 9 (6.3%) |
| 75 Years and over | 0 (0.0%) | 0 (0.0%) |
Disability Class: Ambulatory Difficulty
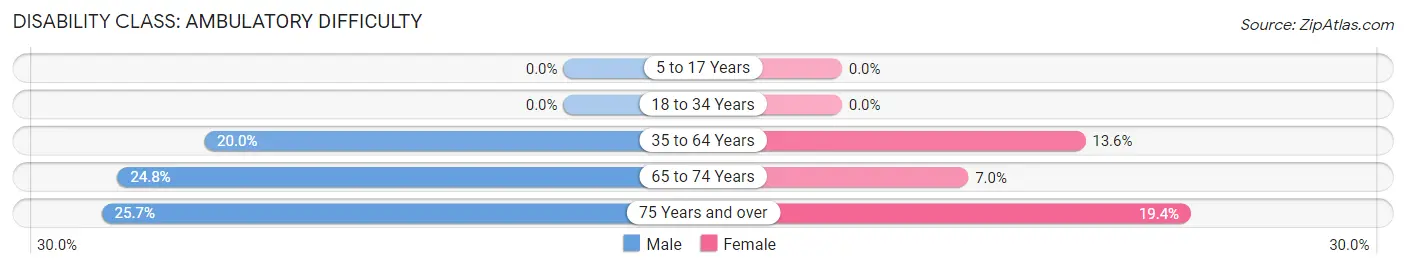
| Age Bracket | Male | Female |
| 5 to 17 Years | 0 (0.0%) | 0 (0.0%) |
| 18 to 34 Years | 0 (0.0%) | 0 (0.0%) |
| 35 to 64 Years | 58 (20.0%) | 48 (13.6%) |
| 65 to 74 Years | 36 (24.8%) | 10 (7.0%) |
| 75 Years and over | 9 (25.7%) | 14 (19.4%) |
Disability Class: Self-Care Difficulty
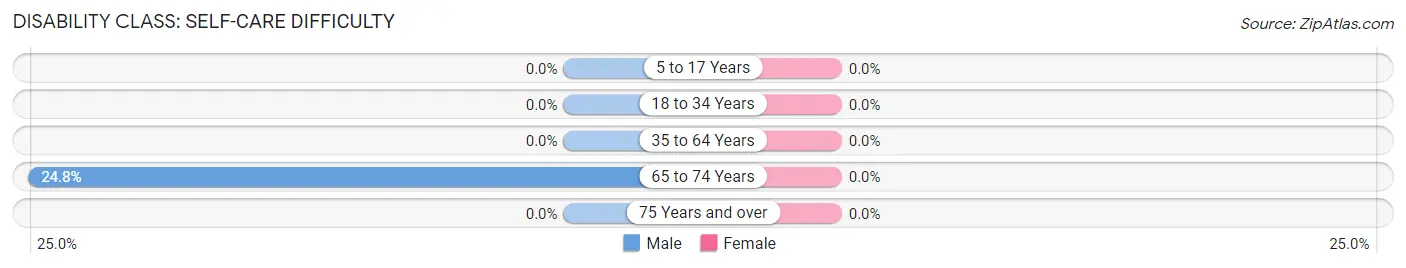
| Age Bracket | Male | Female |
| 5 to 17 Years | 0 (0.0%) | 0 (0.0%) |
| 18 to 34 Years | 0 (0.0%) | 0 (0.0%) |
| 35 to 64 Years | 0 (0.0%) | 0 (0.0%) |
| 65 to 74 Years | 36 (24.8%) | 0 (0.0%) |
| 75 Years and over | 0 (0.0%) | 0 (0.0%) |
Technology Access in Ocean Gate borough
Computing Device Access in Ocean Gate borough
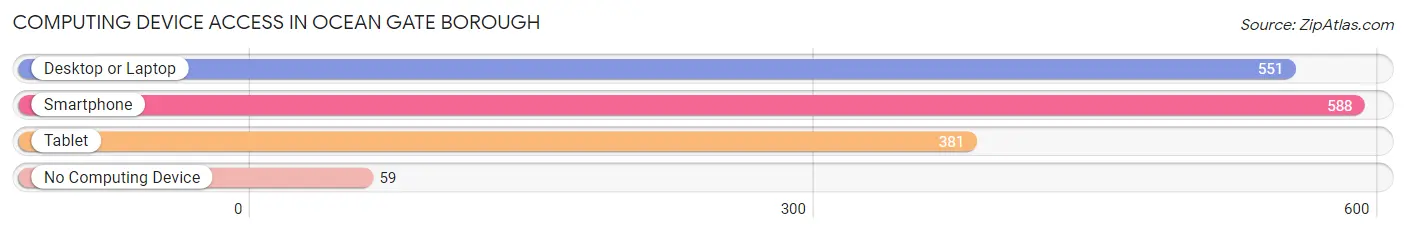
| Device Type | # Households | % Households |
| Desktop or Laptop | 551 | 74.2% |
| Smartphone | 588 | 79.1% |
| Tablet | 381 | 51.3% |
| No Computing Device | 59 | 7.9% |
| Total | 743 | 100.0% |
Internet Access in Ocean Gate borough
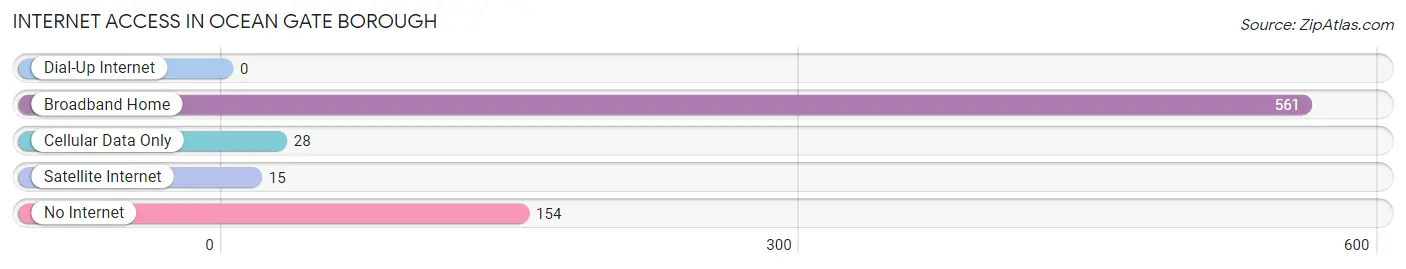
| Internet Type | # Households | % Households |
| Dial-Up Internet | 0 | 0.0% |
| Broadband Home | 561 | 75.5% |
| Cellular Data Only | 28 | 3.8% |
| Satellite Internet | 15 | 2.0% |
| No Internet | 154 | 20.7% |
| Total | 743 | 100.0% |
Ocean Gate borough Summary
Gate Borough is a small borough located in Ocean County, New Jersey. It is situated on the Barnegat Bay, and is part of the Jersey Shore region. The borough was incorporated in 1920, and is home to approximately 1,800 people.
Geography
Gate Borough is located in Ocean County, New Jersey, and is situated on the Barnegat Bay. It is bordered by Berkeley Township to the north, Lavallette to the south, and Seaside Heights to the east. The borough is approximately 1.5 square miles in size, and is home to several small neighborhoods, including Ocean Gate, Ocean Beach, and Ocean Crest.
The borough is located in a coastal region, and is subject to the effects of coastal storms. The borough is also located in a region that is prone to flooding, and has experienced several major floods in recent years.
Economy
Gate Borough is a small, residential community, and the majority of its residents are employed in the service sector. The borough is home to several small businesses, including restaurants, retail stores, and professional services. The borough also has a small fishing industry, and is home to several marinas.
Demographics
As of the 2010 census, Gate Borough had a population of 1,817 people. The racial makeup of the borough was 94.3% White, 1.7% African American, 0.3% Native American, 0.9% Asian, 0.1% Pacific Islander, 1.2% from other races, and 1.6% from two or more races. Hispanic or Latino of any race were 4.2% of the population.
The median household income in Gate Borough was $50,972, and the median family income was $60,972. The per capita income for the borough was $25,972. About 8.3% of families and 10.2% of the population were below the poverty line, including 14.2% of those under age 18 and 5.2% of those age 65 or over.
History
Gate Borough was originally inhabited by the Lenape Native Americans. The area was first settled by Europeans in the late 17th century, and was part of Shrewsbury Township until it was incorporated as a borough in 1920. The borough was named after the nearby Ocean Gate, which was a popular destination for beachgoers in the early 20th century.
The borough experienced a period of growth in the 1950s and 1960s, as many people moved to the area to take advantage of the area’s proximity to the beach. The borough has since become a popular destination for vacationers, and is home to several small businesses.
Common Questions
What is Per Capita Income in Ocean Gate borough?
Per Capita income in Ocean Gate borough is $42,958.
What is the Median Family Income in Ocean Gate borough?
Median Family Income in Ocean Gate borough is $82,500.
What is the Median Household income in Ocean Gate borough?
Median Household Income in Ocean Gate borough is $67,788.
What is Income or Wage Gap in Ocean Gate borough?
Income or Wage Gap in Ocean Gate borough is 20.7%.
Women in Ocean Gate borough earn 79.3 cents for every dollar earned by a man.
What is Inequality or Gini Index in Ocean Gate borough?
Inequality or Gini Index in Ocean Gate borough is 0.46.
What is the Total Population of Ocean Gate borough?
Total Population of Ocean Gate borough is 1,682.
What is the Total Male Population of Ocean Gate borough?
Total Male Population of Ocean Gate borough is 816.
What is the Total Female Population of Ocean Gate borough?
Total Female Population of Ocean Gate borough is 866.
What is the Ratio of Males per 100 Females in Ocean Gate borough?
There are 94.23 Males per 100 Females in Ocean Gate borough.
What is the Ratio of Females per 100 Males in Ocean Gate borough?
There are 106.13 Females per 100 Males in Ocean Gate borough.
What is the Median Population Age in Ocean Gate borough?
Median Population Age in Ocean Gate borough is 46.1 Years.
What is the Average Family Size in Ocean Gate borough
Average Family Size in Ocean Gate borough is 3.0 People.
What is the Average Household Size in Ocean Gate borough
Average Household Size in Ocean Gate borough is 2.3 People.
How Large is the Labor Force in Ocean Gate borough?
There are 828 People in the Labor Forcein in Ocean Gate borough.
What is the Percentage of People in the Labor Force in Ocean Gate borough?
60.0% of People are in the Labor Force in Ocean Gate borough.
What is the Unemployment Rate in Ocean Gate borough?
Unemployment Rate in Ocean Gate borough is 3.4%.