Margate City, NJ Map & Demographics
Margate City Map
Margate City Overview
$79,711
PER CAPITA INCOME
$140,729
AVG FAMILY INCOME
$112,661
AVG HOUSEHOLD INCOME
23.2%
WAGE / INCOME GAP [ % ]
76.8¢/ $1
WAGE / INCOME GAP [ $ ]
0.52
INEQUALITY / GINI INDEX
5,331
TOTAL POPULATION
2,441
MALE POPULATION
2,890
FEMALE POPULATION
84.46
MALES / 100 FEMALES
118.39
FEMALES / 100 MALES
57.9
MEDIAN AGE
2.6
AVG FAMILY SIZE
2.1
AVG HOUSEHOLD SIZE
2,590
LABOR FORCE [ PEOPLE ]
55.8%
PERCENT IN LABOR FORCE
4.0%
UNEMPLOYMENT RATE
Margate City Zip Codes
Margate City Area Codes
Income in Margate City
Income Overview in Margate City
Per Capita Income in Margate City is $79,711, while median incomes of families and households are $140,729 and $112,661 respectively.
| Characteristic | Number | Measure |
| Per Capita Income | 5,331 | $79,711 |
| Median Family Income | 1,667 | $140,729 |
| Mean Family Income | 1,667 | $214,173 |
| Median Household Income | 2,584 | $112,661 |
| Mean Household Income | 2,584 | $165,725 |
| Income Deficit | 1,667 | $0 |
| Wage / Income Gap (%) | 5,331 | 23.22% |
| Wage / Income Gap ($) | 5,331 | 76.78¢ per $1 |
| Gini / Inequality Index | 5,331 | 0.52 |
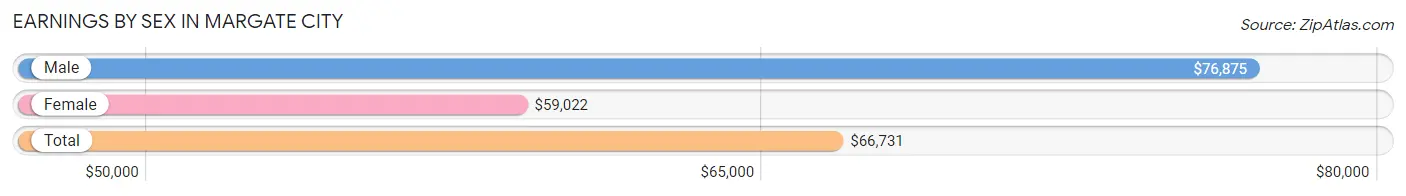
Earnings by Sex in Margate City
Average Earnings in Margate City are $66,731, $76,875 for men and $59,022 for women, a difference of 23.2%.
| Sex | Number | Average Earnings |
| Male | 1,262 (44.6%) | $76,875 |
| Female | 1,568 (55.4%) | $59,022 |
| Total | 2,830 (100.0%) | $66,731 |
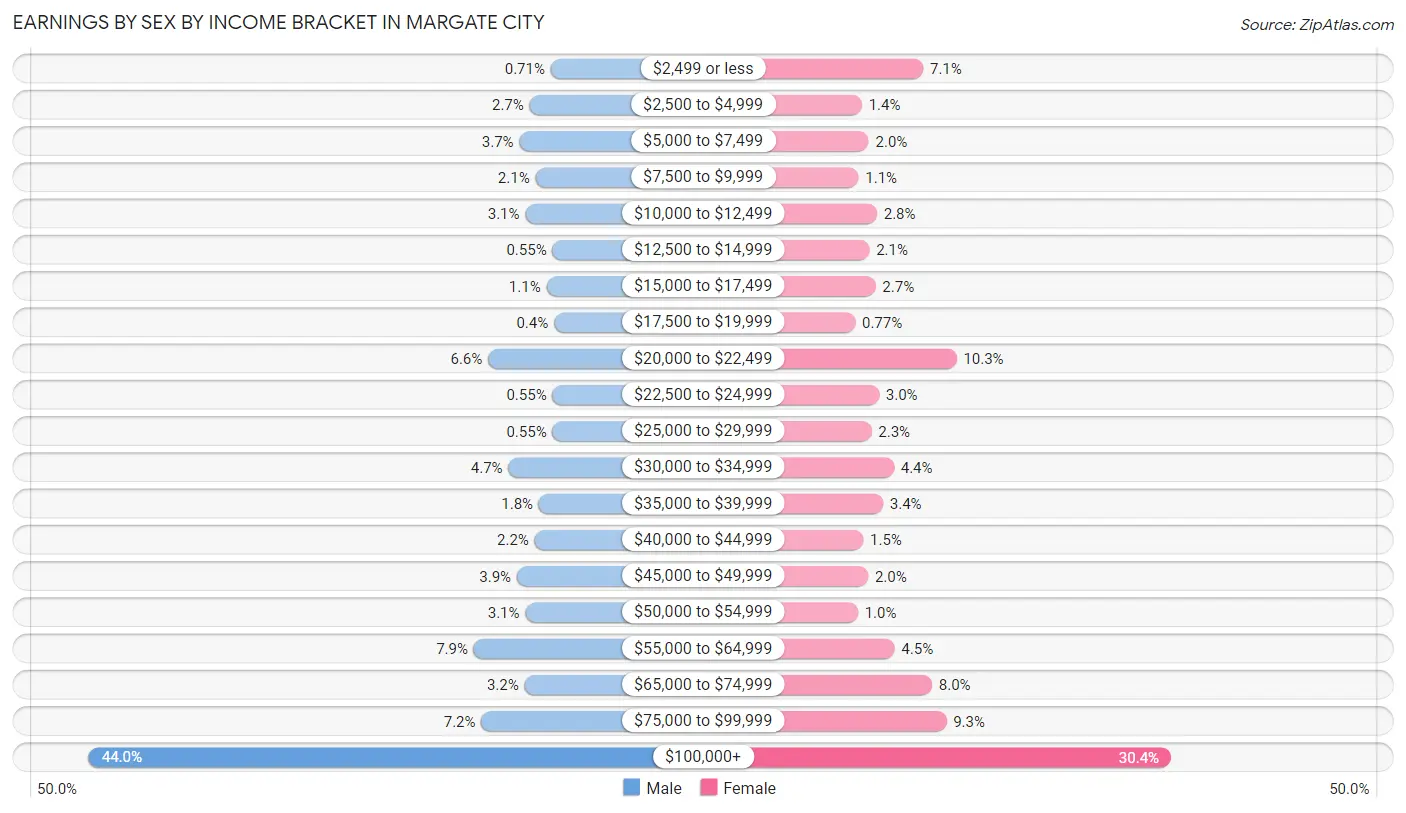
Earnings by Sex by Income Bracket in Margate City
The most common earnings brackets in Margate City are $100,000+ for men (555 | 44.0%) and $100,000+ for women (476 | 30.4%).
| Income | Male | Female |
| $2,499 or less | 9 (0.7%) | 112 (7.1%) |
| $2,500 to $4,999 | 34 (2.7%) | 22 (1.4%) |
| $5,000 to $7,499 | 46 (3.6%) | 32 (2.0%) |
| $7,500 to $9,999 | 27 (2.1%) | 17 (1.1%) |
| $10,000 to $12,499 | 39 (3.1%) | 44 (2.8%) |
| $12,500 to $14,999 | 7 (0.5%) | 33 (2.1%) |
| $15,000 to $17,499 | 14 (1.1%) | 42 (2.7%) |
| $17,500 to $19,999 | 5 (0.4%) | 12 (0.8%) |
| $20,000 to $22,499 | 83 (6.6%) | 161 (10.3%) |
| $22,500 to $24,999 | 7 (0.5%) | 47 (3.0%) |
| $25,000 to $29,999 | 7 (0.5%) | 36 (2.3%) |
| $30,000 to $34,999 | 59 (4.7%) | 69 (4.4%) |
| $35,000 to $39,999 | 23 (1.8%) | 53 (3.4%) |
| $40,000 to $44,999 | 28 (2.2%) | 24 (1.5%) |
| $45,000 to $49,999 | 49 (3.9%) | 31 (2.0%) |
| $50,000 to $54,999 | 39 (3.1%) | 16 (1.0%) |
| $55,000 to $64,999 | 100 (7.9%) | 70 (4.5%) |
| $65,000 to $74,999 | 40 (3.2%) | 125 (8.0%) |
| $75,000 to $99,999 | 91 (7.2%) | 146 (9.3%) |
| $100,000+ | 555 (44.0%) | 476 (30.4%) |
| Total | 1,262 (100.0%) | 1,568 (100.0%) |
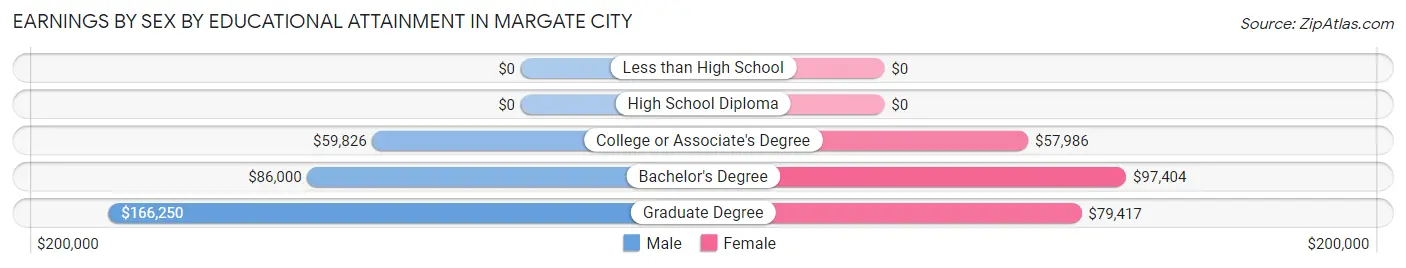
Earnings by Sex by Educational Attainment in Margate City
Average earnings in Margate City are $97,167 for men and $72,237 for women, a difference of 25.7%. Men with an educational attainment of graduate degree enjoy the highest average annual earnings of $166,250, while those with college or associate's degree education earn the least with $59,826. Women with an educational attainment of bachelor's degree earn the most with the average annual earnings of $97,404, while those with college or associate's degree education have the smallest earnings of $57,986.
| Educational Attainment | Male Income | Female Income |
| Less than High School | - | - |
| High School Diploma | - | - |
| College or Associate's Degree | $59,826 | $57,986 |
| Bachelor's Degree | $86,000 | $97,404 |
| Graduate Degree | $166,250 | $79,417 |
| Total | $97,167 | $72,237 |
Family Income in Margate City
Family Income Brackets in Margate City
According to the Margate City family income data, there are 583 families falling into the $200,000+ income range, which is the most common income bracket and makes up 35.0% of all families.
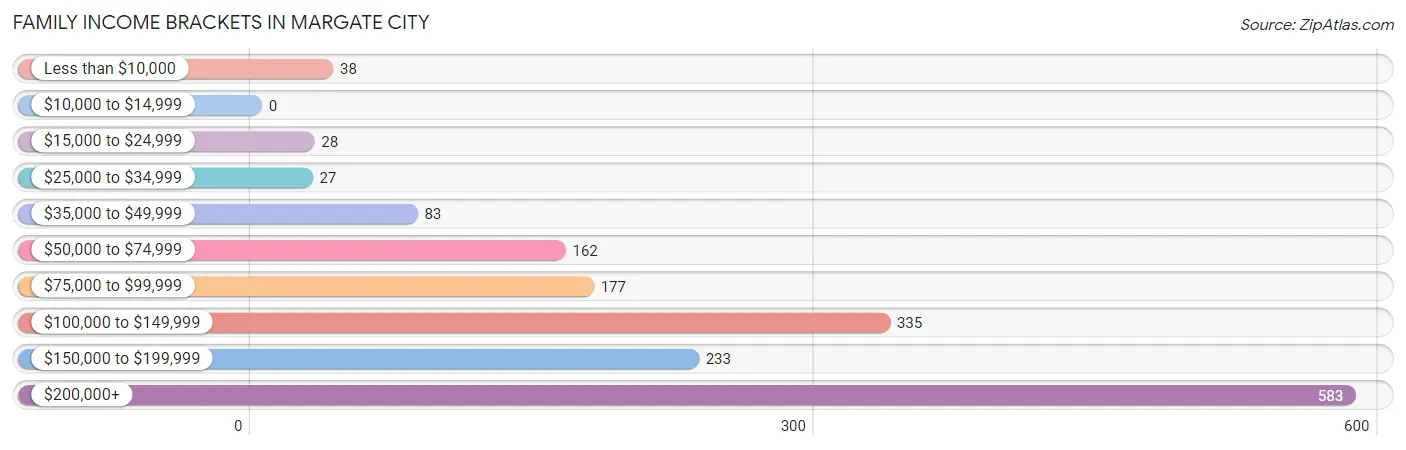
| Income Bracket | # Families | % Families |
| Less than $10,000 | 38 | 2.3% |
| $10,000 to $14,999 | 0 | 0.0% |
| $15,000 to $24,999 | 28 | 1.7% |
| $25,000 to $34,999 | 27 | 1.6% |
| $35,000 to $49,999 | 83 | 5.0% |
| $50,000 to $74,999 | 162 | 9.7% |
| $75,000 to $99,999 | 177 | 10.6% |
| $100,000 to $149,999 | 335 | 20.1% |
| $150,000 to $199,999 | 233 | 14.0% |
| $200,000+ | 583 | 35.0% |
Family Income by Famaliy Size in Margate City
5-person families (109 | 6.5%) account for the highest median family income in Margate City with $233,405 per family, while 2-person families (1,150 | 69.0%) have the highest median income of $64,208 per family member.
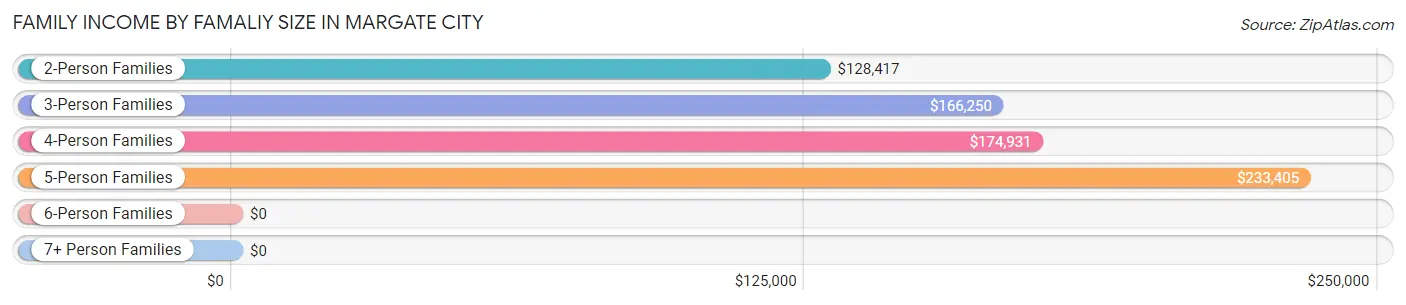
| Income Bracket | # Families | Median Income |
| 2-Person Families | 1,150 (69.0%) | $128,417 |
| 3-Person Families | 234 (14.0%) | $166,250 |
| 4-Person Families | 174 (10.4%) | $174,931 |
| 5-Person Families | 109 (6.5%) | $233,405 |
| 6-Person Families | 0 (0.0%) | $0 |
| 7+ Person Families | 0 (0.0%) | $0 |
| Total | 1,667 (100.0%) | $140,729 |
Family Income by Number of Earners in Margate City
The median family income in Margate City is $140,729, with families comprising 2 earners (676) having the highest median family income of $175,972, while families with no earners (383) have the lowest median family income of $92,538, accounting for 40.6% and 23.0% of families, respectively.
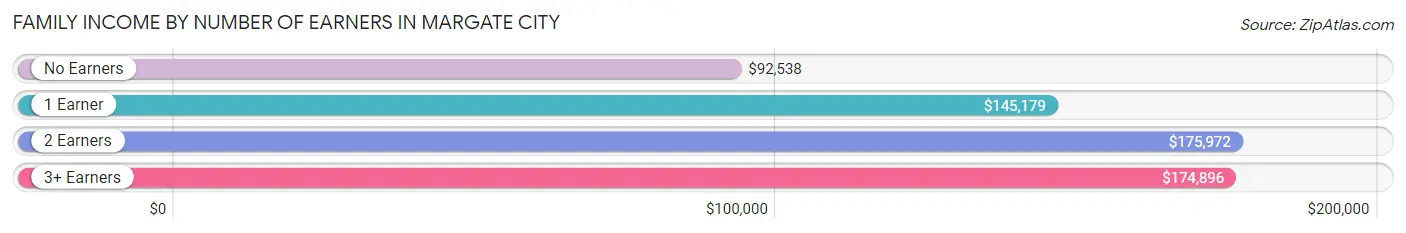
| Number of Earners | # Families | Median Income |
| No Earners | 383 (23.0%) | $92,538 |
| 1 Earner | 473 (28.4%) | $145,179 |
| 2 Earners | 676 (40.6%) | $175,972 |
| 3+ Earners | 135 (8.1%) | $174,896 |
| Total | 1,667 (100.0%) | $140,729 |
Household Income in Margate City
Household Income Brackets in Margate City
With 659 households falling in the category, the $200,000+ income range is the most frequent in Margate City, accounting for 25.5% of all households. In contrast, only 52 households (2.0%) fall into the $10,000 to $14,999 income bracket, making it the least populous group.
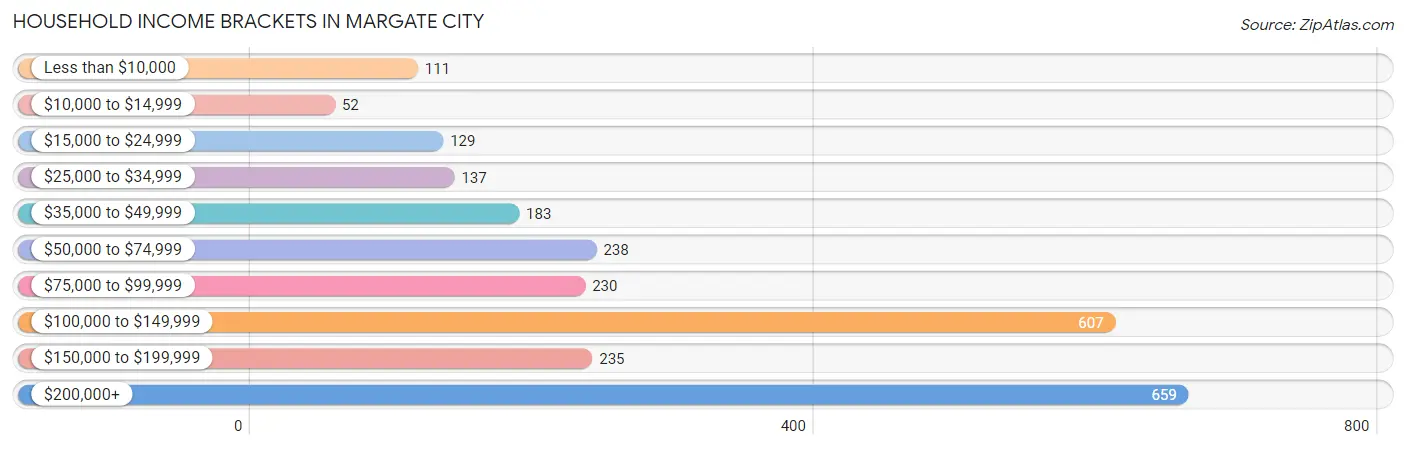
| Income Bracket | # Households | % Households |
| Less than $10,000 | 111 | 4.3% |
| $10,000 to $14,999 | 52 | 2.0% |
| $15,000 to $24,999 | 129 | 5.0% |
| $25,000 to $34,999 | 137 | 5.3% |
| $35,000 to $49,999 | 183 | 7.1% |
| $50,000 to $74,999 | 238 | 9.2% |
| $75,000 to $99,999 | 230 | 8.9% |
| $100,000 to $149,999 | 607 | 23.5% |
| $150,000 to $199,999 | 235 | 9.1% |
| $200,000+ | 659 | 25.5% |
Household Income by Householder Age in Margate City
The median household income in Margate City is $112,661, with the highest median household income of $166,094 found in the 25 to 44 years age bracket for the primary householder. A total of 215 households (8.3%) fall into this category. Meanwhile, the 15 to 24 years age bracket for the primary householder has the lowest median household income of $0, with 29 households (1.1%) in this group.
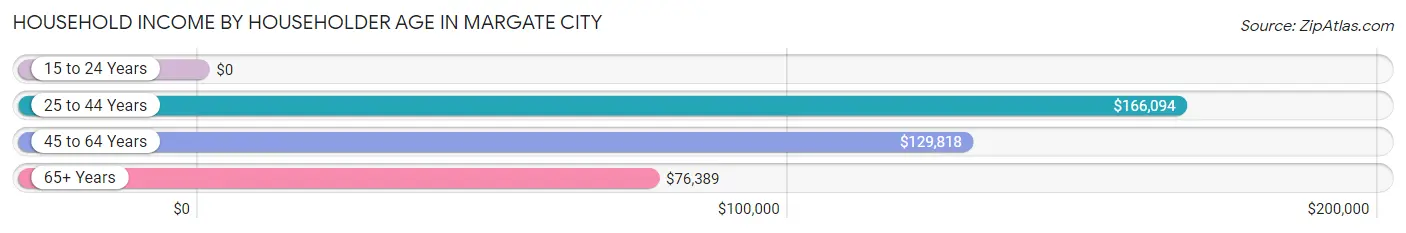
| Income Bracket | # Households | Median Income |
| 15 to 24 Years | 29 (1.1%) | $0 |
| 25 to 44 Years | 215 (8.3%) | $166,094 |
| 45 to 64 Years | 1,104 (42.7%) | $129,818 |
| 65+ Years | 1,236 (47.8%) | $76,389 |
| Total | 2,584 (100.0%) | $112,661 |
Poverty in Margate City
Income Below Poverty by Sex and Age in Margate City
With 5.1% poverty level for males and 5.7% for females among the residents of Margate City, 5 year old males and 25 to 34 year old females are the most vulnerable to poverty, with 17 males (100.0%) and 29 females (42.0%) in their respective age groups living below the poverty level.
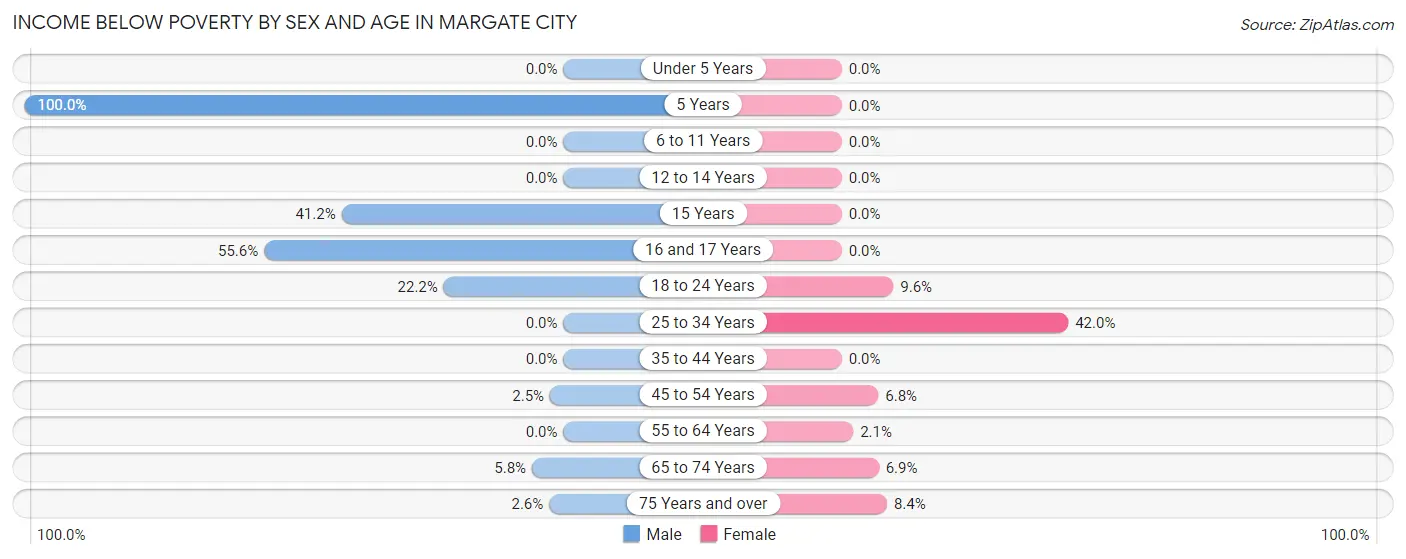
| Age Bracket | Male | Female |
| Under 5 Years | 0 (0.0%) | 0 (0.0%) |
| 5 Years | 17 (100.0%) | 0 (0.0%) |
| 6 to 11 Years | 0 (0.0%) | 0 (0.0%) |
| 12 to 14 Years | 0 (0.0%) | 0 (0.0%) |
| 15 Years | 7 (41.2%) | 0 (0.0%) |
| 16 and 17 Years | 10 (55.6%) | 0 (0.0%) |
| 18 to 24 Years | 42 (22.2%) | 20 (9.6%) |
| 25 to 34 Years | 0 (0.0%) | 29 (42.0%) |
| 35 to 44 Years | 0 (0.0%) | 0 (0.0%) |
| 45 to 54 Years | 9 (2.5%) | 26 (6.8%) |
| 55 to 64 Years | 0 (0.0%) | 14 (2.1%) |
| 65 to 74 Years | 27 (5.8%) | 42 (6.9%) |
| 75 Years and over | 12 (2.6%) | 33 (8.4%) |
| Total | 124 (5.1%) | 164 (5.7%) |
Income Above Poverty by Sex and Age in Margate City
According to the poverty statistics in Margate City, males aged under 5 years and females aged under 5 years are the age groups that are most secure financially, with 100.0% of males and 100.0% of females in these age groups living above the poverty line.
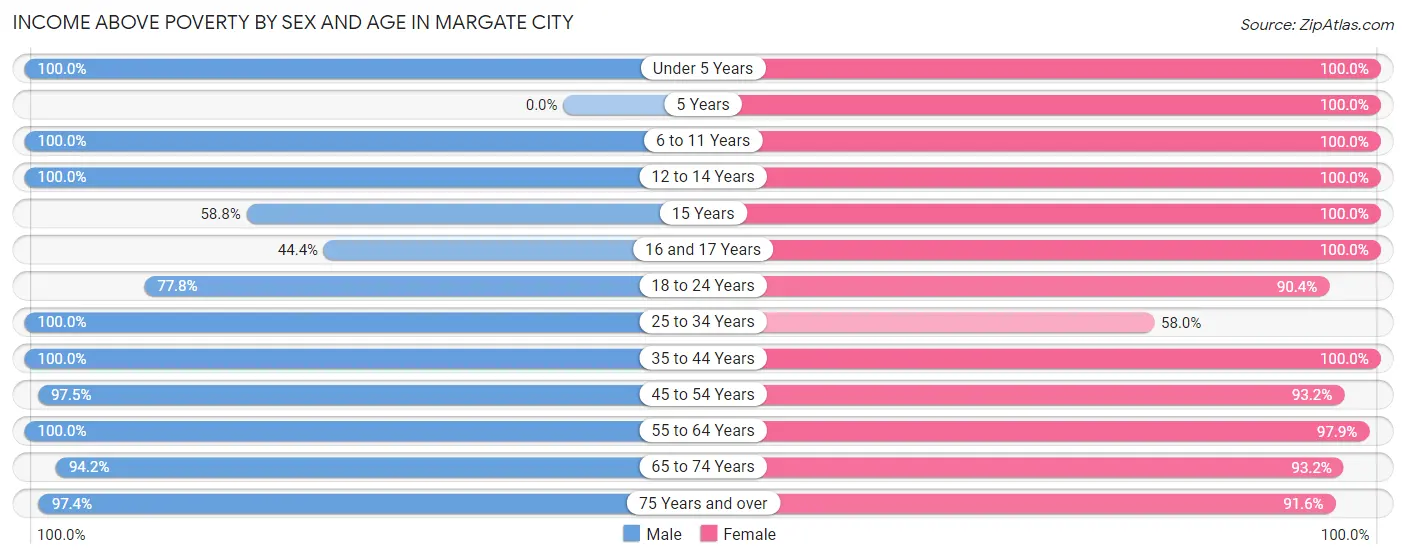
| Age Bracket | Male | Female |
| Under 5 Years | 46 (100.0%) | 27 (100.0%) |
| 5 Years | 0 (0.0%) | 22 (100.0%) |
| 6 to 11 Years | 176 (100.0%) | 123 (100.0%) |
| 12 to 14 Years | 112 (100.0%) | 88 (100.0%) |
| 15 Years | 10 (58.8%) | 61 (100.0%) |
| 16 and 17 Years | 8 (44.4%) | 76 (100.0%) |
| 18 to 24 Years | 147 (77.8%) | 189 (90.4%) |
| 25 to 34 Years | 90 (100.0%) | 40 (58.0%) |
| 35 to 44 Years | 98 (100.0%) | 165 (100.0%) |
| 45 to 54 Years | 353 (97.5%) | 357 (93.2%) |
| 55 to 64 Years | 399 (100.0%) | 646 (97.9%) |
| 65 to 74 Years | 436 (94.2%) | 571 (93.1%) |
| 75 Years and over | 442 (97.4%) | 361 (91.6%) |
| Total | 2,317 (94.9%) | 2,726 (94.3%) |
Income Below Poverty Among Married-Couple Families in Margate City
The poverty statistics for married-couple families in Margate City show that 1.7% or 22 of the total 1,325 families live below the poverty line. Families with no children have the highest poverty rate of 2.3%, comprising of 22 families. On the other hand, families with 1 or 2 children have the lowest poverty rate of 0.0%, which includes 0 families.
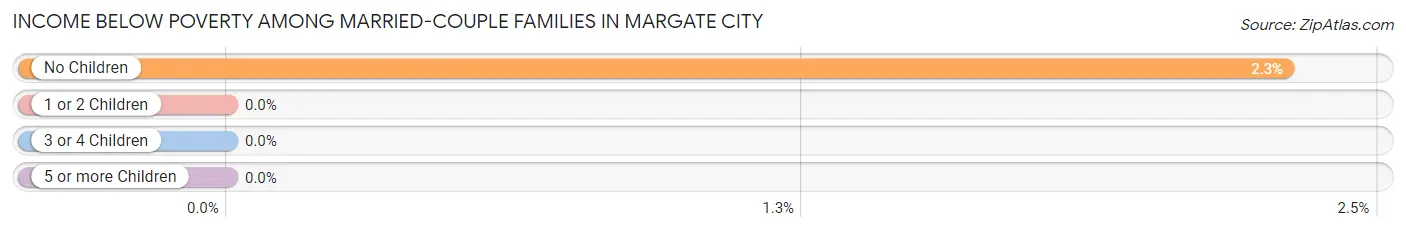
| Children | Above Poverty | Below Poverty |
| No Children | 933 (97.7%) | 22 (2.3%) |
| 1 or 2 Children | 266 (100.0%) | 0 (0.0%) |
| 3 or 4 Children | 104 (100.0%) | 0 (0.0%) |
| 5 or more Children | 0 (0.0%) | 0 (0.0%) |
| Total | 1,303 (98.3%) | 22 (1.7%) |
Income Below Poverty Among Single-Parent Households in Margate City
According to the poverty data in Margate City, 10.5% or 9 single-father households and 11.3% or 29 single-mother households are living below the poverty line. Among single-father households, those with 1 or 2 children have the highest poverty rate, with 9 households (56.2%) experiencing poverty. Likewise, among single-mother households, those with 1 or 2 children have the highest poverty rate, with 29 households (50.9%) falling below the poverty line.
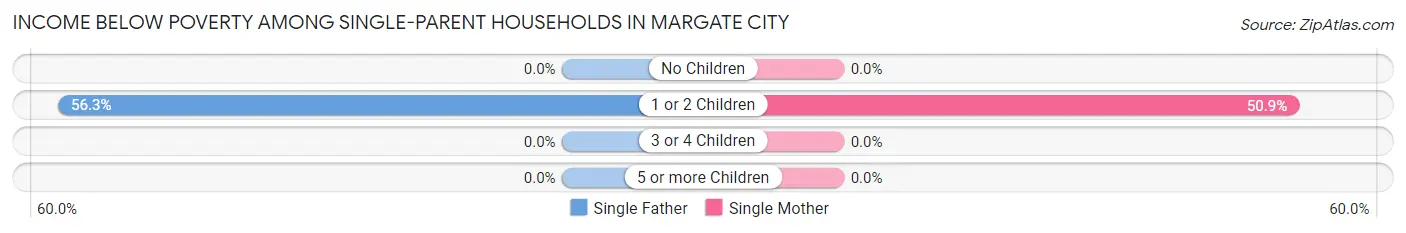
| Children | Single Father | Single Mother |
| No Children | 0 (0.0%) | 0 (0.0%) |
| 1 or 2 Children | 9 (56.2%) | 29 (50.9%) |
| 3 or 4 Children | 0 (0.0%) | 0 (0.0%) |
| 5 or more Children | 0 (0.0%) | 0 (0.0%) |
| Total | 9 (10.5%) | 29 (11.3%) |
Income Below Poverty Among Married-Couple vs Single-Parent Households in Margate City
The poverty data for Margate City shows that 22 of the married-couple family households (1.7%) and 38 of the single-parent households (11.1%) are living below the poverty level. Within the married-couple family households, those with no children have the highest poverty rate, with 22 households (2.3%) falling below the poverty line. Among the single-parent households, those with 1 or 2 children have the highest poverty rate, with 38 household (52.0%) living below poverty.
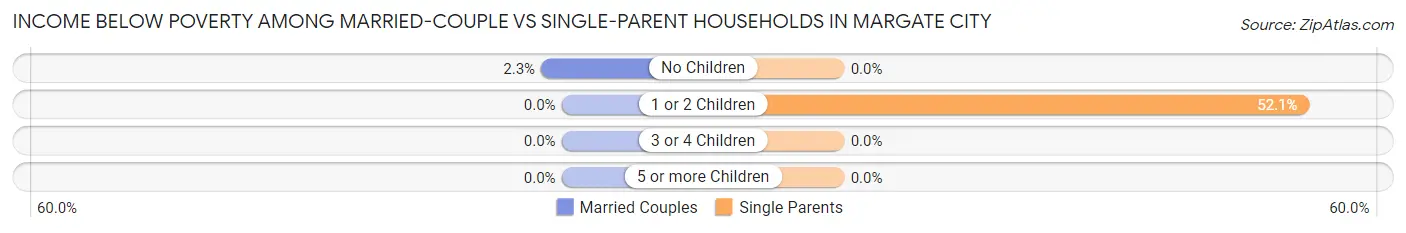
| Children | Married-Couple Families | Single-Parent Households |
| No Children | 22 (2.3%) | 0 (0.0%) |
| 1 or 2 Children | 0 (0.0%) | 38 (52.0%) |
| 3 or 4 Children | 0 (0.0%) | 0 (0.0%) |
| 5 or more Children | 0 (0.0%) | 0 (0.0%) |
| Total | 22 (1.7%) | 38 (11.1%) |
Race in Margate City
The most populous races in Margate City are White / Caucasian (5,038 | 94.5%), Hispanic or Latino (136 | 2.5%), and Two or more Races (111 | 2.1%).
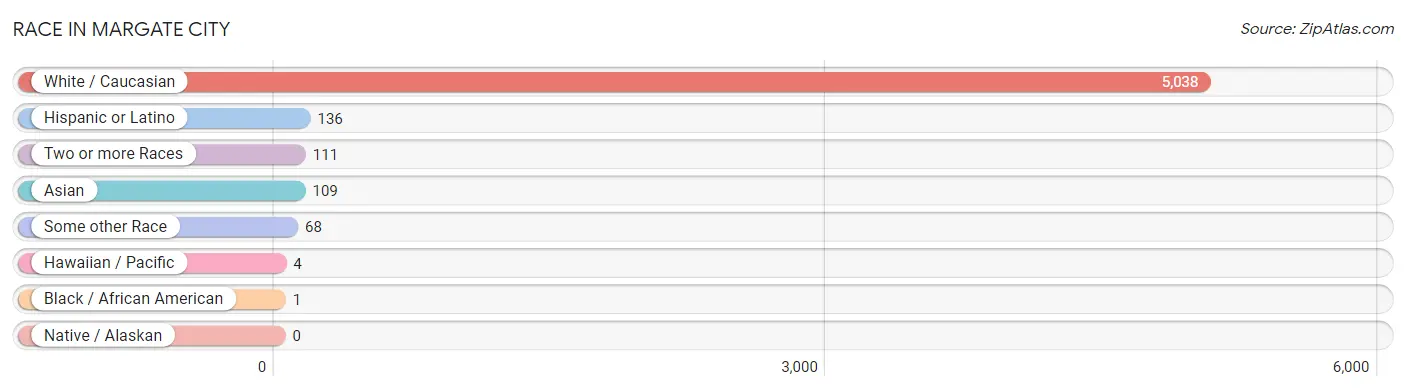
| Race | # Population | % Population |
| Asian | 109 | 2.0% |
| Black / African American | 1 | 0.0% |
| Hawaiian / Pacific | 4 | 0.1% |
| Hispanic or Latino | 136 | 2.5% |
| Native / Alaskan | 0 | 0.0% |
| White / Caucasian | 5,038 | 94.5% |
| Two or more Races | 111 | 2.1% |
| Some other Race | 68 | 1.3% |
| Total | 5,331 | 100.0% |
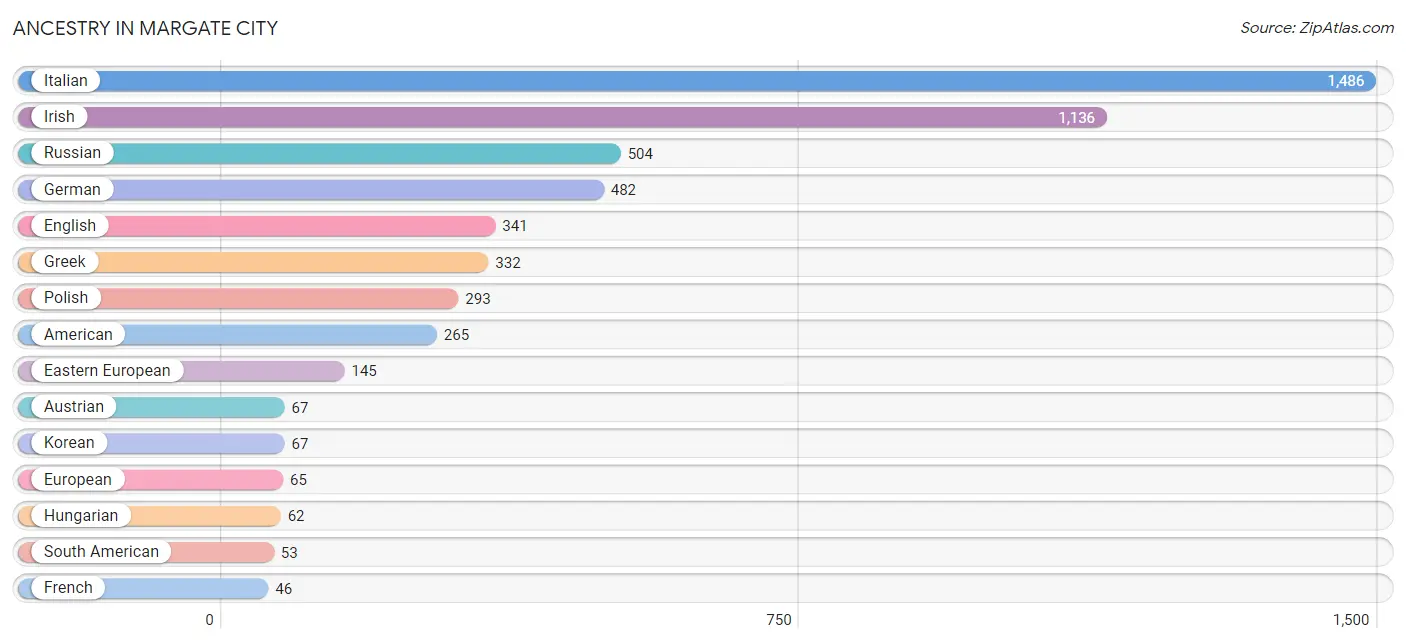
Ancestry in Margate City
The most populous ancestries reported in Margate City are Italian (1,486 | 27.9%), Irish (1,136 | 21.3%), Russian (504 | 9.5%), German (482 | 9.0%), and English (341 | 6.4%), together accounting for 74.1% of all Margate City residents.
| Ancestry | # Population | % Population |
| American | 265 | 5.0% |
| Arab | 7 | 0.1% |
| Armenian | 6 | 0.1% |
| Austrian | 67 | 1.3% |
| British | 23 | 0.4% |
| Canadian | 28 | 0.5% |
| Colombian | 30 | 0.6% |
| Cuban | 19 | 0.4% |
| Dominican | 45 | 0.8% |
| Dutch | 3 | 0.1% |
| Eastern European | 145 | 2.7% |
| English | 341 | 6.4% |
| European | 65 | 1.2% |
| French | 46 | 0.9% |
| German | 482 | 9.0% |
| Greek | 332 | 6.2% |
| Hungarian | 62 | 1.2% |
| Indian (Asian) | 28 | 0.5% |
| Irish | 1,136 | 21.3% |
| Israeli | 5 | 0.1% |
| Italian | 1,486 | 27.9% |
| Korean | 67 | 1.3% |
| Lithuanian | 29 | 0.5% |
| Luxembourger | 35 | 0.7% |
| Mexican | 19 | 0.4% |
| Native Hawaiian | 4 | 0.1% |
| Pennsylvania German | 6 | 0.1% |
| Peruvian | 23 | 0.4% |
| Polish | 293 | 5.5% |
| Portuguese | 2 | 0.0% |
| Romanian | 13 | 0.2% |
| Russian | 504 | 9.5% |
| Scotch-Irish | 19 | 0.4% |
| Scottish | 15 | 0.3% |
| Serbian | 5 | 0.1% |
| South American | 53 | 1.0% |
| Swedish | 10 | 0.2% |
| Swiss | 22 | 0.4% |
| Syrian | 7 | 0.1% |
| Thai | 14 | 0.3% |
| Ukrainian | 38 | 0.7% | View All 41 Rows |
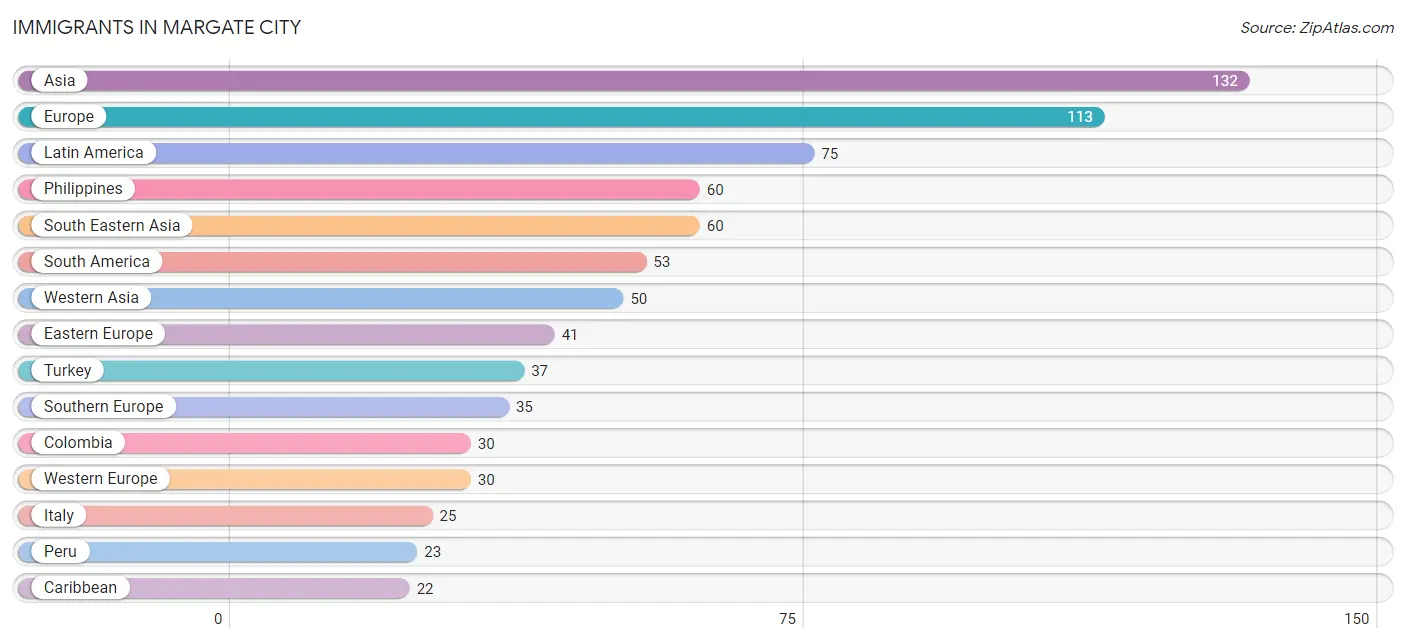
Immigrants in Margate City
The most numerous immigrant groups reported in Margate City came from Asia (132 | 2.5%), Europe (113 | 2.1%), Latin America (75 | 1.4%), Philippines (60 | 1.1%), and South Eastern Asia (60 | 1.1%), together accounting for 8.3% of all Margate City residents.
| Immigration Origin | # Population | % Population |
| Africa | 10 | 0.2% |
| Asia | 132 | 2.5% |
| Caribbean | 22 | 0.4% |
| China | 14 | 0.3% |
| Colombia | 30 | 0.6% |
| Dominican Republic | 22 | 0.4% |
| Eastern Asia | 14 | 0.3% |
| Eastern Europe | 41 | 0.8% |
| Egypt | 10 | 0.2% |
| England | 7 | 0.1% |
| Europe | 113 | 2.1% |
| France | 8 | 0.2% |
| Germany | 15 | 0.3% |
| Greece | 10 | 0.2% |
| Hungary | 17 | 0.3% |
| Israel | 7 | 0.1% |
| Italy | 25 | 0.5% |
| Latin America | 75 | 1.4% |
| Lebanon | 6 | 0.1% |
| Northern Africa | 10 | 0.2% |
| Northern Europe | 7 | 0.1% |
| Pakistan | 8 | 0.2% |
| Peru | 23 | 0.4% |
| Philippines | 60 | 1.1% |
| Poland | 1 | 0.0% |
| Romania | 9 | 0.2% |
| Russia | 9 | 0.2% |
| Serbia | 5 | 0.1% |
| South America | 53 | 1.0% |
| South Central Asia | 8 | 0.2% |
| South Eastern Asia | 60 | 1.1% |
| Southern Europe | 35 | 0.7% |
| Switzerland | 7 | 0.1% |
| Turkey | 37 | 0.7% |
| Western Asia | 50 | 0.9% |
| Western Europe | 30 | 0.6% | View All 36 Rows |
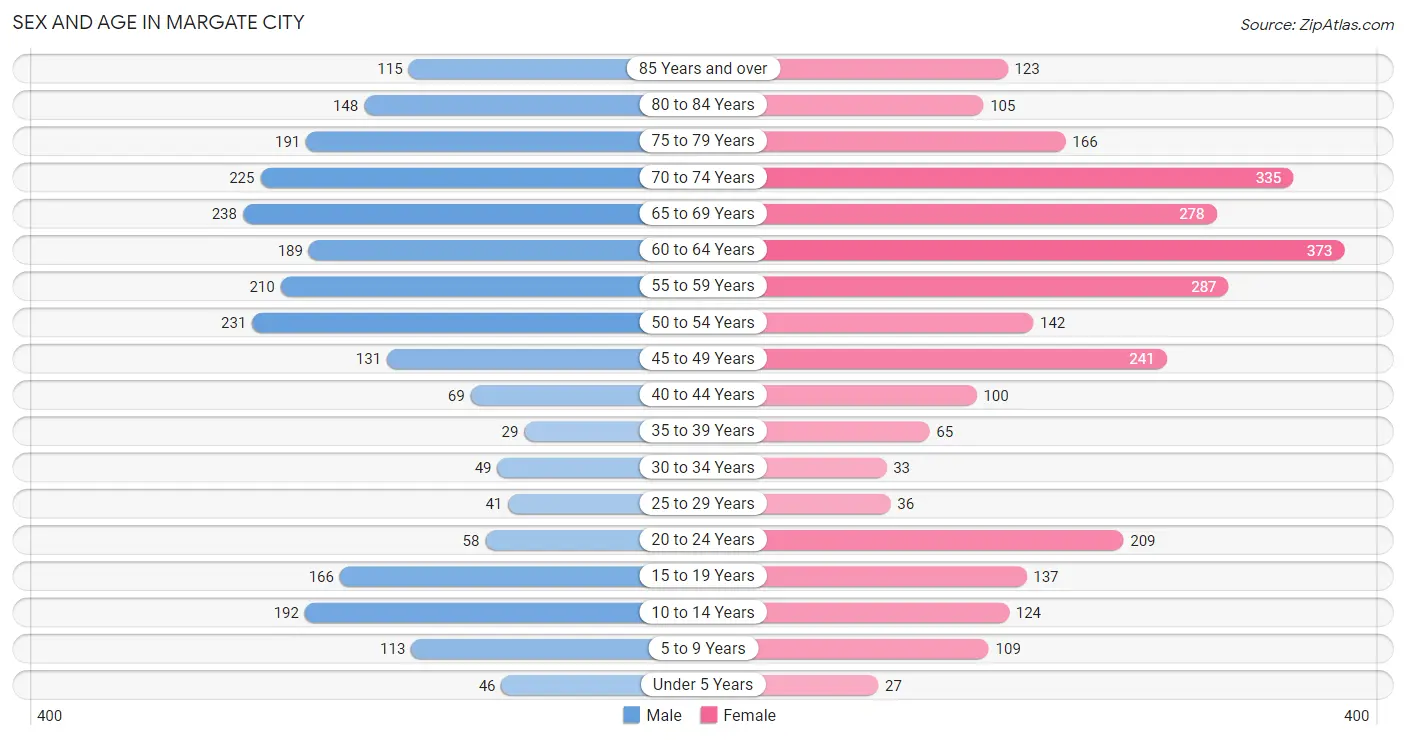
Sex and Age in Margate City
Sex and Age in Margate City
The most populous age groups in Margate City are 65 to 69 Years (238 | 9.8%) for men and 60 to 64 Years (373 | 12.9%) for women.
| Age Bracket | Male | Female |
| Under 5 Years | 46 (1.9%) | 27 (0.9%) |
| 5 to 9 Years | 113 (4.6%) | 109 (3.8%) |
| 10 to 14 Years | 192 (7.9%) | 124 (4.3%) |
| 15 to 19 Years | 166 (6.8%) | 137 (4.7%) |
| 20 to 24 Years | 58 (2.4%) | 209 (7.2%) |
| 25 to 29 Years | 41 (1.7%) | 36 (1.3%) |
| 30 to 34 Years | 49 (2.0%) | 33 (1.1%) |
| 35 to 39 Years | 29 (1.2%) | 65 (2.2%) |
| 40 to 44 Years | 69 (2.8%) | 100 (3.5%) |
| 45 to 49 Years | 131 (5.4%) | 241 (8.3%) |
| 50 to 54 Years | 231 (9.5%) | 142 (4.9%) |
| 55 to 59 Years | 210 (8.6%) | 287 (9.9%) |
| 60 to 64 Years | 189 (7.7%) | 373 (12.9%) |
| 65 to 69 Years | 238 (9.8%) | 278 (9.6%) |
| 70 to 74 Years | 225 (9.2%) | 335 (11.6%) |
| 75 to 79 Years | 191 (7.8%) | 166 (5.7%) |
| 80 to 84 Years | 148 (6.1%) | 105 (3.6%) |
| 85 Years and over | 115 (4.7%) | 123 (4.3%) |
| Total | 2,441 (100.0%) | 2,890 (100.0%) |
Families and Households in Margate City
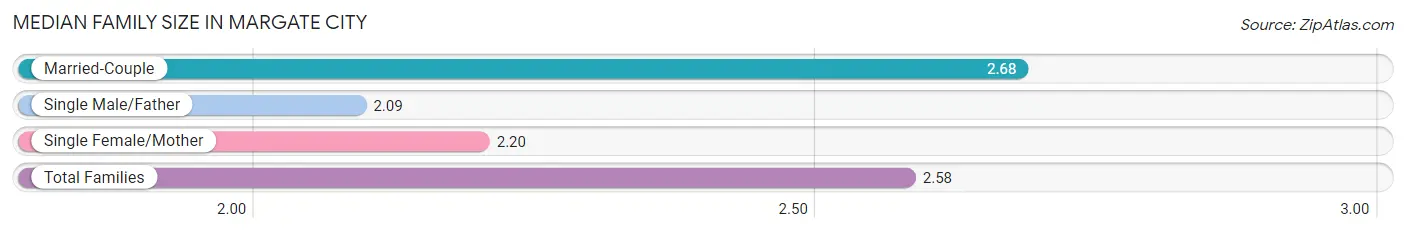
Median Family Size in Margate City
The median family size in Margate City is 2.58 persons per family, with married-couple families (1,325 | 79.5%) accounting for the largest median family size of 2.68 persons per family. On the other hand, single male/father families (86 | 5.2%) represent the smallest median family size with 2.09 persons per family.
| Family Type | # Families | Family Size |
| Married-Couple | 1,325 (79.5%) | 2.68 |
| Single Male/Father | 86 (5.2%) | 2.09 |
| Single Female/Mother | 256 (15.4%) | 2.20 |
| Total Families | 1,667 (100.0%) | 2.58 |
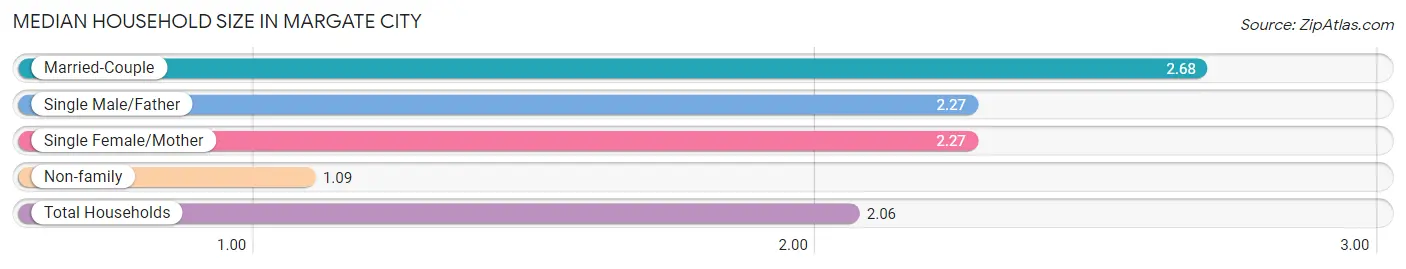
Median Household Size in Margate City
The median household size in Margate City is 2.06 persons per household, with married-couple households (1,325 | 51.3%) accounting for the largest median household size of 2.68 persons per household. non-family households (917 | 35.5%) represent the smallest median household size with 1.09 persons per household.
| Household Type | # Households | Household Size |
| Married-Couple | 1,325 (51.3%) | 2.68 |
| Single Male/Father | 86 (3.3%) | 2.27 |
| Single Female/Mother | 256 (9.9%) | 2.27 |
| Non-family | 917 (35.5%) | 1.09 |
| Total Households | 2,584 (100.0%) | 2.06 |
Household Size by Marriage Status in Margate City
Out of a total of 2,584 households in Margate City, 1,667 (64.5%) are family households, while 917 (35.5%) are nonfamily households. The most numerous type of family households are 2-person households, comprising 1,118, and the most common type of nonfamily households are 1-person households, comprising 843.
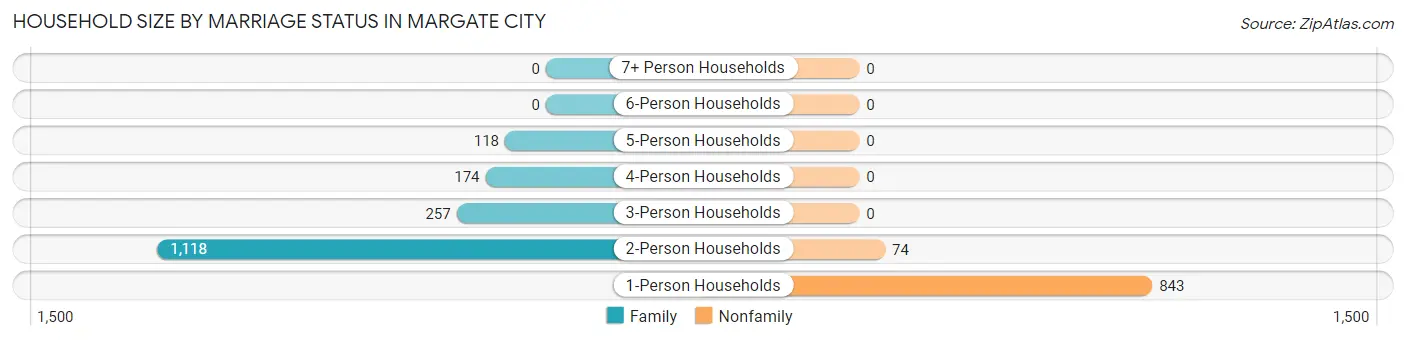
| Household Size | Family Households | Nonfamily Households |
| 1-Person Households | - | 843 (32.6%) |
| 2-Person Households | 1,118 (43.3%) | 74 (2.9%) |
| 3-Person Households | 257 (10.0%) | 0 (0.0%) |
| 4-Person Households | 174 (6.7%) | 0 (0.0%) |
| 5-Person Households | 118 (4.6%) | 0 (0.0%) |
| 6-Person Households | 0 (0.0%) | 0 (0.0%) |
| 7+ Person Households | 0 (0.0%) | 0 (0.0%) |
| Total | 1,667 (64.5%) | 917 (35.5%) |
Female Fertility in Margate City
Fertility by Age in Margate City
Average fertility rate in Margate City is 29.0 births per 1,000 women. Women in the age bracket of 35 to 50 years have the highest fertility rate with 57.0 births per 1,000 women. Women in the age bracket of 35 to 50 years acount for 100.0% of all women with births.
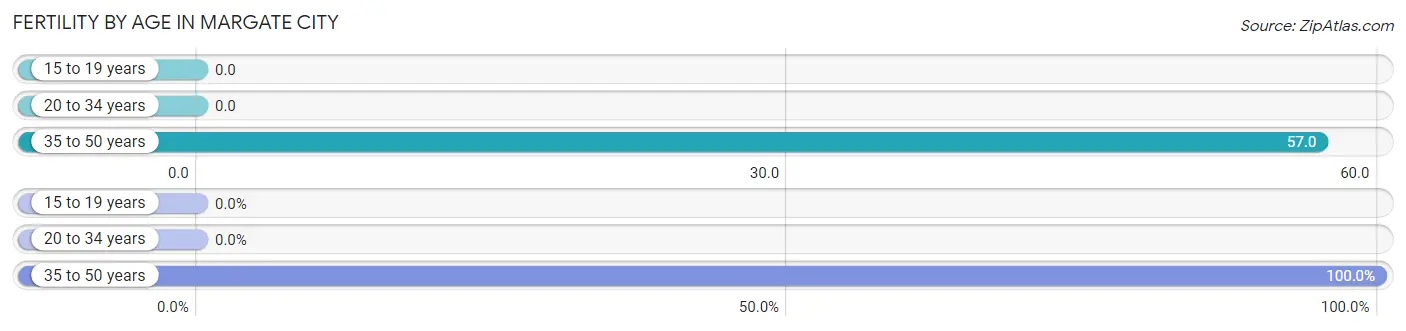
| Age Bracket | Women with Births | Births / 1,000 Women |
| 15 to 19 years | 0 (0.0%) | 0.0 |
| 20 to 34 years | 0 (0.0%) | 0.0 |
| 35 to 50 years | 24 (100.0%) | 57.0 |
| Total | 24 (100.0%) | 29.0 |
Fertility by Age by Marriage Status in Margate City
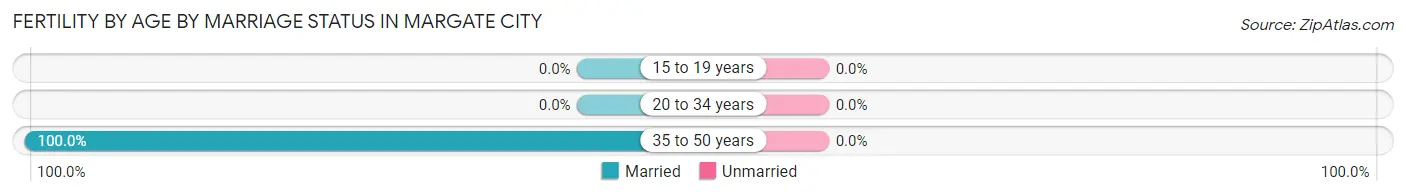
| Age Bracket | Married | Unmarried |
| 15 to 19 years | 0 (0.0%) | 0 (0.0%) |
| 20 to 34 years | 0 (0.0%) | 0 (0.0%) |
| 35 to 50 years | 24 (100.0%) | 0 (0.0%) |
| Total | 24 (100.0%) | 0 (0.0%) |
Fertility by Education in Margate City
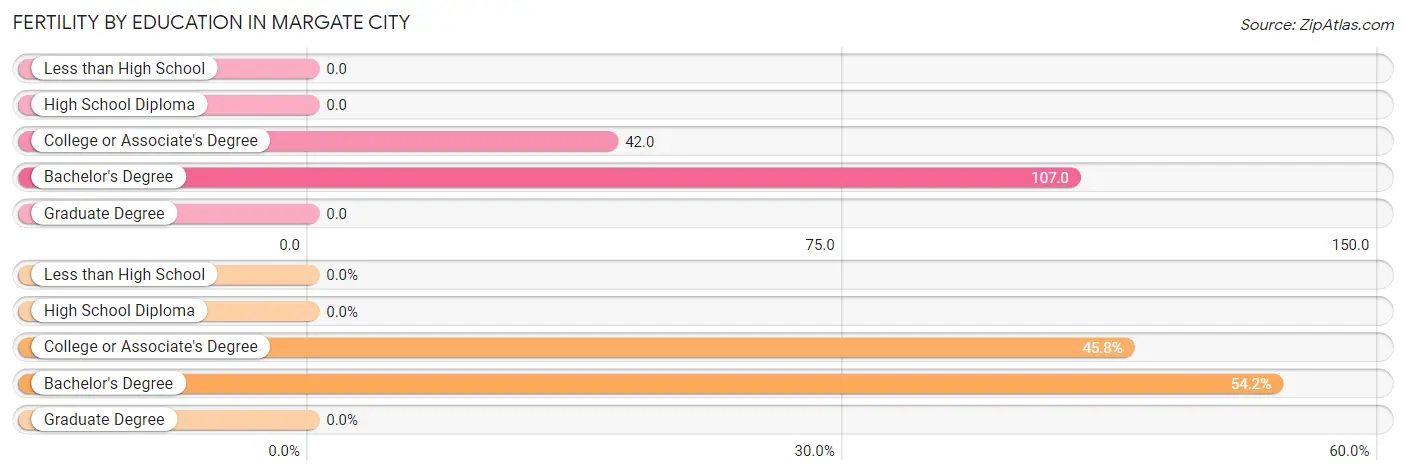
| Educational Attainment | Women with Births | Births / 1,000 Women |
| Less than High School | 0 (0.0%) | 0.0 |
| High School Diploma | 0 (0.0%) | 0.0 |
| College or Associate's Degree | 11 (45.8%) | 42.0 |
| Bachelor's Degree | 13 (54.2%) | 107.0 |
| Graduate Degree | 0 (0.0%) | 0.0 |
| Total | 24 (100.0%) | 29.0 |
Fertility by Education by Marriage Status in Margate City
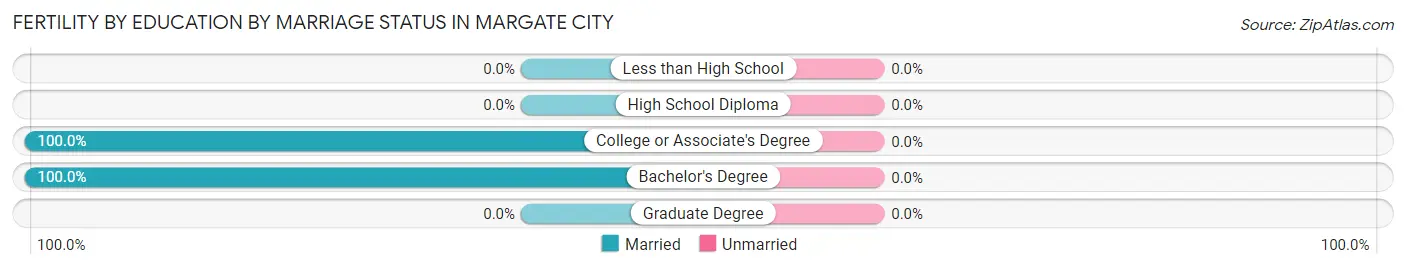
| Educational Attainment | Married | Unmarried |
| Less than High School | 0 (0.0%) | 0 (0.0%) |
| High School Diploma | 0 (0.0%) | 0 (0.0%) |
| College or Associate's Degree | 11 (100.0%) | 0 (0.0%) |
| Bachelor's Degree | 13 (100.0%) | 0 (0.0%) |
| Graduate Degree | 0 (0.0%) | 0 (0.0%) |
| Total | 24 (100.0%) | 0 (0.0%) |
Employment Characteristics in Margate City
Employment by Class of Employer in Margate City
Among the 2,443 employed individuals in Margate City, private company employees (1,462 | 59.8%), local government employees (418 | 17.1%), and self-employed (incorporated) (183 | 7.5%) make up the most common classes of employment.
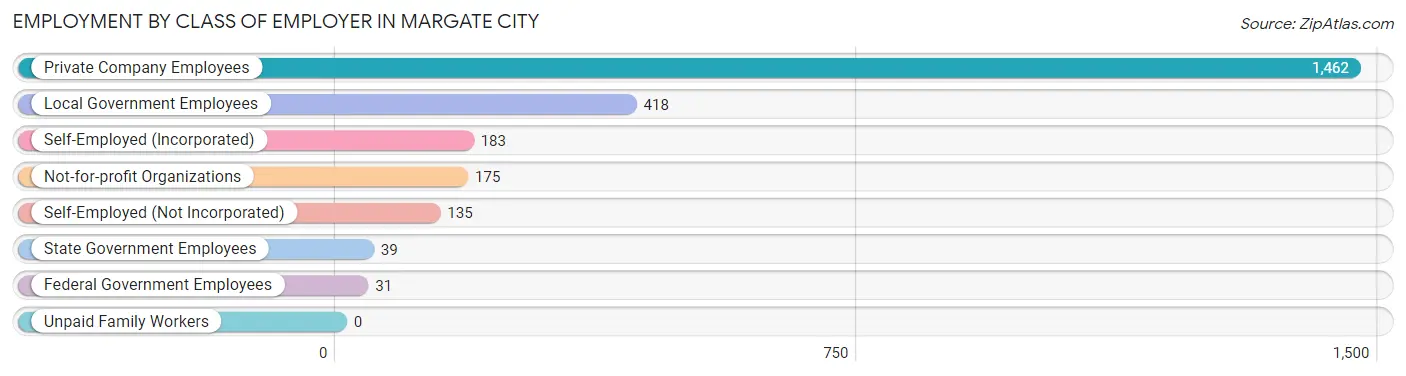
| Employer Class | # Employees | % Employees |
| Private Company Employees | 1,462 | 59.8% |
| Self-Employed (Incorporated) | 183 | 7.5% |
| Self-Employed (Not Incorporated) | 135 | 5.5% |
| Not-for-profit Organizations | 175 | 7.2% |
| Local Government Employees | 418 | 17.1% |
| State Government Employees | 39 | 1.6% |
| Federal Government Employees | 31 | 1.3% |
| Unpaid Family Workers | 0 | 0.0% |
| Total | 2,443 | 100.0% |
Employment Status by Age in Margate City
According to the labor force statistics for Margate City, out of the total population over 16 years of age (4,642), 55.8% or 2,590 individuals are in the labor force, with 4.0% or 104 of them unemployed. The age group with the highest labor force participation rate is 30 to 34 years, with 100.0% or 82 individuals in the labor force. Within the labor force, the 55 to 59 years age range has the highest percentage of unemployed individuals, with 6.4% or 24 of them being unemployed.
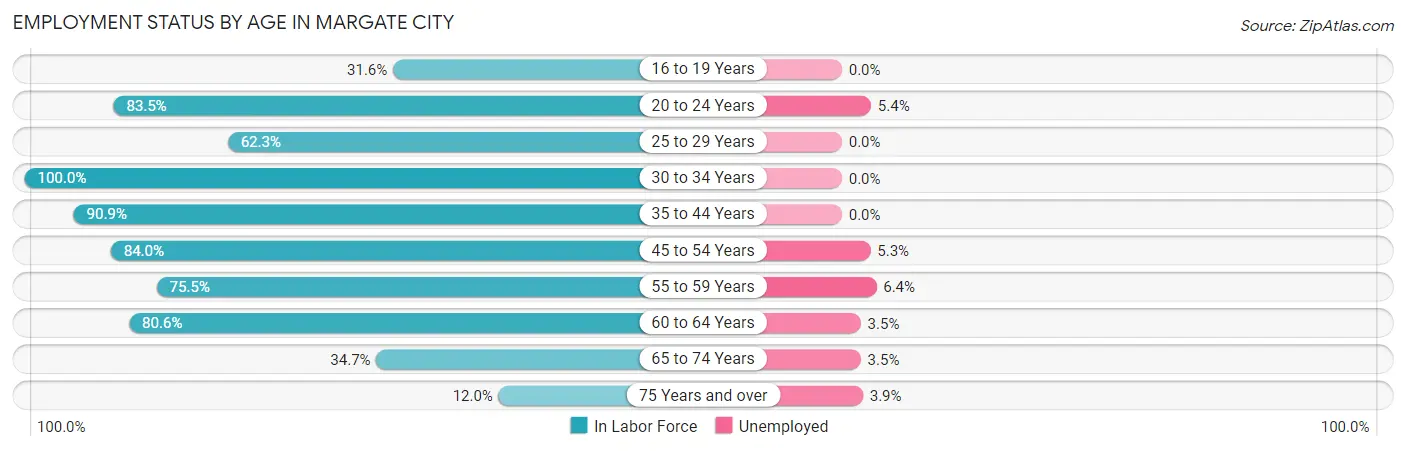
| Age Bracket | In Labor Force | Unemployed |
| 16 to 19 Years | 71 (31.6%) | 0 (0.0%) |
| 20 to 24 Years | 223 (83.5%) | 12 (5.4%) |
| 25 to 29 Years | 48 (62.3%) | 0 (0.0%) |
| 30 to 34 Years | 82 (100.0%) | 0 (0.0%) |
| 35 to 44 Years | 239 (90.9%) | 0 (0.0%) |
| 45 to 54 Years | 626 (84.0%) | 33 (5.3%) |
| 55 to 59 Years | 375 (75.5%) | 24 (6.4%) |
| 60 to 64 Years | 453 (80.6%) | 16 (3.5%) |
| 65 to 74 Years | 373 (34.7%) | 13 (3.5%) |
| 75 Years and over | 102 (12.0%) | 4 (3.9%) |
| Total | 2,590 (55.8%) | 104 (4.0%) |
Employment Status by Educational Attainment in Margate City
According to labor force statistics for Margate City, 81.9% of individuals (1,823) out of the total population between 25 and 64 years of age (2,226) are in the labor force, with 4.0% or 73 of them being unemployed. The group with the highest labor force participation rate are those with the educational attainment of bachelor's degree or higher, with 84.9% or 1,159 individuals in the labor force. Within the labor force, individuals with high school diploma education have the highest percentage of unemployment, with 13.8% or 15 of them being unemployed.
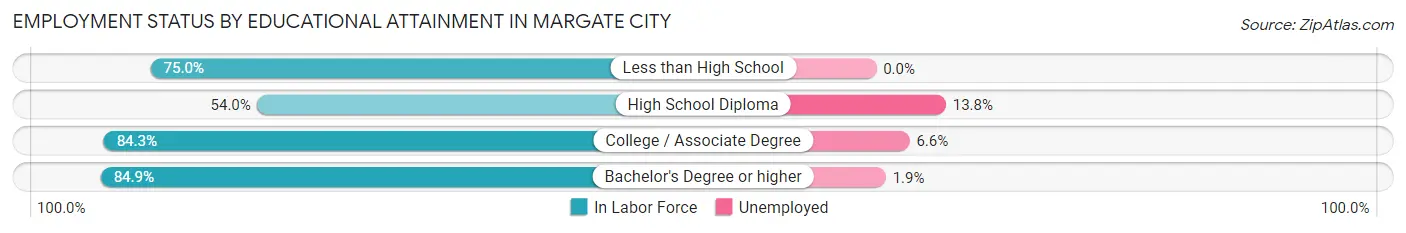
| Educational Attainment | In Labor Force | Unemployed |
| Less than High School | 6 (75.0%) | 0 (0.0%) |
| High School Diploma | 109 (54.0%) | 28 (13.8%) |
| College / Associate Degree | 549 (84.3%) | 43 (6.6%) |
| Bachelor's Degree or higher | 1,159 (84.9%) | 26 (1.9%) |
| Total | 1,823 (81.9%) | 89 (4.0%) |
Employment Occupations by Sex in Margate City
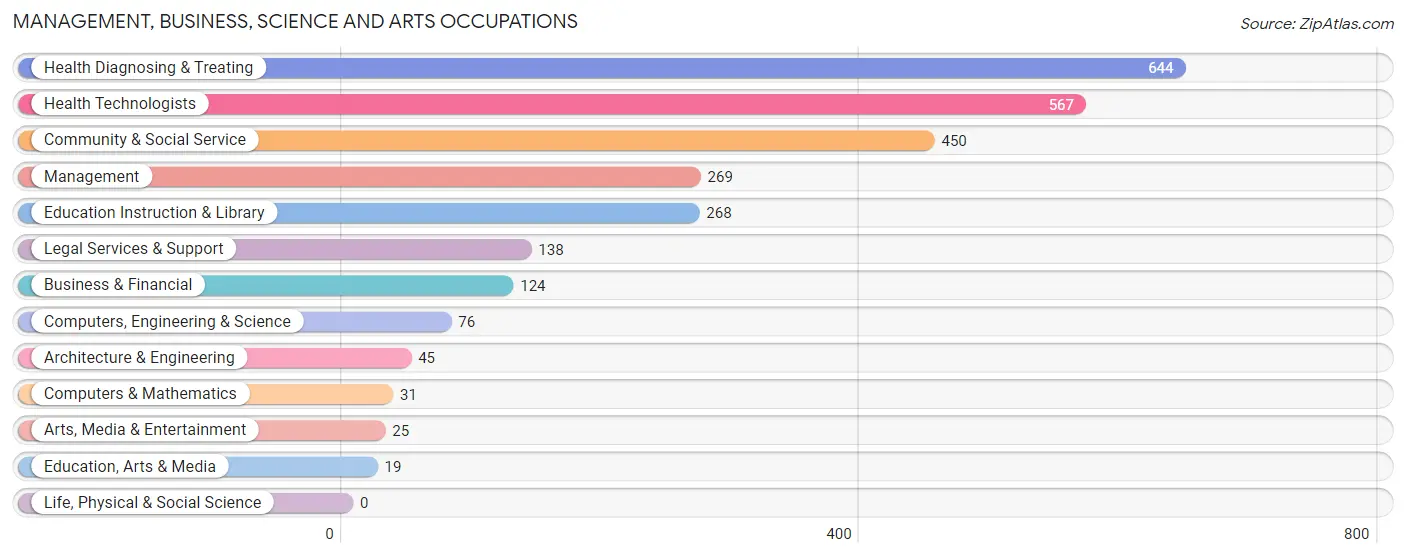
Management, Business, Science and Arts Occupations
The most common Management, Business, Science and Arts occupations in Margate City are Health Diagnosing & Treating (644 | 26.0%), Health Technologists (567 | 22.9%), Community & Social Service (450 | 18.2%), Management (269 | 10.9%), and Education Instruction & Library (268 | 10.8%).
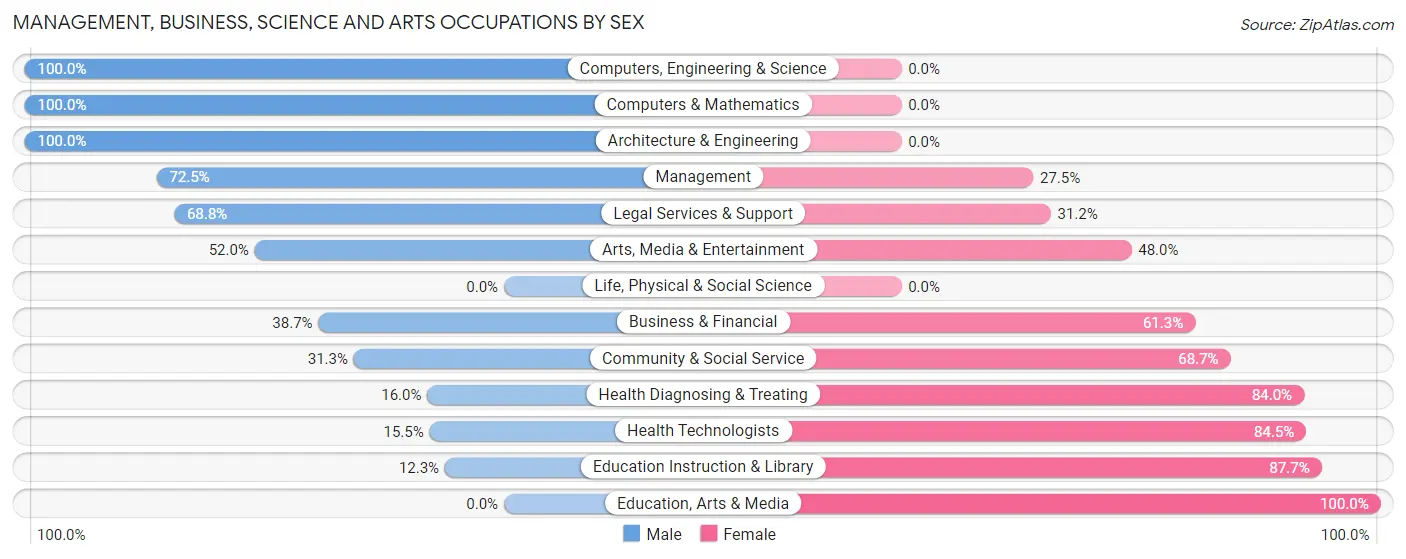
Management, Business, Science and Arts Occupations by Sex
Within the Management, Business, Science and Arts occupations in Margate City, the most male-oriented occupations are Computers, Engineering & Science (100.0%), Computers & Mathematics (100.0%), and Architecture & Engineering (100.0%), while the most female-oriented occupations are Education, Arts & Media (100.0%), Education Instruction & Library (87.7%), and Health Technologists (84.5%).
| Occupation | Male | Female |
| Management | 195 (72.5%) | 74 (27.5%) |
| Business & Financial | 48 (38.7%) | 76 (61.3%) |
| Computers, Engineering & Science | 76 (100.0%) | 0 (0.0%) |
| Computers & Mathematics | 31 (100.0%) | 0 (0.0%) |
| Architecture & Engineering | 45 (100.0%) | 0 (0.0%) |
| Life, Physical & Social Science | 0 (0.0%) | 0 (0.0%) |
| Community & Social Service | 141 (31.3%) | 309 (68.7%) |
| Education, Arts & Media | 0 (0.0%) | 19 (100.0%) |
| Legal Services & Support | 95 (68.8%) | 43 (31.2%) |
| Education Instruction & Library | 33 (12.3%) | 235 (87.7%) |
| Arts, Media & Entertainment | 13 (52.0%) | 12 (48.0%) |
| Health Diagnosing & Treating | 103 (16.0%) | 541 (84.0%) |
| Health Technologists | 88 (15.5%) | 479 (84.5%) |
| Total (Category) | 563 (36.0%) | 1,000 (64.0%) |
| Total (Overall) | 1,114 (45.0%) | 1,363 (55.0%) |
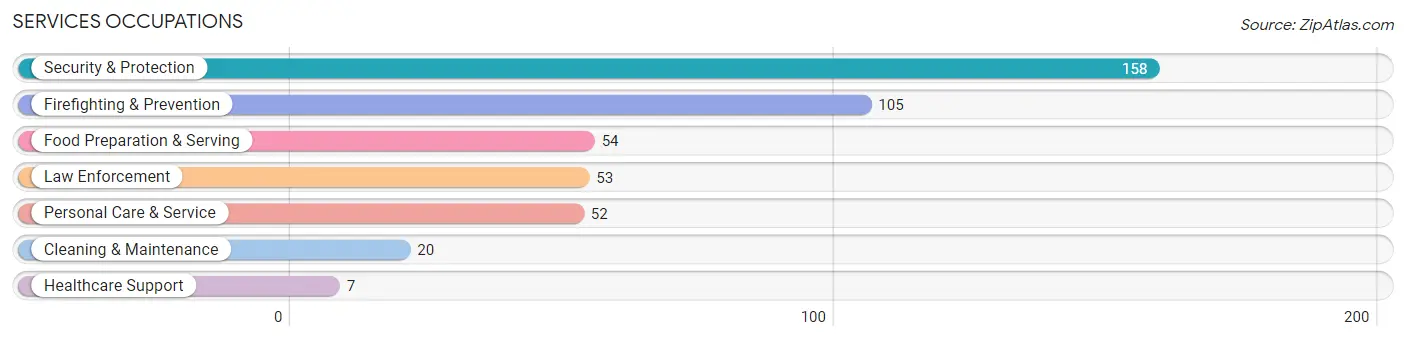
Services Occupations
The most common Services occupations in Margate City are Security & Protection (158 | 6.4%), Firefighting & Prevention (105 | 4.2%), Food Preparation & Serving (54 | 2.2%), Law Enforcement (53 | 2.1%), and Personal Care & Service (52 | 2.1%).
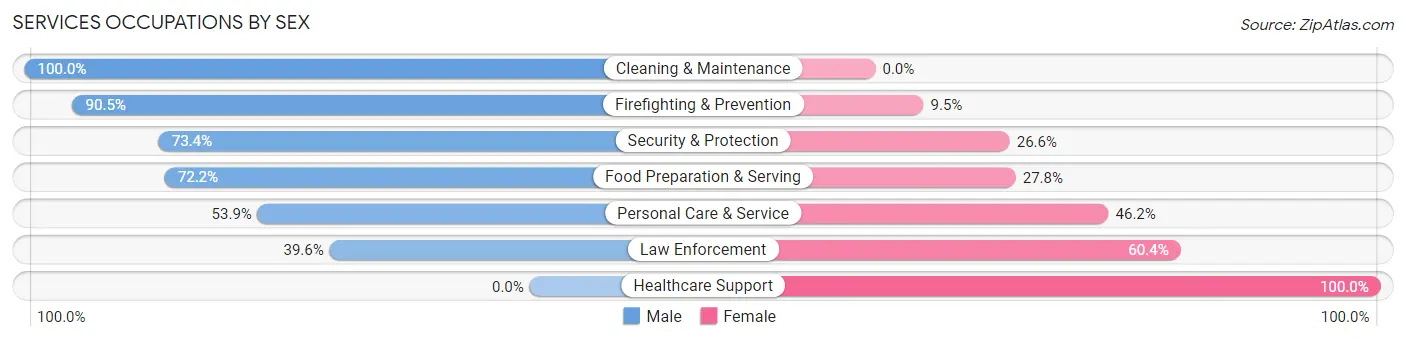
Services Occupations by Sex
Within the Services occupations in Margate City, the most male-oriented occupations are Cleaning & Maintenance (100.0%), Firefighting & Prevention (90.5%), and Security & Protection (73.4%), while the most female-oriented occupations are Healthcare Support (100.0%), Law Enforcement (60.4%), and Personal Care & Service (46.2%).
| Occupation | Male | Female |
| Healthcare Support | 0 (0.0%) | 7 (100.0%) |
| Security & Protection | 116 (73.4%) | 42 (26.6%) |
| Firefighting & Prevention | 95 (90.5%) | 10 (9.5%) |
| Law Enforcement | 21 (39.6%) | 32 (60.4%) |
| Food Preparation & Serving | 39 (72.2%) | 15 (27.8%) |
| Cleaning & Maintenance | 20 (100.0%) | 0 (0.0%) |
| Personal Care & Service | 28 (53.8%) | 24 (46.2%) |
| Total (Category) | 203 (69.8%) | 88 (30.2%) |
| Total (Overall) | 1,114 (45.0%) | 1,363 (55.0%) |
Sales and Office Occupations
The most common Sales and Office occupations in Margate City are Sales & Related (340 | 13.7%), and Office & Administration (164 | 6.6%).
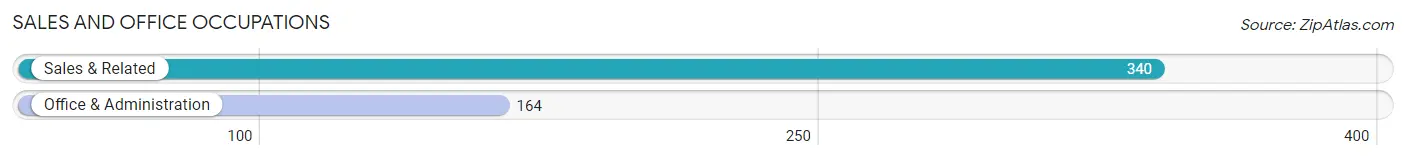
Sales and Office Occupations by Sex
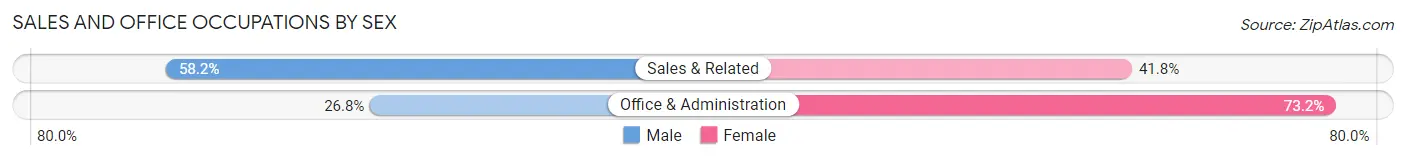
| Occupation | Male | Female |
| Sales & Related | 198 (58.2%) | 142 (41.8%) |
| Office & Administration | 44 (26.8%) | 120 (73.2%) |
| Total (Category) | 242 (48.0%) | 262 (52.0%) |
| Total (Overall) | 1,114 (45.0%) | 1,363 (55.0%) |
Natural Resources, Construction and Maintenance Occupations
The most common Natural Resources, Construction and Maintenance occupations in Margate City are Construction & Extraction (20 | 0.8%), and Installation, Maintenance & Repair (14 | 0.6%).
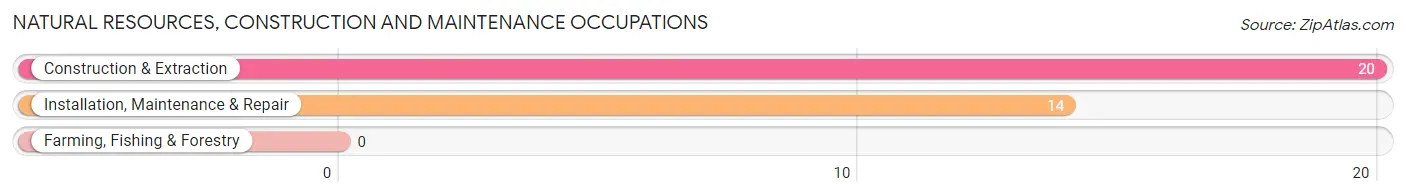
Natural Resources, Construction and Maintenance Occupations by Sex
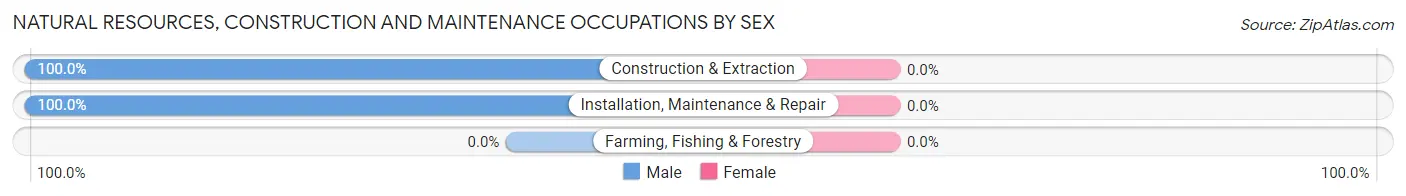
| Occupation | Male | Female |
| Farming, Fishing & Forestry | 0 (0.0%) | 0 (0.0%) |
| Construction & Extraction | 20 (100.0%) | 0 (0.0%) |
| Installation, Maintenance & Repair | 14 (100.0%) | 0 (0.0%) |
| Total (Category) | 34 (100.0%) | 0 (0.0%) |
| Total (Overall) | 1,114 (45.0%) | 1,363 (55.0%) |
Production, Transportation and Moving Occupations
The most common Production, Transportation and Moving occupations in Margate City are Material Moving (81 | 3.3%), and Production (4 | 0.2%).
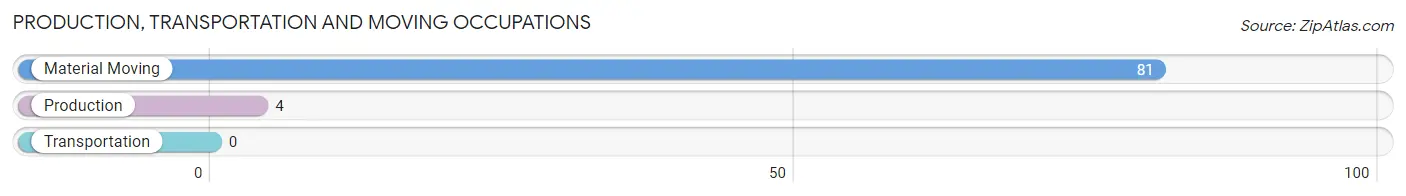
Production, Transportation and Moving Occupations by Sex
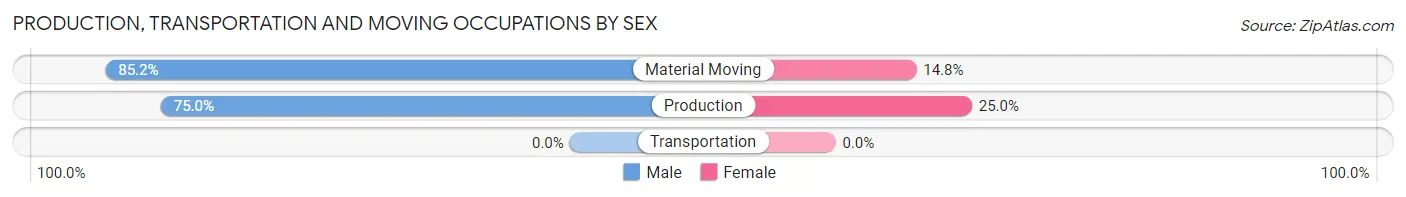
| Occupation | Male | Female |
| Production | 3 (75.0%) | 1 (25.0%) |
| Transportation | 0 (0.0%) | 0 (0.0%) |
| Material Moving | 69 (85.2%) | 12 (14.8%) |
| Total (Category) | 72 (84.7%) | 13 (15.3%) |
| Total (Overall) | 1,114 (45.0%) | 1,363 (55.0%) |
Employment Industries by Sex in Margate City
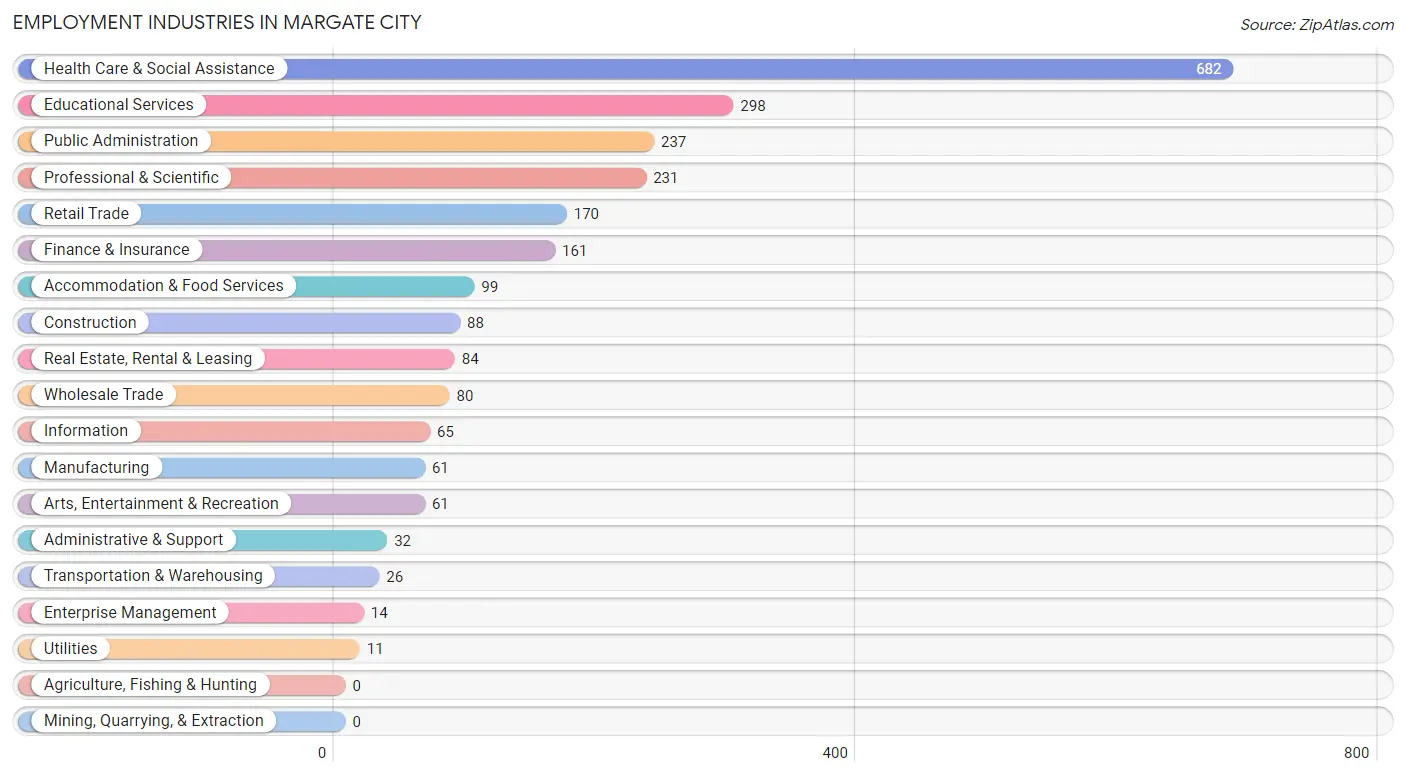
Employment Industries in Margate City
The major employment industries in Margate City include Health Care & Social Assistance (682 | 27.5%), Educational Services (298 | 12.0%), Public Administration (237 | 9.6%), Professional & Scientific (231 | 9.3%), and Retail Trade (170 | 6.9%).
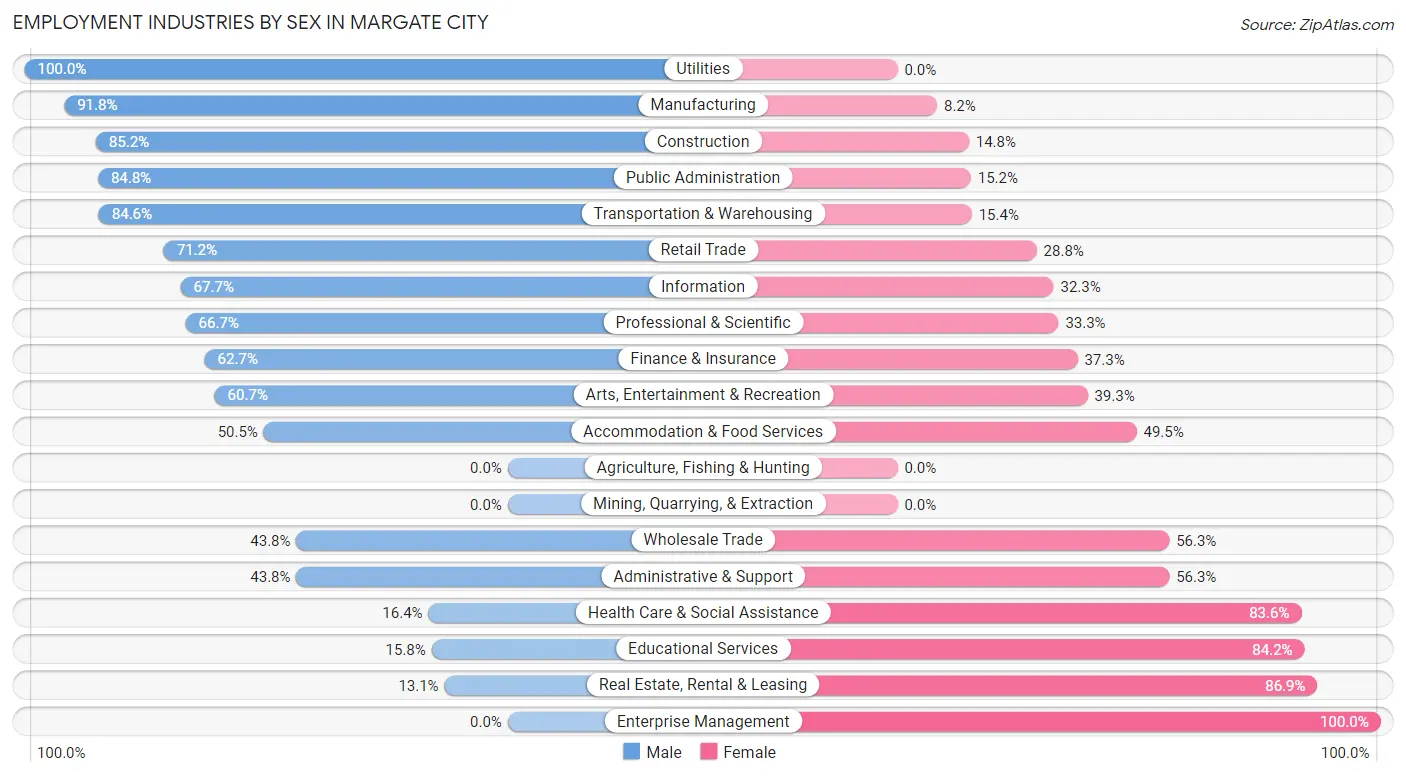
Employment Industries by Sex in Margate City
The Margate City industries that see more men than women are Utilities (100.0%), Manufacturing (91.8%), and Construction (85.2%), whereas the industries that tend to have a higher number of women are Enterprise Management (100.0%), Real Estate, Rental & Leasing (86.9%), and Educational Services (84.2%).
| Industry | Male | Female |
| Agriculture, Fishing & Hunting | 0 (0.0%) | 0 (0.0%) |
| Mining, Quarrying, & Extraction | 0 (0.0%) | 0 (0.0%) |
| Construction | 75 (85.2%) | 13 (14.8%) |
| Manufacturing | 56 (91.8%) | 5 (8.2%) |
| Wholesale Trade | 35 (43.8%) | 45 (56.2%) |
| Retail Trade | 121 (71.2%) | 49 (28.8%) |
| Transportation & Warehousing | 22 (84.6%) | 4 (15.4%) |
| Utilities | 11 (100.0%) | 0 (0.0%) |
| Information | 44 (67.7%) | 21 (32.3%) |
| Finance & Insurance | 101 (62.7%) | 60 (37.3%) |
| Real Estate, Rental & Leasing | 11 (13.1%) | 73 (86.9%) |
| Professional & Scientific | 154 (66.7%) | 77 (33.3%) |
| Enterprise Management | 0 (0.0%) | 14 (100.0%) |
| Administrative & Support | 14 (43.8%) | 18 (56.2%) |
| Educational Services | 47 (15.8%) | 251 (84.2%) |
| Health Care & Social Assistance | 112 (16.4%) | 570 (83.6%) |
| Arts, Entertainment & Recreation | 37 (60.7%) | 24 (39.3%) |
| Accommodation & Food Services | 50 (50.5%) | 49 (49.5%) |
| Public Administration | 201 (84.8%) | 36 (15.2%) |
| Total | 1,114 (45.0%) | 1,363 (55.0%) |
Education in Margate City
School Enrollment in Margate City
The most common levels of schooling among the 1,095 students in Margate City are college / undergraduate (340 | 31.0%), middle school (289 | 26.4%), and high school (212 | 19.4%).
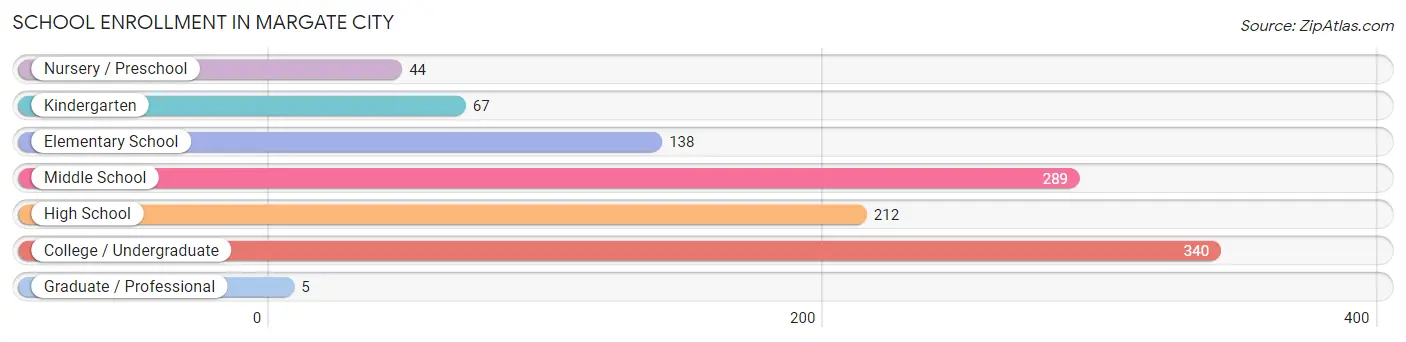
| School Level | # Students | % Students |
| Nursery / Preschool | 44 | 4.0% |
| Kindergarten | 67 | 6.1% |
| Elementary School | 138 | 12.6% |
| Middle School | 289 | 26.4% |
| High School | 212 | 19.4% |
| College / Undergraduate | 340 | 31.0% |
| Graduate / Professional | 5 | 0.5% |
| Total | 1,095 | 100.0% |
School Enrollment by Age by Funding Source in Margate City
Out of a total of 1,095 students who are enrolled in schools in Margate City, 244 (22.3%) attend a private institution, while the remaining 851 (77.7%) are enrolled in public schools. The age group of 3 to 4 year olds has the highest likelihood of being enrolled in private schools, with 28 (93.3% in the age bracket) enrolled. Conversely, the age group of 25 to 34 year olds has the lowest likelihood of being enrolled in a private school, with 29 (100.0% in the age bracket) attending a public institution.
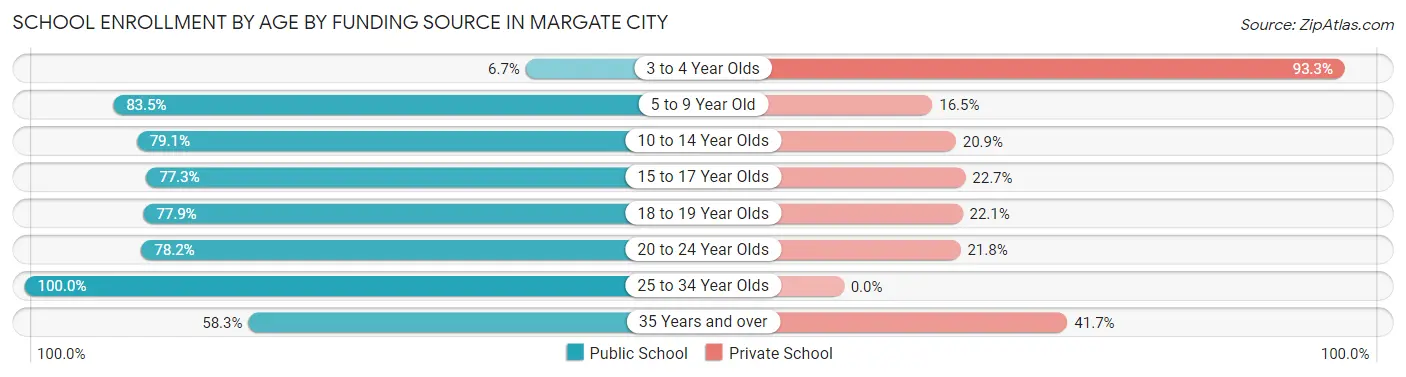
| Age Bracket | Public School | Private School |
| 3 to 4 Year Olds | 2 (6.7%) | 28 (93.3%) |
| 5 to 9 Year Old | 177 (83.5%) | 35 (16.5%) |
| 10 to 14 Year Olds | 250 (79.1%) | 66 (20.9%) |
| 15 to 17 Year Olds | 133 (77.3%) | 39 (22.7%) |
| 18 to 19 Year Olds | 102 (77.9%) | 29 (22.1%) |
| 20 to 24 Year Olds | 151 (78.2%) | 42 (21.8%) |
| 25 to 34 Year Olds | 29 (100.0%) | 0 (0.0%) |
| 35 Years and over | 7 (58.3%) | 5 (41.7%) |
| Total | 851 (77.7%) | 244 (22.3%) |
Educational Attainment by Field of Study in Margate City
Business (496 | 19.3%), education (389 | 15.2%), science & technology (353 | 13.8%), bio, nature & agricultural (228 | 8.9%), and social sciences (189 | 7.4%) are the most common fields of study among 2,565 individuals in Margate City who have obtained a bachelor's degree or higher.
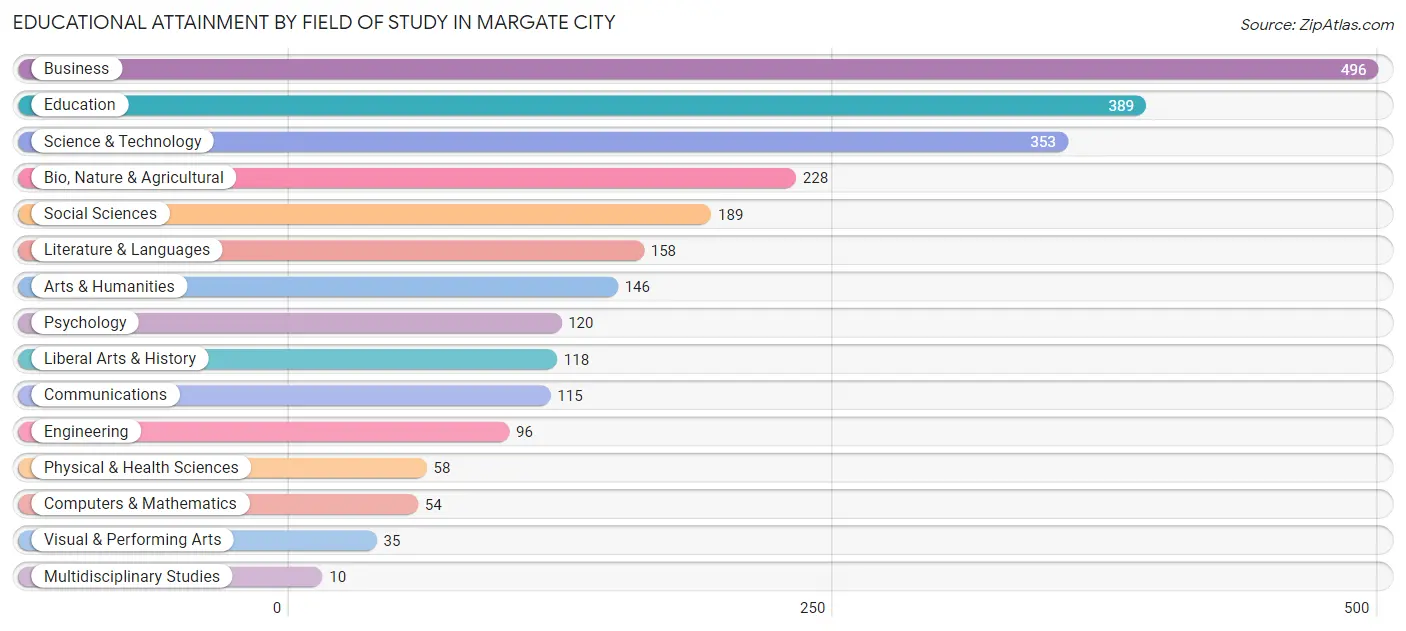
| Field of Study | # Graduates | % Graduates |
| Computers & Mathematics | 54 | 2.1% |
| Bio, Nature & Agricultural | 228 | 8.9% |
| Physical & Health Sciences | 58 | 2.3% |
| Psychology | 120 | 4.7% |
| Social Sciences | 189 | 7.4% |
| Engineering | 96 | 3.7% |
| Multidisciplinary Studies | 10 | 0.4% |
| Science & Technology | 353 | 13.8% |
| Business | 496 | 19.3% |
| Education | 389 | 15.2% |
| Literature & Languages | 158 | 6.2% |
| Liberal Arts & History | 118 | 4.6% |
| Visual & Performing Arts | 35 | 1.4% |
| Communications | 115 | 4.5% |
| Arts & Humanities | 146 | 5.7% |
| Total | 2,565 | 100.0% |
Transportation & Commute in Margate City
Vehicle Availability by Sex in Margate City
The most prevalent vehicle ownership categories in Margate City are males with 2 vehicles (580, accounting for 51.8%) and females with 2 vehicles (706, making up 43.9%).
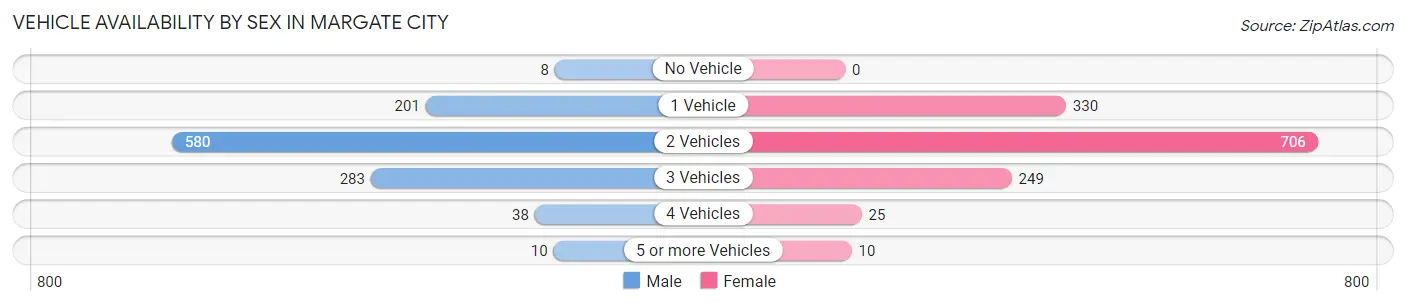
| Vehicles Available | Male | Female |
| No Vehicle | 8 (0.7%) | 0 (0.0%) |
| 1 Vehicle | 201 (17.9%) | 330 (25.0%) |
| 2 Vehicles | 580 (51.8%) | 706 (53.5%) |
| 3 Vehicles | 283 (25.3%) | 249 (18.9%) |
| 4 Vehicles | 38 (3.4%) | 25 (1.9%) |
| 5 or more Vehicles | 10 (0.9%) | 10 (0.8%) |
| Total | 1,120 (100.0%) | 1,320 (100.0%) |
Commute Time in Margate City
The most frequently occuring commute durations in Margate City are 10 to 14 minutes (483 commuters, 23.2%), 15 to 19 minutes (304 commuters, 14.6%), and 20 to 24 minutes (234 commuters, 11.2%).
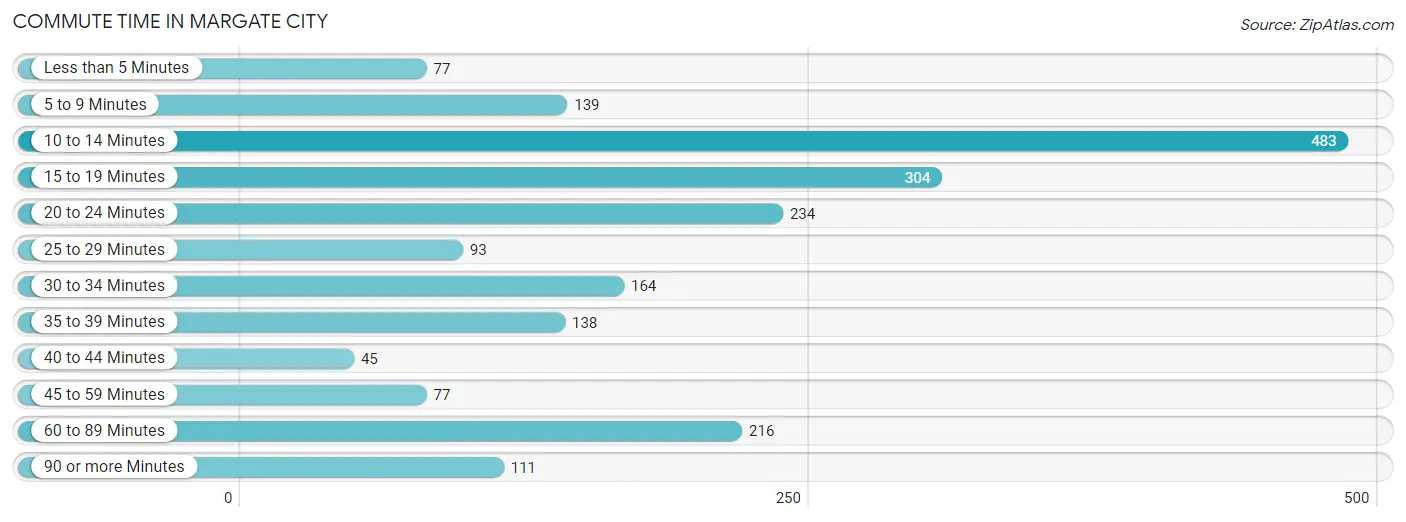
| Commute Time | # Commuters | % Commuters |
| Less than 5 Minutes | 77 | 3.7% |
| 5 to 9 Minutes | 139 | 6.7% |
| 10 to 14 Minutes | 483 | 23.2% |
| 15 to 19 Minutes | 304 | 14.6% |
| 20 to 24 Minutes | 234 | 11.2% |
| 25 to 29 Minutes | 93 | 4.5% |
| 30 to 34 Minutes | 164 | 7.9% |
| 35 to 39 Minutes | 138 | 6.6% |
| 40 to 44 Minutes | 45 | 2.2% |
| 45 to 59 Minutes | 77 | 3.7% |
| 60 to 89 Minutes | 216 | 10.4% |
| 90 or more Minutes | 111 | 5.3% |
Commute Time by Sex in Margate City
The most common commute times in Margate City are 15 to 19 minutes (170 commuters, 18.3%) for males and 10 to 14 minutes (329 commuters, 28.6%) for females.
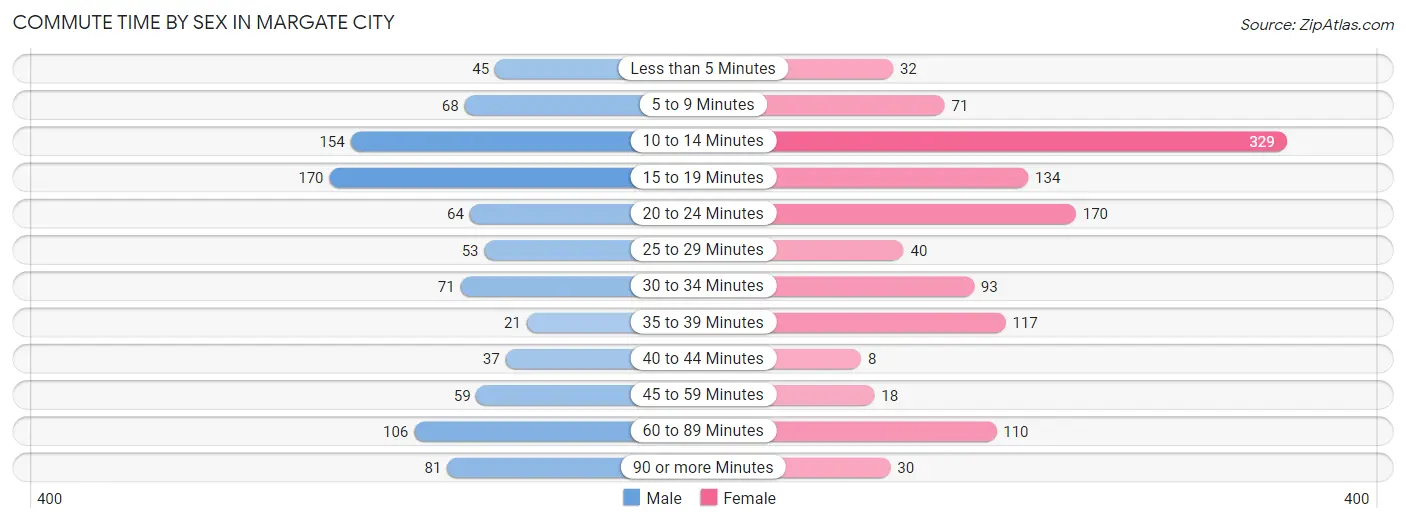
| Commute Time | Male | Female |
| Less than 5 Minutes | 45 (4.8%) | 32 (2.8%) |
| 5 to 9 Minutes | 68 (7.3%) | 71 (6.2%) |
| 10 to 14 Minutes | 154 (16.6%) | 329 (28.6%) |
| 15 to 19 Minutes | 170 (18.3%) | 134 (11.6%) |
| 20 to 24 Minutes | 64 (6.9%) | 170 (14.8%) |
| 25 to 29 Minutes | 53 (5.7%) | 40 (3.5%) |
| 30 to 34 Minutes | 71 (7.6%) | 93 (8.1%) |
| 35 to 39 Minutes | 21 (2.3%) | 117 (10.2%) |
| 40 to 44 Minutes | 37 (4.0%) | 8 (0.7%) |
| 45 to 59 Minutes | 59 (6.4%) | 18 (1.6%) |
| 60 to 89 Minutes | 106 (11.4%) | 110 (9.6%) |
| 90 or more Minutes | 81 (8.7%) | 30 (2.6%) |
Time of Departure to Work by Sex in Margate City
The most frequent times of departure to work in Margate City are 6:00 AM to 6:29 AM (180, 19.4%) for males and 7:00 AM to 7:29 AM (268, 23.3%) for females.
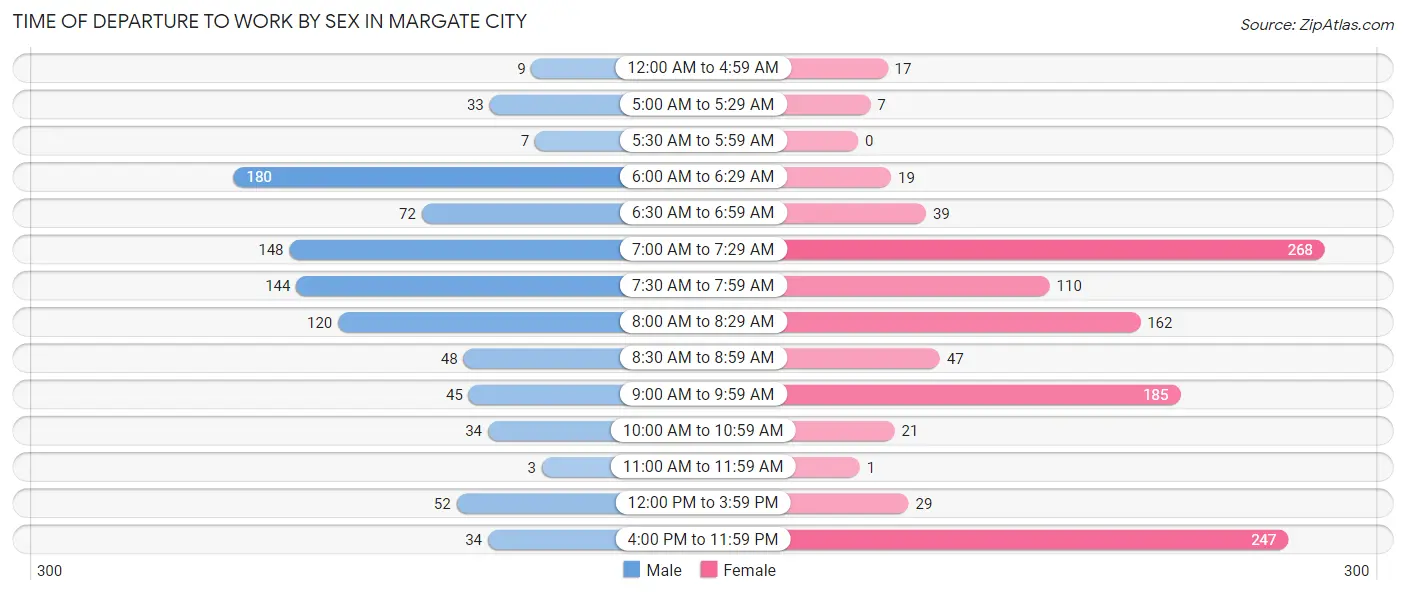
| Time of Departure | Male | Female |
| 12:00 AM to 4:59 AM | 9 (1.0%) | 17 (1.5%) |
| 5:00 AM to 5:29 AM | 33 (3.5%) | 7 (0.6%) |
| 5:30 AM to 5:59 AM | 7 (0.7%) | 0 (0.0%) |
| 6:00 AM to 6:29 AM | 180 (19.4%) | 19 (1.7%) |
| 6:30 AM to 6:59 AM | 72 (7.7%) | 39 (3.4%) |
| 7:00 AM to 7:29 AM | 148 (15.9%) | 268 (23.3%) |
| 7:30 AM to 7:59 AM | 144 (15.5%) | 110 (9.6%) |
| 8:00 AM to 8:29 AM | 120 (12.9%) | 162 (14.1%) |
| 8:30 AM to 8:59 AM | 48 (5.2%) | 47 (4.1%) |
| 9:00 AM to 9:59 AM | 45 (4.8%) | 185 (16.1%) |
| 10:00 AM to 10:59 AM | 34 (3.7%) | 21 (1.8%) |
| 11:00 AM to 11:59 AM | 3 (0.3%) | 1 (0.1%) |
| 12:00 PM to 3:59 PM | 52 (5.6%) | 29 (2.5%) |
| 4:00 PM to 11:59 PM | 34 (3.7%) | 247 (21.4%) |
| Total | 929 (100.0%) | 1,152 (100.0%) |
Housing Occupancy in Margate City
Occupancy by Ownership in Margate City
Of the total 2,584 dwellings in Margate City, owner-occupied units account for 2,319 (89.7%), while renter-occupied units make up 265 (10.3%).
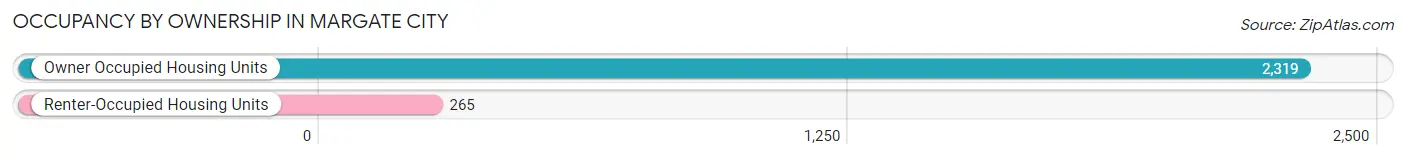
| Occupancy | # Housing Units | % Housing Units |
| Owner Occupied Housing Units | 2,319 | 89.7% |
| Renter-Occupied Housing Units | 265 | 10.3% |
| Total Occupied Housing Units | 2,584 | 100.0% |
Occupancy by Household Size in Margate City
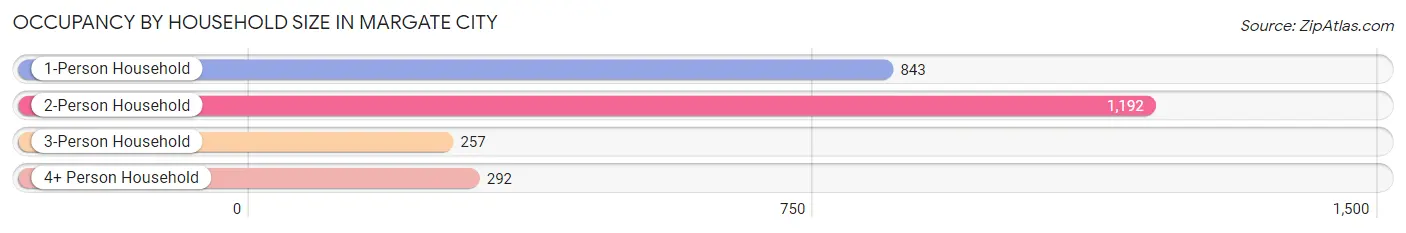
| Household Size | # Housing Units | % Housing Units |
| 1-Person Household | 843 | 32.6% |
| 2-Person Household | 1,192 | 46.1% |
| 3-Person Household | 257 | 10.0% |
| 4+ Person Household | 292 | 11.3% |
| Total Housing Units | 2,584 | 100.0% |
Occupancy by Ownership by Household Size in Margate City
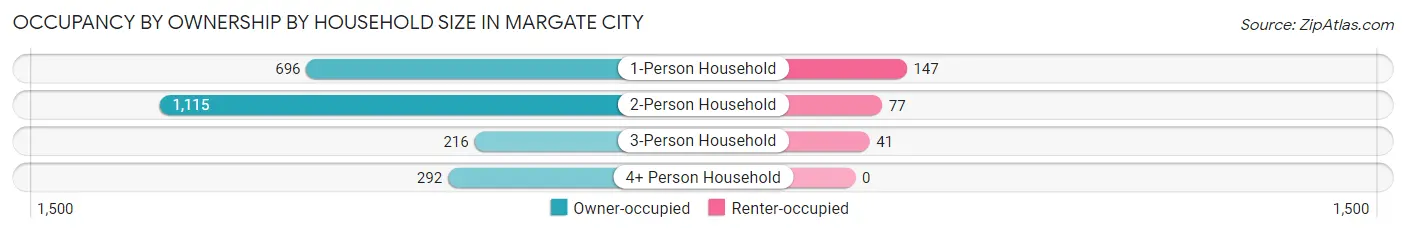
| Household Size | Owner-occupied | Renter-occupied |
| 1-Person Household | 696 (82.6%) | 147 (17.4%) |
| 2-Person Household | 1,115 (93.5%) | 77 (6.5%) |
| 3-Person Household | 216 (84.1%) | 41 (16.0%) |
| 4+ Person Household | 292 (100.0%) | 0 (0.0%) |
| Total Housing Units | 2,319 (89.7%) | 265 (10.3%) |
Occupancy by Educational Attainment in Margate City
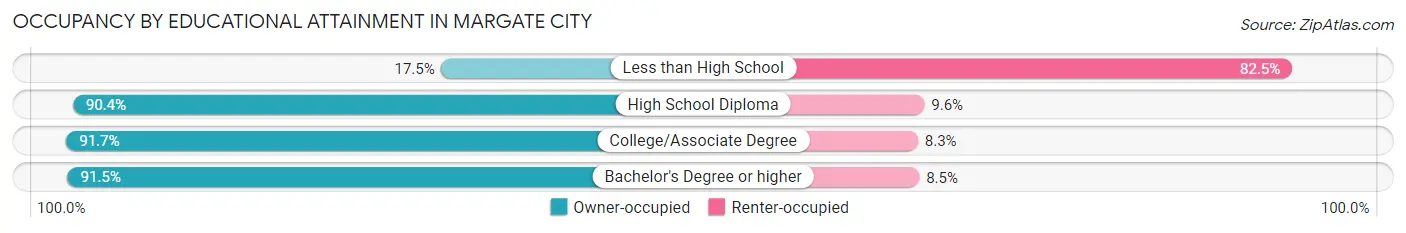
| Household Size | Owner-occupied | Renter-occupied |
| Less than High School | 10 (17.5%) | 47 (82.5%) |
| High School Diploma | 369 (90.4%) | 39 (9.6%) |
| College/Associate Degree | 588 (91.7%) | 53 (8.3%) |
| Bachelor's Degree or higher | 1,352 (91.5%) | 126 (8.5%) |
Occupancy by Age of Householder in Margate City
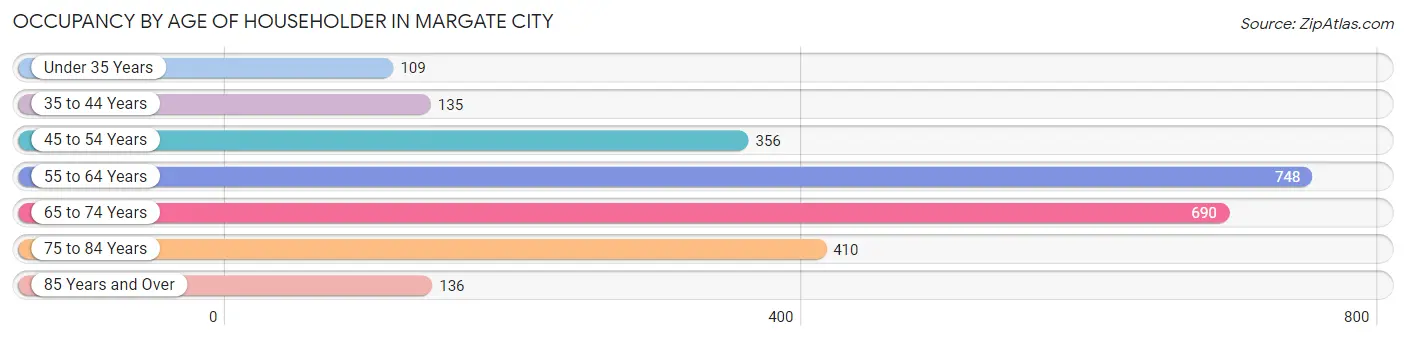
| Age Bracket | # Households | % Households |
| Under 35 Years | 109 | 4.2% |
| 35 to 44 Years | 135 | 5.2% |
| 45 to 54 Years | 356 | 13.8% |
| 55 to 64 Years | 748 | 28.9% |
| 65 to 74 Years | 690 | 26.7% |
| 75 to 84 Years | 410 | 15.9% |
| 85 Years and Over | 136 | 5.3% |
| Total | 2,584 | 100.0% |
Housing Finances in Margate City
Median Income by Occupancy in Margate City
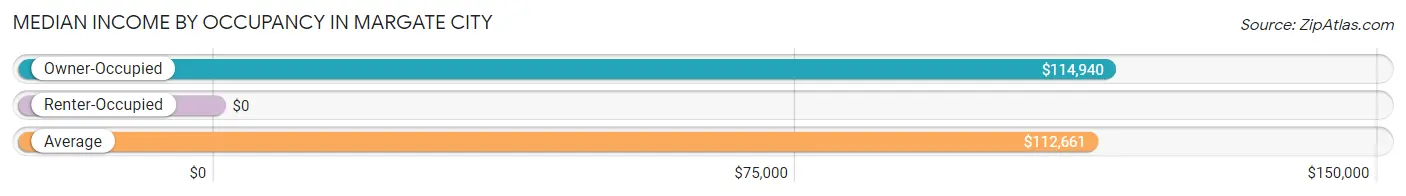
| Occupancy Type | # Households | Median Income |
| Owner-Occupied | 2,319 (89.7%) | $114,940 |
| Renter-Occupied | 265 (10.3%) | $0 |
| Average | 2,584 (100.0%) | $112,661 |
Occupancy by Householder Income Bracket in Margate City
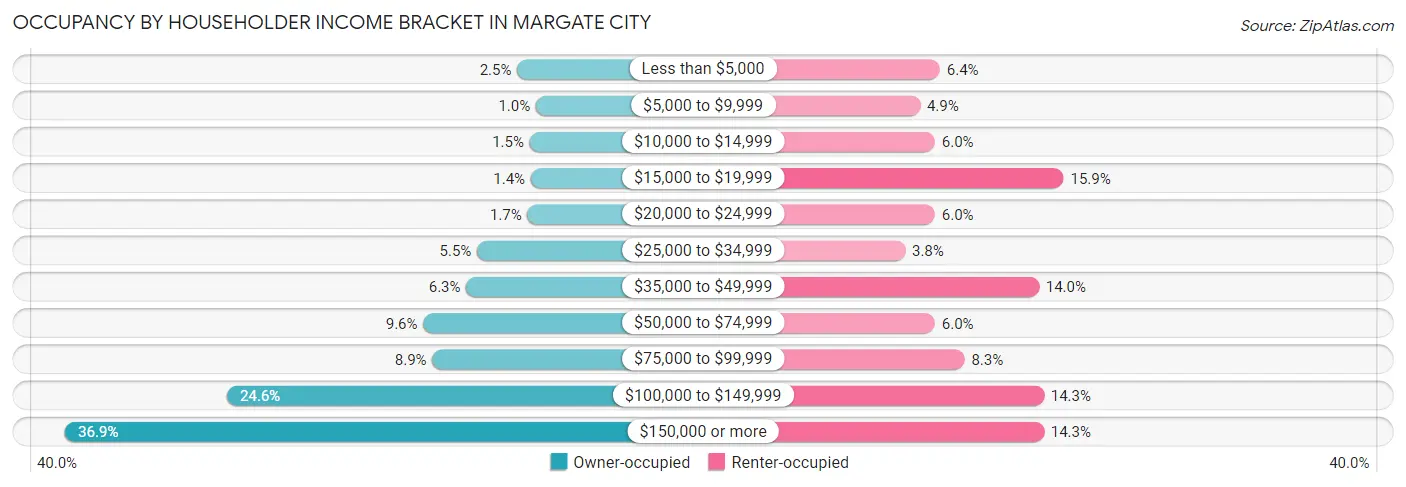
| Income Bracket | Owner-occupied | Renter-occupied |
| Less than $5,000 | 57 (2.5%) | 17 (6.4%) |
| $5,000 to $9,999 | 24 (1.0%) | 13 (4.9%) |
| $10,000 to $14,999 | 35 (1.5%) | 16 (6.0%) |
| $15,000 to $19,999 | 33 (1.4%) | 42 (15.9%) |
| $20,000 to $24,999 | 39 (1.7%) | 16 (6.0%) |
| $25,000 to $34,999 | 128 (5.5%) | 10 (3.8%) |
| $35,000 to $49,999 | 147 (6.3%) | 37 (14.0%) |
| $50,000 to $74,999 | 223 (9.6%) | 16 (6.0%) |
| $75,000 to $99,999 | 207 (8.9%) | 22 (8.3%) |
| $100,000 to $149,999 | 570 (24.6%) | 38 (14.3%) |
| $150,000 or more | 856 (36.9%) | 38 (14.3%) |
| Total | 2,319 (100.0%) | 265 (100.0%) |
Monthly Housing Cost Tiers in Margate City
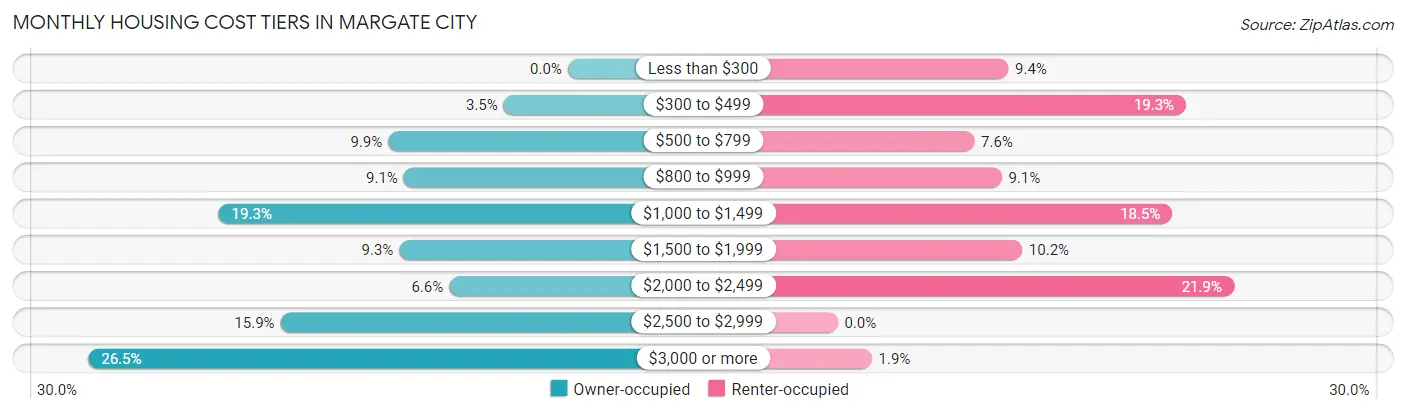
| Monthly Cost | Owner-occupied | Renter-occupied |
| Less than $300 | 0 (0.0%) | 25 (9.4%) |
| $300 to $499 | 82 (3.5%) | 51 (19.3%) |
| $500 to $799 | 230 (9.9%) | 20 (7.5%) |
| $800 to $999 | 210 (9.1%) | 24 (9.1%) |
| $1,000 to $1,499 | 447 (19.3%) | 49 (18.5%) |
| $1,500 to $1,999 | 216 (9.3%) | 27 (10.2%) |
| $2,000 to $2,499 | 152 (6.6%) | 58 (21.9%) |
| $2,500 to $2,999 | 368 (15.9%) | 0 (0.0%) |
| $3,000 or more | 614 (26.5%) | 5 (1.9%) |
| Total | 2,319 (100.0%) | 265 (100.0%) |
Physical Housing Characteristics in Margate City
Housing Structures in Margate City
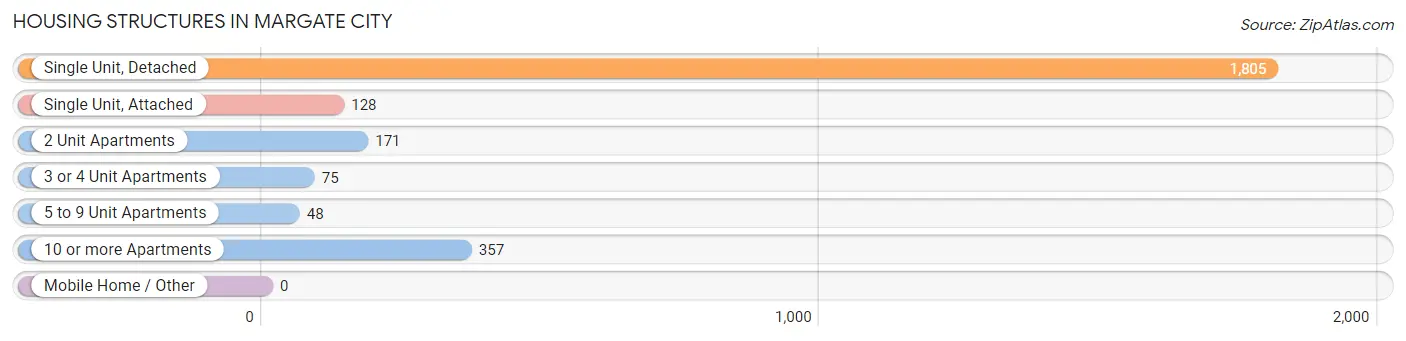
| Structure Type | # Housing Units | % Housing Units |
| Single Unit, Detached | 1,805 | 69.9% |
| Single Unit, Attached | 128 | 5.0% |
| 2 Unit Apartments | 171 | 6.6% |
| 3 or 4 Unit Apartments | 75 | 2.9% |
| 5 to 9 Unit Apartments | 48 | 1.9% |
| 10 or more Apartments | 357 | 13.8% |
| Mobile Home / Other | 0 | 0.0% |
| Total | 2,584 | 100.0% |
Housing Structures by Occupancy in Margate City
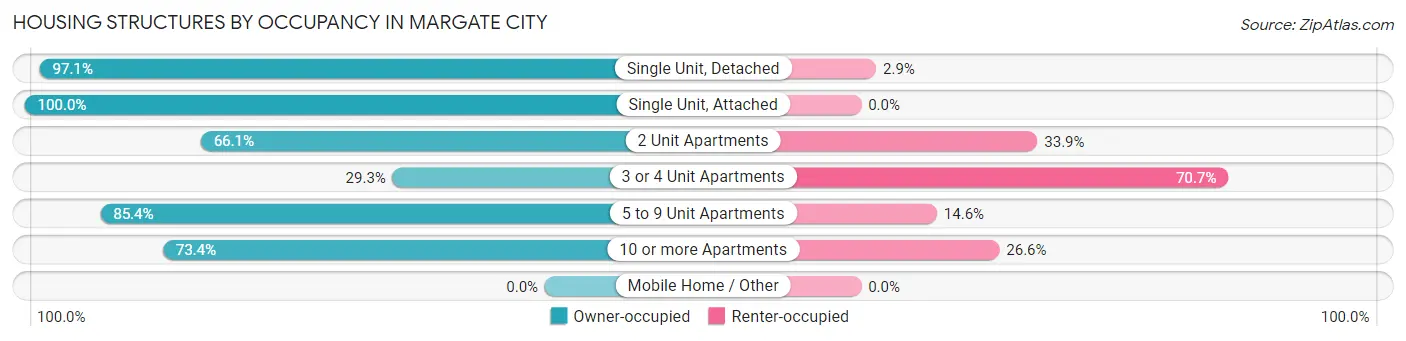
| Structure Type | Owner-occupied | Renter-occupied |
| Single Unit, Detached | 1,753 (97.1%) | 52 (2.9%) |
| Single Unit, Attached | 128 (100.0%) | 0 (0.0%) |
| 2 Unit Apartments | 113 (66.1%) | 58 (33.9%) |
| 3 or 4 Unit Apartments | 22 (29.3%) | 53 (70.7%) |
| 5 to 9 Unit Apartments | 41 (85.4%) | 7 (14.6%) |
| 10 or more Apartments | 262 (73.4%) | 95 (26.6%) |
| Mobile Home / Other | 0 (0.0%) | 0 (0.0%) |
| Total | 2,319 (89.7%) | 265 (10.3%) |
Housing Structures by Number of Rooms in Margate City
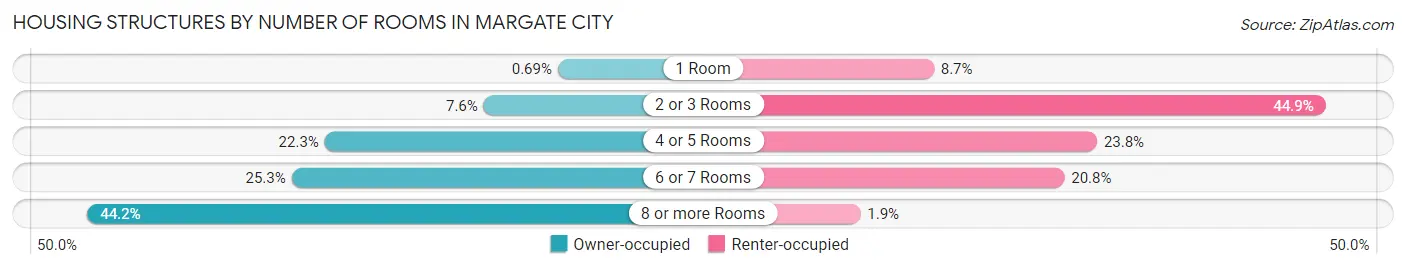
| Number of Rooms | Owner-occupied | Renter-occupied |
| 1 Room | 16 (0.7%) | 23 (8.7%) |
| 2 or 3 Rooms | 175 (7.5%) | 119 (44.9%) |
| 4 or 5 Rooms | 516 (22.3%) | 63 (23.8%) |
| 6 or 7 Rooms | 587 (25.3%) | 55 (20.7%) |
| 8 or more Rooms | 1,025 (44.2%) | 5 (1.9%) |
| Total | 2,319 (100.0%) | 265 (100.0%) |
Housing Structure by Heating Type in Margate City
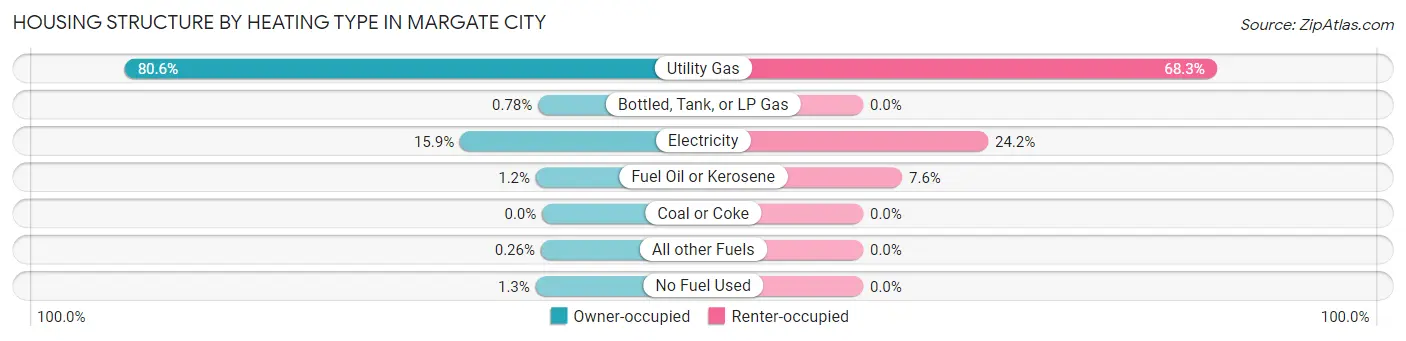
| Heating Type | Owner-occupied | Renter-occupied |
| Utility Gas | 1,870 (80.6%) | 181 (68.3%) |
| Bottled, Tank, or LP Gas | 18 (0.8%) | 0 (0.0%) |
| Electricity | 368 (15.9%) | 64 (24.1%) |
| Fuel Oil or Kerosene | 28 (1.2%) | 20 (7.5%) |
| Coal or Coke | 0 (0.0%) | 0 (0.0%) |
| All other Fuels | 6 (0.3%) | 0 (0.0%) |
| No Fuel Used | 29 (1.3%) | 0 (0.0%) |
| Total | 2,319 (100.0%) | 265 (100.0%) |
Household Vehicle Usage in Margate City
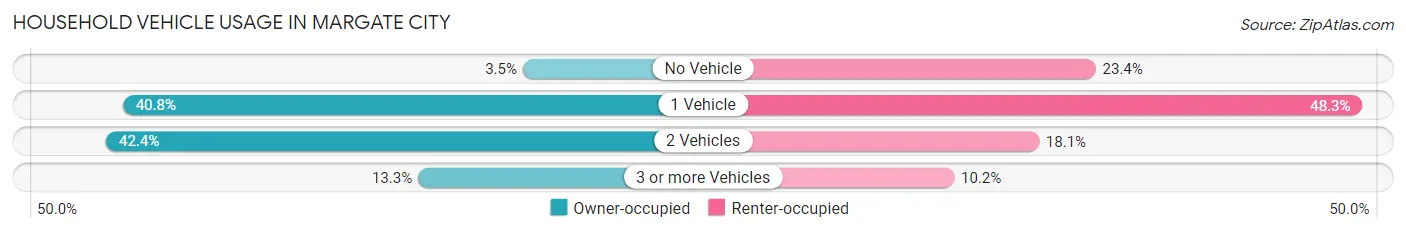
| Vehicles per Household | Owner-occupied | Renter-occupied |
| No Vehicle | 81 (3.5%) | 62 (23.4%) |
| 1 Vehicle | 947 (40.8%) | 128 (48.3%) |
| 2 Vehicles | 983 (42.4%) | 48 (18.1%) |
| 3 or more Vehicles | 308 (13.3%) | 27 (10.2%) |
| Total | 2,319 (100.0%) | 265 (100.0%) |
Real Estate & Mortgages in Margate City
Real Estate and Mortgage Overview in Margate City
| Characteristic | Without Mortgage | With Mortgage |
| Housing Units | 1,153 | 1,166 |
| Median Property Value | $491,700 | $649,300 |
| Median Household Income | $94,583 | $601 |
| Monthly Housing Costs | $1,096 | $569 |
| Real Estate Taxes | $6,584 | $27 |
Property Value by Mortgage Status in Margate City
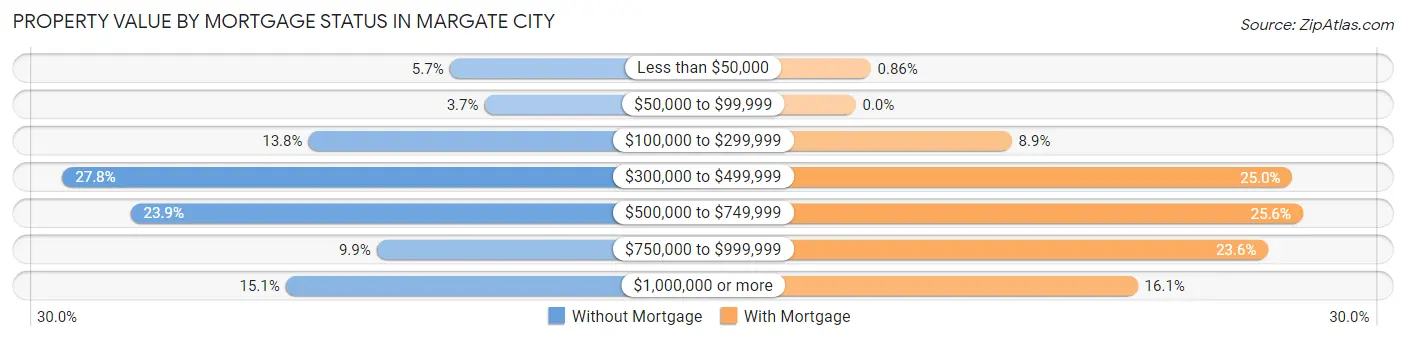
| Property Value | Without Mortgage | With Mortgage |
| Less than $50,000 | 66 (5.7%) | 10 (0.9%) |
| $50,000 to $99,999 | 43 (3.7%) | 0 (0.0%) |
| $100,000 to $299,999 | 159 (13.8%) | 104 (8.9%) |
| $300,000 to $499,999 | 321 (27.8%) | 291 (25.0%) |
| $500,000 to $749,999 | 276 (23.9%) | 298 (25.6%) |
| $750,000 to $999,999 | 114 (9.9%) | 275 (23.6%) |
| $1,000,000 or more | 174 (15.1%) | 188 (16.1%) |
| Total | 1,153 (100.0%) | 1,166 (100.0%) |
Household Income by Mortgage Status in Margate City
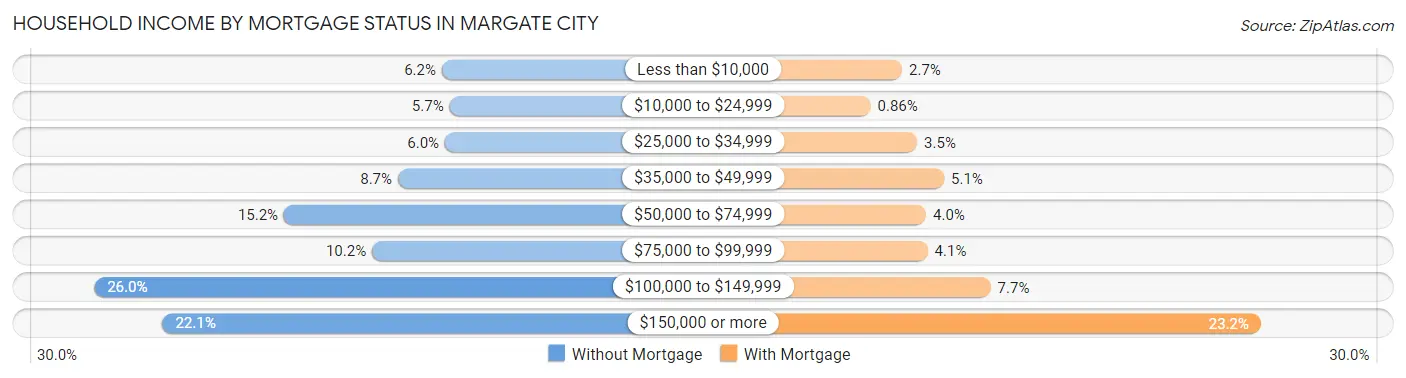
| Household Income | Without Mortgage | With Mortgage |
| Less than $10,000 | 71 (6.2%) | 31 (2.7%) |
| $10,000 to $24,999 | 66 (5.7%) | 10 (0.9%) |
| $25,000 to $34,999 | 69 (6.0%) | 41 (3.5%) |
| $35,000 to $49,999 | 100 (8.7%) | 59 (5.1%) |
| $50,000 to $74,999 | 175 (15.2%) | 47 (4.0%) |
| $75,000 to $99,999 | 117 (10.2%) | 48 (4.1%) |
| $100,000 to $149,999 | 300 (26.0%) | 90 (7.7%) |
| $150,000 or more | 255 (22.1%) | 270 (23.2%) |
| Total | 1,153 (100.0%) | 1,166 (100.0%) |
Property Value to Household Income Ratio in Margate City
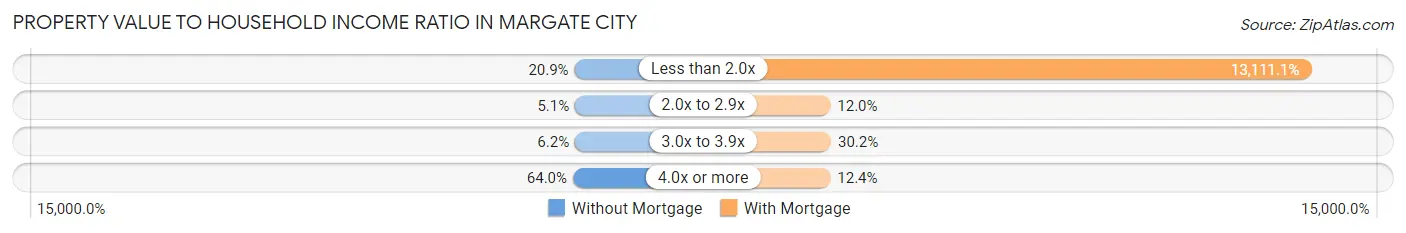
| Value-to-Income Ratio | Without Mortgage | With Mortgage |
| Less than 2.0x | 241 (20.9%) | 152,875 (13,111.1%) |
| 2.0x to 2.9x | 59 (5.1%) | 140 (12.0%) |
| 3.0x to 3.9x | 72 (6.2%) | 352 (30.2%) |
| 4.0x or more | 738 (64.0%) | 145 (12.4%) |
| Total | 1,153 (100.0%) | 1,166 (100.0%) |
Real Estate Taxes by Mortgage Status in Margate City
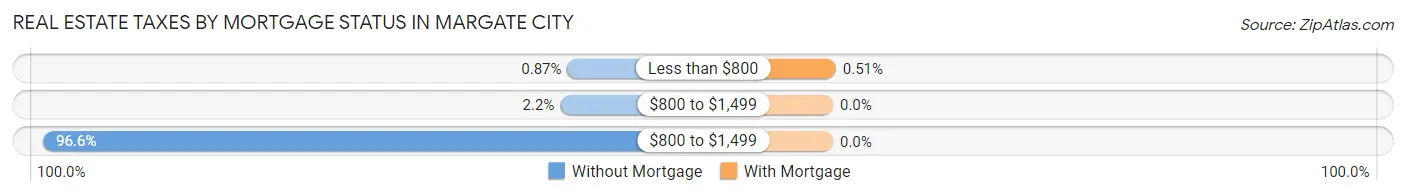
| Property Taxes | Without Mortgage | With Mortgage |
| Less than $800 | 10 (0.9%) | 6 (0.5%) |
| $800 to $1,499 | 25 (2.2%) | 0 (0.0%) |
| $800 to $1,499 | 1,114 (96.6%) | 0 (0.0%) |
| Total | 1,153 (100.0%) | 1,166 (100.0%) |
Health & Disability in Margate City
Health Insurance Coverage by Age in Margate City
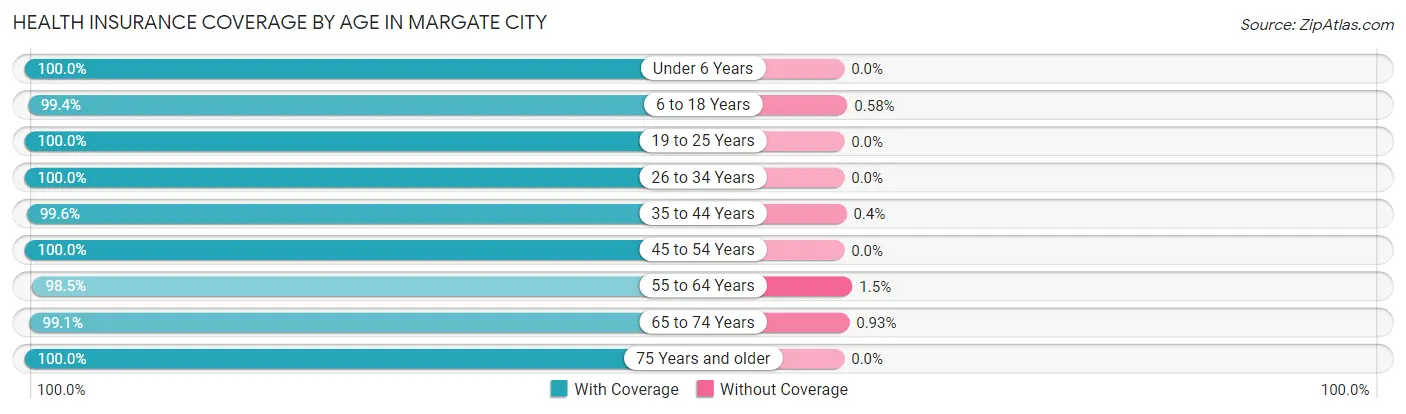
| Age Bracket | With Coverage | Without Coverage |
| Under 6 Years | 112 (100.0%) | 0 (0.0%) |
| 6 to 18 Years | 687 (99.4%) | 4 (0.6%) |
| 19 to 25 Years | 397 (100.0%) | 0 (0.0%) |
| 26 to 34 Years | 140 (100.0%) | 0 (0.0%) |
| 35 to 44 Years | 249 (99.6%) | 1 (0.4%) |
| 45 to 54 Years | 745 (100.0%) | 0 (0.0%) |
| 55 to 64 Years | 1,043 (98.5%) | 16 (1.5%) |
| 65 to 74 Years | 1,066 (99.1%) | 10 (0.9%) |
| 75 Years and older | 848 (100.0%) | 0 (0.0%) |
| Total | 5,287 (99.4%) | 31 (0.6%) |
Health Insurance Coverage by Citizenship Status in Margate City
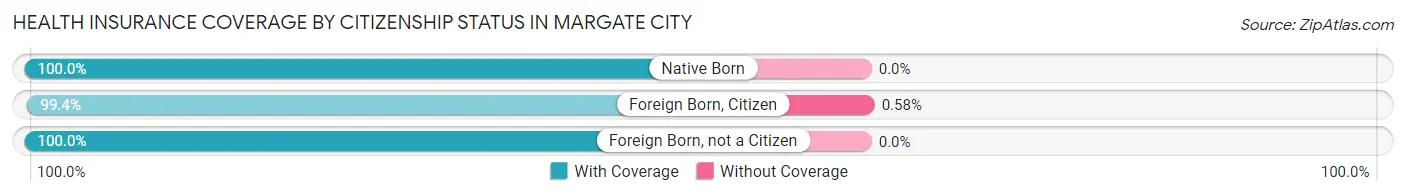
| Citizenship Status | With Coverage | Without Coverage |
| Native Born | 112 (100.0%) | 0 (0.0%) |
| Foreign Born, Citizen | 687 (99.4%) | 4 (0.6%) |
| Foreign Born, not a Citizen | 397 (100.0%) | 0 (0.0%) |
Health Insurance Coverage by Household Income in Margate City
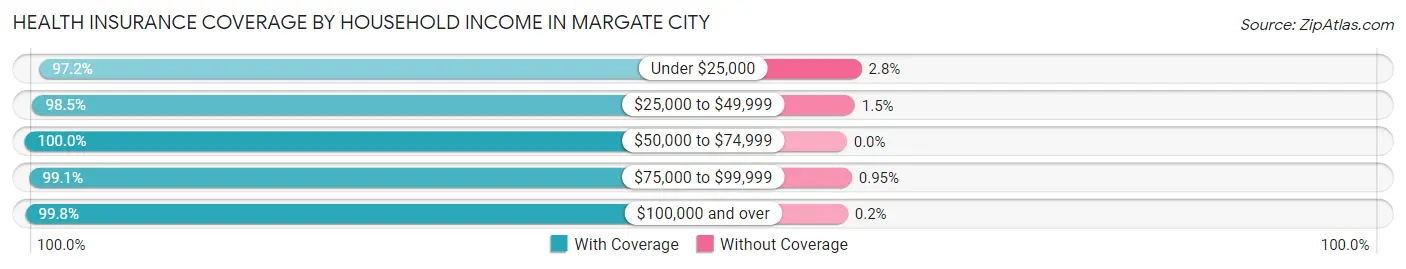
| Household Income | With Coverage | Without Coverage |
| Under $25,000 | 350 (97.2%) | 10 (2.8%) |
| $25,000 to $49,999 | 458 (98.5%) | 7 (1.5%) |
| $50,000 to $74,999 | 433 (100.0%) | 0 (0.0%) |
| $75,000 to $99,999 | 520 (99.1%) | 5 (0.9%) |
| $100,000 and over | 3,523 (99.8%) | 7 (0.2%) |
Public vs Private Health Insurance Coverage by Age in Margate City
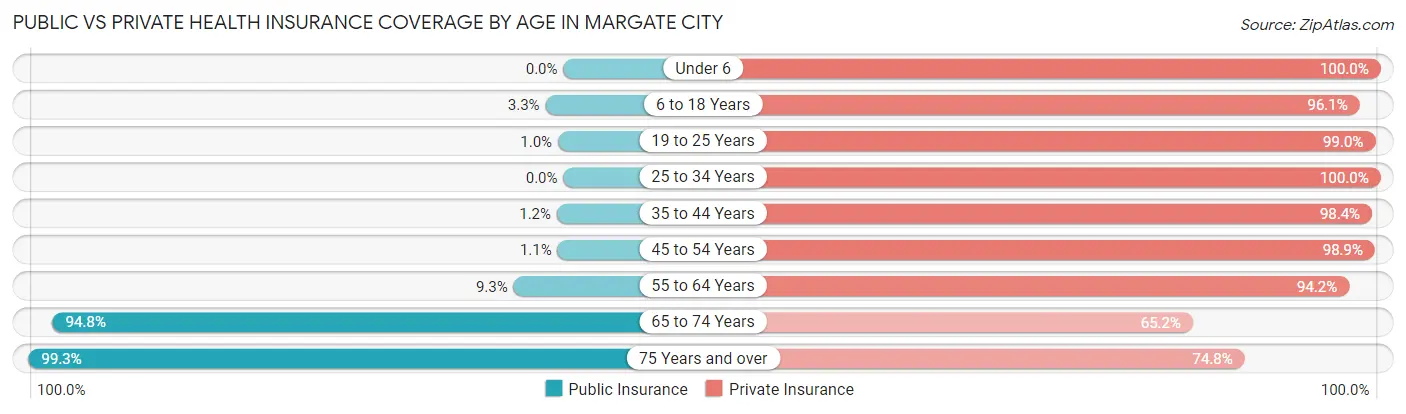
| Age Bracket | Public Insurance | Private Insurance |
| Under 6 | 0 (0.0%) | 112 (100.0%) |
| 6 to 18 Years | 23 (3.3%) | 664 (96.1%) |
| 19 to 25 Years | 4 (1.0%) | 393 (99.0%) |
| 25 to 34 Years | 0 (0.0%) | 140 (100.0%) |
| 35 to 44 Years | 3 (1.2%) | 246 (98.4%) |
| 45 to 54 Years | 8 (1.1%) | 737 (98.9%) |
| 55 to 64 Years | 98 (9.2%) | 997 (94.2%) |
| 65 to 74 Years | 1,020 (94.8%) | 701 (65.1%) |
| 75 Years and over | 842 (99.3%) | 634 (74.8%) |
| Total | 1,998 (37.6%) | 4,624 (87.0%) |
Disability Status by Sex by Age in Margate City
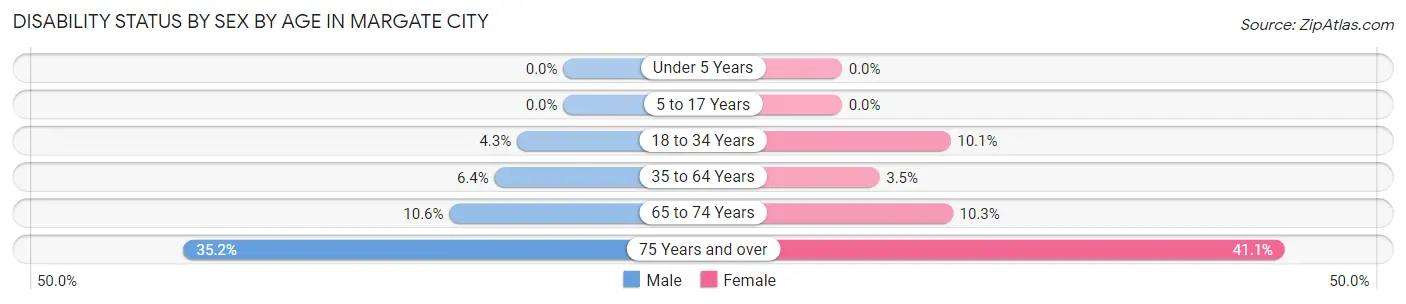
| Age Bracket | Male | Female |
| Under 5 Years | 0 (0.0%) | 0 (0.0%) |
| 5 to 17 Years | 0 (0.0%) | 0 (0.0%) |
| 18 to 34 Years | 12 (4.3%) | 28 (10.1%) |
| 35 to 64 Years | 54 (6.4%) | 42 (3.5%) |
| 65 to 74 Years | 49 (10.6%) | 63 (10.3%) |
| 75 Years and over | 160 (35.2%) | 162 (41.1%) |
Disability Class by Sex by Age in Margate City
Disability Class: Hearing Difficulty
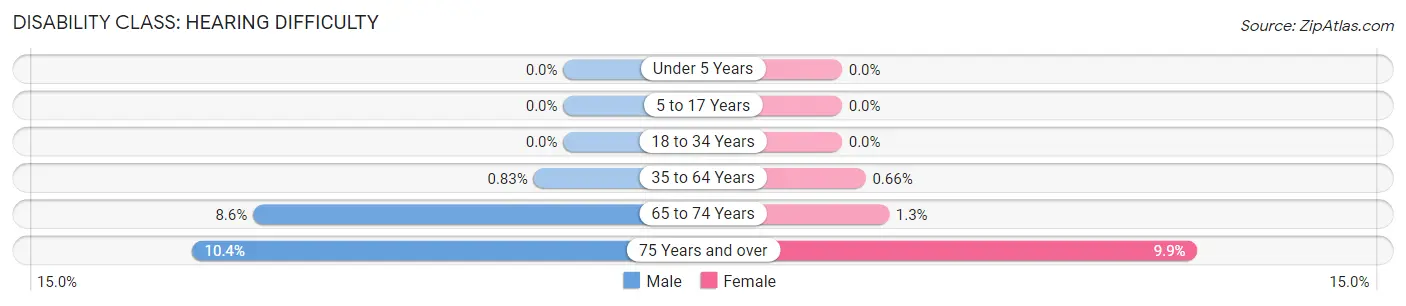
| Age Bracket | Male | Female |
| Under 5 Years | 0 (0.0%) | 0 (0.0%) |
| 5 to 17 Years | 0 (0.0%) | 0 (0.0%) |
| 18 to 34 Years | 0 (0.0%) | 0 (0.0%) |
| 35 to 64 Years | 7 (0.8%) | 8 (0.7%) |
| 65 to 74 Years | 40 (8.6%) | 8 (1.3%) |
| 75 Years and over | 47 (10.3%) | 39 (9.9%) |
Disability Class: Vision Difficulty
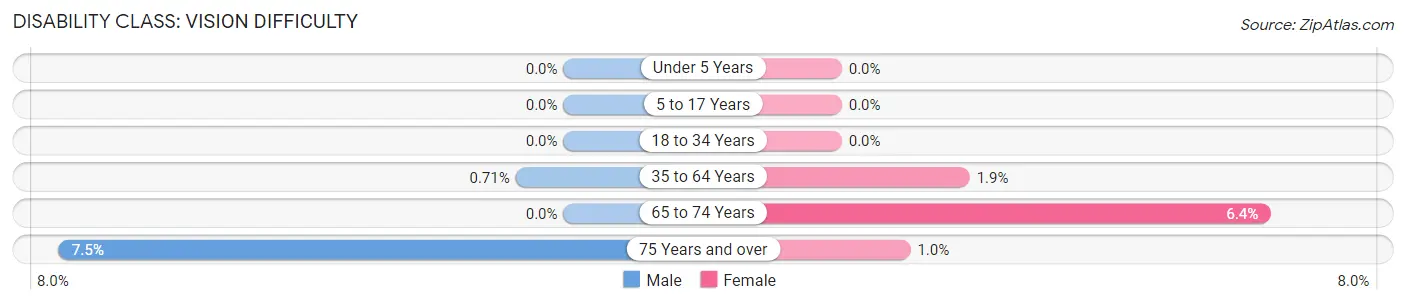
| Age Bracket | Male | Female |
| Under 5 Years | 0 (0.0%) | 0 (0.0%) |
| 5 to 17 Years | 0 (0.0%) | 0 (0.0%) |
| 18 to 34 Years | 0 (0.0%) | 0 (0.0%) |
| 35 to 64 Years | 6 (0.7%) | 23 (1.9%) |
| 65 to 74 Years | 0 (0.0%) | 39 (6.4%) |
| 75 Years and over | 34 (7.5%) | 4 (1.0%) |
Disability Class: Cognitive Difficulty
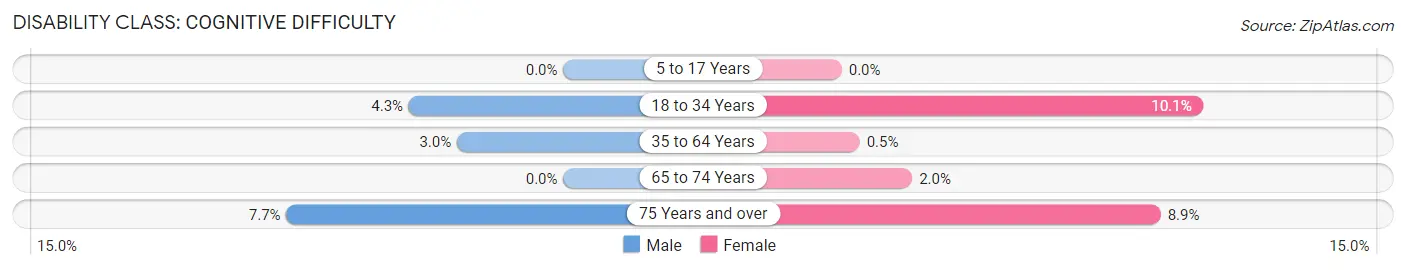
| Age Bracket | Male | Female |
| 5 to 17 Years | 0 (0.0%) | 0 (0.0%) |
| 18 to 34 Years | 12 (4.3%) | 28 (10.1%) |
| 35 to 64 Years | 25 (3.0%) | 6 (0.5%) |
| 65 to 74 Years | 0 (0.0%) | 12 (2.0%) |
| 75 Years and over | 35 (7.7%) | 35 (8.9%) |
Disability Class: Ambulatory Difficulty
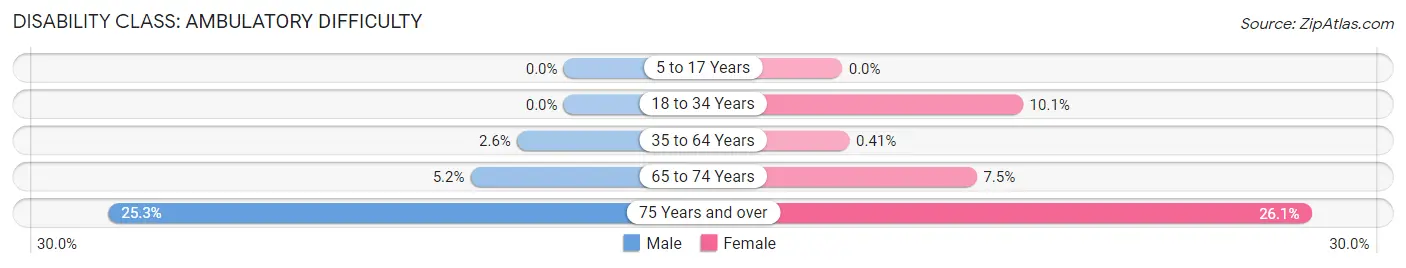
| Age Bracket | Male | Female |
| 5 to 17 Years | 0 (0.0%) | 0 (0.0%) |
| 18 to 34 Years | 0 (0.0%) | 28 (10.1%) |
| 35 to 64 Years | 22 (2.6%) | 5 (0.4%) |
| 65 to 74 Years | 24 (5.2%) | 46 (7.5%) |
| 75 Years and over | 115 (25.3%) | 103 (26.1%) |
Disability Class: Self-Care Difficulty
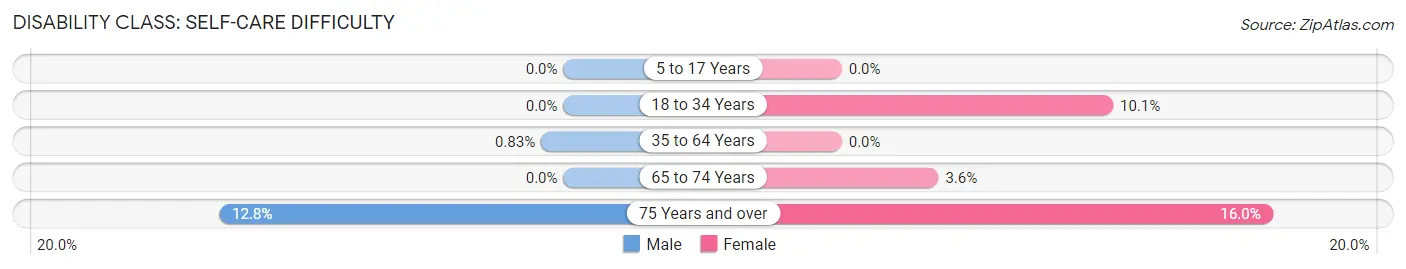
| Age Bracket | Male | Female |
| 5 to 17 Years | 0 (0.0%) | 0 (0.0%) |
| 18 to 34 Years | 0 (0.0%) | 28 (10.1%) |
| 35 to 64 Years | 7 (0.8%) | 0 (0.0%) |
| 65 to 74 Years | 0 (0.0%) | 22 (3.6%) |
| 75 Years and over | 58 (12.8%) | 63 (16.0%) |
Technology Access in Margate City
Computing Device Access in Margate City
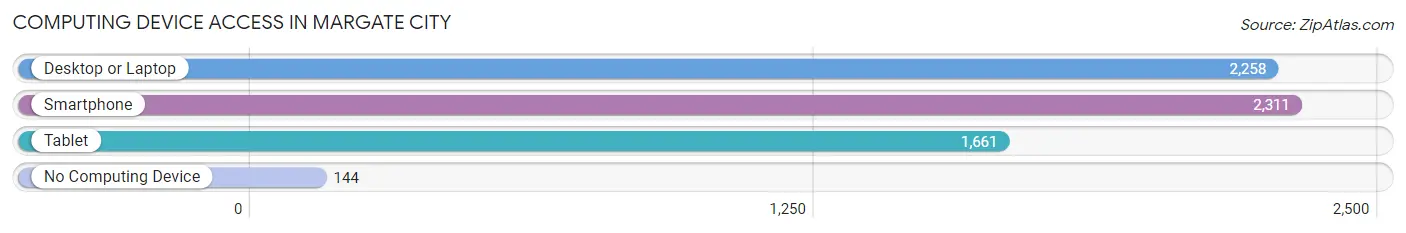
| Device Type | # Households | % Households |
| Desktop or Laptop | 2,258 | 87.4% |
| Smartphone | 2,311 | 89.4% |
| Tablet | 1,661 | 64.3% |
| No Computing Device | 144 | 5.6% |
| Total | 2,584 | 100.0% |
Internet Access in Margate City
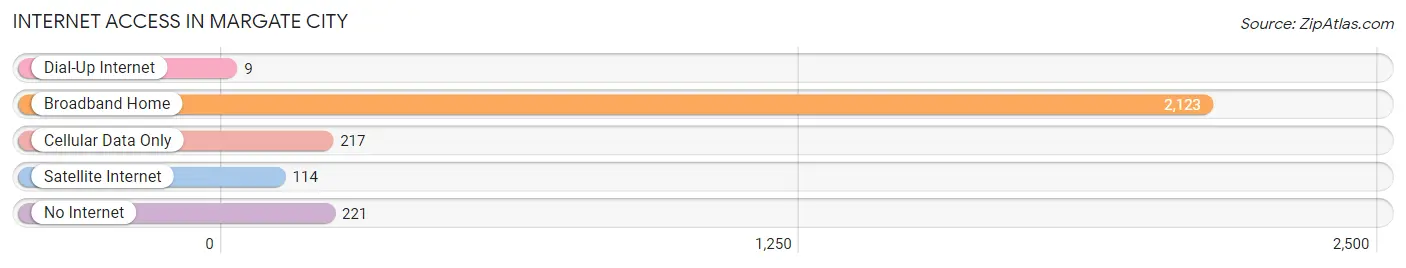
| Internet Type | # Households | % Households |
| Dial-Up Internet | 9 | 0.4% |
| Broadband Home | 2,123 | 82.2% |
| Cellular Data Only | 217 | 8.4% |
| Satellite Internet | 114 | 4.4% |
| No Internet | 221 | 8.6% |
| Total | 2,584 | 100.0% |
Margate City Summary
Introduction
Margate City is a small city located in Atlantic County, New Jersey. It is situated on Absecon Island, which is bordered by the Atlantic Ocean to the east and the Great Egg Harbor Bay to the west. The city is known for its beaches, boardwalk, and amusement parks. It is also home to a variety of restaurants, shops, and other attractions.
History
The area that is now Margate City was first settled by the Lenni Lenape Native Americans in the 1600s. The first European settlers arrived in the area in the 1700s. The area was originally known as South Atlantic City, and was part of Egg Harbor Township. In 1885, the area was incorporated as a borough and renamed Margate City.
The city was a popular summer destination for many years, and was known for its beaches and boardwalk. In the early 1900s, the city was home to several amusement parks, including Steeplechase Park and Dreamland. The city was also home to a variety of restaurants, shops, and other attractions.
Geography
Margate City is located in Atlantic County, New Jersey. It is situated on Absecon Island, which is bordered by the Atlantic Ocean to the east and the Great Egg Harbor Bay to the west. The city is located approximately 10 miles south of Atlantic City and approximately 50 miles southeast of Philadelphia.
The city has a total area of 1.7 square miles, all of which is land. The city is located at an elevation of 10 feet above sea level.
Economy
The economy of Margate City is largely based on tourism. The city is home to a variety of restaurants, shops, and other attractions. The city is also home to several hotels and motels, which cater to tourists.
The city is also home to a variety of businesses, including retail stores, professional services, and manufacturing. The city is home to several marinas, which provide services to boaters.
Demographics
As of the 2010 census, the population of Margate City was 6,354. The racial makeup of the city was 92.3% White, 3.2% African American, 0.3% Native American, 1.2% Asian, 0.1% Pacific Islander, and 2.9% from other races. Hispanic or Latino of any race were 5.3% of the population.
The median household income in the city was $50,945, and the median family income was $60,917. The per capita income in the city was $27,945. About 5.3% of families and 7.2% of the population were below the poverty line.
Conclusion
Margate City is a small city located in Atlantic County, New Jersey. It is situated on Absecon Island, which is bordered by the Atlantic Ocean to the east and the Great Egg Harbor Bay to the west. The city is known for its beaches, boardwalk, and amusement parks. It is also home to a variety of restaurants, shops, and other attractions. The economy of Margate City is largely based on tourism, and the city is home to a variety of businesses. As of the 2010 census, the population of Margate City was 6,354. The median household income in the city was $50,945, and the median family income was $60,917.
Common Questions
What is Per Capita Income in Margate City?
Per Capita income in Margate City is $79,711.
What is the Median Family Income in Margate City?
Median Family Income in Margate City is $140,729.
What is the Median Household income in Margate City?
Median Household Income in Margate City is $112,661.
What is Income or Wage Gap in Margate City?
Income or Wage Gap in Margate City is 23.2%.
Women in Margate City earn 76.8 cents for every dollar earned by a man.
What is Inequality or Gini Index in Margate City?
Inequality or Gini Index in Margate City is 0.52.
What is the Total Population of Margate City?
Total Population of Margate City is 5,331.
What is the Total Male Population of Margate City?
Total Male Population of Margate City is 2,441.
What is the Total Female Population of Margate City?
Total Female Population of Margate City is 2,890.
What is the Ratio of Males per 100 Females in Margate City?
There are 84.46 Males per 100 Females in Margate City.
What is the Ratio of Females per 100 Males in Margate City?
There are 118.39 Females per 100 Males in Margate City.
What is the Median Population Age in Margate City?
Median Population Age in Margate City is 57.9 Years.
What is the Average Family Size in Margate City
Average Family Size in Margate City is 2.6 People.
What is the Average Household Size in Margate City
Average Household Size in Margate City is 2.1 People.
How Large is the Labor Force in Margate City?
There are 2,590 People in the Labor Forcein in Margate City.
What is the Percentage of People in the Labor Force in Margate City?
55.8% of People are in the Labor Force in Margate City.
What is the Unemployment Rate in Margate City?
Unemployment Rate in Margate City is 4.0%.