Juliustown, NJ Map & Demographics
Juliustown Map
Juliustown Overview
$60,400
PER CAPITA INCOME
$151,250
AVG FAMILY INCOME
0.39
INEQUALITY / GINI INDEX
67
TOTAL POPULATION
29
MALE POPULATION
38
FEMALE POPULATION
76.32
MALES / 100 FEMALES
131.03
FEMALES / 100 MALES
70.7
MEDIAN AGE
2.2
AVG FAMILY SIZE
1.7
AVG HOUSEHOLD SIZE
31
LABOR FORCE [ PEOPLE ]
49.2%
PERCENT IN LABOR FORCE
Juliustown Zip Codes
Income in Juliustown
Income Overview in Juliustown
| Characteristic | Number | Measure |
| Per Capita Income | 67 | $60,400 |
| Median Family Income | 24 | $151,250 |
| Mean Family Income | 24 | $146,983 |
| Median Household Income | 39 | $0 |
| Mean Household Income | 39 | $102,905 |
| Income Deficit | 24 | $0 |
| Wage / Income Gap (%) | 67 | 0.00% |
| Wage / Income Gap ($) | 67 | 100.00¢ per $1 |
| Gini / Inequality Index | 67 | 0.39 |
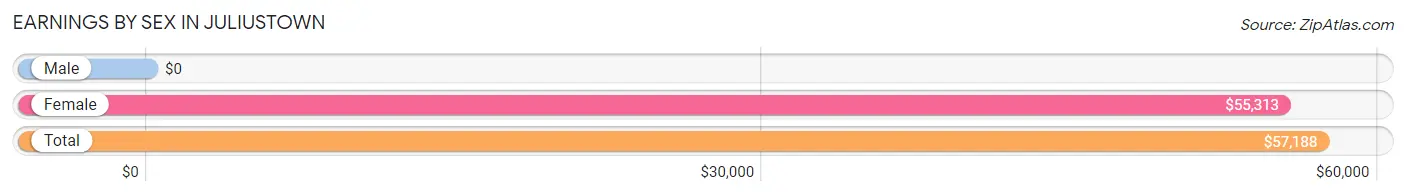
Earnings by Sex in Juliustown
| Sex | Number | Average Earnings |
| Male | 14 (45.2%) | $0 |
| Female | 17 (54.8%) | $55,313 |
| Total | 31 (100.0%) | $57,188 |
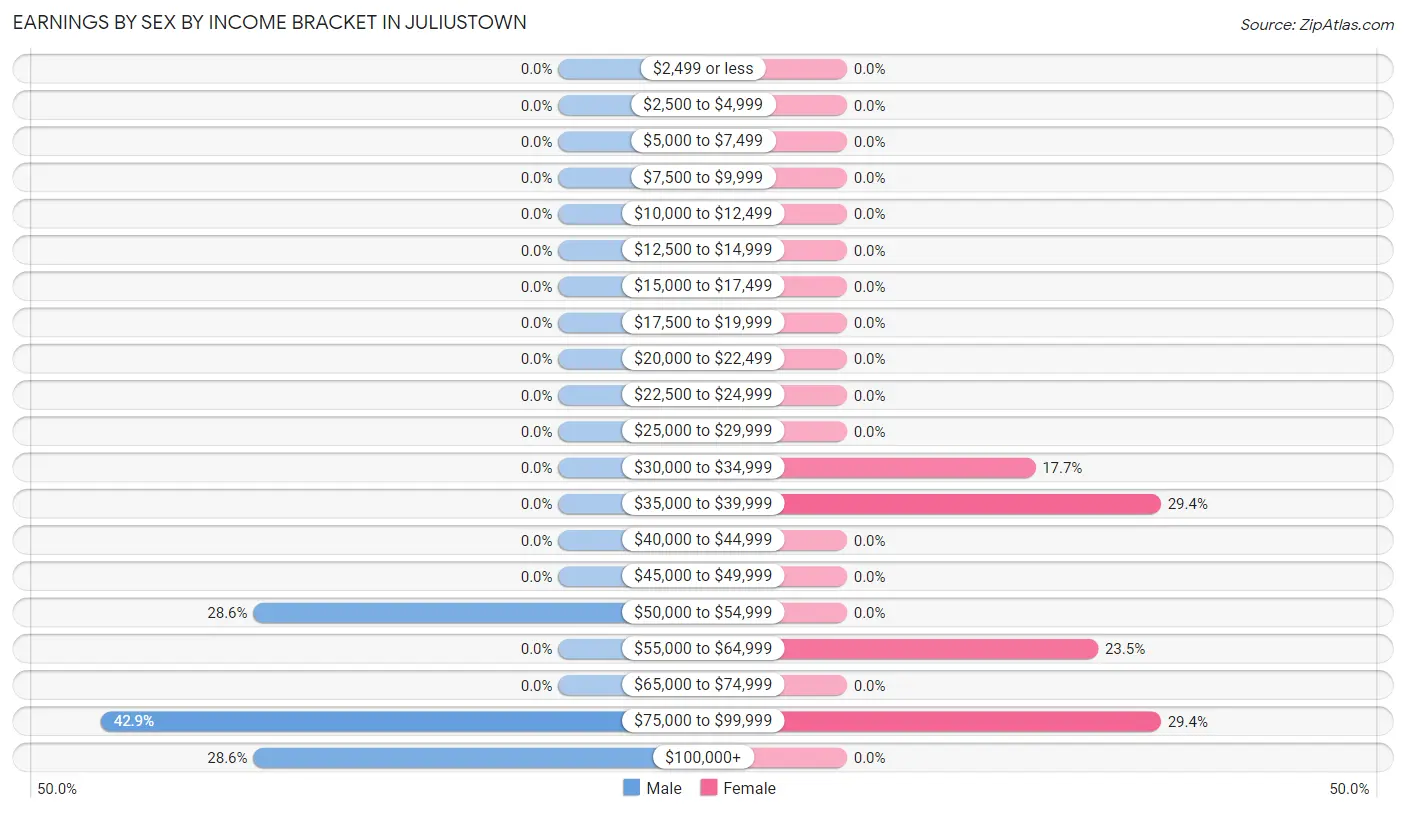
Earnings by Sex by Income Bracket in Juliustown
The most common earnings brackets in Juliustown are $75,000 to $99,999 for men (6 | 42.9%) and $35,000 to $39,999 for women (5 | 29.4%).
| Income | Male | Female |
| $2,499 or less | 0 (0.0%) | 0 (0.0%) |
| $2,500 to $4,999 | 0 (0.0%) | 0 (0.0%) |
| $5,000 to $7,499 | 0 (0.0%) | 0 (0.0%) |
| $7,500 to $9,999 | 0 (0.0%) | 0 (0.0%) |
| $10,000 to $12,499 | 0 (0.0%) | 0 (0.0%) |
| $12,500 to $14,999 | 0 (0.0%) | 0 (0.0%) |
| $15,000 to $17,499 | 0 (0.0%) | 0 (0.0%) |
| $17,500 to $19,999 | 0 (0.0%) | 0 (0.0%) |
| $20,000 to $22,499 | 0 (0.0%) | 0 (0.0%) |
| $22,500 to $24,999 | 0 (0.0%) | 0 (0.0%) |
| $25,000 to $29,999 | 0 (0.0%) | 0 (0.0%) |
| $30,000 to $34,999 | 0 (0.0%) | 3 (17.6%) |
| $35,000 to $39,999 | 0 (0.0%) | 5 (29.4%) |
| $40,000 to $44,999 | 0 (0.0%) | 0 (0.0%) |
| $45,000 to $49,999 | 0 (0.0%) | 0 (0.0%) |
| $50,000 to $54,999 | 4 (28.6%) | 0 (0.0%) |
| $55,000 to $64,999 | 0 (0.0%) | 4 (23.5%) |
| $65,000 to $74,999 | 0 (0.0%) | 0 (0.0%) |
| $75,000 to $99,999 | 6 (42.9%) | 5 (29.4%) |
| $100,000+ | 4 (28.6%) | 0 (0.0%) |
| Total | 14 (100.0%) | 17 (100.0%) |
Earnings by Sex by Educational Attainment in Juliustown
| Educational Attainment | Male Income | Female Income |
| Less than High School | - | - |
| High School Diploma | - | - |
| College or Associate's Degree | - | - |
| Bachelor's Degree | - | - |
| Graduate Degree | - | - |
| Total | - | - |
Family Income in Juliustown
Family Income Brackets in Juliustown
According to the Juliustown family income data, there are 11 families falling into the $150,000 to $199,999 income range, which is the most common income bracket and makes up 45.8% of all families.
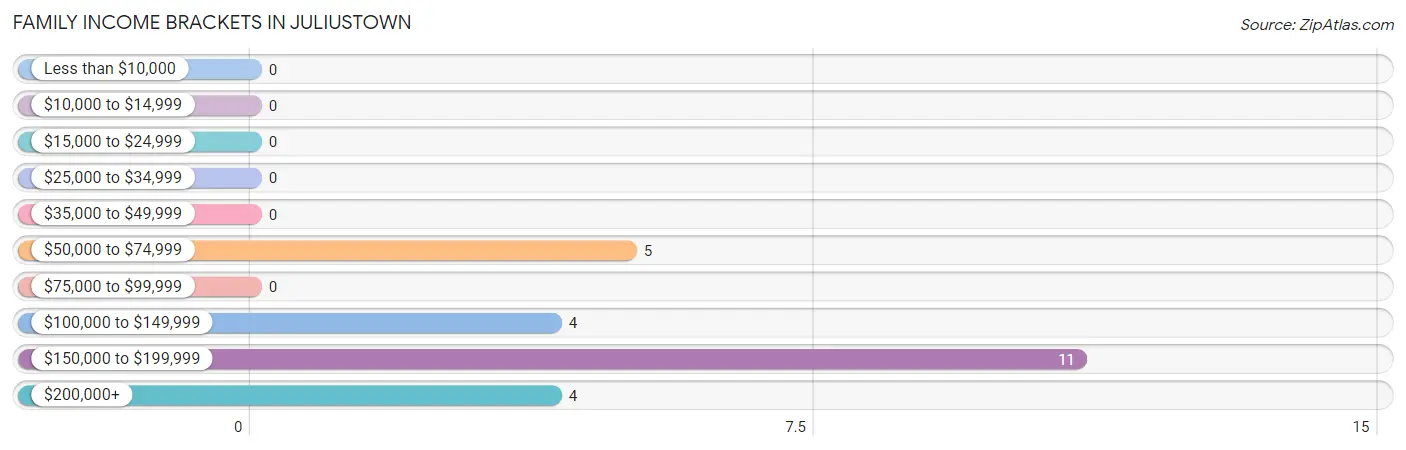
| Income Bracket | # Families | % Families |
| Less than $10,000 | 0 | 0.0% |
| $10,000 to $14,999 | 0 | 0.0% |
| $15,000 to $24,999 | 0 | 0.0% |
| $25,000 to $34,999 | 0 | 0.0% |
| $35,000 to $49,999 | 0 | 0.0% |
| $50,000 to $74,999 | 5 | 20.8% |
| $75,000 to $99,999 | 0 | 0.0% |
| $100,000 to $149,999 | 4 | 16.7% |
| $150,000 to $199,999 | 11 | 45.8% |
| $200,000+ | 4 | 16.7% |
Family Income by Famaliy Size in Juliustown
2-person families (20 | 83.3%) account for the highest median family income in Juliustown with $152,083 per family, while 2-person families (20 | 83.3%) have the highest median income of $76,042 per family member.
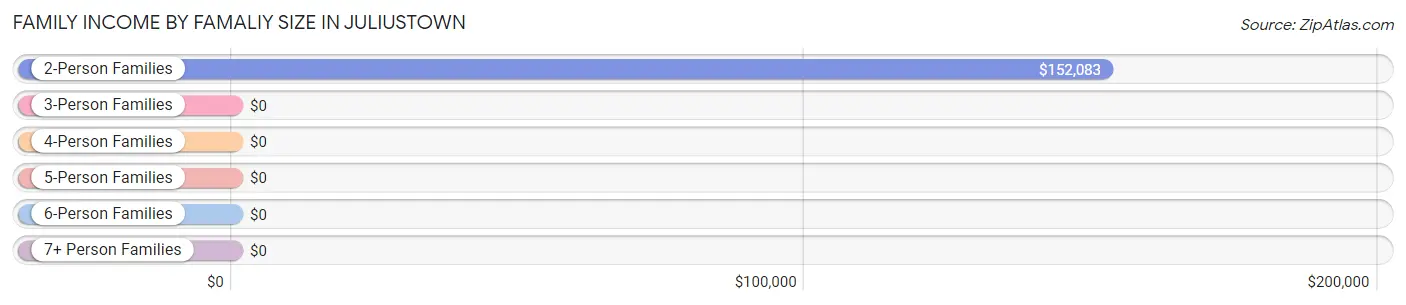
| Income Bracket | # Families | Median Income |
| 2-Person Families | 20 (83.3%) | $152,083 |
| 3-Person Families | 4 (16.7%) | $0 |
| 4-Person Families | 0 (0.0%) | $0 |
| 5-Person Families | 0 (0.0%) | $0 |
| 6-Person Families | 0 (0.0%) | $0 |
| 7+ Person Families | 0 (0.0%) | $0 |
| Total | 24 (100.0%) | $151,250 |
Family Income by Number of Earners in Juliustown
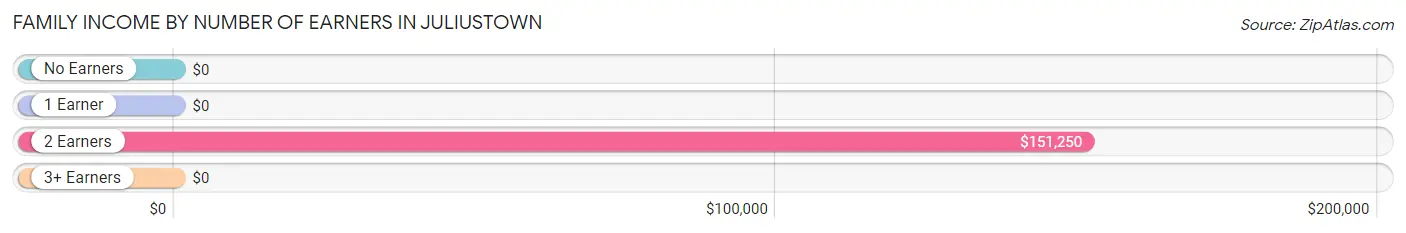
| Number of Earners | # Families | Median Income |
| No Earners | 10 (41.7%) | $0 |
| 1 Earner | 0 (0.0%) | $0 |
| 2 Earners | 14 (58.3%) | $151,250 |
| 3+ Earners | 0 (0.0%) | $0 |
| Total | 24 (100.0%) | $151,250 |
Household Income in Juliustown
Household Income Brackets in Juliustown
With 11 households falling in the category, the $150,000 to $199,999 income range is the most frequent in Juliustown, accounting for 28.2% of all households.
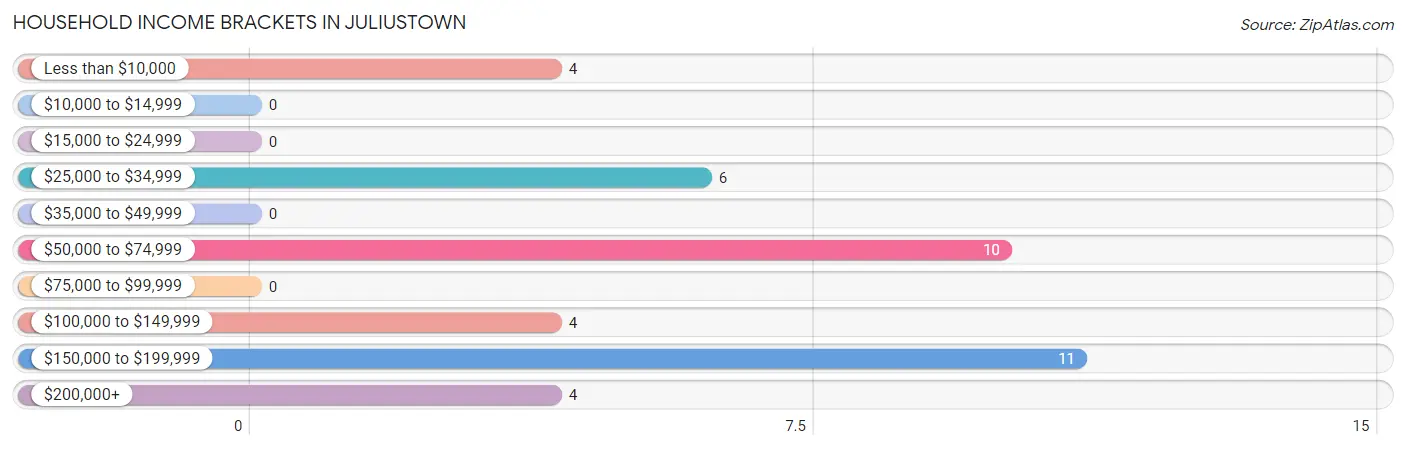
| Income Bracket | # Households | % Households |
| Less than $10,000 | 4 | 10.3% |
| $10,000 to $14,999 | 0 | 0.0% |
| $15,000 to $24,999 | 0 | 0.0% |
| $25,000 to $34,999 | 6 | 15.4% |
| $35,000 to $49,999 | 0 | 0.0% |
| $50,000 to $74,999 | 10 | 25.6% |
| $75,000 to $99,999 | 0 | 0.0% |
| $100,000 to $149,999 | 4 | 10.3% |
| $150,000 to $199,999 | 11 | 28.2% |
| $200,000+ | 4 | 10.3% |
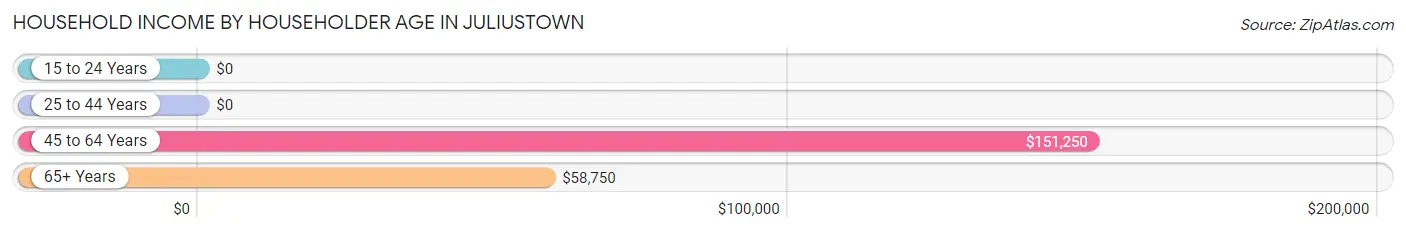
Household Income by Householder Age in Juliustown
The median household income in Juliustown is $0, with the highest median household income of $151,250 found in the 45 to 64 years age bracket for the primary householder. A total of 14 households (35.9%) fall into this category.
| Income Bracket | # Households | Median Income |
| 15 to 24 Years | 0 (0.0%) | $0 |
| 25 to 44 Years | 0 (0.0%) | $0 |
| 45 to 64 Years | 14 (35.9%) | $151,250 |
| 65+ Years | 25 (64.1%) | $58,750 |
| Total | 39 (100.0%) | $0 |
Poverty in Juliustown
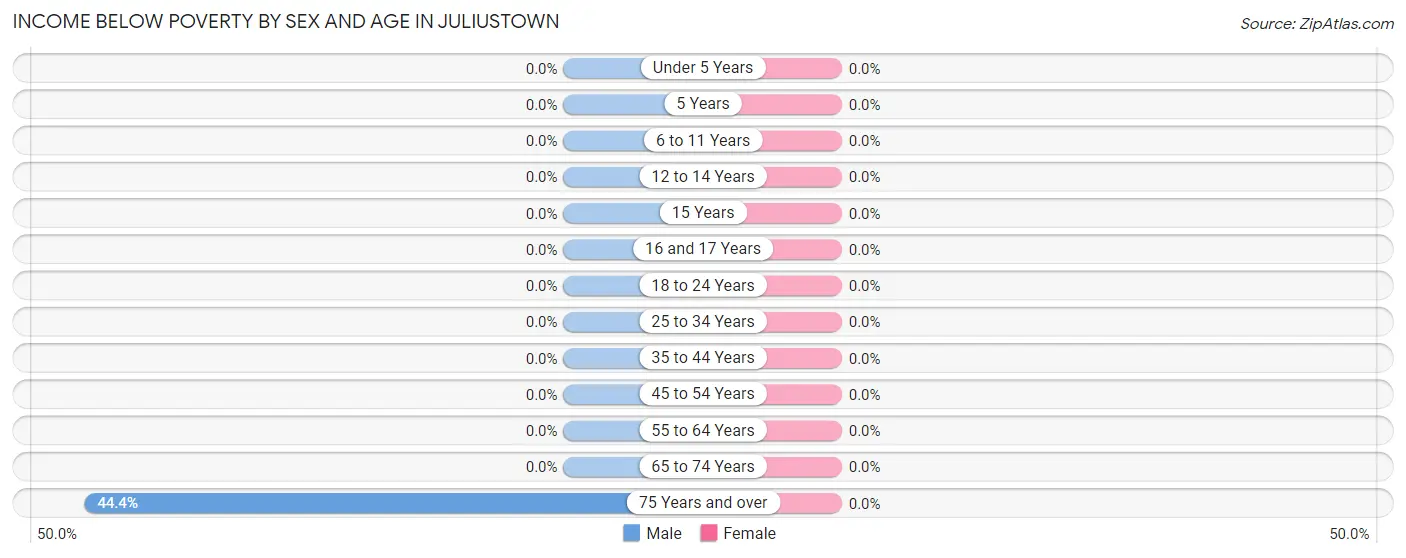
Income Below Poverty by Sex and Age in Juliustown
| Age Bracket | Male | Female |
| Under 5 Years | 0 (0.0%) | 0 (0.0%) |
| 5 Years | 0 (0.0%) | 0 (0.0%) |
| 6 to 11 Years | 0 (0.0%) | 0 (0.0%) |
| 12 to 14 Years | 0 (0.0%) | 0 (0.0%) |
| 15 Years | 0 (0.0%) | 0 (0.0%) |
| 16 and 17 Years | 0 (0.0%) | 0 (0.0%) |
| 18 to 24 Years | 0 (0.0%) | 0 (0.0%) |
| 25 to 34 Years | 0 (0.0%) | 0 (0.0%) |
| 35 to 44 Years | 0 (0.0%) | 0 (0.0%) |
| 45 to 54 Years | 0 (0.0%) | 0 (0.0%) |
| 55 to 64 Years | 0 (0.0%) | 0 (0.0%) |
| 65 to 74 Years | 0 (0.0%) | 0 (0.0%) |
| 75 Years and over | 4 (44.4%) | 0 (0.0%) |
| Total | 4 (13.8%) | 0 (0.0%) |
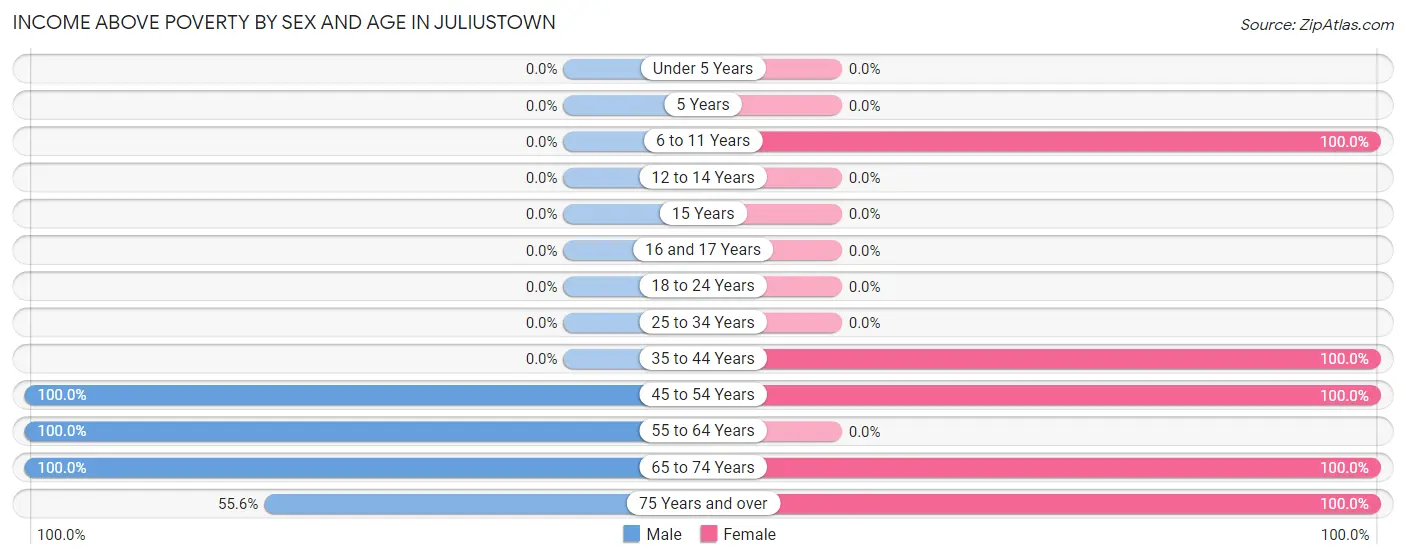
Income Above Poverty by Sex and Age in Juliustown
According to the poverty statistics in Juliustown, males aged 45 to 54 years and females aged 6 to 11 years are the age groups that are most secure financially, with 100.0% of males and 100.0% of females in these age groups living above the poverty line.
| Age Bracket | Male | Female |
| Under 5 Years | 0 (0.0%) | 0 (0.0%) |
| 5 Years | 0 (0.0%) | 0 (0.0%) |
| 6 to 11 Years | 0 (0.0%) | 4 (100.0%) |
| 12 to 14 Years | 0 (0.0%) | 0 (0.0%) |
| 15 Years | 0 (0.0%) | 0 (0.0%) |
| 16 and 17 Years | 0 (0.0%) | 0 (0.0%) |
| 18 to 24 Years | 0 (0.0%) | 0 (0.0%) |
| 25 to 34 Years | 0 (0.0%) | 0 (0.0%) |
| 35 to 44 Years | 0 (0.0%) | 4 (100.0%) |
| 45 to 54 Years | 8 (100.0%) | 8 (100.0%) |
| 55 to 64 Years | 6 (100.0%) | 0 (0.0%) |
| 65 to 74 Years | 6 (100.0%) | 10 (100.0%) |
| 75 Years and over | 5 (55.6%) | 12 (100.0%) |
| Total | 25 (86.2%) | 38 (100.0%) |
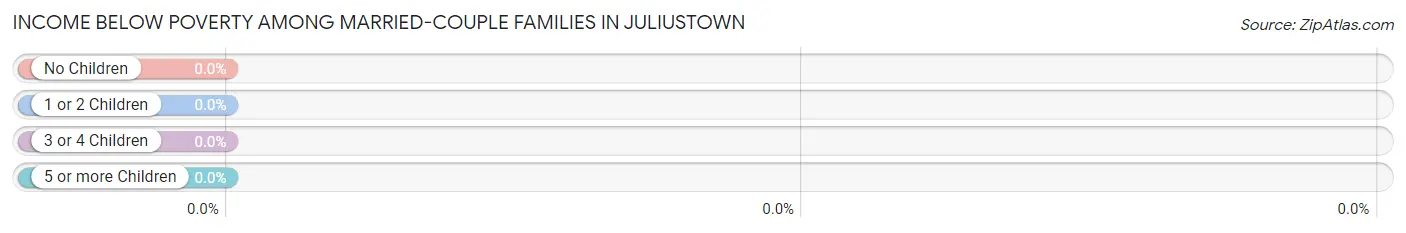
Income Below Poverty Among Married-Couple Families in Juliustown
| Children | Above Poverty | Below Poverty |
| No Children | 20 (100.0%) | 0 (0.0%) |
| 1 or 2 Children | 4 (100.0%) | 0 (0.0%) |
| 3 or 4 Children | 0 (0.0%) | 0 (0.0%) |
| 5 or more Children | 0 (0.0%) | 0 (0.0%) |
| Total | 24 (100.0%) | 0 (0.0%) |
Income Below Poverty Among Single-Parent Households in Juliustown
| Children | Single Father | Single Mother |
| No Children | 0 (0.0%) | 0 (0.0%) |
| 1 or 2 Children | 0 (0.0%) | 0 (0.0%) |
| 3 or 4 Children | 0 (0.0%) | 0 (0.0%) |
| 5 or more Children | 0 (0.0%) | 0 (0.0%) |
| Total | 0 (0.0%) | 0 (0.0%) |
Income Below Poverty Among Married-Couple vs Single-Parent Households in Juliustown
| Children | Married-Couple Families | Single-Parent Households |
| No Children | 0 (0.0%) | 0 (0.0%) |
| 1 or 2 Children | 0 (0.0%) | 0 (0.0%) |
| 3 or 4 Children | 0 (0.0%) | 0 (0.0%) |
| 5 or more Children | 0 (0.0%) | 0 (0.0%) |
| Total | 0 (0.0%) | 0 (0.0%) |
Race in Juliustown
The most populous races in Juliustown are , and White / Caucasian (67 | 100.0%).
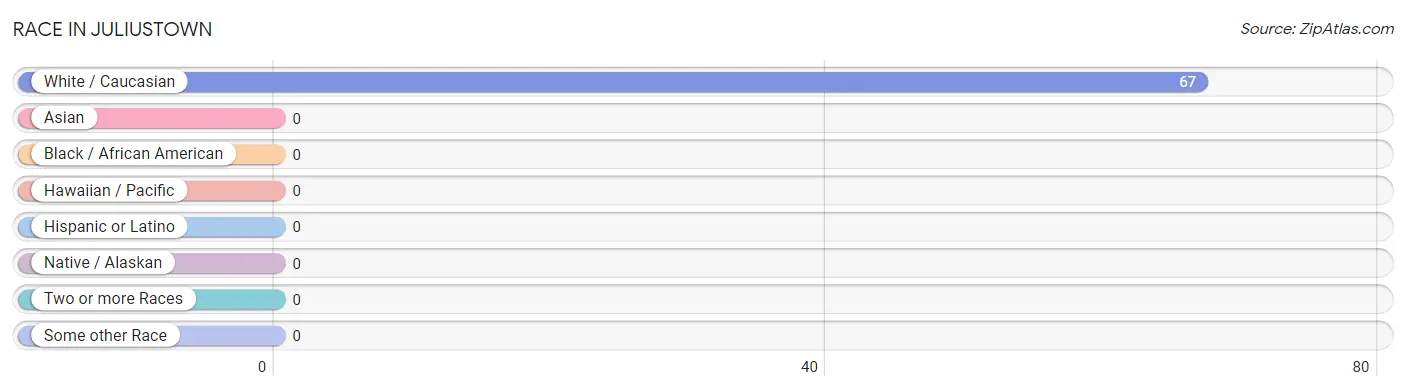
| Race | # Population | % Population |
| Asian | 0 | 0.0% |
| Black / African American | 0 | 0.0% |
| Hawaiian / Pacific | 0 | 0.0% |
| Hispanic or Latino | 0 | 0.0% |
| Native / Alaskan | 0 | 0.0% |
| White / Caucasian | 67 | 100.0% |
| Two or more Races | 0 | 0.0% |
| Some other Race | 0 | 0.0% |
| Total | 67 | 100.0% |
Ancestry in Juliustown
The most populous ancestries reported in Juliustown are German (25 | 37.3%), Italian (25 | 37.3%), Irish (19 | 28.4%), Scottish (5 | 7.5%), and American (4 | 6.0%), together accounting for 116.4% of all Juliustown residents.
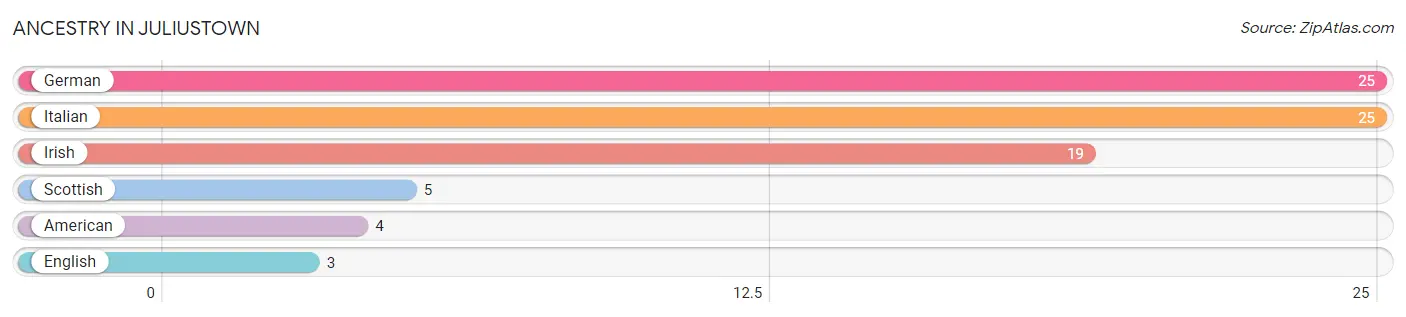
| Ancestry | # Population | % Population |
| American | 4 | 6.0% |
| English | 3 | 4.5% |
| German | 25 | 37.3% |
| Irish | 19 | 28.4% |
| Italian | 25 | 37.3% |
| Scottish | 5 | 7.5% | View All 6 Rows |
Immigrants in Juliustown

| Immigration Origin | # Population | % Population | View All 0 Rows |
Sex and Age in Juliustown
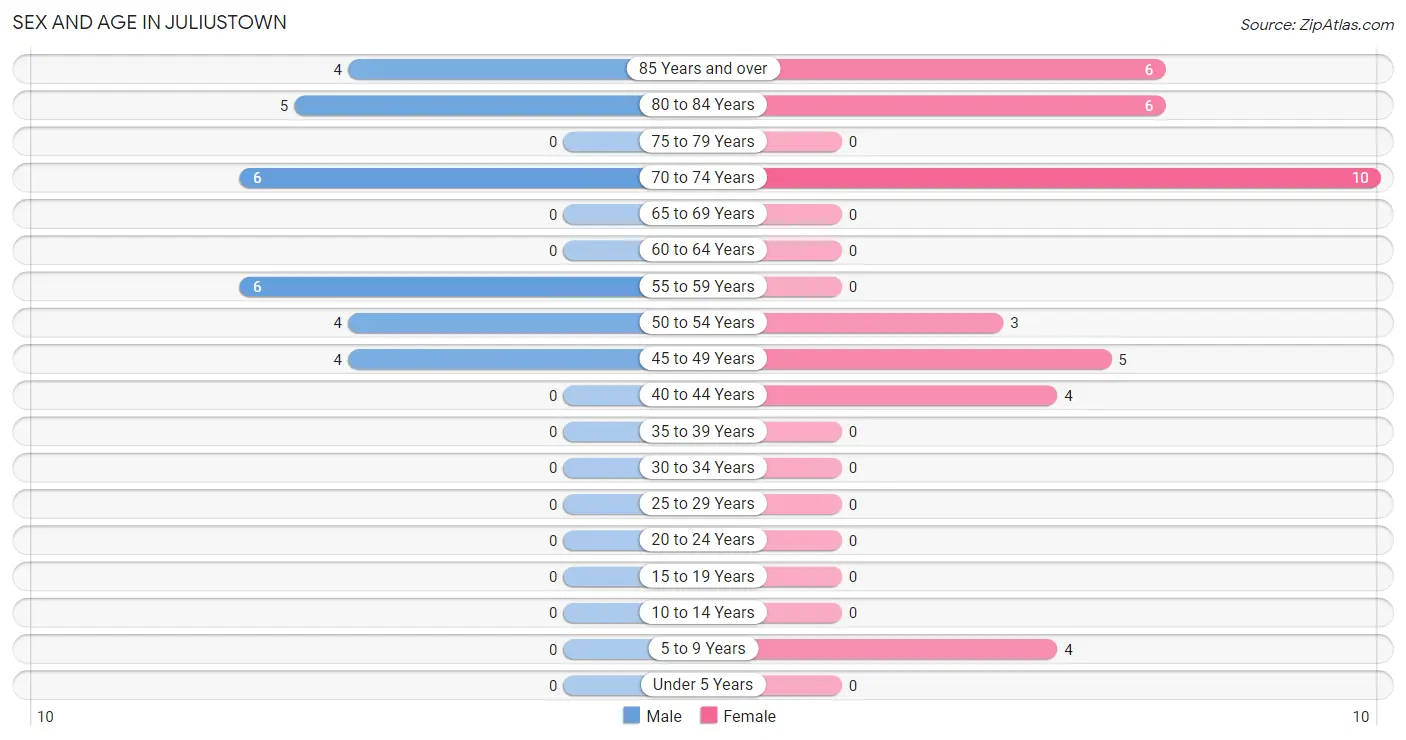
Sex and Age in Juliustown
The most populous age groups in Juliustown are 55 to 59 Years (6 | 20.7%) for men and 70 to 74 Years (10 | 26.3%) for women.
| Age Bracket | Male | Female |
| Under 5 Years | 0 (0.0%) | 0 (0.0%) |
| 5 to 9 Years | 0 (0.0%) | 4 (10.5%) |
| 10 to 14 Years | 0 (0.0%) | 0 (0.0%) |
| 15 to 19 Years | 0 (0.0%) | 0 (0.0%) |
| 20 to 24 Years | 0 (0.0%) | 0 (0.0%) |
| 25 to 29 Years | 0 (0.0%) | 0 (0.0%) |
| 30 to 34 Years | 0 (0.0%) | 0 (0.0%) |
| 35 to 39 Years | 0 (0.0%) | 0 (0.0%) |
| 40 to 44 Years | 0 (0.0%) | 4 (10.5%) |
| 45 to 49 Years | 4 (13.8%) | 5 (13.2%) |
| 50 to 54 Years | 4 (13.8%) | 3 (7.9%) |
| 55 to 59 Years | 6 (20.7%) | 0 (0.0%) |
| 60 to 64 Years | 0 (0.0%) | 0 (0.0%) |
| 65 to 69 Years | 0 (0.0%) | 0 (0.0%) |
| 70 to 74 Years | 6 (20.7%) | 10 (26.3%) |
| 75 to 79 Years | 0 (0.0%) | 0 (0.0%) |
| 80 to 84 Years | 5 (17.2%) | 6 (15.8%) |
| 85 Years and over | 4 (13.8%) | 6 (15.8%) |
| Total | 29 (100.0%) | 38 (100.0%) |
Families and Households in Juliustown
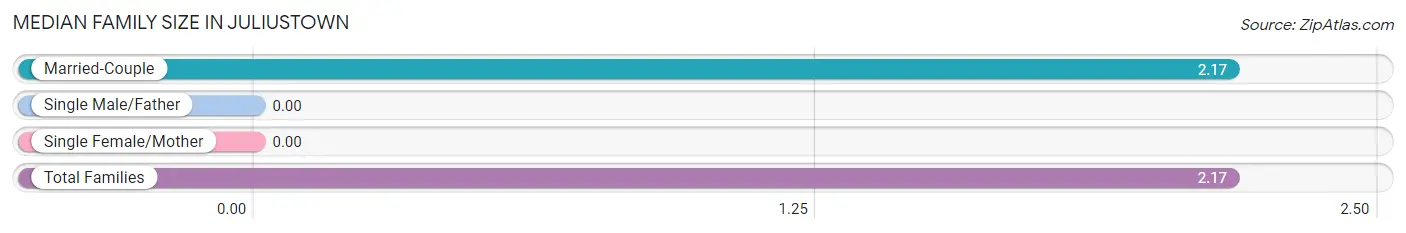
Median Family Size in Juliustown
| Family Type | # Families | Family Size |
| Married-Couple | 24 (100.0%) | 2.17 |
| Single Male/Father | 0 (0.0%) | - |
| Single Female/Mother | 0 (0.0%) | - |
| Total Families | 24 (100.0%) | 2.17 |
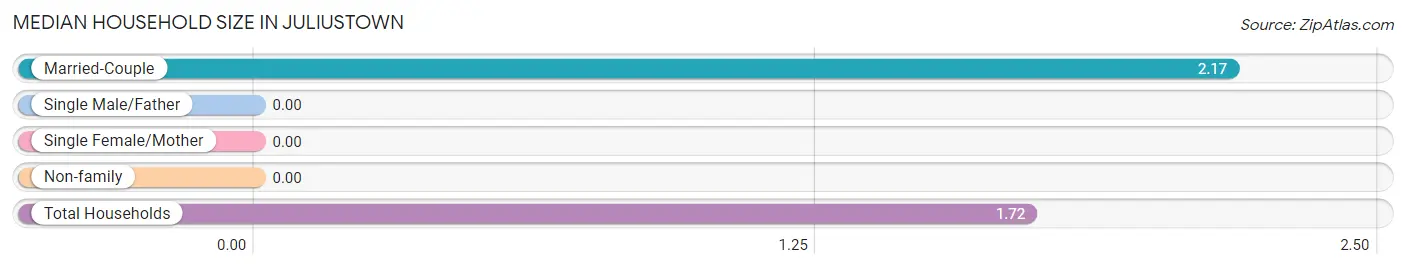
Median Household Size in Juliustown
| Household Type | # Households | Household Size |
| Married-Couple | 24 (61.5%) | 2.17 |
| Single Male/Father | 0 (0.0%) | - |
| Single Female/Mother | 0 (0.0%) | - |
| Non-family | 15 (38.5%) | - |
| Total Households | 39 (100.0%) | 1.72 |
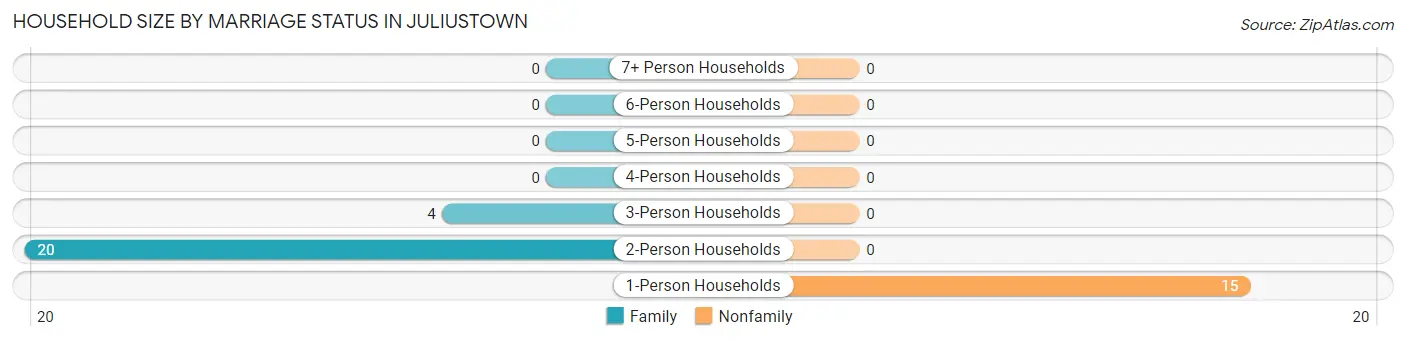
Household Size by Marriage Status in Juliustown
Out of a total of 39 households in Juliustown, 24 (61.5%) are family households, while 15 (38.5%) are nonfamily households. The most numerous type of family households are 2-person households, comprising 20, and the most common type of nonfamily households are 1-person households, comprising 15.
| Household Size | Family Households | Nonfamily Households |
| 1-Person Households | - | 15 (38.5%) |
| 2-Person Households | 20 (51.3%) | 0 (0.0%) |
| 3-Person Households | 4 (10.3%) | 0 (0.0%) |
| 4-Person Households | 0 (0.0%) | 0 (0.0%) |
| 5-Person Households | 0 (0.0%) | 0 (0.0%) |
| 6-Person Households | 0 (0.0%) | 0 (0.0%) |
| 7+ Person Households | 0 (0.0%) | 0 (0.0%) |
| Total | 24 (61.5%) | 15 (38.5%) |
Female Fertility in Juliustown
Fertility by Age in Juliustown
| Age Bracket | Women with Births | Births / 1,000 Women |
| 15 to 19 years | 0 (0.0%) | 0.0 |
| 20 to 34 years | 0 (0.0%) | 0.0 |
| 35 to 50 years | 0 (0.0%) | 0.0 |
| Total | 0 (0.0%) | 0.0 |
Fertility by Age by Marriage Status in Juliustown
| Age Bracket | Married | Unmarried |
| 15 to 19 years | 0 (0.0%) | 0 (0.0%) |
| 20 to 34 years | 0 (0.0%) | 0 (0.0%) |
| 35 to 50 years | 0 (0.0%) | 0 (0.0%) |
| Total | 0 (0.0%) | 0 (0.0%) |
Fertility by Education in Juliustown
| Educational Attainment | Women with Births | Births / 1,000 Women |
| Less than High School | 0 (0.0%) | 0.0 |
| High School Diploma | 0 (0.0%) | 0.0 |
| College or Associate's Degree | 0 (0.0%) | 0.0 |
| Bachelor's Degree | 0 (0.0%) | 0.0 |
| Graduate Degree | 0 (0.0%) | 0.0 |
| Total | 0 (0.0%) | 0.0 |
Fertility by Education by Marriage Status in Juliustown
| Educational Attainment | Married | Unmarried |
| Less than High School | 0 (0.0%) | 0 (0.0%) |
| High School Diploma | 0 (0.0%) | 0 (0.0%) |
| College or Associate's Degree | 0 (0.0%) | 0 (0.0%) |
| Bachelor's Degree | 0 (0.0%) | 0 (0.0%) |
| Graduate Degree | 0 (0.0%) | 0 (0.0%) |
| Total | 0 (0.0%) | 0 (0.0%) |
Employment Characteristics in Juliustown
Employment by Class of Employer in Juliustown
Among the 31 employed individuals in Juliustown, private company employees (15 | 48.4%), not-for-profit organizations (8 | 25.8%), and self-employed (not incorporated) (4 | 12.9%) make up the most common classes of employment.
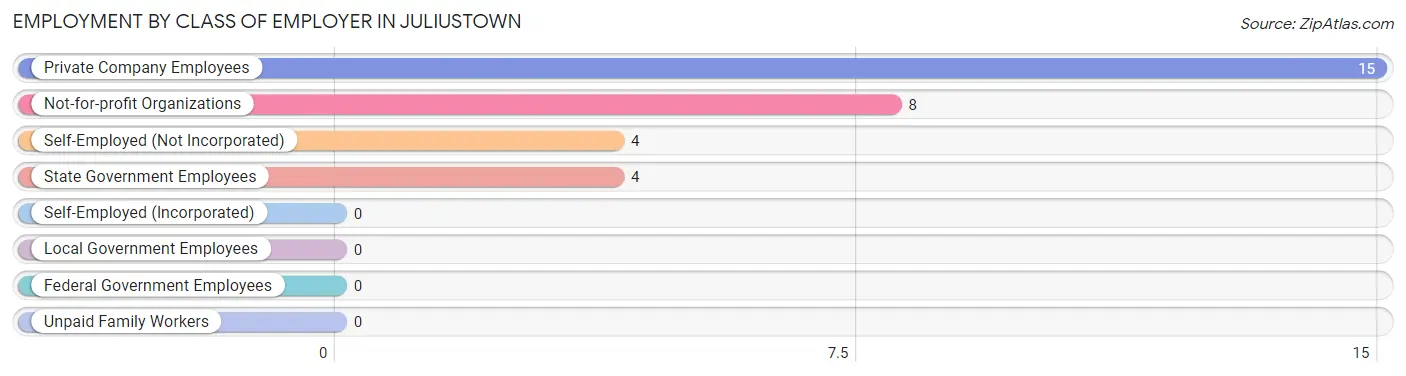
| Employer Class | # Employees | % Employees |
| Private Company Employees | 15 | 48.4% |
| Self-Employed (Incorporated) | 0 | 0.0% |
| Self-Employed (Not Incorporated) | 4 | 12.9% |
| Not-for-profit Organizations | 8 | 25.8% |
| Local Government Employees | 0 | 0.0% |
| State Government Employees | 4 | 12.9% |
| Federal Government Employees | 0 | 0.0% |
| Unpaid Family Workers | 0 | 0.0% |
| Total | 31 | 100.0% |
Employment Status by Age in Juliustown
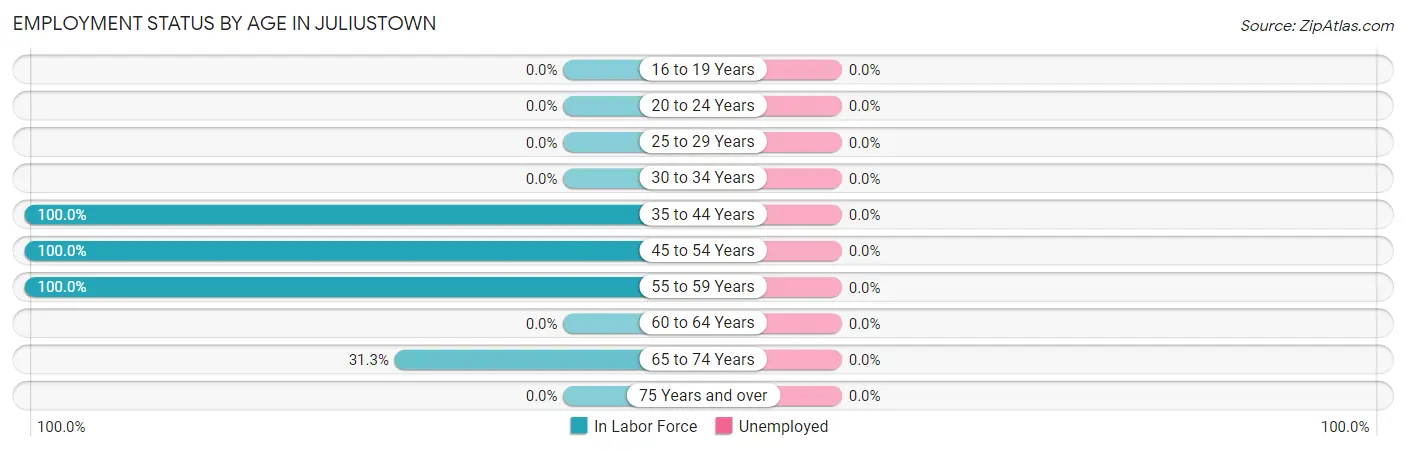
| Age Bracket | In Labor Force | Unemployed |
| 16 to 19 Years | 0 (0.0%) | 0 (0.0%) |
| 20 to 24 Years | 0 (0.0%) | 0 (0.0%) |
| 25 to 29 Years | 0 (0.0%) | 0 (0.0%) |
| 30 to 34 Years | 0 (0.0%) | 0 (0.0%) |
| 35 to 44 Years | 4 (100.0%) | 0 (0.0%) |
| 45 to 54 Years | 16 (100.0%) | 0 (0.0%) |
| 55 to 59 Years | 6 (100.0%) | 0 (0.0%) |
| 60 to 64 Years | 0 (0.0%) | 0 (0.0%) |
| 65 to 74 Years | 5 (31.3%) | 0 (0.0%) |
| 75 Years and over | 0 (0.0%) | 0 (0.0%) |
| Total | 31 (49.2%) | 0 (0.0%) |
Employment Status by Educational Attainment in Juliustown
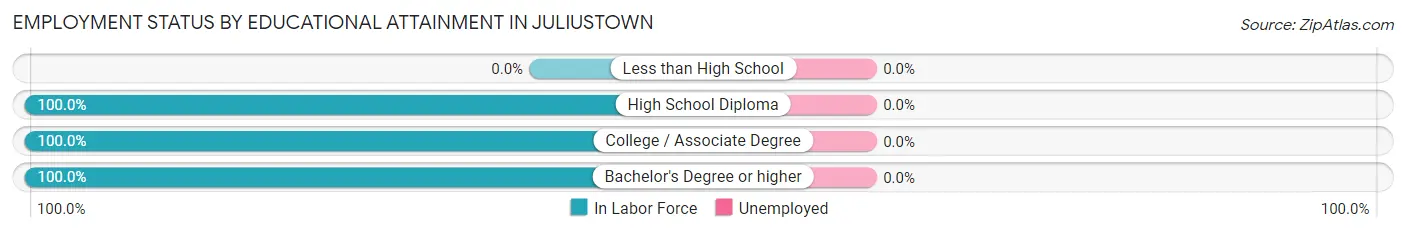
| Educational Attainment | In Labor Force | Unemployed |
| Less than High School | 0 (0.0%) | 0 (0.0%) |
| High School Diploma | 9 (100.0%) | 0 (0.0%) |
| College / Associate Degree | 10 (100.0%) | 0 (0.0%) |
| Bachelor's Degree or higher | 7 (100.0%) | 0 (0.0%) |
| Total | 26 (100.0%) | 0 (0.0%) |
Employment Occupations by Sex in Juliustown
Management, Business, Science and Arts Occupations
The most common Management, Business, Science and Arts occupations in Juliustown are Community & Social Service (8 | 25.8%), Education, Arts & Media (5 | 16.1%), Management (4 | 12.9%), and Education Instruction & Library (3 | 9.7%).
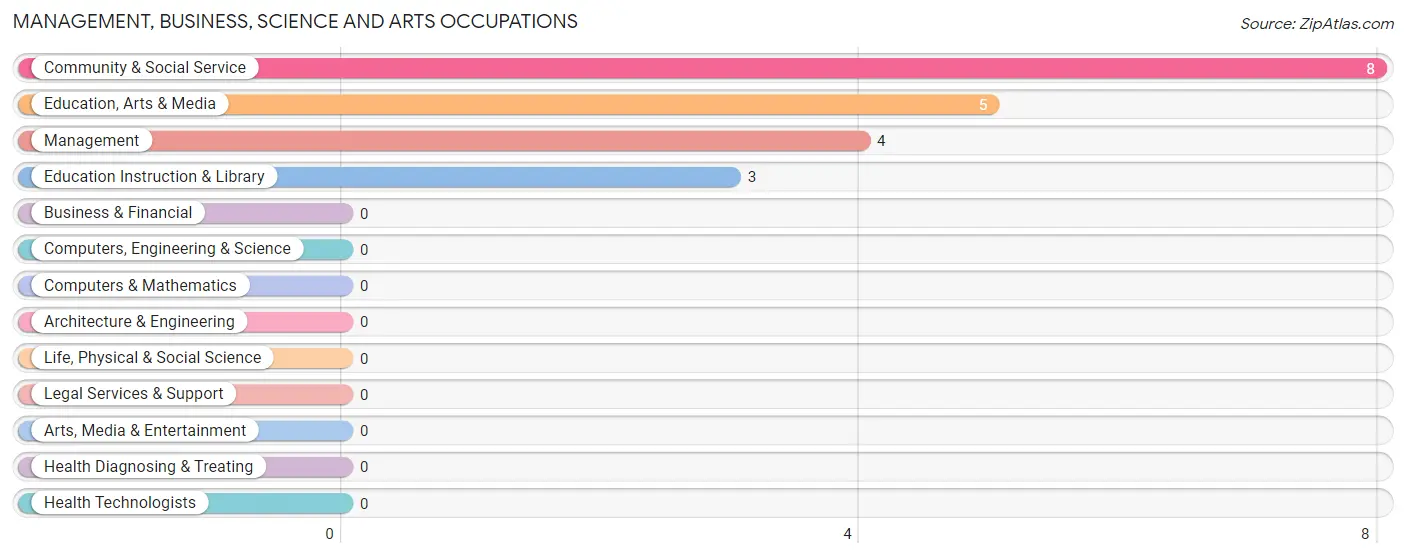
Management, Business, Science and Arts Occupations by Sex
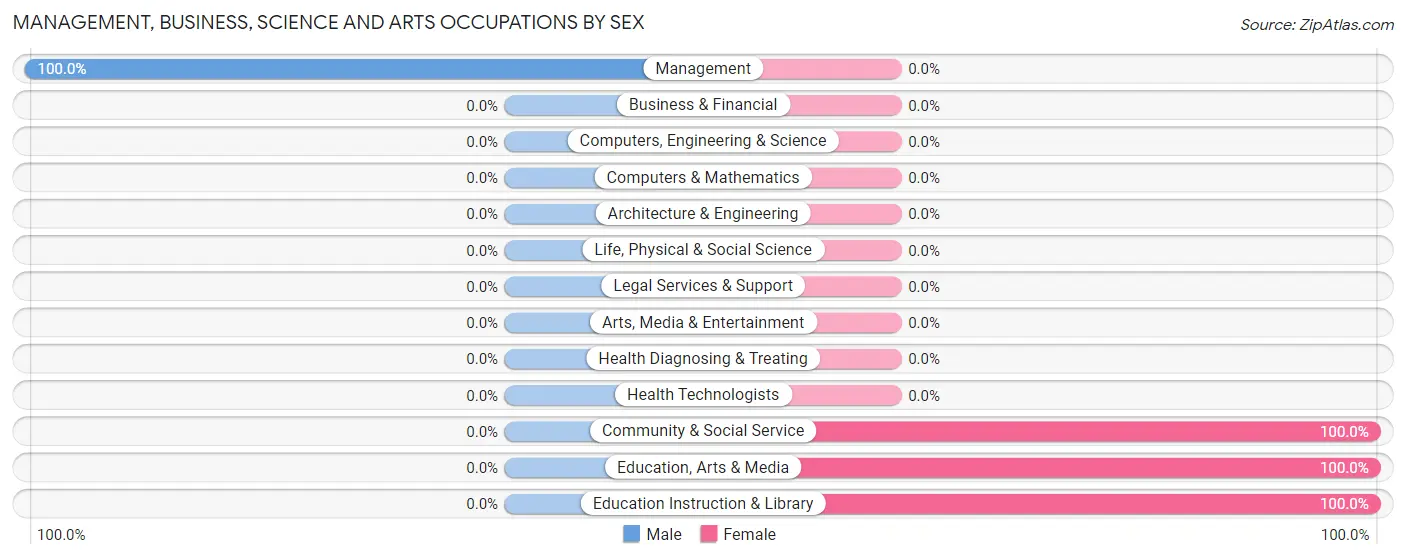
| Occupation | Male | Female |
| Management | 4 (100.0%) | 0 (0.0%) |
| Business & Financial | 0 (0.0%) | 0 (0.0%) |
| Computers, Engineering & Science | 0 (0.0%) | 0 (0.0%) |
| Computers & Mathematics | 0 (0.0%) | 0 (0.0%) |
| Architecture & Engineering | 0 (0.0%) | 0 (0.0%) |
| Life, Physical & Social Science | 0 (0.0%) | 0 (0.0%) |
| Community & Social Service | 0 (0.0%) | 8 (100.0%) |
| Education, Arts & Media | 0 (0.0%) | 5 (100.0%) |
| Legal Services & Support | 0 (0.0%) | 0 (0.0%) |
| Education Instruction & Library | 0 (0.0%) | 3 (100.0%) |
| Arts, Media & Entertainment | 0 (0.0%) | 0 (0.0%) |
| Health Diagnosing & Treating | 0 (0.0%) | 0 (0.0%) |
| Health Technologists | 0 (0.0%) | 0 (0.0%) |
| Total (Category) | 4 (33.3%) | 8 (66.7%) |
| Total (Overall) | 14 (45.2%) | 17 (54.8%) |
Services Occupations
Services Occupations by Sex
| Occupation | Male | Female |
| Healthcare Support | 0 (0.0%) | 0 (0.0%) |
| Security & Protection | 0 (0.0%) | 0 (0.0%) |
| Firefighting & Prevention | 0 (0.0%) | 0 (0.0%) |
| Law Enforcement | 0 (0.0%) | 0 (0.0%) |
| Food Preparation & Serving | 0 (0.0%) | 0 (0.0%) |
| Cleaning & Maintenance | 0 (0.0%) | 0 (0.0%) |
| Personal Care & Service | 0 (0.0%) | 0 (0.0%) |
| Total (Category) | 0 (0.0%) | 0 (0.0%) |
| Total (Overall) | 14 (45.2%) | 17 (54.8%) |
Sales and Office Occupations
The most common Sales and Office occupations in Juliustown are Office & Administration (9 | 29.0%), and Sales & Related (6 | 19.4%).

Sales and Office Occupations by Sex

| Occupation | Male | Female |
| Sales & Related | 6 (100.0%) | 0 (0.0%) |
| Office & Administration | 0 (0.0%) | 9 (100.0%) |
| Total (Category) | 6 (40.0%) | 9 (60.0%) |
| Total (Overall) | 14 (45.2%) | 17 (54.8%) |
Natural Resources, Construction and Maintenance Occupations

Natural Resources, Construction and Maintenance Occupations by Sex
| Occupation | Male | Female |
| Farming, Fishing & Forestry | 0 (0.0%) | 0 (0.0%) |
| Construction & Extraction | 0 (0.0%) | 0 (0.0%) |
| Installation, Maintenance & Repair | 0 (0.0%) | 0 (0.0%) |
| Total (Category) | 0 (0.0%) | 0 (0.0%) |
| Total (Overall) | 14 (45.2%) | 17 (54.8%) |
Production, Transportation and Moving Occupations
The most common Production, Transportation and Moving occupations in Juliustown are , and Transportation (4 | 12.9%).
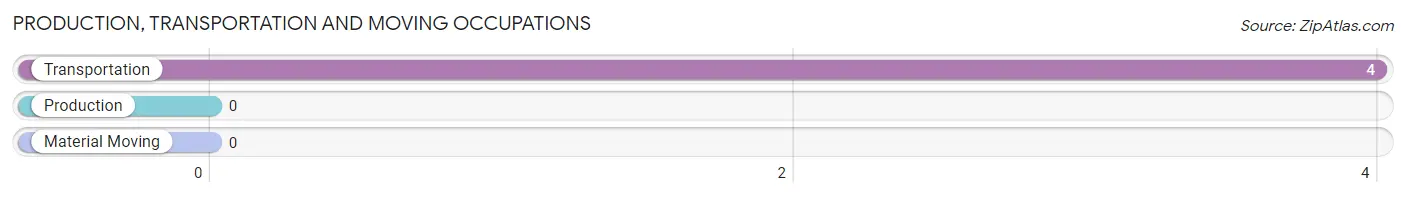
Production, Transportation and Moving Occupations by Sex
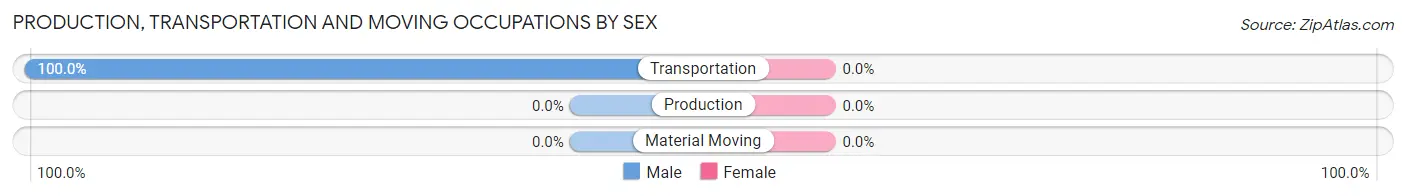
| Occupation | Male | Female |
| Production | 0 (0.0%) | 0 (0.0%) |
| Transportation | 4 (100.0%) | 0 (0.0%) |
| Material Moving | 0 (0.0%) | 0 (0.0%) |
| Total (Category) | 4 (100.0%) | 0 (0.0%) |
| Total (Overall) | 14 (45.2%) | 17 (54.8%) |
Employment Industries by Sex in Juliustown
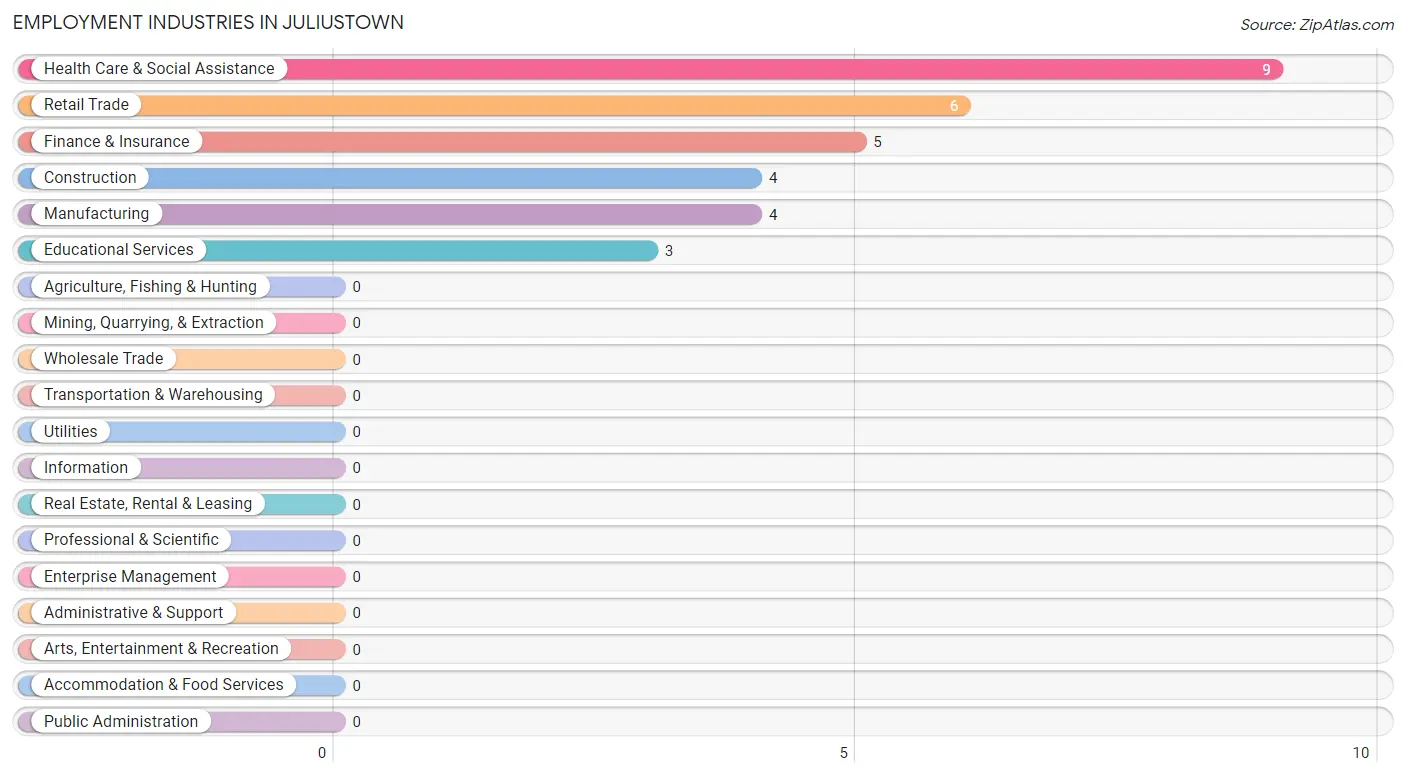
Employment Industries in Juliustown
The major employment industries in Juliustown include Health Care & Social Assistance (9 | 29.0%), Retail Trade (6 | 19.4%), Finance & Insurance (5 | 16.1%), Construction (4 | 12.9%), and Manufacturing (4 | 12.9%).
Employment Industries by Sex in Juliustown
The Juliustown industries that see more men than women are Construction (100.0%), Manufacturing (100.0%), and Retail Trade (100.0%), whereas the industries that tend to have a higher number of women are Finance & Insurance (100.0%), Educational Services (100.0%), and Health Care & Social Assistance (100.0%).
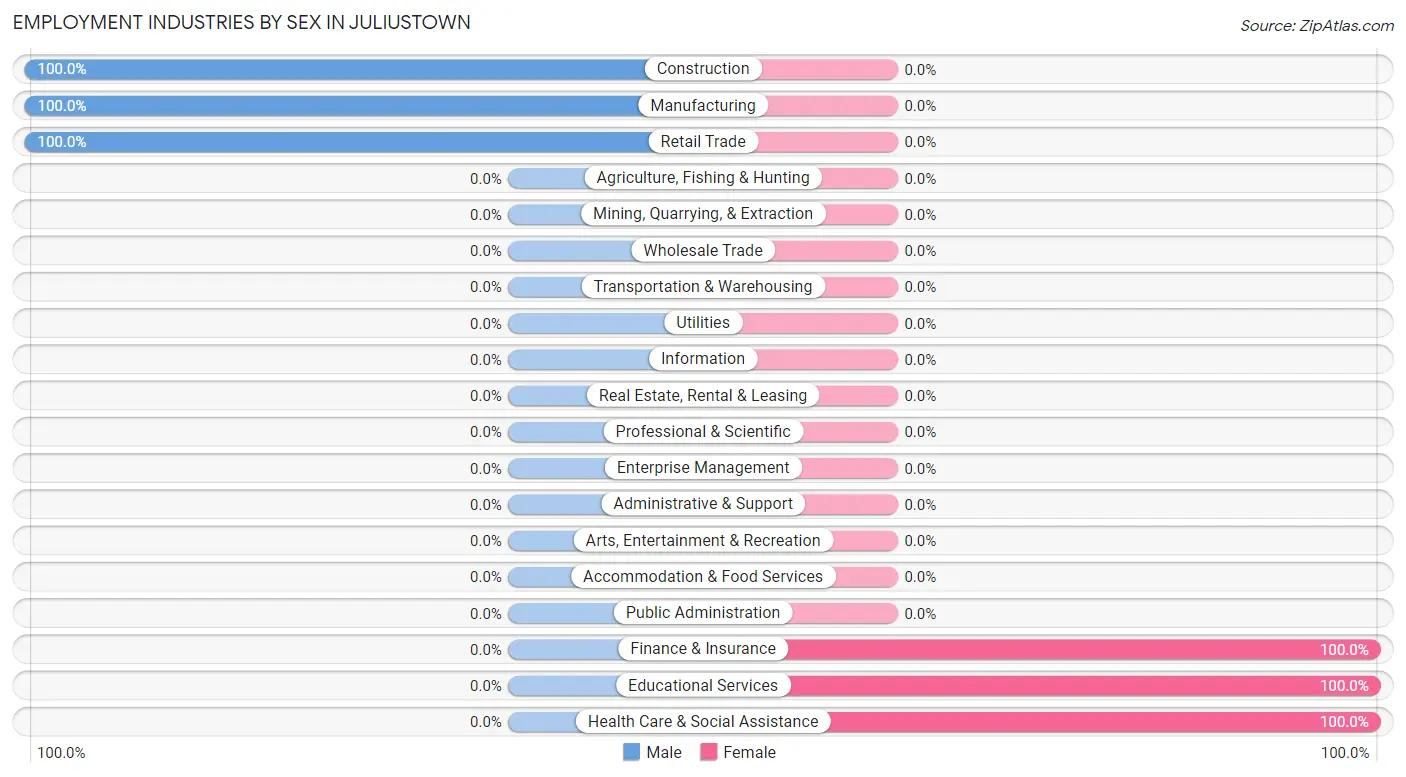
| Industry | Male | Female |
| Agriculture, Fishing & Hunting | 0 (0.0%) | 0 (0.0%) |
| Mining, Quarrying, & Extraction | 0 (0.0%) | 0 (0.0%) |
| Construction | 4 (100.0%) | 0 (0.0%) |
| Manufacturing | 4 (100.0%) | 0 (0.0%) |
| Wholesale Trade | 0 (0.0%) | 0 (0.0%) |
| Retail Trade | 6 (100.0%) | 0 (0.0%) |
| Transportation & Warehousing | 0 (0.0%) | 0 (0.0%) |
| Utilities | 0 (0.0%) | 0 (0.0%) |
| Information | 0 (0.0%) | 0 (0.0%) |
| Finance & Insurance | 0 (0.0%) | 5 (100.0%) |
| Real Estate, Rental & Leasing | 0 (0.0%) | 0 (0.0%) |
| Professional & Scientific | 0 (0.0%) | 0 (0.0%) |
| Enterprise Management | 0 (0.0%) | 0 (0.0%) |
| Administrative & Support | 0 (0.0%) | 0 (0.0%) |
| Educational Services | 0 (0.0%) | 3 (100.0%) |
| Health Care & Social Assistance | 0 (0.0%) | 9 (100.0%) |
| Arts, Entertainment & Recreation | 0 (0.0%) | 0 (0.0%) |
| Accommodation & Food Services | 0 (0.0%) | 0 (0.0%) |
| Public Administration | 0 (0.0%) | 0 (0.0%) |
| Total | 14 (45.2%) | 17 (54.8%) |
Education in Juliustown
School Enrollment in Juliustown
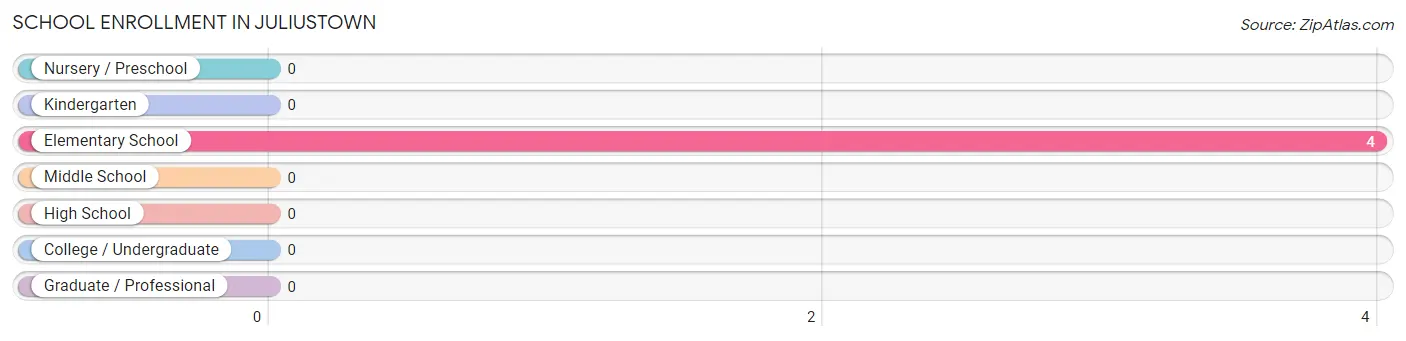
| School Level | # Students | % Students |
| Nursery / Preschool | 0 | 0.0% |
| Kindergarten | 0 | 0.0% |
| Elementary School | 4 | 100.0% |
| Middle School | 0 | 0.0% |
| High School | 0 | 0.0% |
| College / Undergraduate | 0 | 0.0% |
| Graduate / Professional | 0 | 0.0% |
| Total | 4 | 100.0% |
School Enrollment by Age by Funding Source in Juliustown
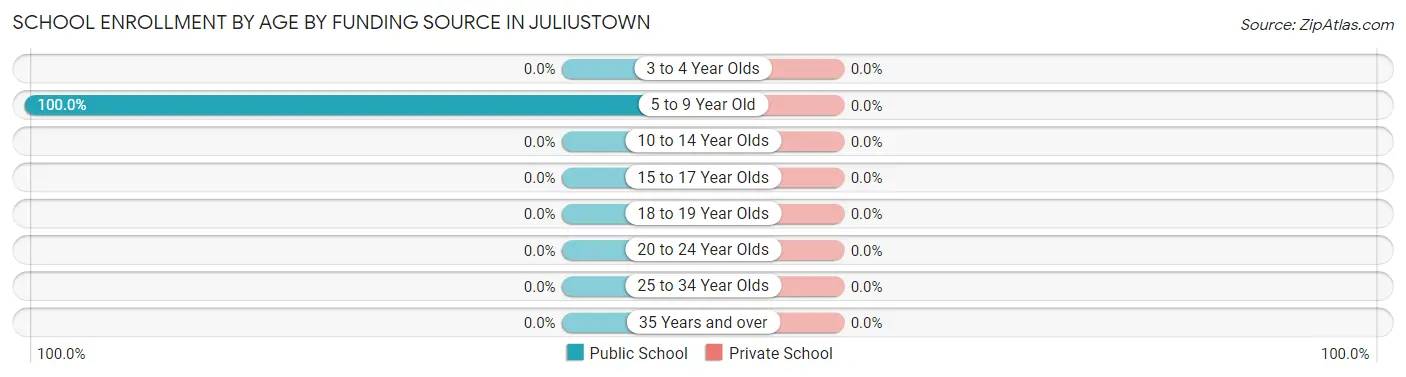
| Age Bracket | Public School | Private School |
| 3 to 4 Year Olds | 0 (0.0%) | 0 (0.0%) |
| 5 to 9 Year Old | 4 (100.0%) | 0 (0.0%) |
| 10 to 14 Year Olds | 0 (0.0%) | 0 (0.0%) |
| 15 to 17 Year Olds | 0 (0.0%) | 0 (0.0%) |
| 18 to 19 Year Olds | 0 (0.0%) | 0 (0.0%) |
| 20 to 24 Year Olds | 0 (0.0%) | 0 (0.0%) |
| 25 to 34 Year Olds | 0 (0.0%) | 0 (0.0%) |
| 35 Years and over | 0 (0.0%) | 0 (0.0%) |
| Total | 4 (100.0%) | 0 (0.0%) |
Educational Attainment by Field of Study in Juliustown
Education (11 | 61.1%), computers & mathematics (4 | 22.2%), and arts & humanities (3 | 16.7%) are the most common fields of study among 18 individuals in Juliustown who have obtained a bachelor's degree or higher.
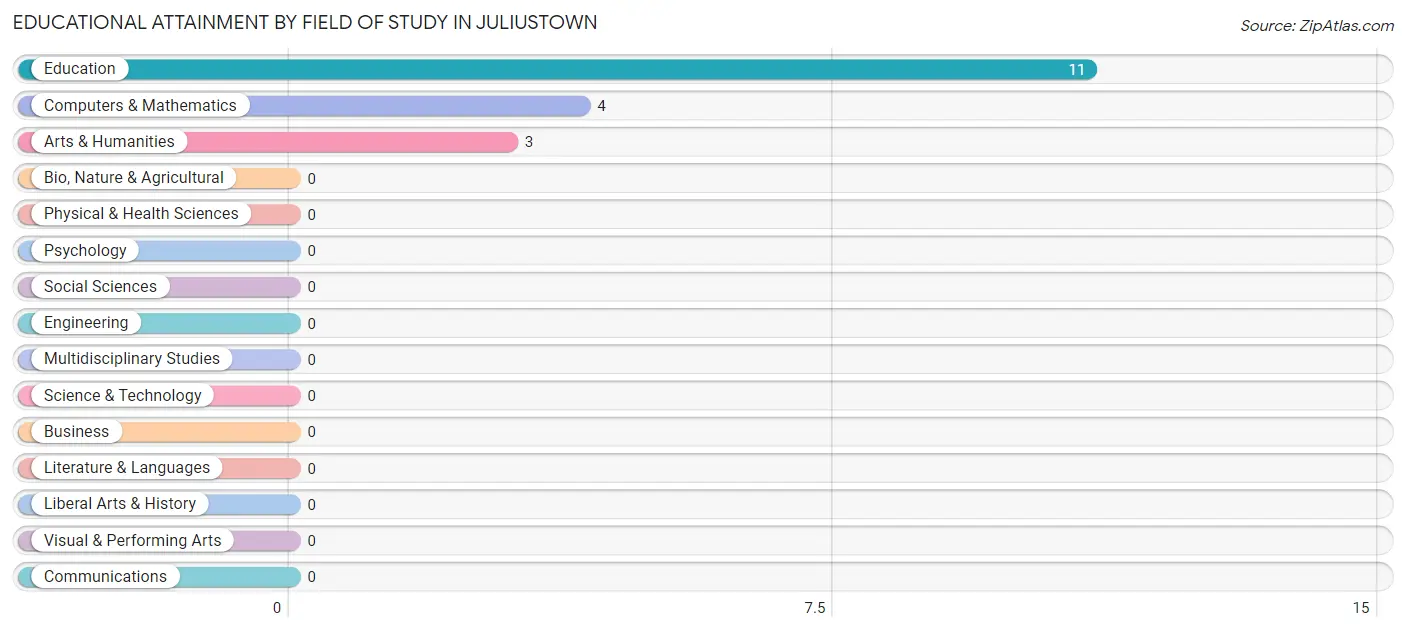
| Field of Study | # Graduates | % Graduates |
| Computers & Mathematics | 4 | 22.2% |
| Bio, Nature & Agricultural | 0 | 0.0% |
| Physical & Health Sciences | 0 | 0.0% |
| Psychology | 0 | 0.0% |
| Social Sciences | 0 | 0.0% |
| Engineering | 0 | 0.0% |
| Multidisciplinary Studies | 0 | 0.0% |
| Science & Technology | 0 | 0.0% |
| Business | 0 | 0.0% |
| Education | 11 | 61.1% |
| Literature & Languages | 0 | 0.0% |
| Liberal Arts & History | 0 | 0.0% |
| Visual & Performing Arts | 0 | 0.0% |
| Communications | 0 | 0.0% |
| Arts & Humanities | 3 | 16.7% |
| Total | 18 | 100.0% |
Transportation & Commute in Juliustown
Vehicle Availability by Sex in Juliustown
The most prevalent vehicle ownership categories in Juliustown are males with 2 vehicles (14, accounting for 100.0%) and females with 2 vehicles (12, making up 82.4%).
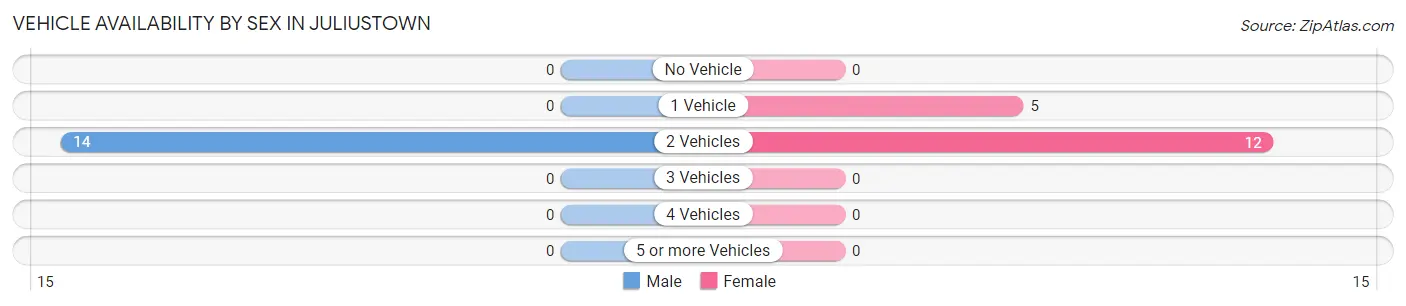
| Vehicles Available | Male | Female |
| No Vehicle | 0 (0.0%) | 0 (0.0%) |
| 1 Vehicle | 0 (0.0%) | 5 (29.4%) |
| 2 Vehicles | 14 (100.0%) | 12 (70.6%) |
| 3 Vehicles | 0 (0.0%) | 0 (0.0%) |
| 4 Vehicles | 0 (0.0%) | 0 (0.0%) |
| 5 or more Vehicles | 0 (0.0%) | 0 (0.0%) |
| Total | 14 (100.0%) | 17 (100.0%) |
Commute Time in Juliustown
The most frequently occuring commute durations in Juliustown are 35 to 39 minutes (9 commuters, 29.0%), 25 to 29 minutes (6 commuters, 19.4%), and 15 to 19 minutes (5 commuters, 16.1%).
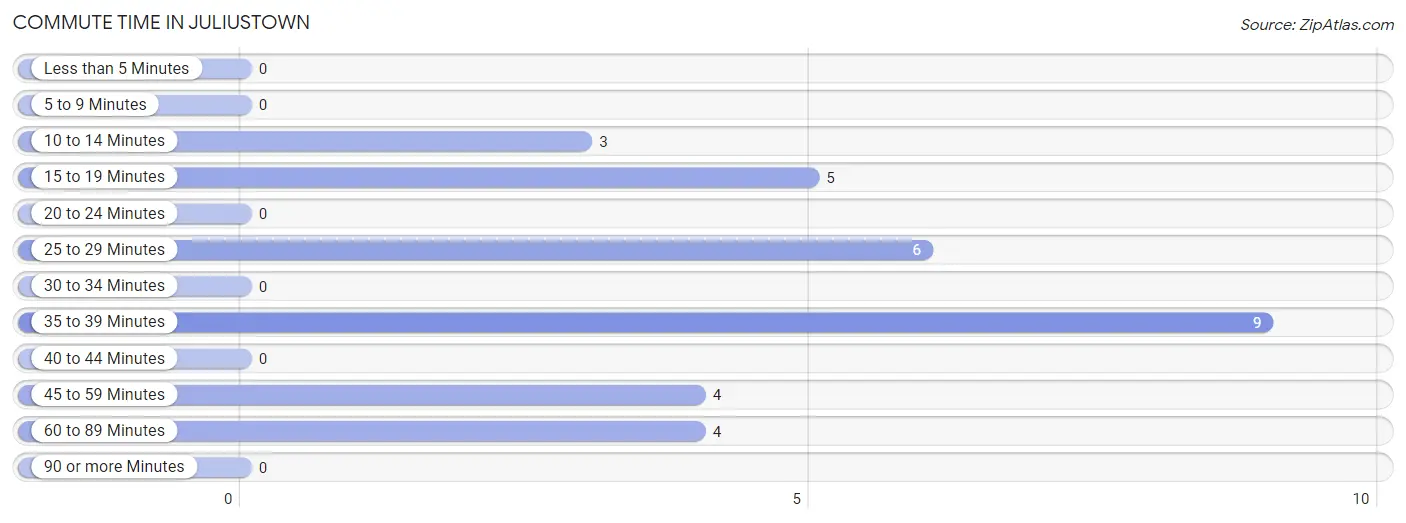
| Commute Time | # Commuters | % Commuters |
| Less than 5 Minutes | 0 | 0.0% |
| 5 to 9 Minutes | 0 | 0.0% |
| 10 to 14 Minutes | 3 | 9.7% |
| 15 to 19 Minutes | 5 | 16.1% |
| 20 to 24 Minutes | 0 | 0.0% |
| 25 to 29 Minutes | 6 | 19.4% |
| 30 to 34 Minutes | 0 | 0.0% |
| 35 to 39 Minutes | 9 | 29.0% |
| 40 to 44 Minutes | 0 | 0.0% |
| 45 to 59 Minutes | 4 | 12.9% |
| 60 to 89 Minutes | 4 | 12.9% |
| 90 or more Minutes | 0 | 0.0% |
Commute Time by Sex in Juliustown
The most common commute times in Juliustown are 25 to 29 minutes (6 commuters, 42.9%) for males and 35 to 39 minutes (9 commuters, 52.9%) for females.
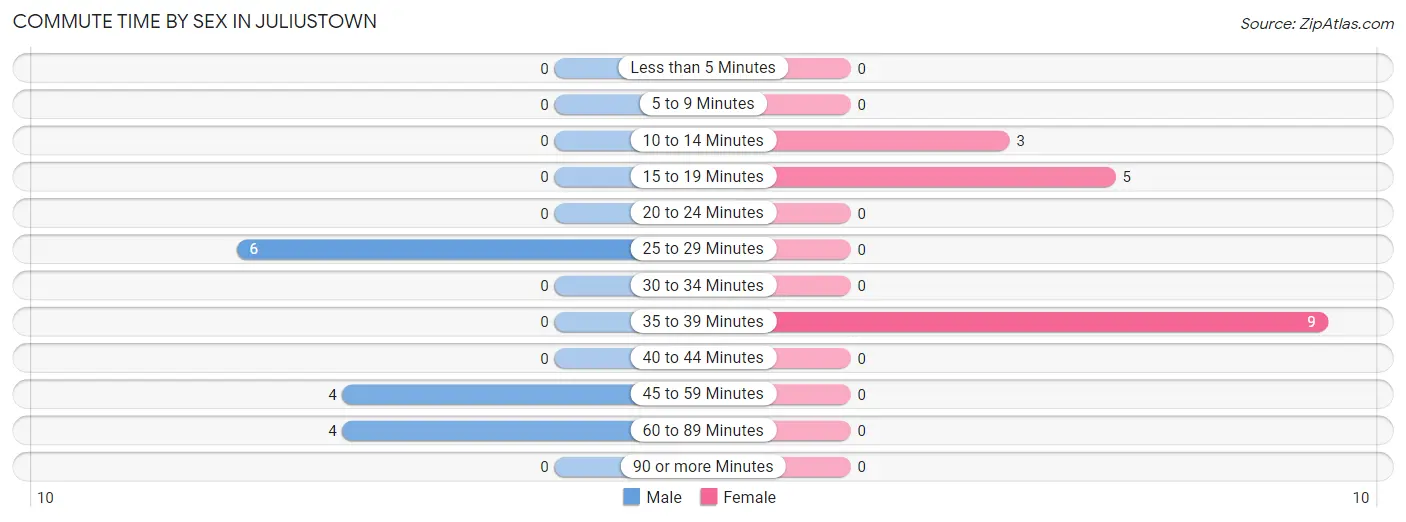
| Commute Time | Male | Female |
| Less than 5 Minutes | 0 (0.0%) | 0 (0.0%) |
| 5 to 9 Minutes | 0 (0.0%) | 0 (0.0%) |
| 10 to 14 Minutes | 0 (0.0%) | 3 (17.6%) |
| 15 to 19 Minutes | 0 (0.0%) | 5 (29.4%) |
| 20 to 24 Minutes | 0 (0.0%) | 0 (0.0%) |
| 25 to 29 Minutes | 6 (42.9%) | 0 (0.0%) |
| 30 to 34 Minutes | 0 (0.0%) | 0 (0.0%) |
| 35 to 39 Minutes | 0 (0.0%) | 9 (52.9%) |
| 40 to 44 Minutes | 0 (0.0%) | 0 (0.0%) |
| 45 to 59 Minutes | 4 (28.6%) | 0 (0.0%) |
| 60 to 89 Minutes | 4 (28.6%) | 0 (0.0%) |
| 90 or more Minutes | 0 (0.0%) | 0 (0.0%) |
Time of Departure to Work by Sex in Juliustown
The most frequent times of departure to work in Juliustown are 6:00 AM to 6:29 AM (6, 42.9%) for males and 7:30 AM to 7:59 AM (7, 41.2%) for females.
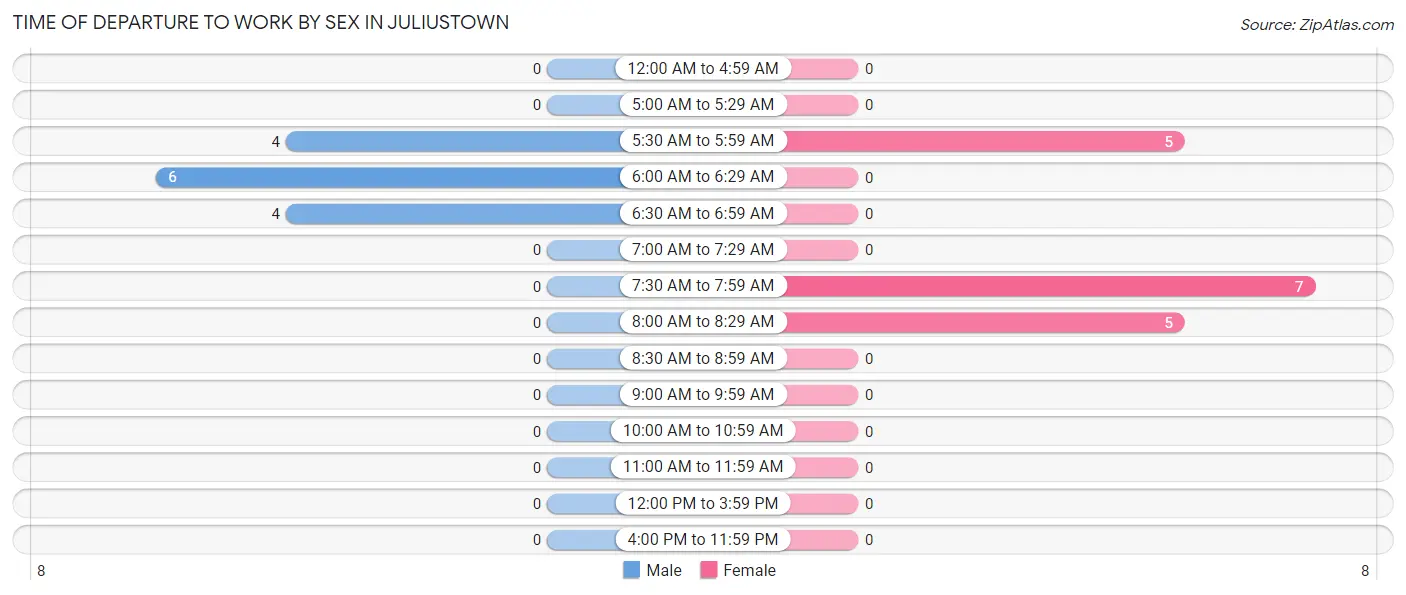
| Time of Departure | Male | Female |
| 12:00 AM to 4:59 AM | 0 (0.0%) | 0 (0.0%) |
| 5:00 AM to 5:29 AM | 0 (0.0%) | 0 (0.0%) |
| 5:30 AM to 5:59 AM | 4 (28.6%) | 5 (29.4%) |
| 6:00 AM to 6:29 AM | 6 (42.9%) | 0 (0.0%) |
| 6:30 AM to 6:59 AM | 4 (28.6%) | 0 (0.0%) |
| 7:00 AM to 7:29 AM | 0 (0.0%) | 0 (0.0%) |
| 7:30 AM to 7:59 AM | 0 (0.0%) | 7 (41.2%) |
| 8:00 AM to 8:29 AM | 0 (0.0%) | 5 (29.4%) |
| 8:30 AM to 8:59 AM | 0 (0.0%) | 0 (0.0%) |
| 9:00 AM to 9:59 AM | 0 (0.0%) | 0 (0.0%) |
| 10:00 AM to 10:59 AM | 0 (0.0%) | 0 (0.0%) |
| 11:00 AM to 11:59 AM | 0 (0.0%) | 0 (0.0%) |
| 12:00 PM to 3:59 PM | 0 (0.0%) | 0 (0.0%) |
| 4:00 PM to 11:59 PM | 0 (0.0%) | 0 (0.0%) |
| Total | 14 (100.0%) | 17 (100.0%) |
Housing Occupancy in Juliustown
Occupancy by Ownership in Juliustown
Of the total 39 dwellings in Juliustown, owner-occupied units account for 39 (100.0%), while renter-occupied units make up 0 (0.0%).
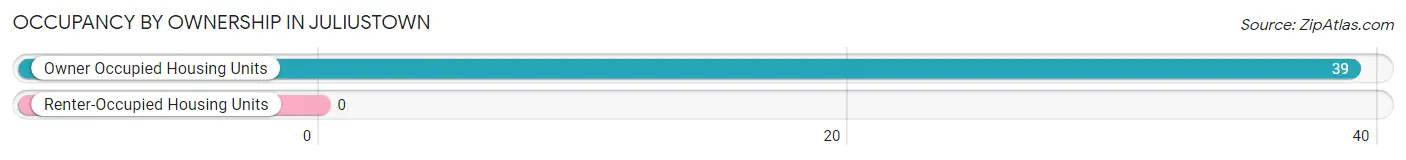
| Occupancy | # Housing Units | % Housing Units |
| Owner Occupied Housing Units | 39 | 100.0% |
| Renter-Occupied Housing Units | 0 | 0.0% |
| Total Occupied Housing Units | 39 | 100.0% |
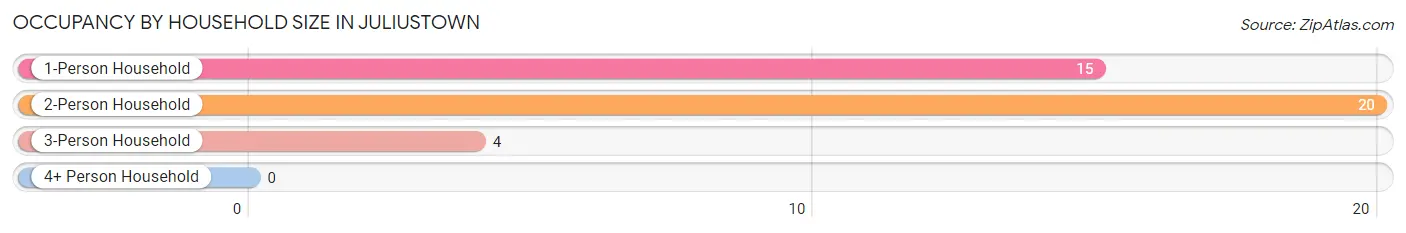
Occupancy by Household Size in Juliustown
| Household Size | # Housing Units | % Housing Units |
| 1-Person Household | 15 | 38.5% |
| 2-Person Household | 20 | 51.3% |
| 3-Person Household | 4 | 10.3% |
| 4+ Person Household | 0 | 0.0% |
| Total Housing Units | 39 | 100.0% |
Occupancy by Ownership by Household Size in Juliustown
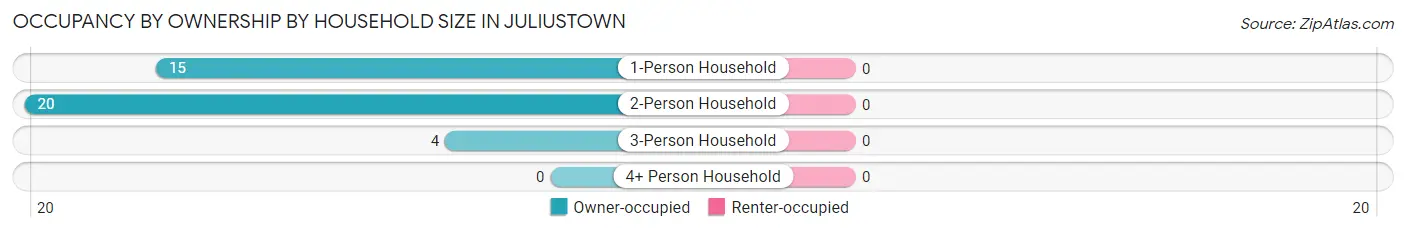
| Household Size | Owner-occupied | Renter-occupied |
| 1-Person Household | 15 (100.0%) | 0 (0.0%) |
| 2-Person Household | 20 (100.0%) | 0 (0.0%) |
| 3-Person Household | 4 (100.0%) | 0 (0.0%) |
| 4+ Person Household | 0 (0.0%) | 0 (0.0%) |
| Total Housing Units | 39 (100.0%) | 0 (0.0%) |
Occupancy by Educational Attainment in Juliustown
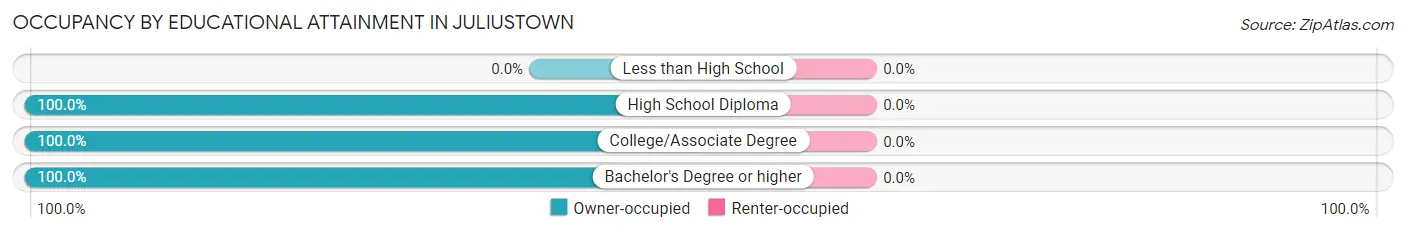
| Household Size | Owner-occupied | Renter-occupied |
| Less than High School | 0 (0.0%) | 0 (0.0%) |
| High School Diploma | 14 (100.0%) | 0 (0.0%) |
| College/Associate Degree | 16 (100.0%) | 0 (0.0%) |
| Bachelor's Degree or higher | 9 (100.0%) | 0 (0.0%) |
Occupancy by Age of Householder in Juliustown
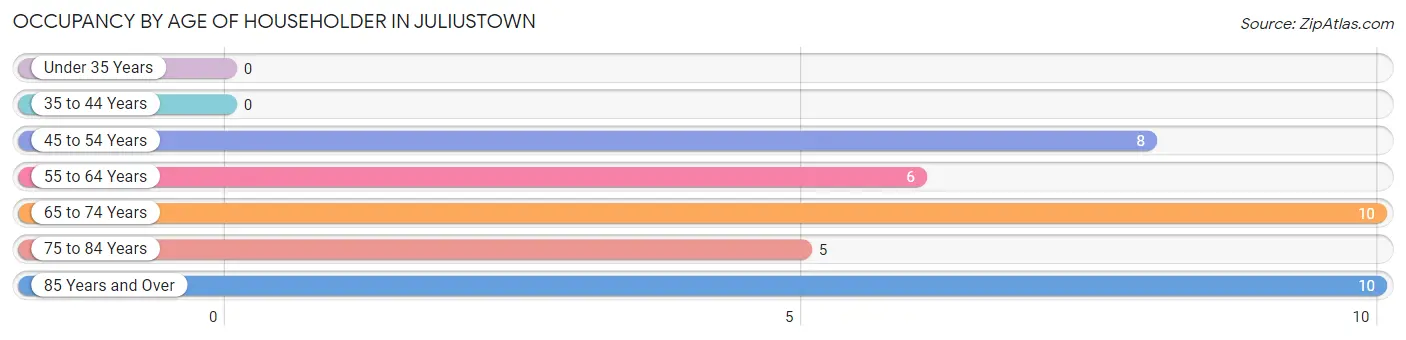
| Age Bracket | # Households | % Households |
| Under 35 Years | 0 | 0.0% |
| 35 to 44 Years | 0 | 0.0% |
| 45 to 54 Years | 8 | 20.5% |
| 55 to 64 Years | 6 | 15.4% |
| 65 to 74 Years | 10 | 25.6% |
| 75 to 84 Years | 5 | 12.8% |
| 85 Years and Over | 10 | 25.6% |
| Total | 39 | 100.0% |
Housing Finances in Juliustown
Median Income by Occupancy in Juliustown
| Occupancy Type | # Households | Median Income |
| Owner-Occupied | 39 (100.0%) | $0 |
| Renter-Occupied | 0 (0.0%) | $0 |
| Average | 39 (100.0%) | $0 |
Occupancy by Householder Income Bracket in Juliustown
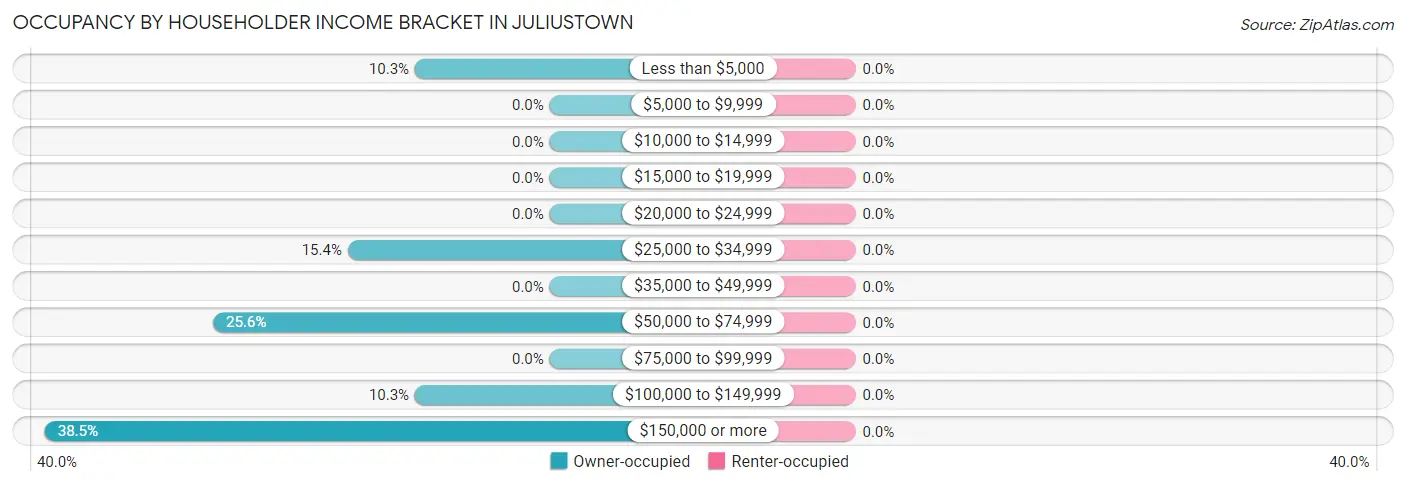
| Income Bracket | Owner-occupied | Renter-occupied |
| Less than $5,000 | 4 (10.3%) | 0 (0.0%) |
| $5,000 to $9,999 | 0 (0.0%) | 0 (0.0%) |
| $10,000 to $14,999 | 0 (0.0%) | 0 (0.0%) |
| $15,000 to $19,999 | 0 (0.0%) | 0 (0.0%) |
| $20,000 to $24,999 | 0 (0.0%) | 0 (0.0%) |
| $25,000 to $34,999 | 6 (15.4%) | 0 (0.0%) |
| $35,000 to $49,999 | 0 (0.0%) | 0 (0.0%) |
| $50,000 to $74,999 | 10 (25.6%) | 0 (0.0%) |
| $75,000 to $99,999 | 0 (0.0%) | 0 (0.0%) |
| $100,000 to $149,999 | 4 (10.3%) | 0 (0.0%) |
| $150,000 or more | 15 (38.5%) | 0 (0.0%) |
| Total | 39 (100.0%) | 0 (0.0%) |
Monthly Housing Cost Tiers in Juliustown
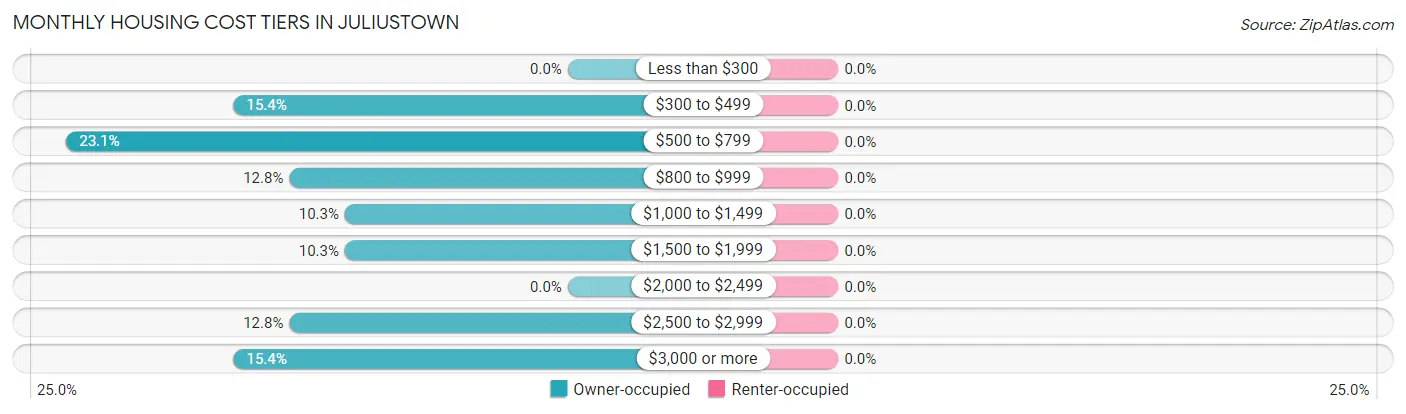
| Monthly Cost | Owner-occupied | Renter-occupied |
| Less than $300 | 0 (0.0%) | 0 (0.0%) |
| $300 to $499 | 6 (15.4%) | 0 (0.0%) |
| $500 to $799 | 9 (23.1%) | 0 (0.0%) |
| $800 to $999 | 5 (12.8%) | 0 (0.0%) |
| $1,000 to $1,499 | 4 (10.3%) | 0 (0.0%) |
| $1,500 to $1,999 | 4 (10.3%) | 0 (0.0%) |
| $2,000 to $2,499 | 0 (0.0%) | 0 (0.0%) |
| $2,500 to $2,999 | 5 (12.8%) | 0 (0.0%) |
| $3,000 or more | 6 (15.4%) | 0 (0.0%) |
| Total | 39 (100.0%) | 0 (0.0%) |
Physical Housing Characteristics in Juliustown
Housing Structures in Juliustown
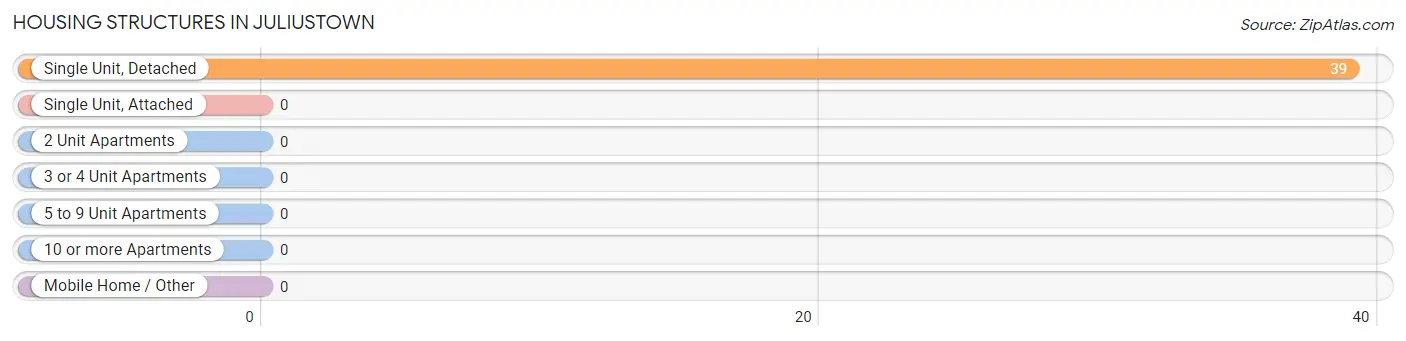
| Structure Type | # Housing Units | % Housing Units |
| Single Unit, Detached | 39 | 100.0% |
| Single Unit, Attached | 0 | 0.0% |
| 2 Unit Apartments | 0 | 0.0% |
| 3 or 4 Unit Apartments | 0 | 0.0% |
| 5 to 9 Unit Apartments | 0 | 0.0% |
| 10 or more Apartments | 0 | 0.0% |
| Mobile Home / Other | 0 | 0.0% |
| Total | 39 | 100.0% |
Housing Structures by Occupancy in Juliustown
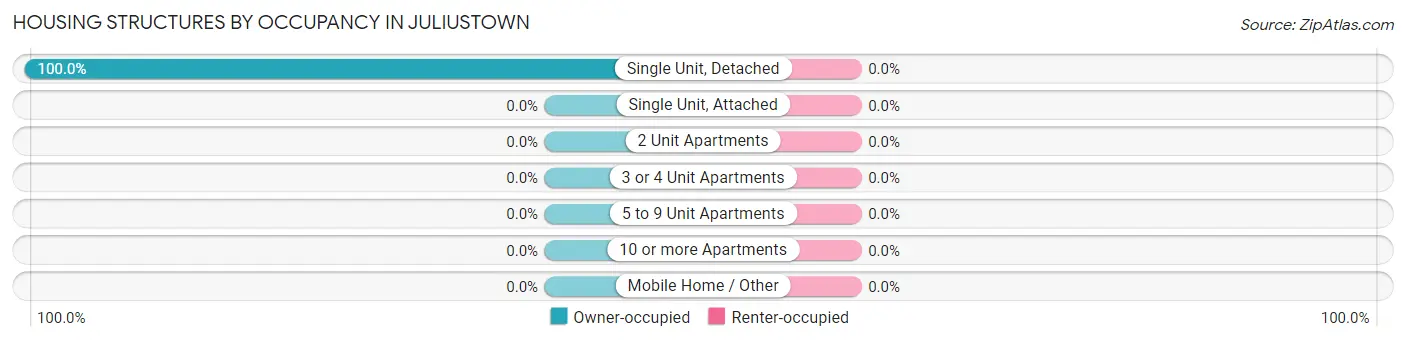
| Structure Type | Owner-occupied | Renter-occupied |
| Single Unit, Detached | 39 (100.0%) | 0 (0.0%) |
| Single Unit, Attached | 0 (0.0%) | 0 (0.0%) |
| 2 Unit Apartments | 0 (0.0%) | 0 (0.0%) |
| 3 or 4 Unit Apartments | 0 (0.0%) | 0 (0.0%) |
| 5 to 9 Unit Apartments | 0 (0.0%) | 0 (0.0%) |
| 10 or more Apartments | 0 (0.0%) | 0 (0.0%) |
| Mobile Home / Other | 0 (0.0%) | 0 (0.0%) |
| Total | 39 (100.0%) | 0 (0.0%) |
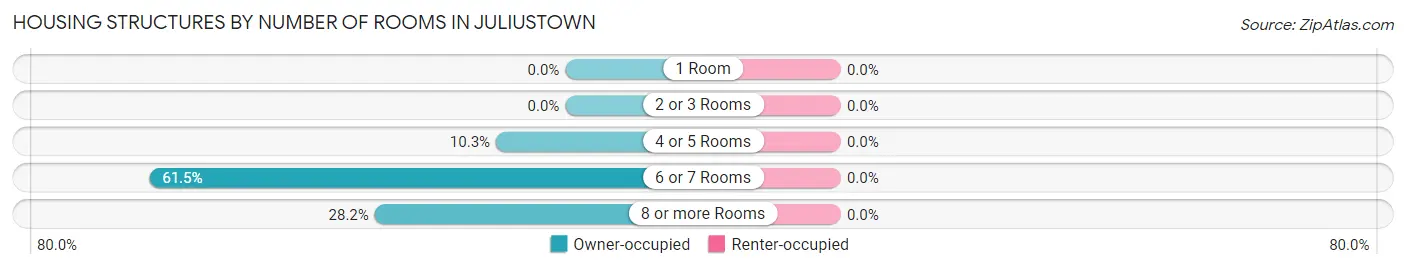
Housing Structures by Number of Rooms in Juliustown
| Number of Rooms | Owner-occupied | Renter-occupied |
| 1 Room | 0 (0.0%) | 0 (0.0%) |
| 2 or 3 Rooms | 0 (0.0%) | 0 (0.0%) |
| 4 or 5 Rooms | 4 (10.3%) | 0 (0.0%) |
| 6 or 7 Rooms | 24 (61.5%) | 0 (0.0%) |
| 8 or more Rooms | 11 (28.2%) | 0 (0.0%) |
| Total | 39 (100.0%) | 0 (0.0%) |
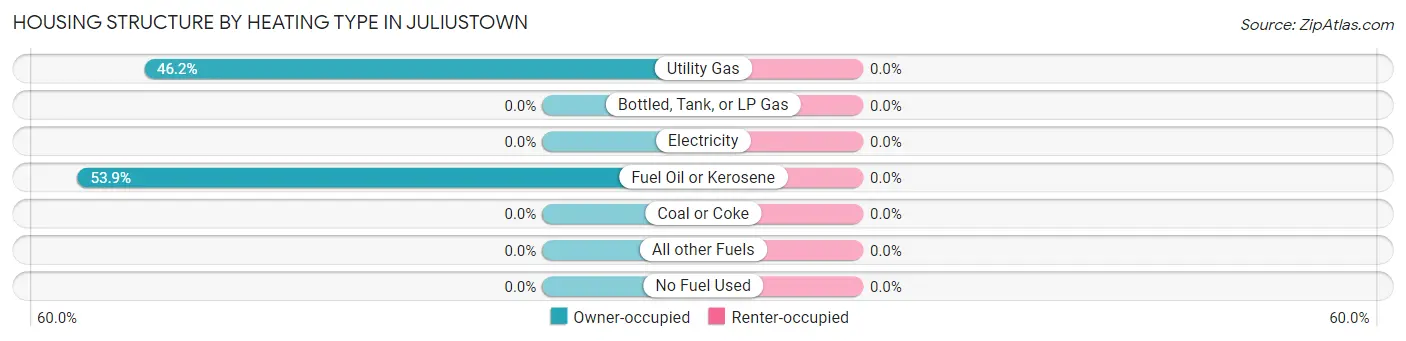
Housing Structure by Heating Type in Juliustown
| Heating Type | Owner-occupied | Renter-occupied |
| Utility Gas | 18 (46.2%) | 0 (0.0%) |
| Bottled, Tank, or LP Gas | 0 (0.0%) | 0 (0.0%) |
| Electricity | 0 (0.0%) | 0 (0.0%) |
| Fuel Oil or Kerosene | 21 (53.8%) | 0 (0.0%) |
| Coal or Coke | 0 (0.0%) | 0 (0.0%) |
| All other Fuels | 0 (0.0%) | 0 (0.0%) |
| No Fuel Used | 0 (0.0%) | 0 (0.0%) |
| Total | 39 (100.0%) | 0 (0.0%) |
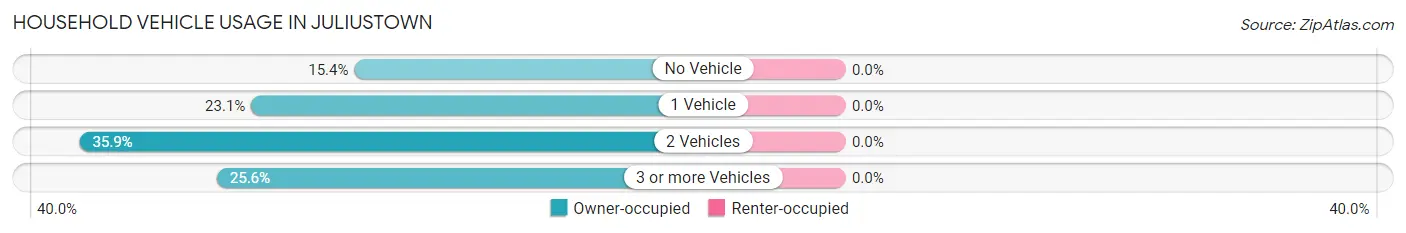
Household Vehicle Usage in Juliustown
| Vehicles per Household | Owner-occupied | Renter-occupied |
| No Vehicle | 6 (15.4%) | 0 (0.0%) |
| 1 Vehicle | 9 (23.1%) | 0 (0.0%) |
| 2 Vehicles | 14 (35.9%) | 0 (0.0%) |
| 3 or more Vehicles | 10 (25.6%) | 0 (0.0%) |
| Total | 39 (100.0%) | 0 (0.0%) |
Real Estate & Mortgages in Juliustown
Real Estate and Mortgage Overview in Juliustown
| Characteristic | Without Mortgage | With Mortgage |
| Housing Units | 20 | 19 |
| Median Property Value | $195,000 | $425,000 |
| Median Household Income | - | - |
| Monthly Housing Costs | $644 | $6 |
| Real Estate Taxes | $5,714 | $0 |
Property Value by Mortgage Status in Juliustown
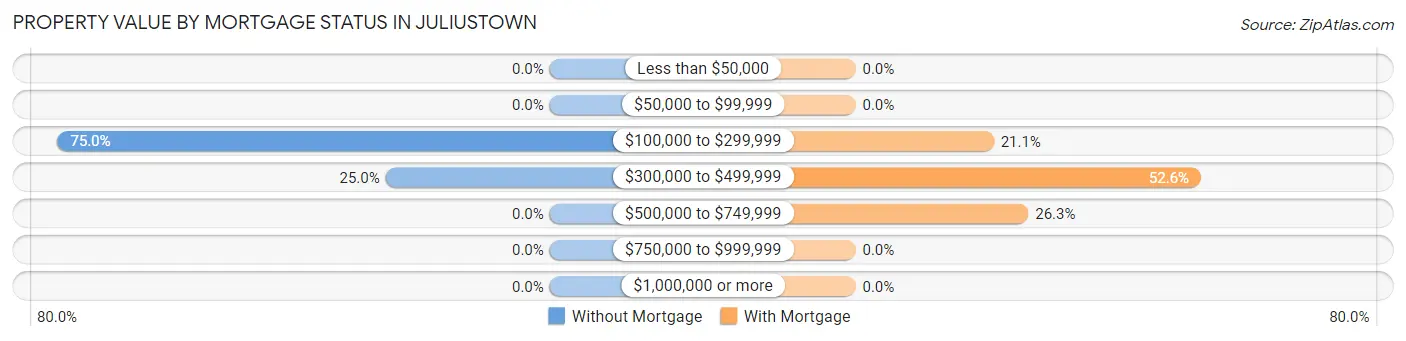
| Property Value | Without Mortgage | With Mortgage |
| Less than $50,000 | 0 (0.0%) | 0 (0.0%) |
| $50,000 to $99,999 | 0 (0.0%) | 0 (0.0%) |
| $100,000 to $299,999 | 15 (75.0%) | 4 (21.0%) |
| $300,000 to $499,999 | 5 (25.0%) | 10 (52.6%) |
| $500,000 to $749,999 | 0 (0.0%) | 5 (26.3%) |
| $750,000 to $999,999 | 0 (0.0%) | 0 (0.0%) |
| $1,000,000 or more | 0 (0.0%) | 0 (0.0%) |
| Total | 20 (100.0%) | 19 (100.0%) |
Household Income by Mortgage Status in Juliustown
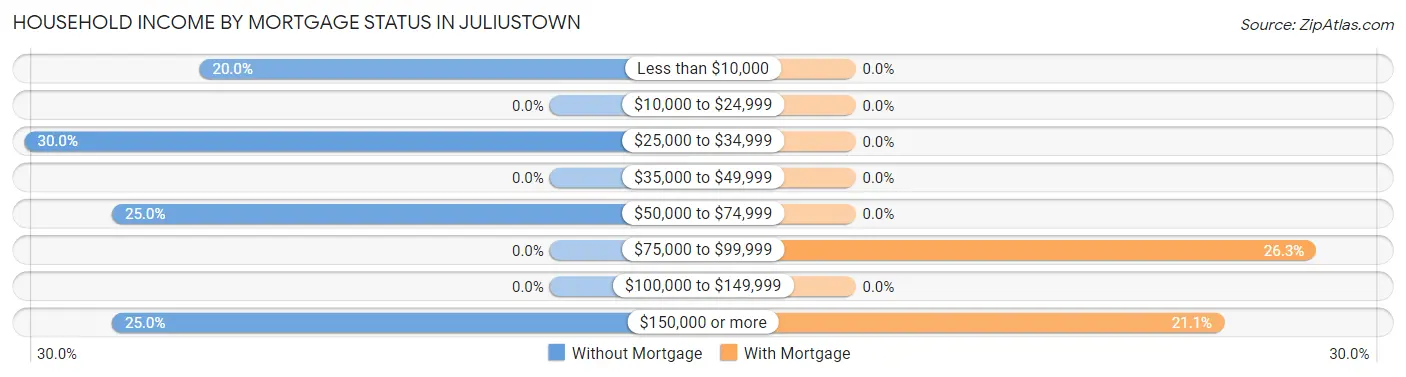
| Household Income | Without Mortgage | With Mortgage |
| Less than $10,000 | 4 (20.0%) | 0 (0.0%) |
| $10,000 to $24,999 | 0 (0.0%) | 0 (0.0%) |
| $25,000 to $34,999 | 6 (30.0%) | 0 (0.0%) |
| $35,000 to $49,999 | 0 (0.0%) | 0 (0.0%) |
| $50,000 to $74,999 | 5 (25.0%) | 0 (0.0%) |
| $75,000 to $99,999 | 0 (0.0%) | 5 (26.3%) |
| $100,000 to $149,999 | 0 (0.0%) | 0 (0.0%) |
| $150,000 or more | 5 (25.0%) | 4 (21.0%) |
| Total | 20 (100.0%) | 19 (100.0%) |
Property Value to Household Income Ratio in Juliustown
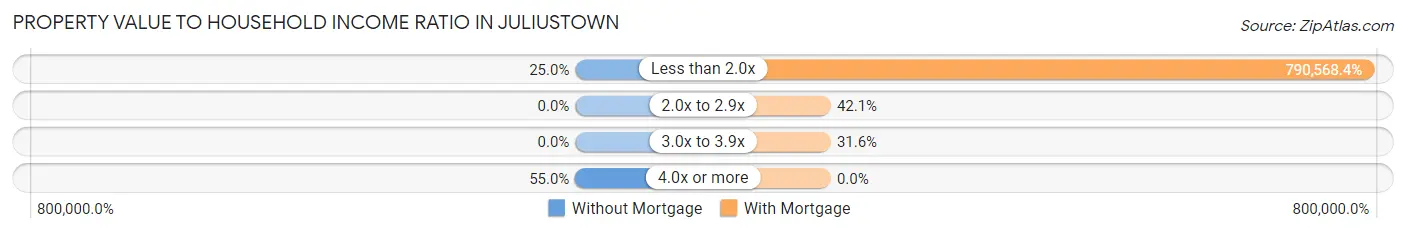
| Value-to-Income Ratio | Without Mortgage | With Mortgage |
| Less than 2.0x | 5 (25.0%) | 150,208 (790,568.4%) |
| 2.0x to 2.9x | 0 (0.0%) | 8 (42.1%) |
| 3.0x to 3.9x | 0 (0.0%) | 6 (31.6%) |
| 4.0x or more | 11 (55.0%) | 0 (0.0%) |
| Total | 20 (100.0%) | 19 (100.0%) |
Real Estate Taxes by Mortgage Status in Juliustown
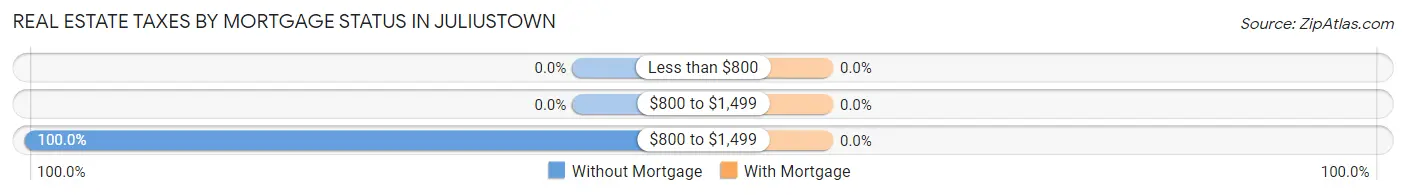
| Property Taxes | Without Mortgage | With Mortgage |
| Less than $800 | 0 (0.0%) | 0 (0.0%) |
| $800 to $1,499 | 0 (0.0%) | 0 (0.0%) |
| $800 to $1,499 | 20 (100.0%) | 0 (0.0%) |
| Total | 20 (100.0%) | 19 (100.0%) |
Health & Disability in Juliustown
Health Insurance Coverage by Age in Juliustown
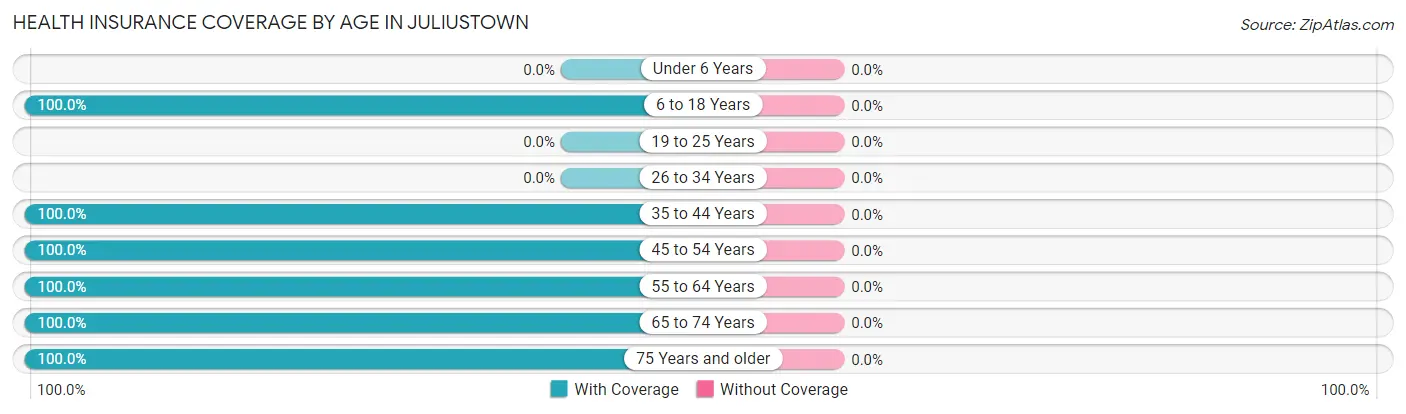
| Age Bracket | With Coverage | Without Coverage |
| Under 6 Years | 0 (0.0%) | 0 (0.0%) |
| 6 to 18 Years | 4 (100.0%) | 0 (0.0%) |
| 19 to 25 Years | 0 (0.0%) | 0 (0.0%) |
| 26 to 34 Years | 0 (0.0%) | 0 (0.0%) |
| 35 to 44 Years | 4 (100.0%) | 0 (0.0%) |
| 45 to 54 Years | 16 (100.0%) | 0 (0.0%) |
| 55 to 64 Years | 6 (100.0%) | 0 (0.0%) |
| 65 to 74 Years | 16 (100.0%) | 0 (0.0%) |
| 75 Years and older | 21 (100.0%) | 0 (0.0%) |
| Total | 67 (100.0%) | 0 (0.0%) |
Health Insurance Coverage by Citizenship Status in Juliustown
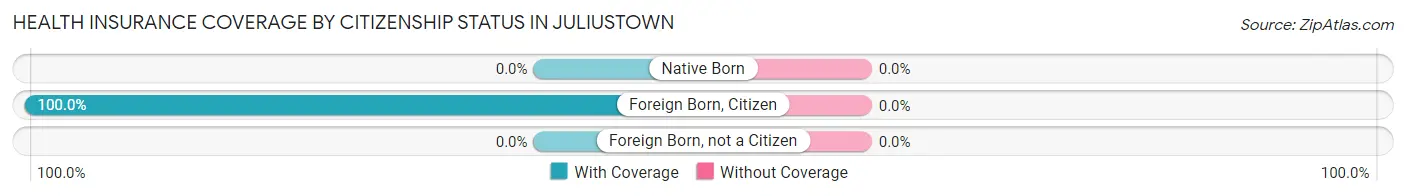
| Citizenship Status | With Coverage | Without Coverage |
| Native Born | 0 (0.0%) | 0 (0.0%) |
| Foreign Born, Citizen | 4 (100.0%) | 0 (0.0%) |
| Foreign Born, not a Citizen | 0 (0.0%) | 0 (0.0%) |
Health Insurance Coverage by Household Income in Juliustown
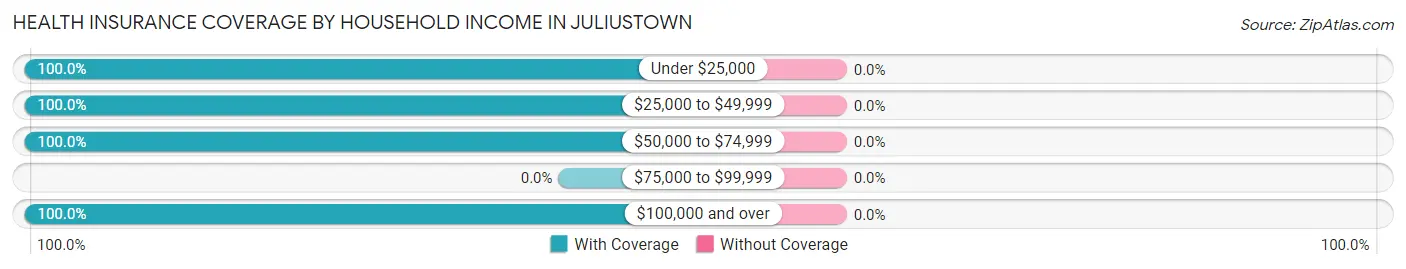
| Household Income | With Coverage | Without Coverage |
| Under $25,000 | 4 (100.0%) | 0 (0.0%) |
| $25,000 to $49,999 | 6 (100.0%) | 0 (0.0%) |
| $50,000 to $74,999 | 16 (100.0%) | 0 (0.0%) |
| $75,000 to $99,999 | 0 (0.0%) | 0 (0.0%) |
| $100,000 and over | 41 (100.0%) | 0 (0.0%) |
Public vs Private Health Insurance Coverage by Age in Juliustown
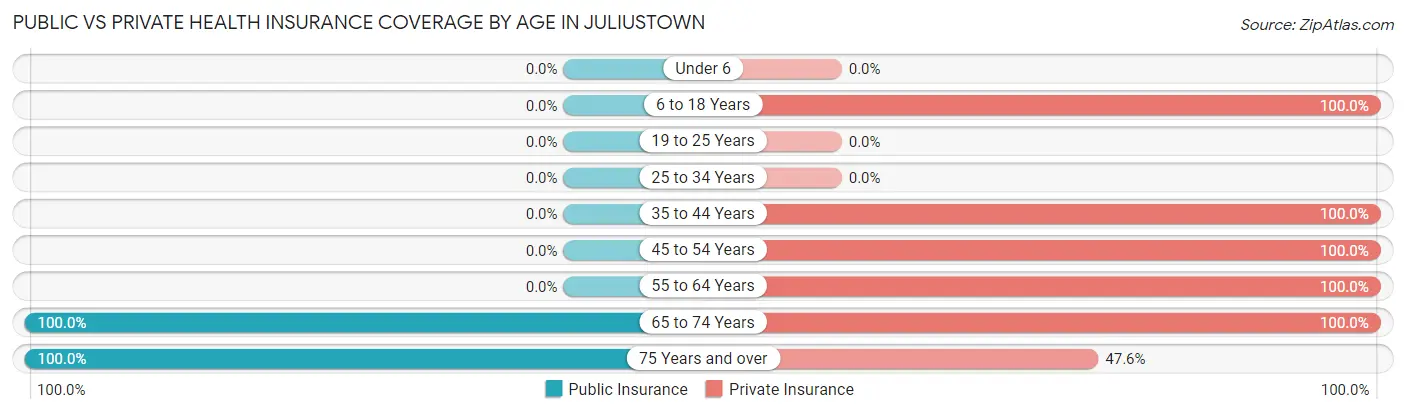
| Age Bracket | Public Insurance | Private Insurance |
| Under 6 | 0 (0.0%) | 0 (0.0%) |
| 6 to 18 Years | 0 (0.0%) | 4 (100.0%) |
| 19 to 25 Years | 0 (0.0%) | 0 (0.0%) |
| 25 to 34 Years | 0 (0.0%) | 0 (0.0%) |
| 35 to 44 Years | 0 (0.0%) | 4 (100.0%) |
| 45 to 54 Years | 0 (0.0%) | 16 (100.0%) |
| 55 to 64 Years | 0 (0.0%) | 6 (100.0%) |
| 65 to 74 Years | 16 (100.0%) | 16 (100.0%) |
| 75 Years and over | 21 (100.0%) | 10 (47.6%) |
| Total | 37 (55.2%) | 56 (83.6%) |
Disability Status by Sex by Age in Juliustown
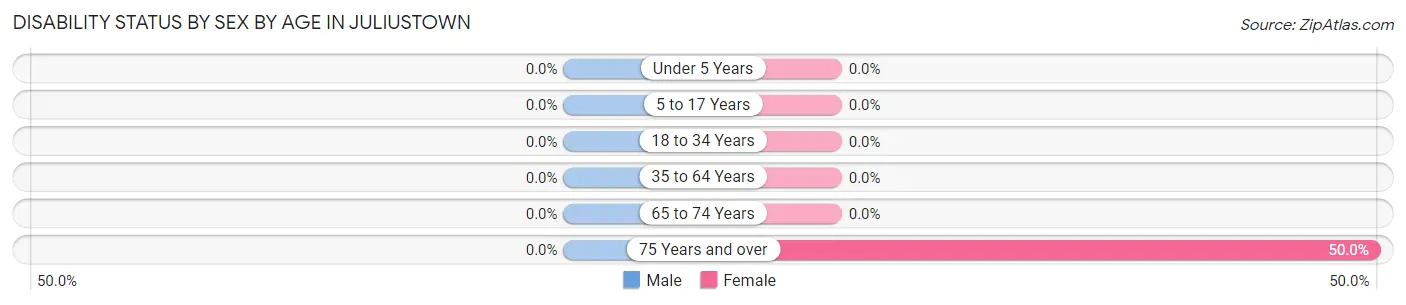
| Age Bracket | Male | Female |
| Under 5 Years | 0 (0.0%) | 0 (0.0%) |
| 5 to 17 Years | 0 (0.0%) | 0 (0.0%) |
| 18 to 34 Years | 0 (0.0%) | 0 (0.0%) |
| 35 to 64 Years | 0 (0.0%) | 0 (0.0%) |
| 65 to 74 Years | 0 (0.0%) | 0 (0.0%) |
| 75 Years and over | 0 (0.0%) | 6 (50.0%) |
Disability Class by Sex by Age in Juliustown
Disability Class: Hearing Difficulty
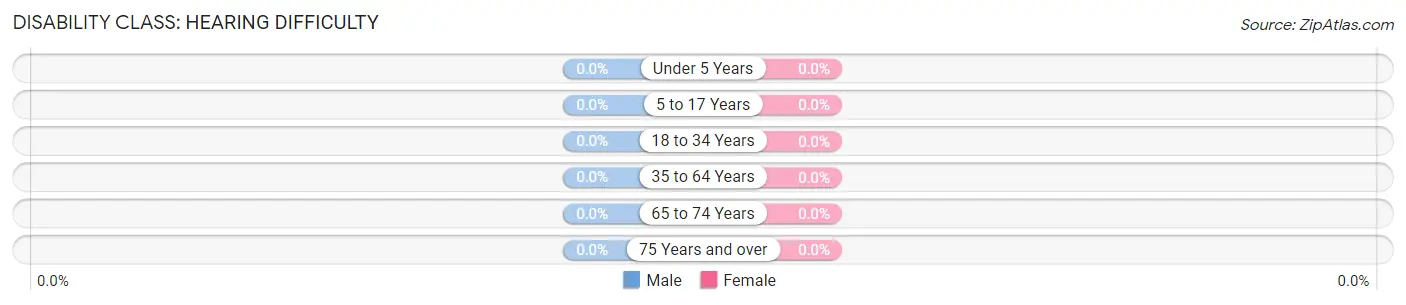
| Age Bracket | Male | Female |
| Under 5 Years | 0 (0.0%) | 0 (0.0%) |
| 5 to 17 Years | 0 (0.0%) | 0 (0.0%) |
| 18 to 34 Years | 0 (0.0%) | 0 (0.0%) |
| 35 to 64 Years | 0 (0.0%) | 0 (0.0%) |
| 65 to 74 Years | 0 (0.0%) | 0 (0.0%) |
| 75 Years and over | 0 (0.0%) | 0 (0.0%) |
Disability Class: Vision Difficulty
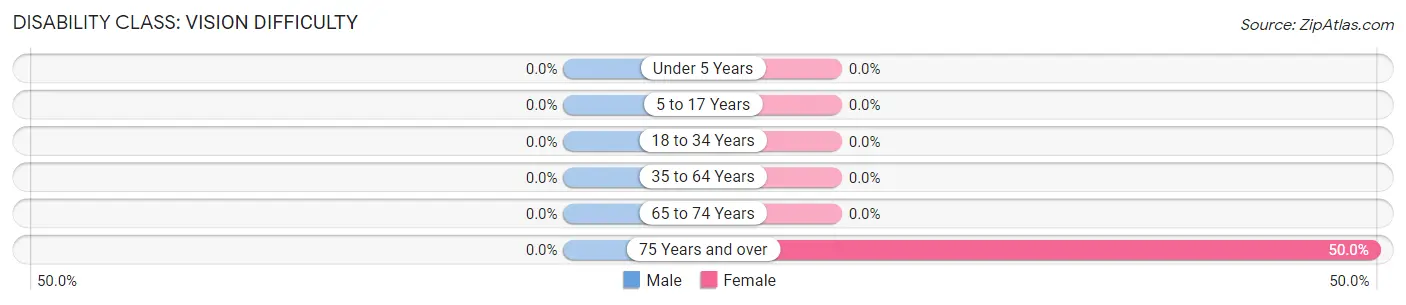
| Age Bracket | Male | Female |
| Under 5 Years | 0 (0.0%) | 0 (0.0%) |
| 5 to 17 Years | 0 (0.0%) | 0 (0.0%) |
| 18 to 34 Years | 0 (0.0%) | 0 (0.0%) |
| 35 to 64 Years | 0 (0.0%) | 0 (0.0%) |
| 65 to 74 Years | 0 (0.0%) | 0 (0.0%) |
| 75 Years and over | 0 (0.0%) | 6 (50.0%) |
Disability Class: Cognitive Difficulty

| Age Bracket | Male | Female |
| 5 to 17 Years | 0 (0.0%) | 0 (0.0%) |
| 18 to 34 Years | 0 (0.0%) | 0 (0.0%) |
| 35 to 64 Years | 0 (0.0%) | 0 (0.0%) |
| 65 to 74 Years | 0 (0.0%) | 0 (0.0%) |
| 75 Years and over | 0 (0.0%) | 0 (0.0%) |
Disability Class: Ambulatory Difficulty
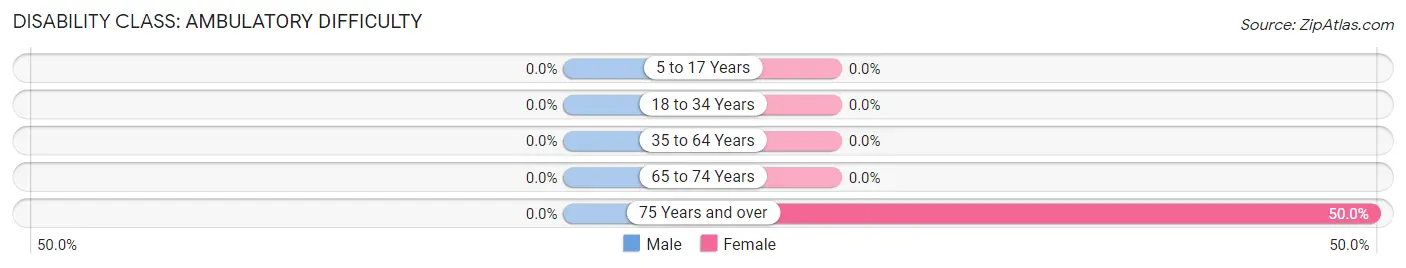
| Age Bracket | Male | Female |
| 5 to 17 Years | 0 (0.0%) | 0 (0.0%) |
| 18 to 34 Years | 0 (0.0%) | 0 (0.0%) |
| 35 to 64 Years | 0 (0.0%) | 0 (0.0%) |
| 65 to 74 Years | 0 (0.0%) | 0 (0.0%) |
| 75 Years and over | 0 (0.0%) | 6 (50.0%) |
Disability Class: Self-Care Difficulty
| Age Bracket | Male | Female |
| 5 to 17 Years | 0 (0.0%) | 0 (0.0%) |
| 18 to 34 Years | 0 (0.0%) | 0 (0.0%) |
| 35 to 64 Years | 0 (0.0%) | 0 (0.0%) |
| 65 to 74 Years | 0 (0.0%) | 0 (0.0%) |
| 75 Years and over | 0 (0.0%) | 0 (0.0%) |
Technology Access in Juliustown
Computing Device Access in Juliustown
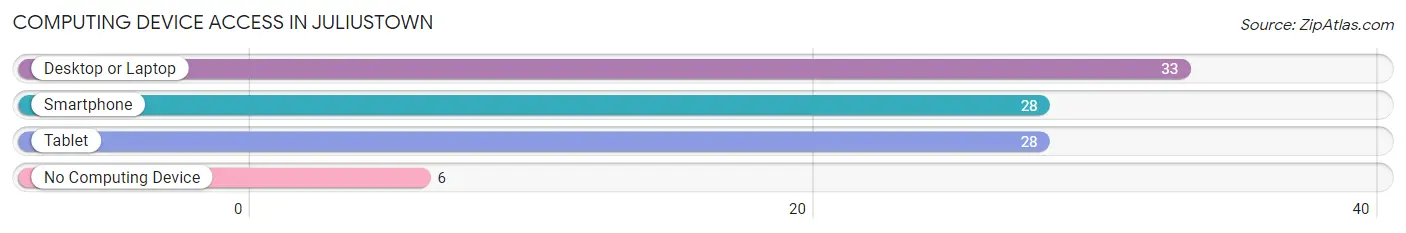
| Device Type | # Households | % Households |
| Desktop or Laptop | 33 | 84.6% |
| Smartphone | 28 | 71.8% |
| Tablet | 28 | 71.8% |
| No Computing Device | 6 | 15.4% |
| Total | 39 | 100.0% |
Internet Access in Juliustown
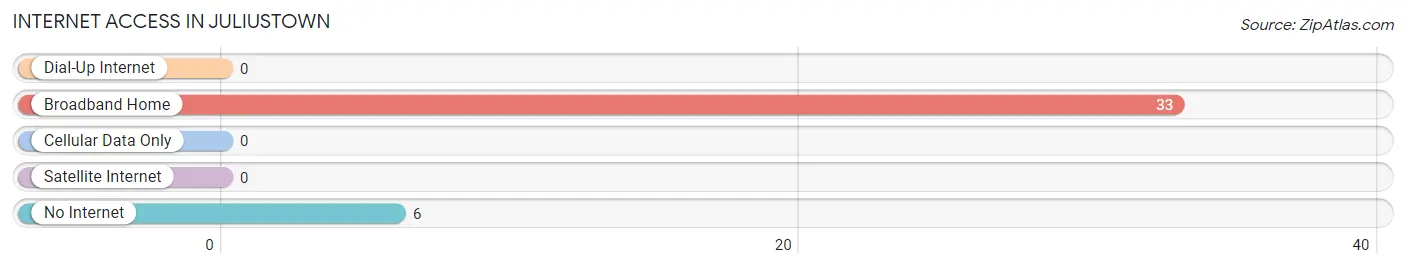
| Internet Type | # Households | % Households |
| Dial-Up Internet | 0 | 0.0% |
| Broadband Home | 33 | 84.6% |
| Cellular Data Only | 0 | 0.0% |
| Satellite Internet | 0 | 0.0% |
| No Internet | 6 | 15.4% |
| Total | 39 | 100.0% |
Juliustown Summary
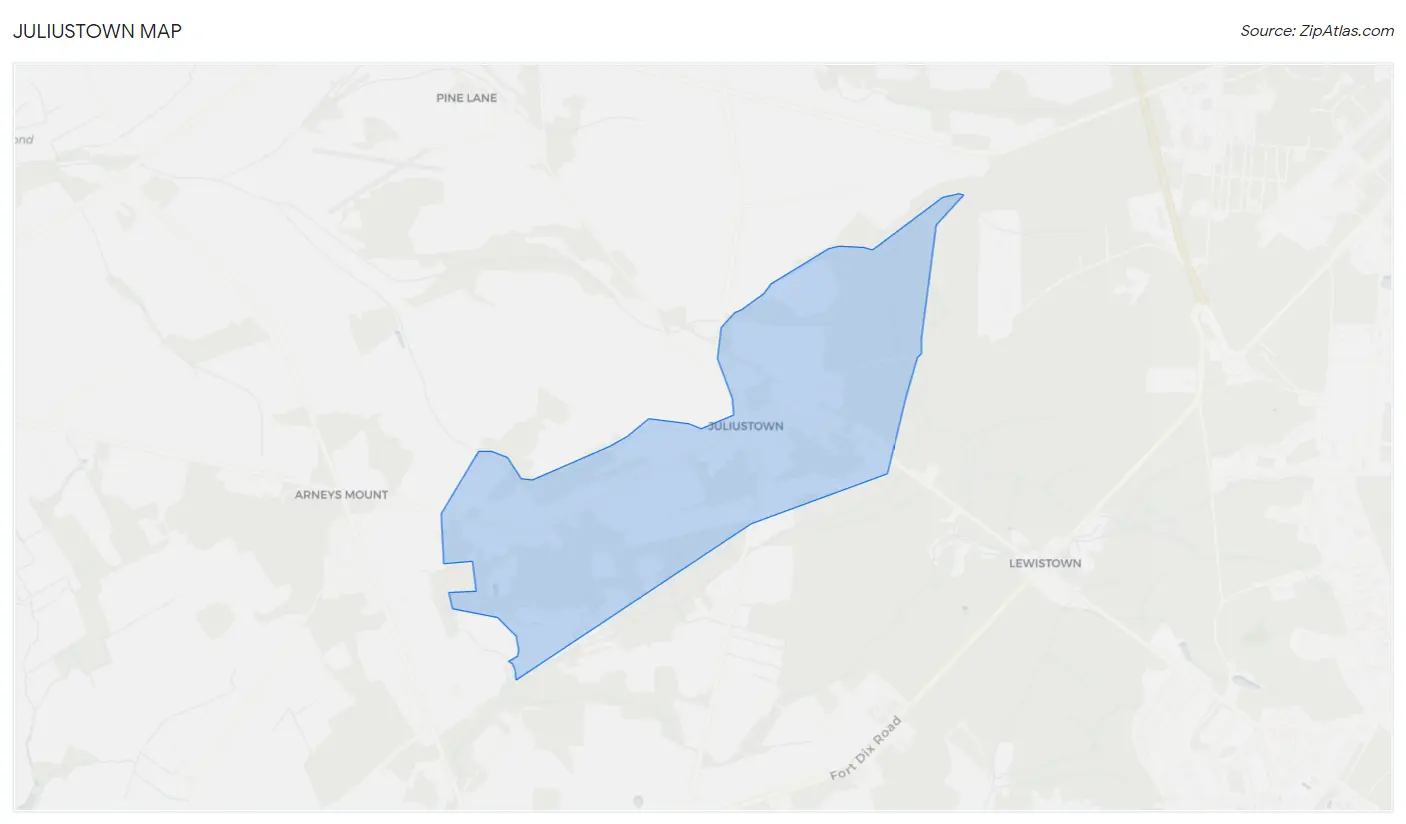
Juliustown, NJ is a small unincorporated community located in Burlington County, New Jersey. It is situated in the northern part of the county, just south of the city of Mount Holly. The community is bordered by the townships of North Hanover, Eastampton, and Pemberton. Juliustown is a rural area with a population of just over 1,000 people.
History
Juliustown was founded in 1790 by John Julius, a Quaker from Philadelphia. Julius purchased a large tract of land in the area and began to develop it into a farming community. The town was named after him and was incorporated in 1845.
Juliustown was a small farming community for much of its history. The town was home to a number of small businesses, including a general store, a blacksmith, and a post office. The town also had a school, which was built in 1876.
Geography
Juliustown is located in the northern part of Burlington County, New Jersey. It is situated in the Pine Barrens, a large area of pine forests and wetlands. The town is bordered by the townships of North Hanover, Eastampton, and Pemberton.
The town is located on the edge of the Rancocas Creek, which flows through the area. The creek is a popular spot for fishing and canoeing. The town is also home to a number of small lakes, including Lake Juliustown and Lake Pemberton.
Economy
Juliustown is a small, rural community with a limited economy. The town is home to a number of small businesses, including a general store, a blacksmith, and a post office. The town also has a few small farms, which produce a variety of crops, including corn, soybeans, and hay.
The town is also home to a number of small manufacturing businesses, including a furniture factory and a plastics factory. The town is also home to a number of small service businesses, including a landscaping company and a plumbing company.
Demographics
As of the 2010 census, Juliustown had a population of 1,072 people. The racial makeup of the town was 94.3% White, 2.7% African American, 0.3% Native American, 0.7% Asian, and 1.9% from other races. The median household income in the town was $50,000, and the median family income was $60,000.
The town is home to a number of churches, including the Juliustown United Methodist Church, the Juliustown Presbyterian Church, and the Juliustown Baptist Church. The town is also home to a number of civic organizations, including the Juliustown Lions Club and the Juliustown Historical Society.
Conclusion
Juliustown, NJ is a small, rural community located in Burlington County, New Jersey. The town was founded in 1790 by John Julius and was incorporated in 1845. The town is home to a number of small businesses, including a general store, a blacksmith, and a post office. The town is also home to a number of small farms, manufacturing businesses, and service businesses. As of the 2010 census, Juliustown had a population of 1,072 people. The town is home to a number of churches and civic organizations.
Common Questions
What is Per Capita Income in Juliustown?
Per Capita income in Juliustown is $60,400.
What is the Median Family Income in Juliustown?
Median Family Income in Juliustown is $151,250.
What is Inequality or Gini Index in Juliustown?
Inequality or Gini Index in Juliustown is 0.39.
What is the Total Population of Juliustown?
Total Population of Juliustown is 67.
What is the Total Male Population of Juliustown?
Total Male Population of Juliustown is 29.
What is the Total Female Population of Juliustown?
Total Female Population of Juliustown is 38.
What is the Ratio of Males per 100 Females in Juliustown?
There are 76.32 Males per 100 Females in Juliustown.
What is the Ratio of Females per 100 Males in Juliustown?
There are 131.03 Females per 100 Males in Juliustown.
What is the Median Population Age in Juliustown?
Median Population Age in Juliustown is 70.7 Years.
What is the Average Family Size in Juliustown
Average Family Size in Juliustown is 2.2 People.
What is the Average Household Size in Juliustown
Average Household Size in Juliustown is 1.7 People.
How Large is the Labor Force in Juliustown?
There are 31 People in the Labor Forcein in Juliustown.
What is the Percentage of People in the Labor Force in Juliustown?
49.2% of People are in the Labor Force in Juliustown.