Garwood borough, NJ Map & Demographics
Garwood borough Overview
$55,478
PER CAPITA INCOME
$142,829
AVG FAMILY INCOME
$107,823
AVG HOUSEHOLD INCOME
9.2%
WAGE / INCOME GAP [ % ]
90.8¢/ $1
WAGE / INCOME GAP [ $ ]
0.41
INEQUALITY / GINI INDEX
4,542
TOTAL POPULATION
2,467
MALE POPULATION
2,075
FEMALE POPULATION
118.89
MALES / 100 FEMALES
84.11
FEMALES / 100 MALES
41.5
MEDIAN AGE
3.1
AVG FAMILY SIZE
2.3
AVG HOUSEHOLD SIZE
2,717
LABOR FORCE [ PEOPLE ]
70.0%
PERCENT IN LABOR FORCE
6.0%
UNEMPLOYMENT RATE
Income in Garwood borough
Income Overview in Garwood borough
Per Capita Income in Garwood borough is $55,478, while median incomes of families and households are $142,829 and $107,823 respectively.
| Characteristic | Number | Measure |
| Per Capita Income | 4,542 | $55,478 |
| Median Family Income | 1,190 | $142,829 |
| Mean Family Income | 1,190 | $160,661 |
| Median Household Income | 1,956 | $107,823 |
| Mean Household Income | 1,956 | $128,257 |
| Income Deficit | 1,190 | $0 |
| Wage / Income Gap (%) | 4,542 | 9.18% |
| Wage / Income Gap ($) | 4,542 | 90.82¢ per $1 |
| Gini / Inequality Index | 4,542 | 0.41 |
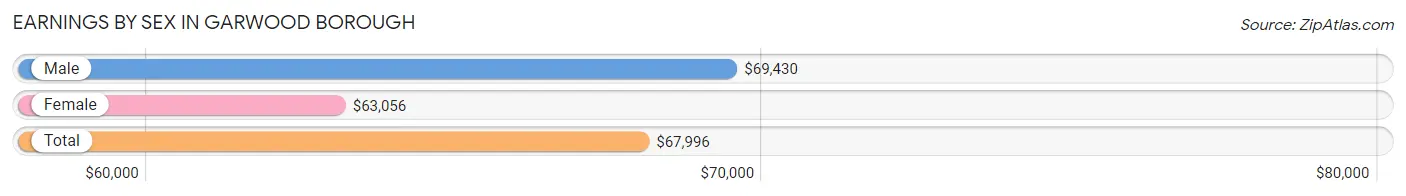
Earnings by Sex in Garwood borough
Average Earnings in Garwood borough are $67,996, $69,430 for men and $63,056 for women, a difference of 9.2%.
| Sex | Number | Average Earnings |
| Male | 1,641 (60.6%) | $69,430 |
| Female | 1,068 (39.4%) | $63,056 |
| Total | 2,709 (100.0%) | $67,996 |
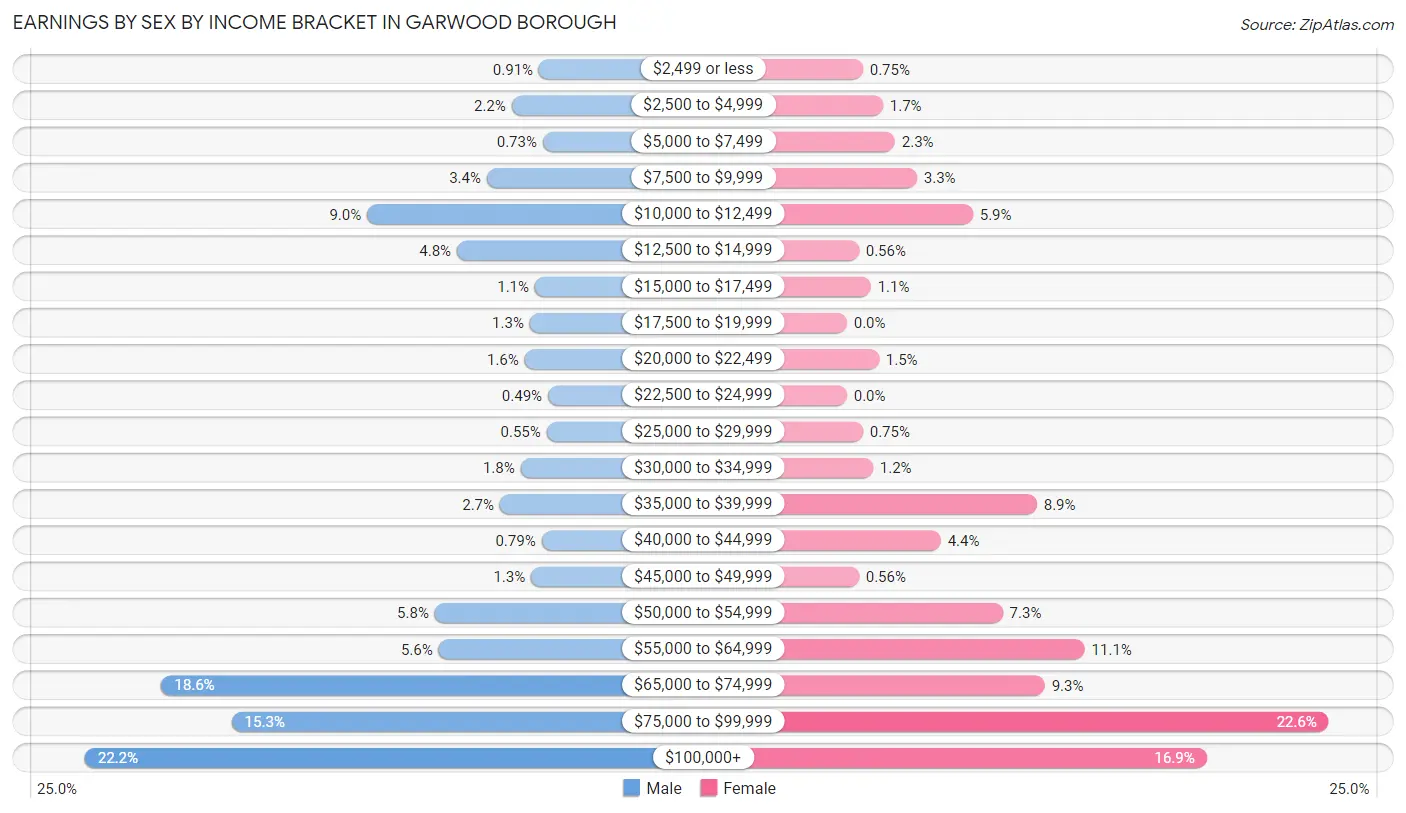
Earnings by Sex by Income Bracket in Garwood borough
The most common earnings brackets in Garwood borough are $100,000+ for men (364 | 22.2%) and $75,000 to $99,999 for women (241 | 22.6%).
| Income | Male | Female |
| $2,499 or less | 15 (0.9%) | 8 (0.7%) |
| $2,500 to $4,999 | 36 (2.2%) | 18 (1.7%) |
| $5,000 to $7,499 | 12 (0.7%) | 24 (2.2%) |
| $7,500 to $9,999 | 55 (3.4%) | 35 (3.3%) |
| $10,000 to $12,499 | 147 (9.0%) | 63 (5.9%) |
| $12,500 to $14,999 | 78 (4.8%) | 6 (0.6%) |
| $15,000 to $17,499 | 18 (1.1%) | 12 (1.1%) |
| $17,500 to $19,999 | 22 (1.3%) | 0 (0.0%) |
| $20,000 to $22,499 | 26 (1.6%) | 16 (1.5%) |
| $22,500 to $24,999 | 8 (0.5%) | 0 (0.0%) |
| $25,000 to $29,999 | 9 (0.5%) | 8 (0.7%) |
| $30,000 to $34,999 | 29 (1.8%) | 13 (1.2%) |
| $35,000 to $39,999 | 45 (2.7%) | 95 (8.9%) |
| $40,000 to $44,999 | 13 (0.8%) | 47 (4.4%) |
| $45,000 to $49,999 | 21 (1.3%) | 6 (0.6%) |
| $50,000 to $54,999 | 95 (5.8%) | 78 (7.3%) |
| $55,000 to $64,999 | 92 (5.6%) | 119 (11.1%) |
| $65,000 to $74,999 | 305 (18.6%) | 99 (9.3%) |
| $75,000 to $99,999 | 251 (15.3%) | 241 (22.6%) |
| $100,000+ | 364 (22.2%) | 180 (16.9%) |
| Total | 1,641 (100.0%) | 1,068 (100.0%) |
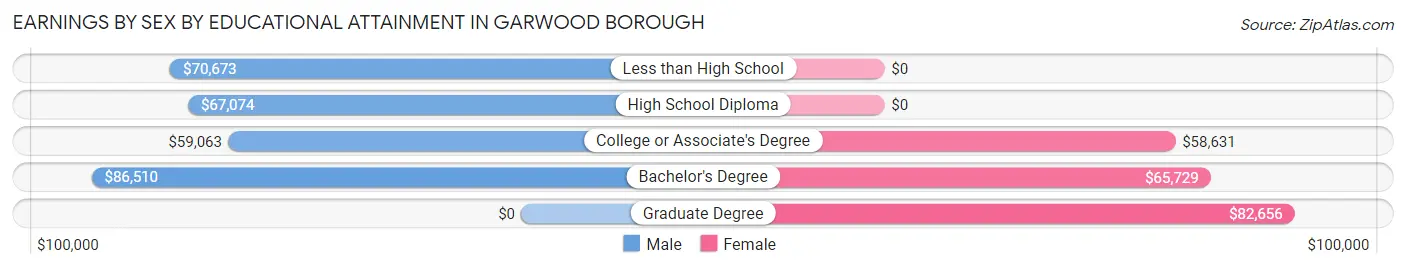
Earnings by Sex by Educational Attainment in Garwood borough
Average earnings in Garwood borough are $71,379 for men and $65,050 for women, a difference of 8.9%. Men with an educational attainment of bachelor's degree enjoy the highest average annual earnings of $86,510, while those with college or associate's degree education earn the least with $59,063. Women with an educational attainment of graduate degree earn the most with the average annual earnings of $82,656, while those with college or associate's degree education have the smallest earnings of $58,631.
| Educational Attainment | Male Income | Female Income |
| Less than High School | $70,673 | $0 |
| High School Diploma | $67,074 | $0 |
| College or Associate's Degree | $59,063 | $58,631 |
| Bachelor's Degree | $86,510 | $65,729 |
| Graduate Degree | - | - |
| Total | $71,379 | $65,050 |
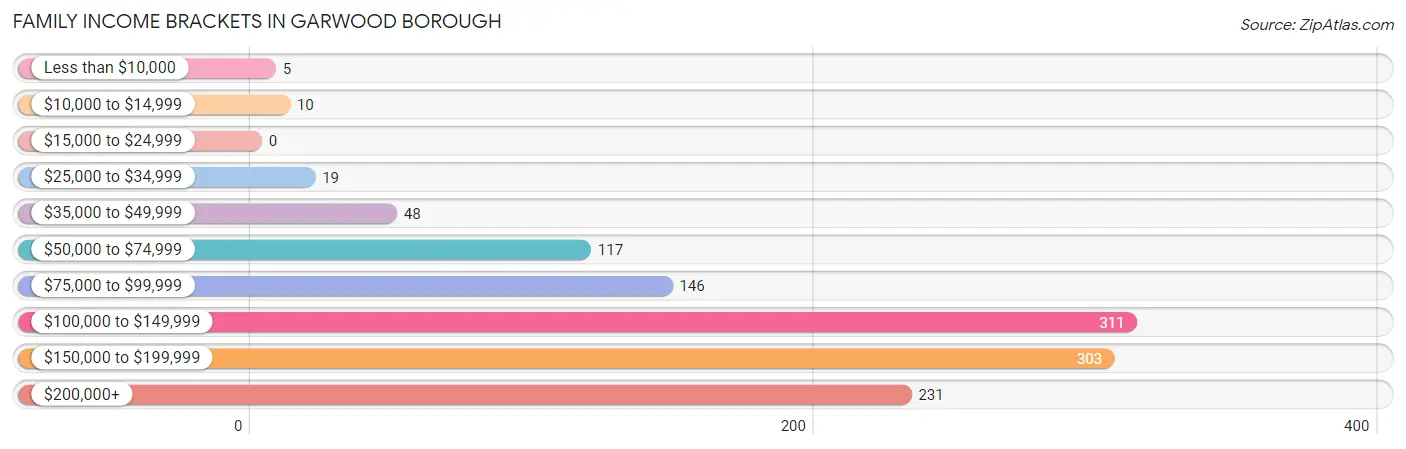
Family Income in Garwood borough
Family Income Brackets in Garwood borough
According to the Garwood borough family income data, there are 311 families falling into the $100,000 to $149,999 income range, which is the most common income bracket and makes up 26.1% of all families.
| Income Bracket | # Families | % Families |
| Less than $10,000 | 5 | 0.4% |
| $10,000 to $14,999 | 10 | 0.8% |
| $15,000 to $24,999 | 0 | 0.0% |
| $25,000 to $34,999 | 19 | 1.6% |
| $35,000 to $49,999 | 48 | 4.0% |
| $50,000 to $74,999 | 117 | 9.8% |
| $75,000 to $99,999 | 146 | 12.3% |
| $100,000 to $149,999 | 311 | 26.1% |
| $150,000 to $199,999 | 303 | 25.5% |
| $200,000+ | 231 | 19.4% |
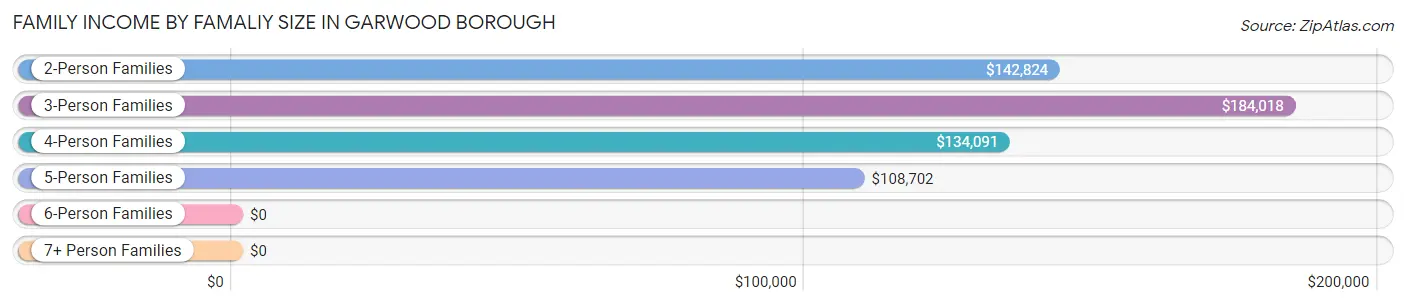
Family Income by Famaliy Size in Garwood borough
3-person families (253 | 21.3%) account for the highest median family income in Garwood borough with $184,018 per family, while 2-person families (533 | 44.8%) have the highest median income of $71,412 per family member.
| Income Bracket | # Families | Median Income |
| 2-Person Families | 533 (44.8%) | $142,824 |
| 3-Person Families | 253 (21.3%) | $184,018 |
| 4-Person Families | 286 (24.0%) | $134,091 |
| 5-Person Families | 97 (8.2%) | $108,702 |
| 6-Person Families | 21 (1.8%) | $0 |
| 7+ Person Families | 0 (0.0%) | $0 |
| Total | 1,190 (100.0%) | $142,829 |
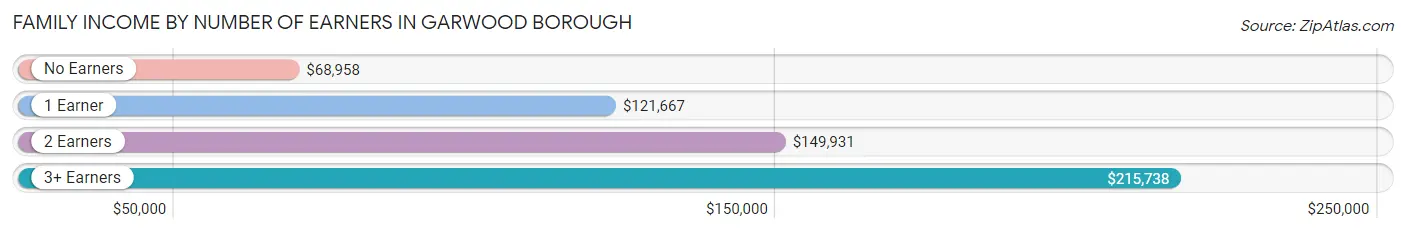
Family Income by Number of Earners in Garwood borough
The median family income in Garwood borough is $142,829, with families comprising 3+ earners (194) having the highest median family income of $215,738, while families with no earners (99) have the lowest median family income of $68,958, accounting for 16.3% and 8.3% of families, respectively.
| Number of Earners | # Families | Median Income |
| No Earners | 99 (8.3%) | $68,958 |
| 1 Earner | 394 (33.1%) | $121,667 |
| 2 Earners | 503 (42.3%) | $149,931 |
| 3+ Earners | 194 (16.3%) | $215,738 |
| Total | 1,190 (100.0%) | $142,829 |
Household Income in Garwood borough
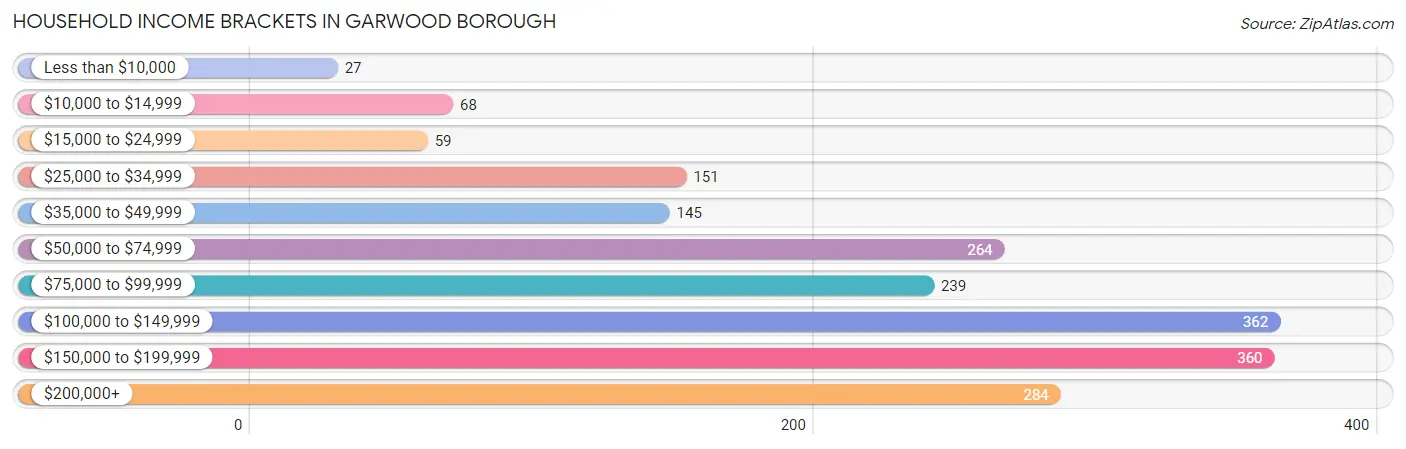
Household Income Brackets in Garwood borough
With 362 households falling in the category, the $100,000 to $149,999 income range is the most frequent in Garwood borough, accounting for 18.5% of all households. In contrast, only 27 households (1.4%) fall into the less than $10,000 income bracket, making it the least populous group.
| Income Bracket | # Households | % Households |
| Less than $10,000 | 27 | 1.4% |
| $10,000 to $14,999 | 68 | 3.5% |
| $15,000 to $24,999 | 59 | 3.0% |
| $25,000 to $34,999 | 151 | 7.7% |
| $35,000 to $49,999 | 145 | 7.4% |
| $50,000 to $74,999 | 264 | 13.5% |
| $75,000 to $99,999 | 239 | 12.2% |
| $100,000 to $149,999 | 362 | 18.5% |
| $150,000 to $199,999 | 360 | 18.4% |
| $200,000+ | 284 | 14.5% |
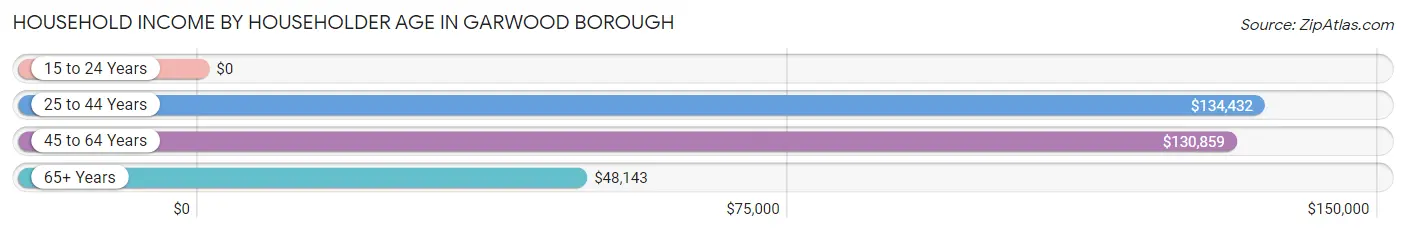
Household Income by Householder Age in Garwood borough
The median household income in Garwood borough is $107,823, with the highest median household income of $134,432 found in the 25 to 44 years age bracket for the primary householder. A total of 729 households (37.3%) fall into this category.
| Income Bracket | # Households | Median Income |
| 15 to 24 Years | 0 (0.0%) | $0 |
| 25 to 44 Years | 729 (37.3%) | $134,432 |
| 45 to 64 Years | 567 (29.0%) | $130,859 |
| 65+ Years | 660 (33.7%) | $48,143 |
| Total | 1,956 (100.0%) | $107,823 |
Poverty in Garwood borough
Income Below Poverty by Sex and Age in Garwood borough
With 3.2% poverty level for males and 4.1% for females among the residents of Garwood borough, 25 to 34 year old males and 65 to 74 year old females are the most vulnerable to poverty, with 36 males (10.0%) and 25 females (12.1%) in their respective age groups living below the poverty level.
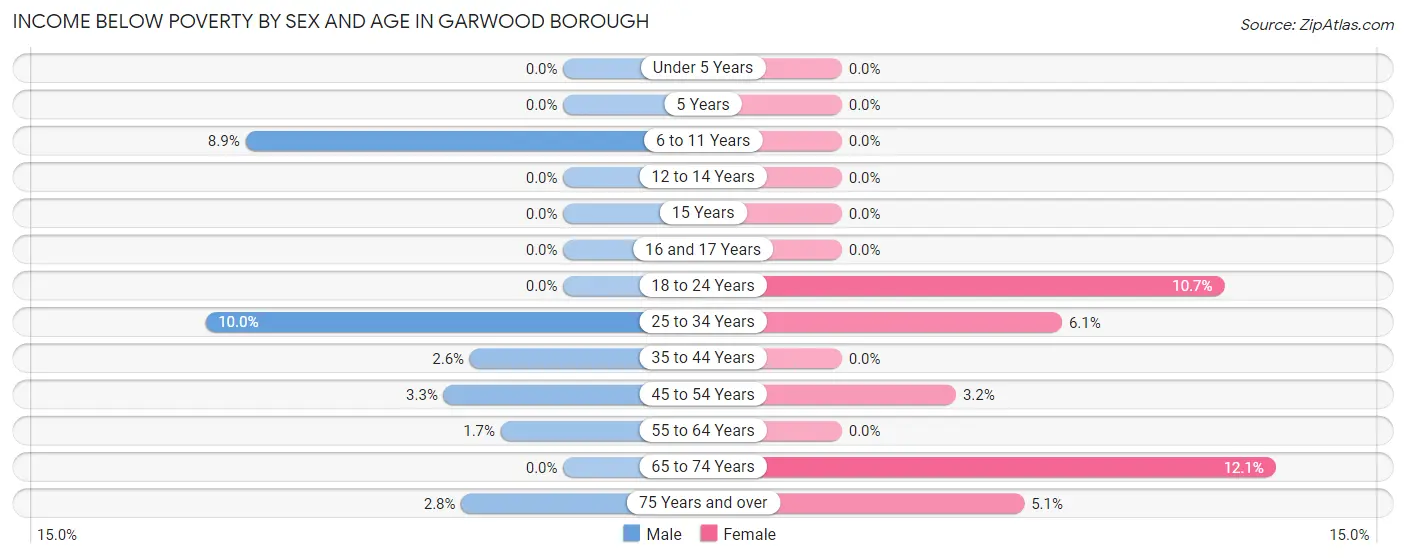
| Age Bracket | Male | Female |
| Under 5 Years | 0 (0.0%) | 0 (0.0%) |
| 5 Years | 0 (0.0%) | 0 (0.0%) |
| 6 to 11 Years | 10 (8.8%) | 0 (0.0%) |
| 12 to 14 Years | 0 (0.0%) | 0 (0.0%) |
| 15 Years | 0 (0.0%) | 0 (0.0%) |
| 16 and 17 Years | 0 (0.0%) | 0 (0.0%) |
| 18 to 24 Years | 0 (0.0%) | 18 (10.6%) |
| 25 to 34 Years | 36 (10.0%) | 19 (6.1%) |
| 35 to 44 Years | 12 (2.6%) | 0 (0.0%) |
| 45 to 54 Years | 10 (3.3%) | 9 (3.2%) |
| 55 to 64 Years | 5 (1.7%) | 0 (0.0%) |
| 65 to 74 Years | 0 (0.0%) | 25 (12.1%) |
| 75 Years and over | 5 (2.8%) | 13 (5.1%) |
| Total | 78 (3.2%) | 84 (4.1%) |
Income Above Poverty by Sex and Age in Garwood borough
According to the poverty statistics in Garwood borough, males aged under 5 years and females aged under 5 years are the age groups that are most secure financially, with 100.0% of males and 100.0% of females in these age groups living above the poverty line.
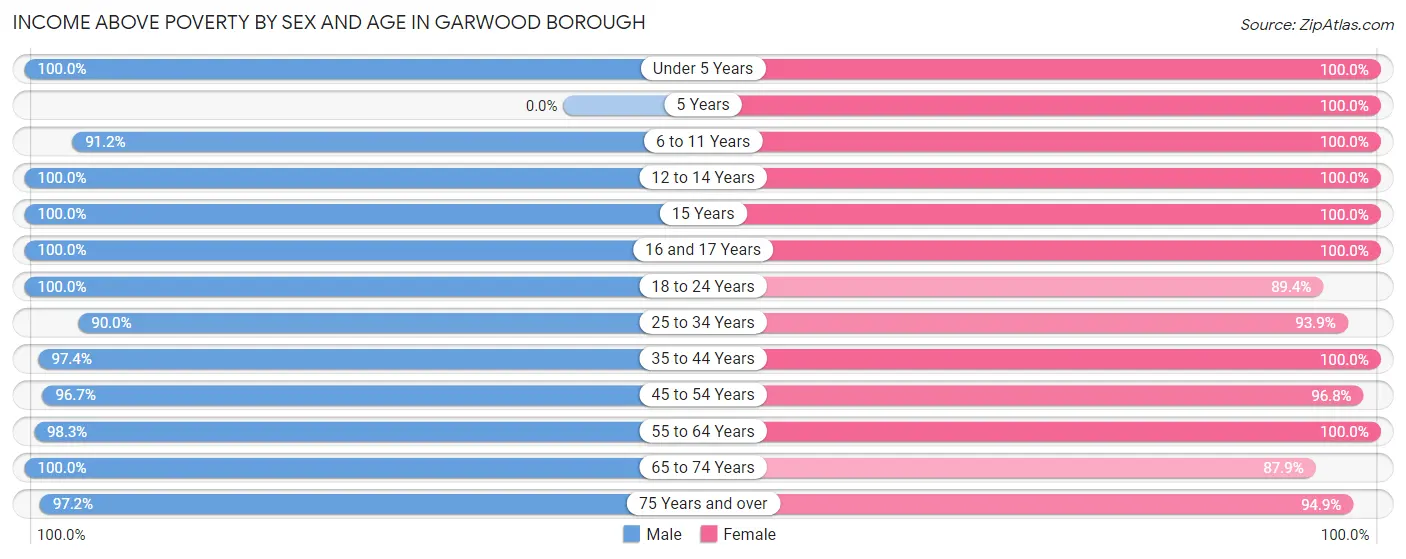
| Age Bracket | Male | Female |
| Under 5 Years | 127 (100.0%) | 76 (100.0%) |
| 5 Years | 0 (0.0%) | 34 (100.0%) |
| 6 to 11 Years | 103 (91.1%) | 108 (100.0%) |
| 12 to 14 Years | 89 (100.0%) | 66 (100.0%) |
| 15 Years | 18 (100.0%) | 30 (100.0%) |
| 16 and 17 Years | 82 (100.0%) | 25 (100.0%) |
| 18 to 24 Years | 145 (100.0%) | 151 (89.3%) |
| 25 to 34 Years | 325 (90.0%) | 291 (93.9%) |
| 35 to 44 Years | 450 (97.4%) | 257 (100.0%) |
| 45 to 54 Years | 290 (96.7%) | 274 (96.8%) |
| 55 to 64 Years | 283 (98.3%) | 254 (100.0%) |
| 65 to 74 Years | 306 (100.0%) | 182 (87.9%) |
| 75 Years and over | 171 (97.2%) | 243 (94.9%) |
| Total | 2,389 (96.8%) | 1,991 (96.0%) |
Income Below Poverty Among Married-Couple Families in Garwood borough
The poverty statistics for married-couple families in Garwood borough show that 1.5% or 15 of the total 976 families live below the poverty line. Families with 1 or 2 children have the highest poverty rate of 2.5%, comprising of 10 families. On the other hand, families with 3 or 4 children have the lowest poverty rate of 0.0%, which includes 0 families.
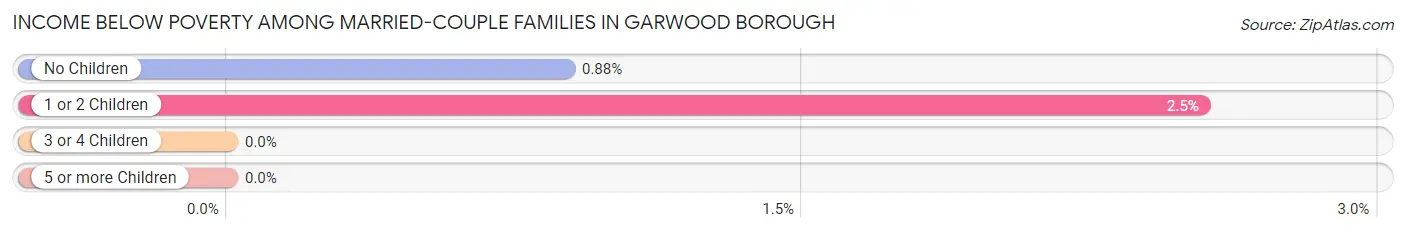
| Children | Above Poverty | Below Poverty |
| No Children | 565 (99.1%) | 5 (0.9%) |
| 1 or 2 Children | 384 (97.5%) | 10 (2.5%) |
| 3 or 4 Children | 12 (100.0%) | 0 (0.0%) |
| 5 or more Children | 0 (0.0%) | 0 (0.0%) |
| Total | 961 (98.5%) | 15 (1.5%) |
Income Below Poverty Among Single-Parent Households in Garwood borough
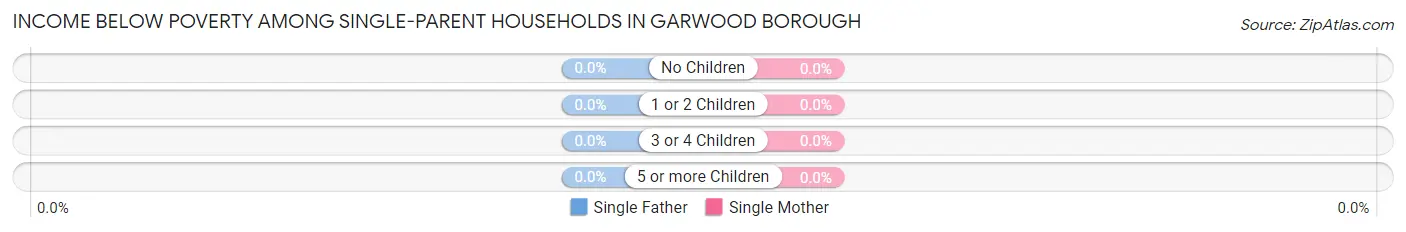
| Children | Single Father | Single Mother |
| No Children | 0 (0.0%) | 0 (0.0%) |
| 1 or 2 Children | 0 (0.0%) | 0 (0.0%) |
| 3 or 4 Children | 0 (0.0%) | 0 (0.0%) |
| 5 or more Children | 0 (0.0%) | 0 (0.0%) |
| Total | 0 (0.0%) | 0 (0.0%) |
Income Below Poverty Among Married-Couple vs Single-Parent Households in Garwood borough
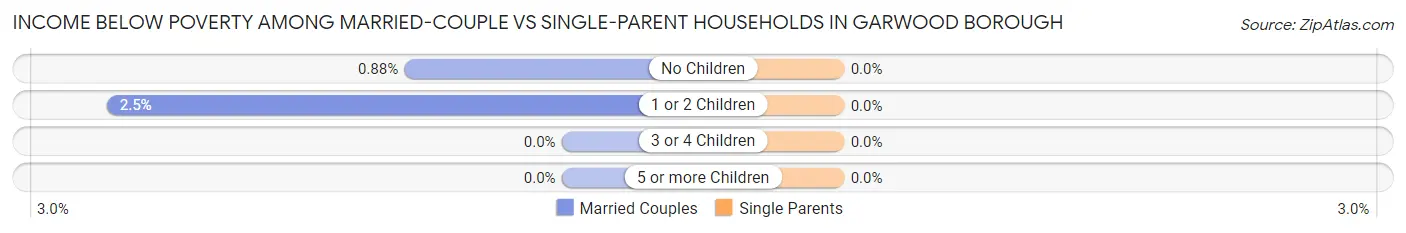
| Children | Married-Couple Families | Single-Parent Households |
| No Children | 5 (0.9%) | 0 (0.0%) |
| 1 or 2 Children | 10 (2.5%) | 0 (0.0%) |
| 3 or 4 Children | 0 (0.0%) | 0 (0.0%) |
| 5 or more Children | 0 (0.0%) | 0 (0.0%) |
| Total | 15 (1.5%) | 0 (0.0%) |
Race in Garwood borough
The most populous races in Garwood borough are White / Caucasian (3,526 | 77.6%), Hispanic or Latino (900 | 19.8%), and Some other Race (556 | 12.2%).
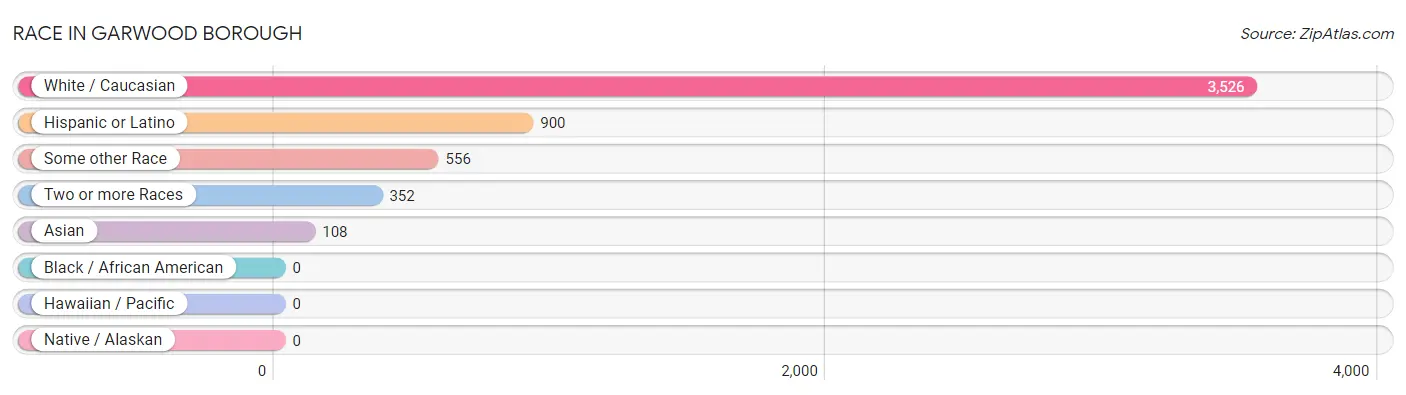
| Race | # Population | % Population |
| Asian | 108 | 2.4% |
| Black / African American | 0 | 0.0% |
| Hawaiian / Pacific | 0 | 0.0% |
| Hispanic or Latino | 900 | 19.8% |
| Native / Alaskan | 0 | 0.0% |
| White / Caucasian | 3,526 | 77.6% |
| Two or more Races | 352 | 7.7% |
| Some other Race | 556 | 12.2% |
| Total | 4,542 | 100.0% |
Ancestry in Garwood borough
The most populous ancestries reported in Garwood borough are Italian (1,130 | 24.9%), German (425 | 9.4%), Irish (416 | 9.2%), American (384 | 8.5%), and Polish (329 | 7.2%), together accounting for 59.1% of all Garwood borough residents.
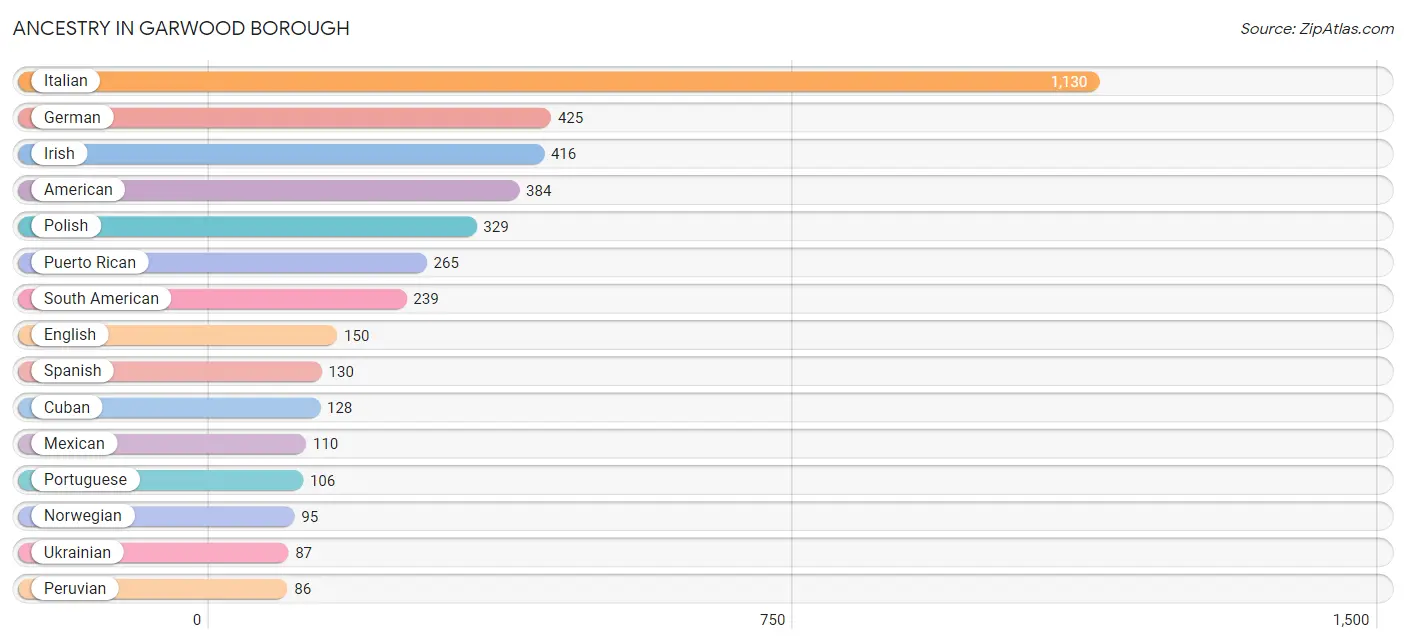
| Ancestry | # Population | % Population |
| Albanian | 74 | 1.6% |
| American | 384 | 8.5% |
| Arab | 69 | 1.5% |
| Argentinean | 37 | 0.8% |
| Austrian | 15 | 0.3% |
| Brazilian | 81 | 1.8% |
| British | 34 | 0.7% |
| Cherokee | 7 | 0.2% |
| Colombian | 28 | 0.6% |
| Cuban | 128 | 2.8% |
| Czechoslovakian | 18 | 0.4% |
| Danish | 11 | 0.2% |
| Dominican | 28 | 0.6% |
| Eastern European | 12 | 0.3% |
| Ecuadorian | 26 | 0.6% |
| Egyptian | 53 | 1.2% |
| English | 150 | 3.3% |
| European | 20 | 0.4% |
| French | 17 | 0.4% |
| French Canadian | 20 | 0.4% |
| German | 425 | 9.4% |
| Greek | 46 | 1.0% |
| Hungarian | 35 | 0.8% |
| Indian (Asian) | 15 | 0.3% |
| Irish | 416 | 9.2% |
| Israeli | 48 | 1.1% |
| Italian | 1,130 | 24.9% |
| Korean | 71 | 1.6% |
| Lebanese | 16 | 0.4% |
| Lithuanian | 26 | 0.6% |
| Maltese | 20 | 0.4% |
| Mexican | 110 | 2.4% |
| Mexican American Indian | 14 | 0.3% |
| Norwegian | 95 | 2.1% |
| Peruvian | 86 | 1.9% |
| Polish | 329 | 7.2% |
| Portuguese | 106 | 2.3% |
| Puerto Rican | 265 | 5.8% |
| Russian | 84 | 1.8% |
| Scandinavian | 14 | 0.3% |
| Scotch-Irish | 58 | 1.3% |
| Scottish | 38 | 0.8% |
| Slovak | 81 | 1.8% |
| South American | 239 | 5.3% |
| Spanish | 130 | 2.9% |
| Swedish | 11 | 0.2% |
| Thai | 21 | 0.5% |
| Trinidadian and Tobagonian | 10 | 0.2% |
| Ukrainian | 87 | 1.9% |
| Uruguayan | 8 | 0.2% |
| Venezuelan | 54 | 1.2% | View All 51 Rows |
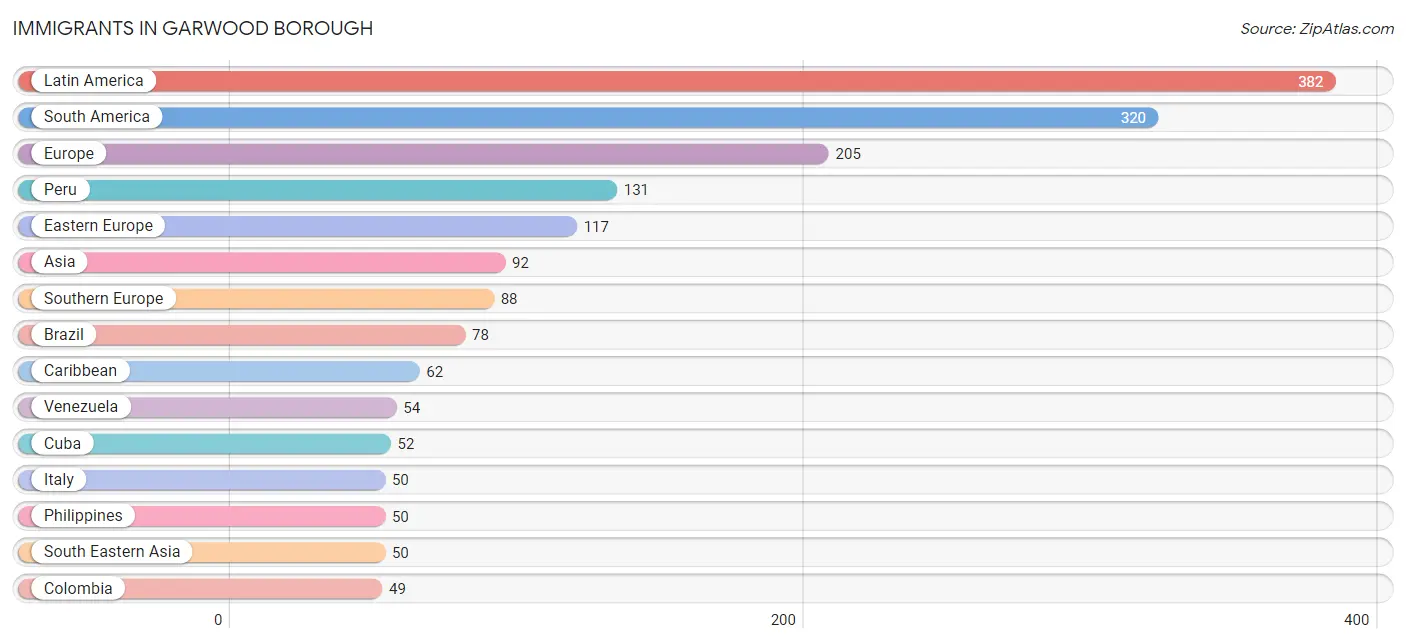
Immigrants in Garwood borough
The most numerous immigrant groups reported in Garwood borough came from Latin America (382 | 8.4%), South America (320 | 7.0%), Europe (205 | 4.5%), Peru (131 | 2.9%), and Eastern Europe (117 | 2.6%), together accounting for 25.4% of all Garwood borough residents.
| Immigration Origin | # Population | % Population |
| Albania | 38 | 0.8% |
| Asia | 92 | 2.0% |
| Belarus | 23 | 0.5% |
| Brazil | 78 | 1.7% |
| Caribbean | 62 | 1.4% |
| China | 15 | 0.3% |
| Colombia | 49 | 1.1% |
| Cuba | 52 | 1.1% |
| Czechoslovakia | 10 | 0.2% |
| Eastern Asia | 15 | 0.3% |
| Eastern Europe | 117 | 2.6% |
| Europe | 205 | 4.5% |
| Greece | 15 | 0.3% |
| Hong Kong | 15 | 0.3% |
| India | 13 | 0.3% |
| Israel | 14 | 0.3% |
| Italy | 50 | 1.1% |
| Latin America | 382 | 8.4% |
| Peru | 131 | 2.9% |
| Philippines | 50 | 1.1% |
| Poland | 46 | 1.0% |
| Portugal | 23 | 0.5% |
| South America | 320 | 7.0% |
| South Central Asia | 13 | 0.3% |
| South Eastern Asia | 50 | 1.1% |
| Southern Europe | 88 | 1.9% |
| Trinidad and Tobago | 10 | 0.2% |
| Uruguay | 8 | 0.2% |
| Venezuela | 54 | 1.2% |
| Western Asia | 14 | 0.3% | View All 30 Rows |
Sex and Age in Garwood borough
Sex and Age in Garwood borough
The most populous age groups in Garwood borough are 35 to 39 Years (303 | 12.3%) for men and 30 to 34 Years (198 | 9.5%) for women.
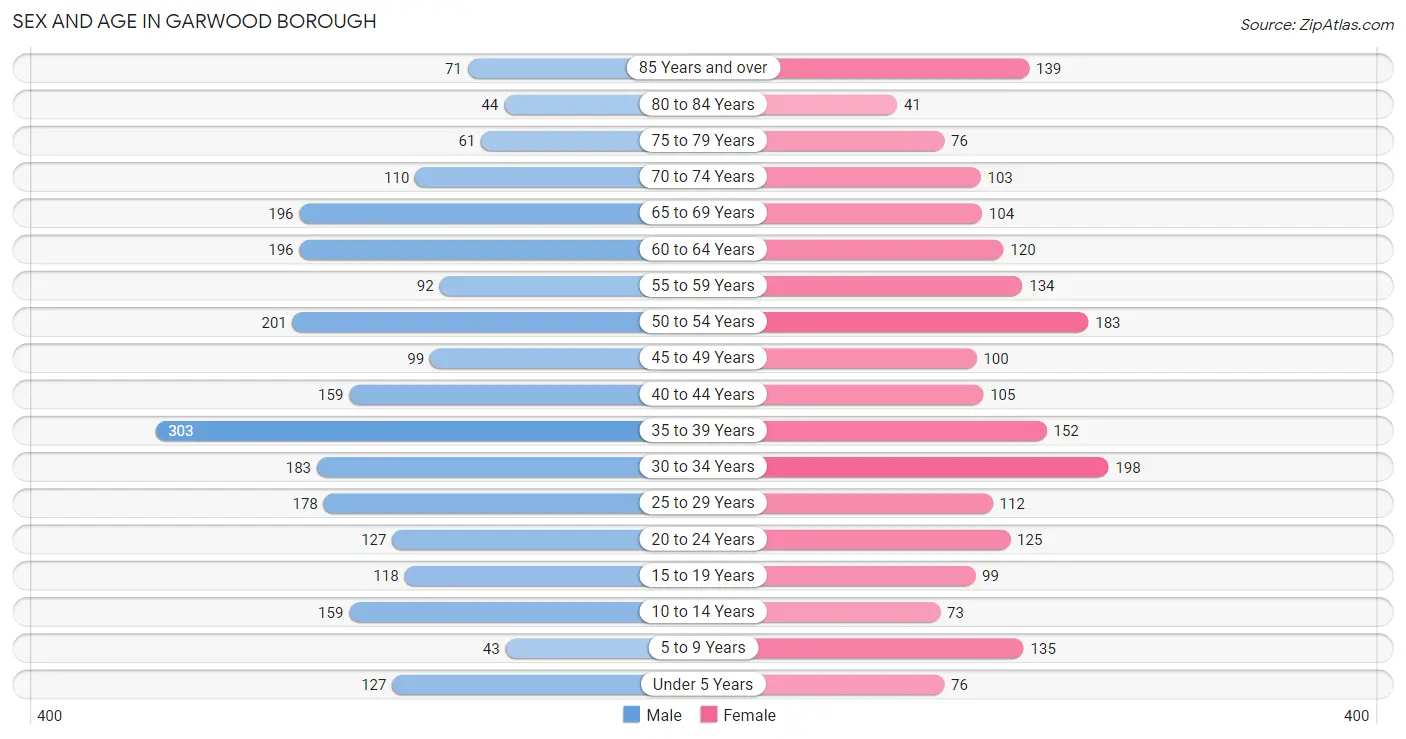
| Age Bracket | Male | Female |
| Under 5 Years | 127 (5.1%) | 76 (3.7%) |
| 5 to 9 Years | 43 (1.7%) | 135 (6.5%) |
| 10 to 14 Years | 159 (6.5%) | 73 (3.5%) |
| 15 to 19 Years | 118 (4.8%) | 99 (4.8%) |
| 20 to 24 Years | 127 (5.1%) | 125 (6.0%) |
| 25 to 29 Years | 178 (7.2%) | 112 (5.4%) |
| 30 to 34 Years | 183 (7.4%) | 198 (9.5%) |
| 35 to 39 Years | 303 (12.3%) | 152 (7.3%) |
| 40 to 44 Years | 159 (6.5%) | 105 (5.1%) |
| 45 to 49 Years | 99 (4.0%) | 100 (4.8%) |
| 50 to 54 Years | 201 (8.2%) | 183 (8.8%) |
| 55 to 59 Years | 92 (3.7%) | 134 (6.5%) |
| 60 to 64 Years | 196 (7.9%) | 120 (5.8%) |
| 65 to 69 Years | 196 (7.9%) | 104 (5.0%) |
| 70 to 74 Years | 110 (4.5%) | 103 (5.0%) |
| 75 to 79 Years | 61 (2.5%) | 76 (3.7%) |
| 80 to 84 Years | 44 (1.8%) | 41 (2.0%) |
| 85 Years and over | 71 (2.9%) | 139 (6.7%) |
| Total | 2,467 (100.0%) | 2,075 (100.0%) |
Families and Households in Garwood borough
Median Family Size in Garwood borough
The median family size in Garwood borough is 3.06 persons per family, with single female/mother families (117 | 9.8%) accounting for the largest median family size of 4.1 persons per family. On the other hand, single male/father families (97 | 8.2%) represent the smallest median family size with 2.24 persons per family.
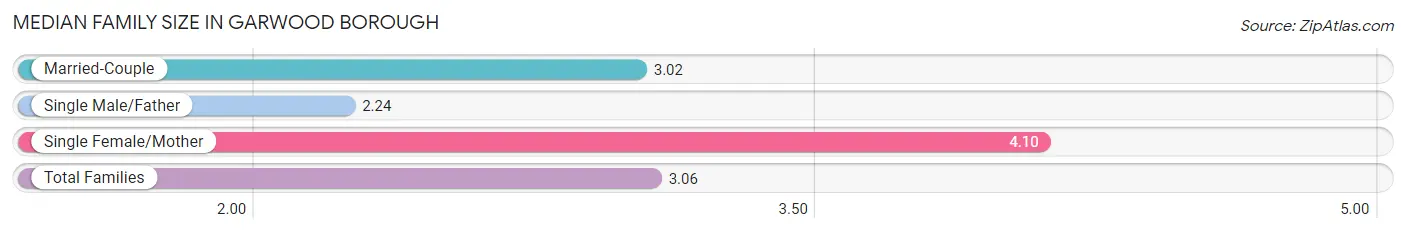
| Family Type | # Families | Family Size |
| Married-Couple | 976 (82.0%) | 3.02 |
| Single Male/Father | 97 (8.2%) | 2.24 |
| Single Female/Mother | 117 (9.8%) | 4.10 |
| Total Families | 1,190 (100.0%) | 3.06 |
Median Household Size in Garwood borough
The median household size in Garwood borough is 2.32 persons per household, with single female/mother households (117 | 6.0%) accounting for the largest median household size of 4.1 persons per household. non-family households (766 | 39.2%) represent the smallest median household size with 1.10 persons per household.
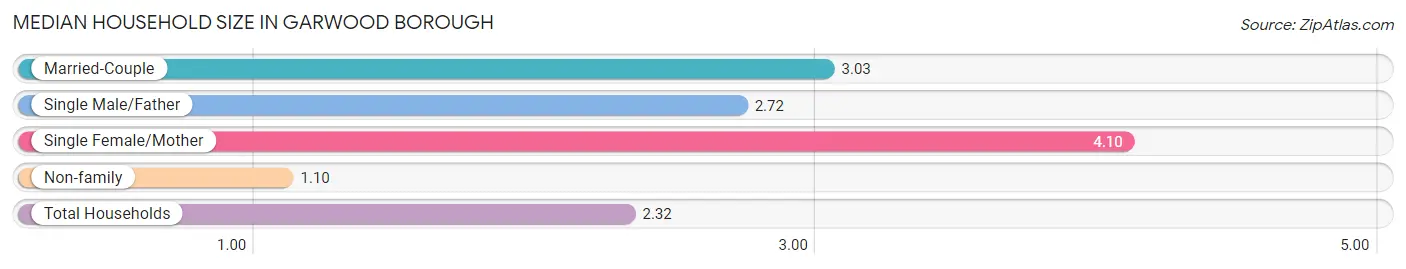
| Household Type | # Households | Household Size |
| Married-Couple | 976 (49.9%) | 3.03 |
| Single Male/Father | 97 (5.0%) | 2.72 |
| Single Female/Mother | 117 (6.0%) | 4.10 |
| Non-family | 766 (39.2%) | 1.10 |
| Total Households | 1,956 (100.0%) | 2.32 |
Household Size by Marriage Status in Garwood borough
Out of a total of 1,956 households in Garwood borough, 1,190 (60.8%) are family households, while 766 (39.2%) are nonfamily households. The most numerous type of family households are 2-person households, comprising 511, and the most common type of nonfamily households are 1-person households, comprising 695.
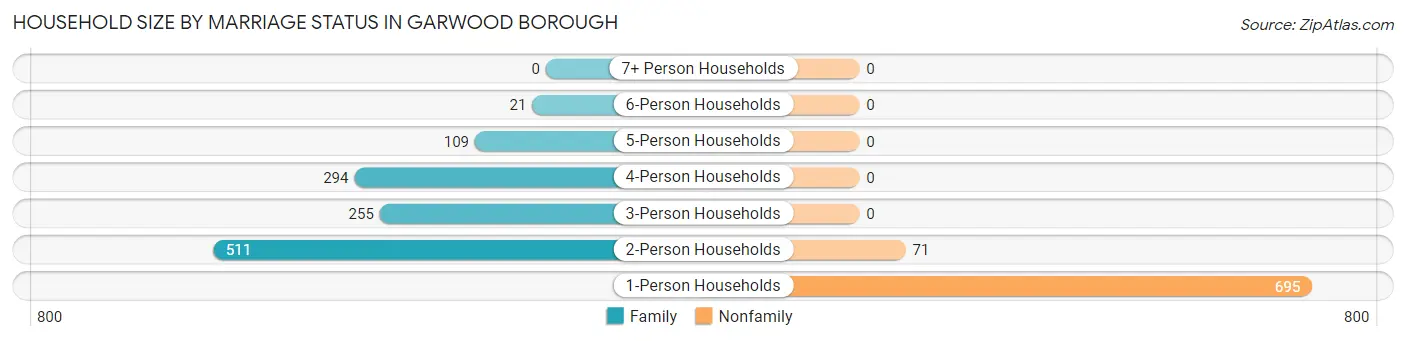
| Household Size | Family Households | Nonfamily Households |
| 1-Person Households | - | 695 (35.5%) |
| 2-Person Households | 511 (26.1%) | 71 (3.6%) |
| 3-Person Households | 255 (13.0%) | 0 (0.0%) |
| 4-Person Households | 294 (15.0%) | 0 (0.0%) |
| 5-Person Households | 109 (5.6%) | 0 (0.0%) |
| 6-Person Households | 21 (1.1%) | 0 (0.0%) |
| 7+ Person Households | 0 (0.0%) | 0 (0.0%) |
| Total | 1,190 (60.8%) | 766 (39.2%) |
Female Fertility in Garwood borough
Fertility by Age in Garwood borough
Average fertility rate in Garwood borough is 103.0 births per 1,000 women. Women in the age bracket of 20 to 34 years have the highest fertility rate with 159.0 births per 1,000 women. Women in the age bracket of 20 to 34 years acount for 70.4% of all women with births.
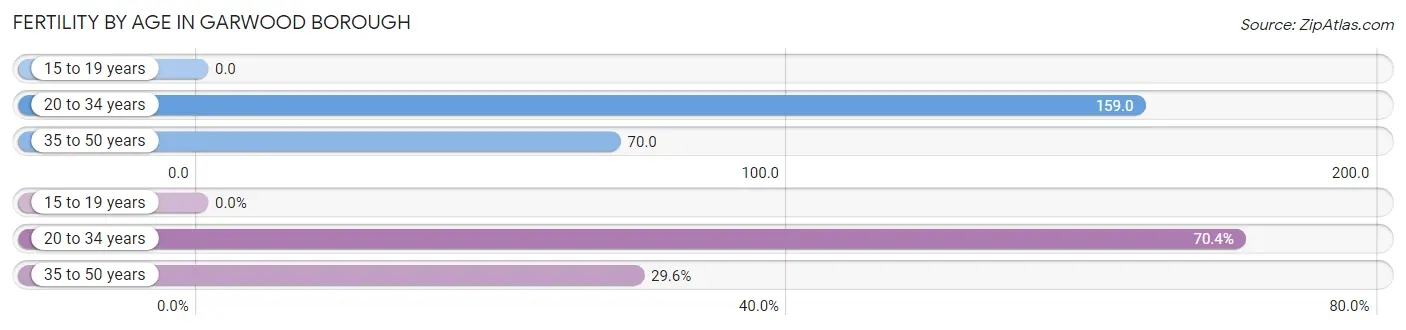
| Age Bracket | Women with Births | Births / 1,000 Women |
| 15 to 19 years | 0 (0.0%) | 0.0 |
| 20 to 34 years | 69 (70.4%) | 159.0 |
| 35 to 50 years | 29 (29.6%) | 70.0 |
| Total | 98 (100.0%) | 103.0 |
Fertility by Age by Marriage Status in Garwood borough
70.4% of women with births (98) in Garwood borough are married. The highest percentage of unmarried women with births falls into 20 to 34 years age bracket with 42.0% of them unmarried at the time of birth, while the lowest percentage of unmarried women with births belong to 35 to 50 years age bracket with 0.0% of them unmarried.
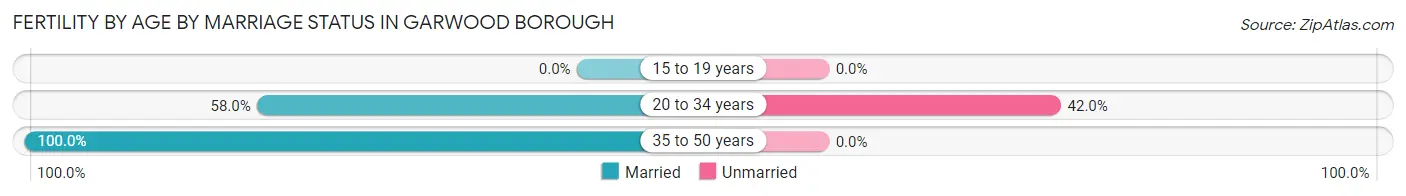
| Age Bracket | Married | Unmarried |
| 15 to 19 years | 0 (0.0%) | 0 (0.0%) |
| 20 to 34 years | 40 (58.0%) | 29 (42.0%) |
| 35 to 50 years | 29 (100.0%) | 0 (0.0%) |
| Total | 69 (70.4%) | 29 (29.6%) |
Fertility by Education in Garwood borough
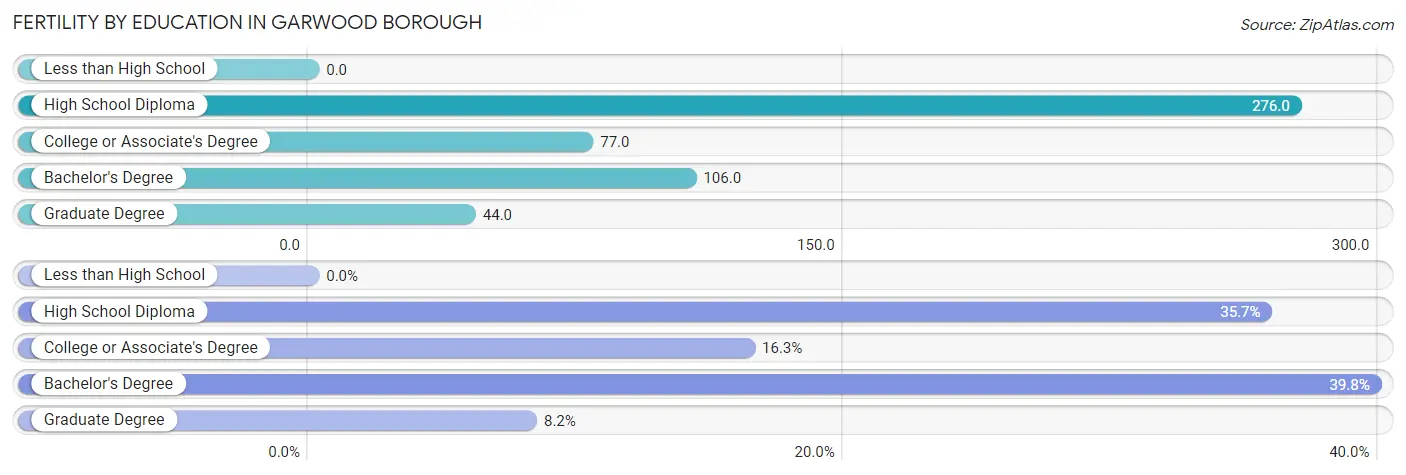
| Educational Attainment | Women with Births | Births / 1,000 Women |
| Less than High School | 0 (0.0%) | 0.0 |
| High School Diploma | 35 (35.7%) | 276.0 |
| College or Associate's Degree | 16 (16.3%) | 77.0 |
| Bachelor's Degree | 39 (39.8%) | 106.0 |
| Graduate Degree | 8 (8.2%) | 44.0 |
| Total | 98 (100.0%) | 103.0 |
Fertility by Education by Marriage Status in Garwood borough
29.6% of women with births in Garwood borough are unmarried. Women with the educational attainment of bachelor's degree are most likely to be married with 100.0% of them married at childbirth, while women with the educational attainment of college or associate's degree are least likely to be married with 68.8% of them unmarried at childbirth.
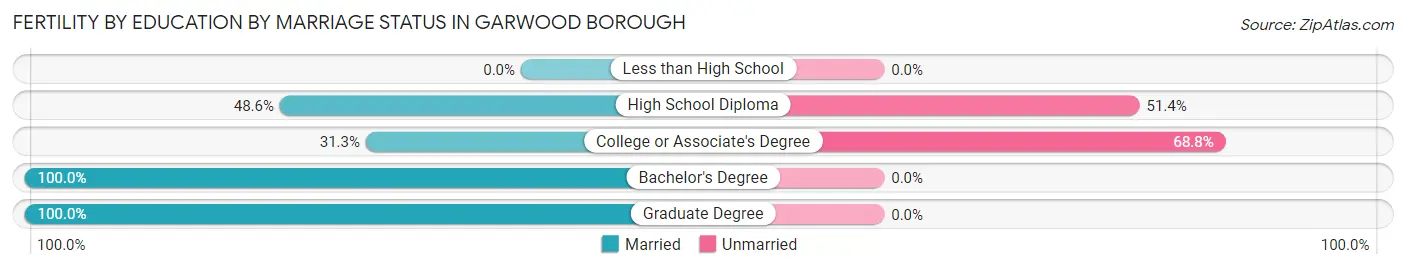
| Educational Attainment | Married | Unmarried |
| Less than High School | 0 (0.0%) | 0 (0.0%) |
| High School Diploma | 17 (48.6%) | 18 (51.4%) |
| College or Associate's Degree | 5 (31.2%) | 11 (68.8%) |
| Bachelor's Degree | 39 (100.0%) | 0 (0.0%) |
| Graduate Degree | 8 (100.0%) | 0 (0.0%) |
| Total | 69 (70.4%) | 29 (29.6%) |
Employment Characteristics in Garwood borough
Employment by Class of Employer in Garwood borough
Among the 2,496 employed individuals in Garwood borough, private company employees (1,700 | 68.1%), local government employees (362 | 14.5%), and not-for-profit organizations (172 | 6.9%) make up the most common classes of employment.
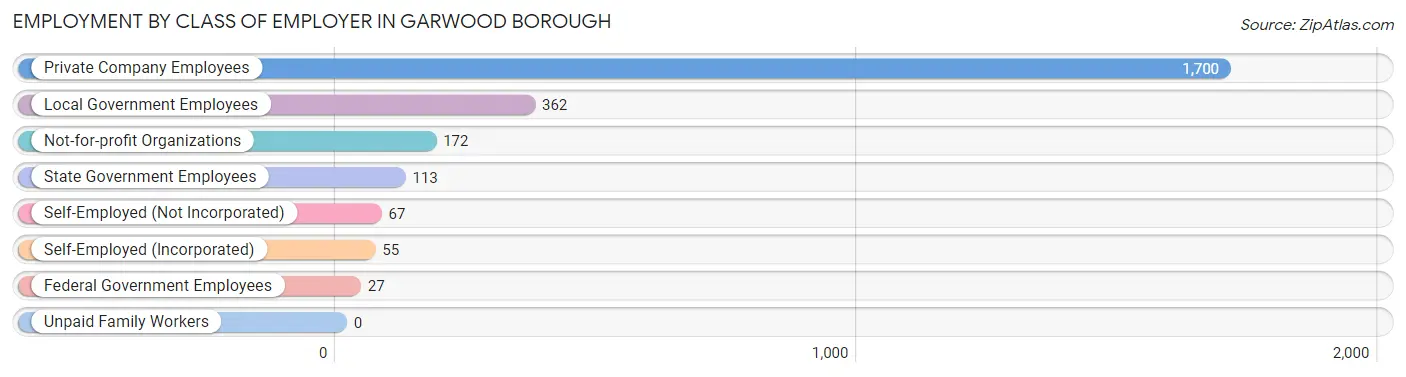
| Employer Class | # Employees | % Employees |
| Private Company Employees | 1,700 | 68.1% |
| Self-Employed (Incorporated) | 55 | 2.2% |
| Self-Employed (Not Incorporated) | 67 | 2.7% |
| Not-for-profit Organizations | 172 | 6.9% |
| Local Government Employees | 362 | 14.5% |
| State Government Employees | 113 | 4.5% |
| Federal Government Employees | 27 | 1.1% |
| Unpaid Family Workers | 0 | 0.0% |
| Total | 2,496 | 100.0% |
Employment Status by Age in Garwood borough
According to the labor force statistics for Garwood borough, out of the total population over 16 years of age (3,881), 70.0% or 2,717 individuals are in the labor force, with 6.0% or 163 of them unemployed. The age group with the highest labor force participation rate is 20 to 24 years, with 100.0% or 252 individuals in the labor force. Within the labor force, the 16 to 19 years age range has the highest percentage of unemployed individuals, with 77.2% or 61 of them being unemployed.
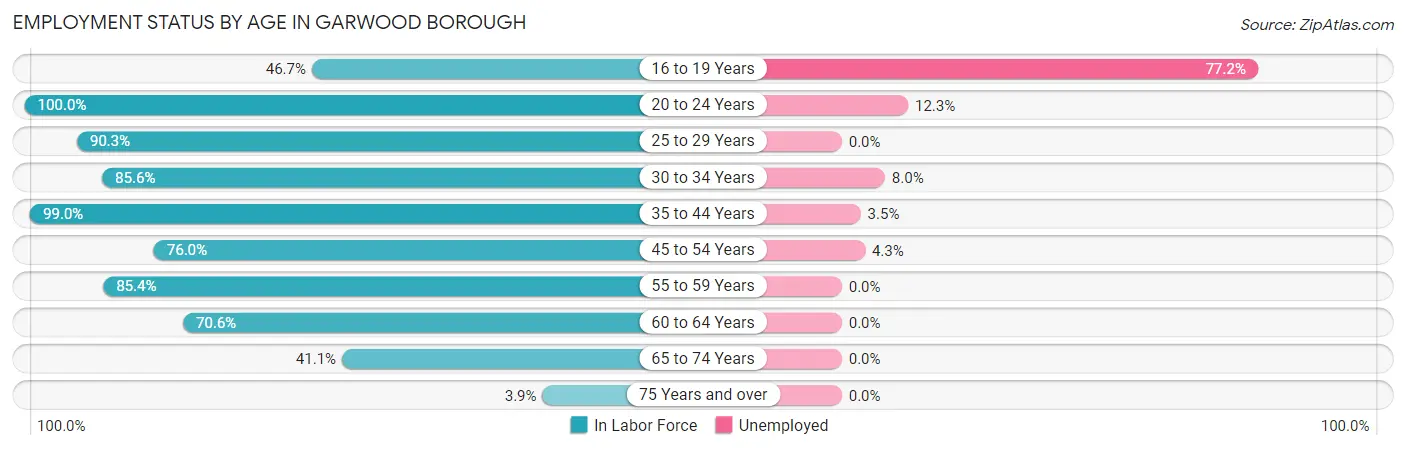
| Age Bracket | In Labor Force | Unemployed |
| 16 to 19 Years | 79 (46.7%) | 61 (77.2%) |
| 20 to 24 Years | 252 (100.0%) | 31 (12.3%) |
| 25 to 29 Years | 262 (90.3%) | 0 (0.0%) |
| 30 to 34 Years | 326 (85.6%) | 26 (8.0%) |
| 35 to 44 Years | 712 (99.0%) | 25 (3.5%) |
| 45 to 54 Years | 443 (76.0%) | 19 (4.3%) |
| 55 to 59 Years | 193 (85.4%) | 0 (0.0%) |
| 60 to 64 Years | 223 (70.6%) | 0 (0.0%) |
| 65 to 74 Years | 211 (41.1%) | 0 (0.0%) |
| 75 Years and over | 17 (3.9%) | 0 (0.0%) |
| Total | 2,717 (70.0%) | 163 (6.0%) |
Employment Status by Educational Attainment in Garwood borough
According to labor force statistics for Garwood borough, 85.8% of individuals (2,158) out of the total population between 25 and 64 years of age (2,515) are in the labor force, with 3.2% or 69 of them being unemployed. The group with the highest labor force participation rate are those with the educational attainment of bachelor's degree or higher, with 90.1% or 978 individuals in the labor force. Within the labor force, individuals with bachelor's degree or higher education have the highest percentage of unemployment, with 4.0% or 39 of them being unemployed.
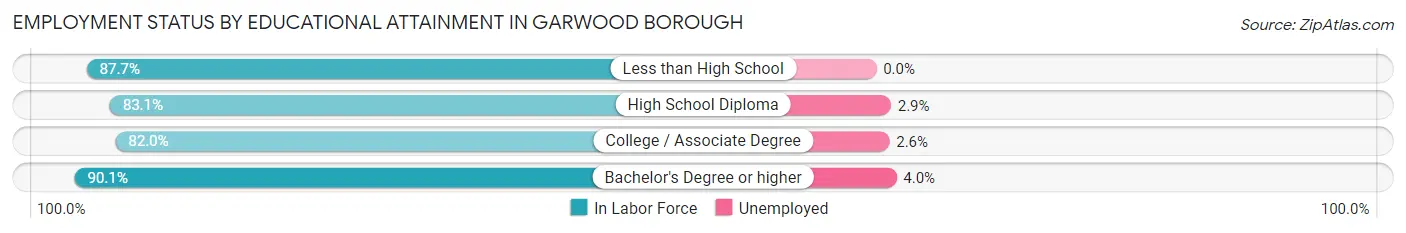
| Educational Attainment | In Labor Force | Unemployed |
| Less than High School | 50 (87.7%) | 0 (0.0%) |
| High School Diploma | 409 (83.1%) | 14 (2.9%) |
| College / Associate Degree | 722 (82.0%) | 23 (2.6%) |
| Bachelor's Degree or higher | 978 (90.1%) | 43 (4.0%) |
| Total | 2,158 (85.8%) | 80 (3.2%) |
Employment Occupations by Sex in Garwood borough
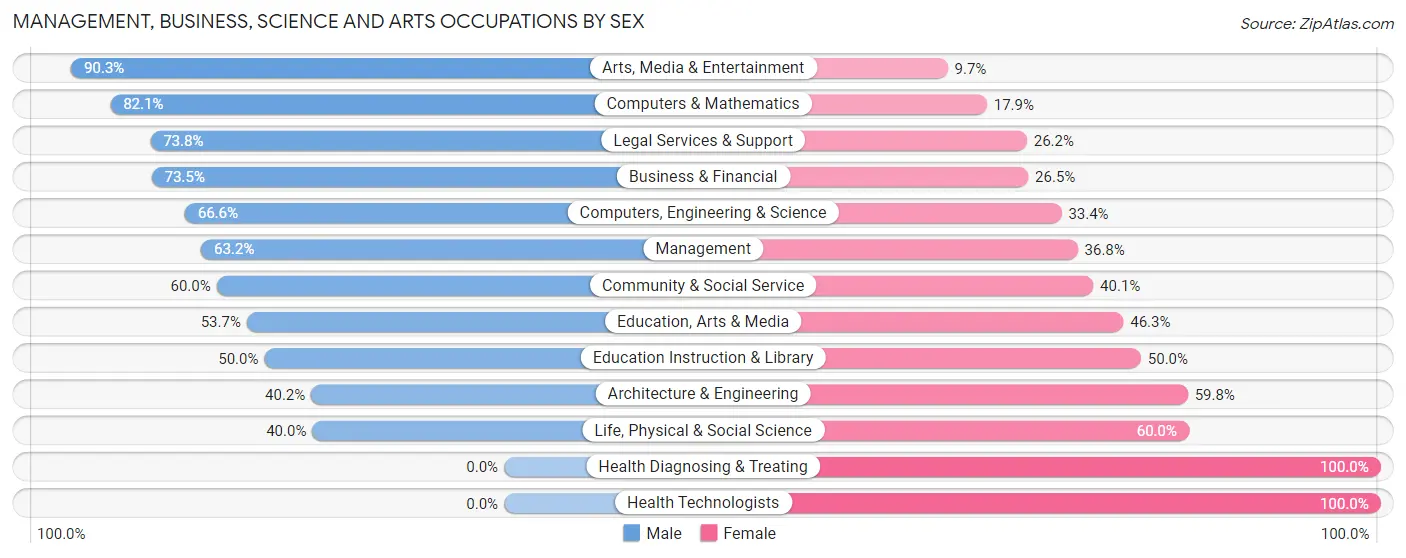
Management, Business, Science and Arts Occupations
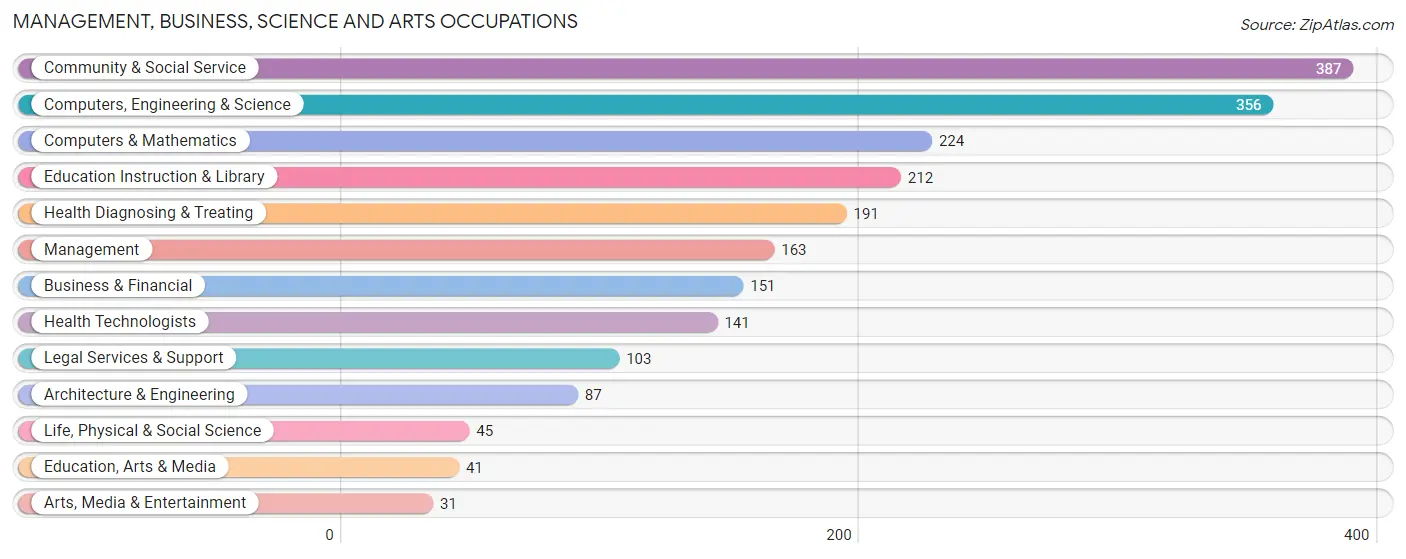
The most common Management, Business, Science and Arts occupations in Garwood borough are Community & Social Service (387 | 15.1%), Computers, Engineering & Science (356 | 13.9%), Computers & Mathematics (224 | 8.8%), Education Instruction & Library (212 | 8.3%), and Health Diagnosing & Treating (191 | 7.5%).
Management, Business, Science and Arts Occupations by Sex
Within the Management, Business, Science and Arts occupations in Garwood borough, the most male-oriented occupations are Arts, Media & Entertainment (90.3%), Computers & Mathematics (82.1%), and Legal Services & Support (73.8%), while the most female-oriented occupations are Health Diagnosing & Treating (100.0%), Health Technologists (100.0%), and Life, Physical & Social Science (60.0%).
| Occupation | Male | Female |
| Management | 103 (63.2%) | 60 (36.8%) |
| Business & Financial | 111 (73.5%) | 40 (26.5%) |
| Computers, Engineering & Science | 237 (66.6%) | 119 (33.4%) |
| Computers & Mathematics | 184 (82.1%) | 40 (17.9%) |
| Architecture & Engineering | 35 (40.2%) | 52 (59.8%) |
| Life, Physical & Social Science | 18 (40.0%) | 27 (60.0%) |
| Community & Social Service | 232 (60.0%) | 155 (40.1%) |
| Education, Arts & Media | 22 (53.7%) | 19 (46.3%) |
| Legal Services & Support | 76 (73.8%) | 27 (26.2%) |
| Education Instruction & Library | 106 (50.0%) | 106 (50.0%) |
| Arts, Media & Entertainment | 28 (90.3%) | 3 (9.7%) |
| Health Diagnosing & Treating | 0 (0.0%) | 191 (100.0%) |
| Health Technologists | 0 (0.0%) | 141 (100.0%) |
| Total (Category) | 683 (54.7%) | 565 (45.3%) |
| Total (Overall) | 1,562 (61.1%) | 994 (38.9%) |
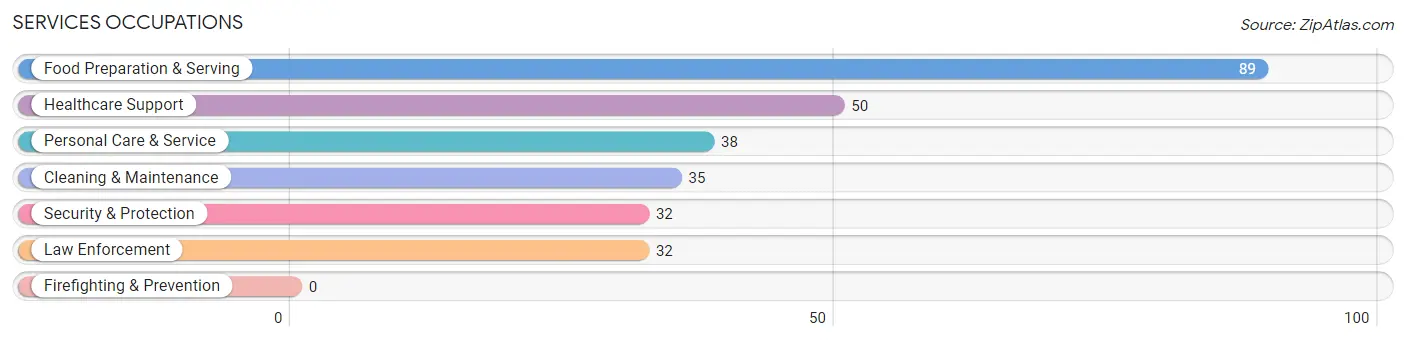
Services Occupations
The most common Services occupations in Garwood borough are Food Preparation & Serving (89 | 3.5%), Healthcare Support (50 | 2.0%), Personal Care & Service (38 | 1.5%), Cleaning & Maintenance (35 | 1.4%), and Security & Protection (32 | 1.3%).
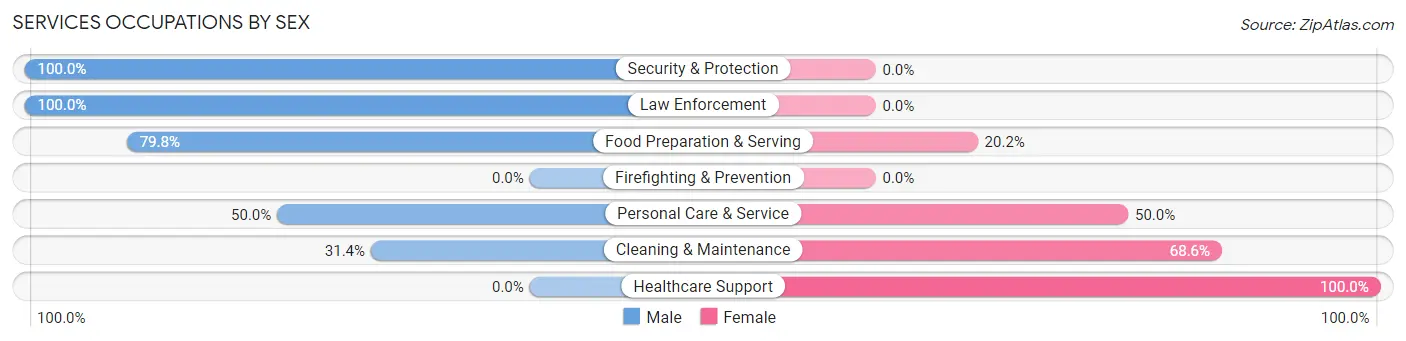
Services Occupations by Sex
Within the Services occupations in Garwood borough, the most male-oriented occupations are Security & Protection (100.0%), Law Enforcement (100.0%), and Food Preparation & Serving (79.8%), while the most female-oriented occupations are Healthcare Support (100.0%), Cleaning & Maintenance (68.6%), and Personal Care & Service (50.0%).
| Occupation | Male | Female |
| Healthcare Support | 0 (0.0%) | 50 (100.0%) |
| Security & Protection | 32 (100.0%) | 0 (0.0%) |
| Firefighting & Prevention | 0 (0.0%) | 0 (0.0%) |
| Law Enforcement | 32 (100.0%) | 0 (0.0%) |
| Food Preparation & Serving | 71 (79.8%) | 18 (20.2%) |
| Cleaning & Maintenance | 11 (31.4%) | 24 (68.6%) |
| Personal Care & Service | 19 (50.0%) | 19 (50.0%) |
| Total (Category) | 133 (54.5%) | 111 (45.5%) |
| Total (Overall) | 1,562 (61.1%) | 994 (38.9%) |
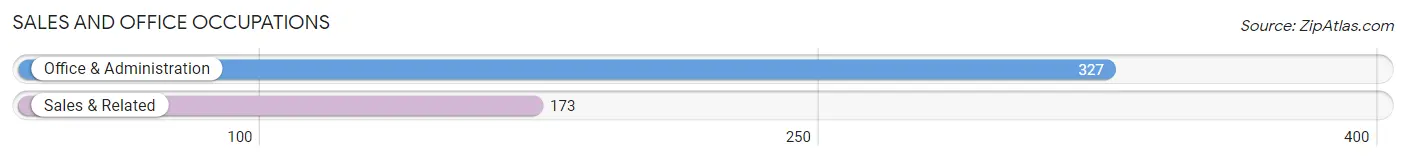
Sales and Office Occupations
The most common Sales and Office occupations in Garwood borough are Office & Administration (327 | 12.8%), and Sales & Related (173 | 6.8%).
Sales and Office Occupations by Sex
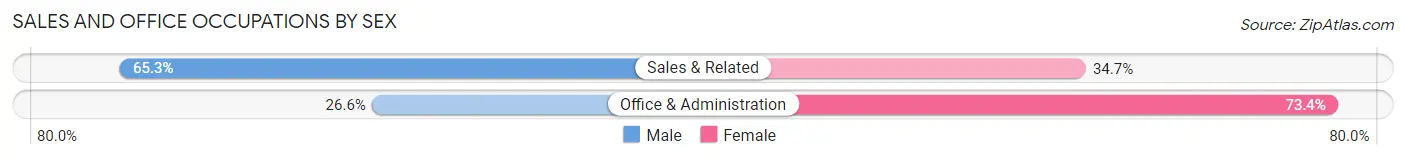
| Occupation | Male | Female |
| Sales & Related | 113 (65.3%) | 60 (34.7%) |
| Office & Administration | 87 (26.6%) | 240 (73.4%) |
| Total (Category) | 200 (40.0%) | 300 (60.0%) |
| Total (Overall) | 1,562 (61.1%) | 994 (38.9%) |
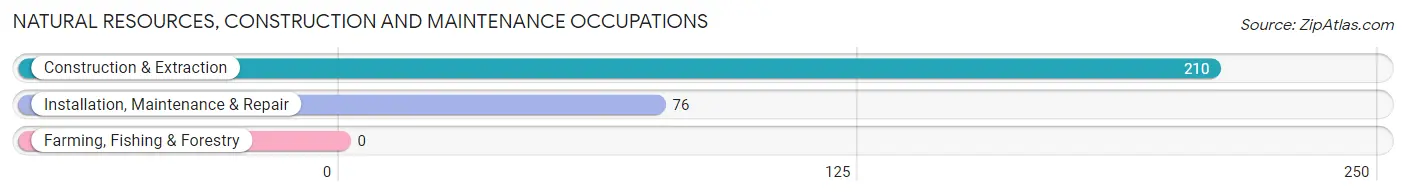
Natural Resources, Construction and Maintenance Occupations
The most common Natural Resources, Construction and Maintenance occupations in Garwood borough are Construction & Extraction (210 | 8.2%), and Installation, Maintenance & Repair (76 | 3.0%).
Natural Resources, Construction and Maintenance Occupations by Sex
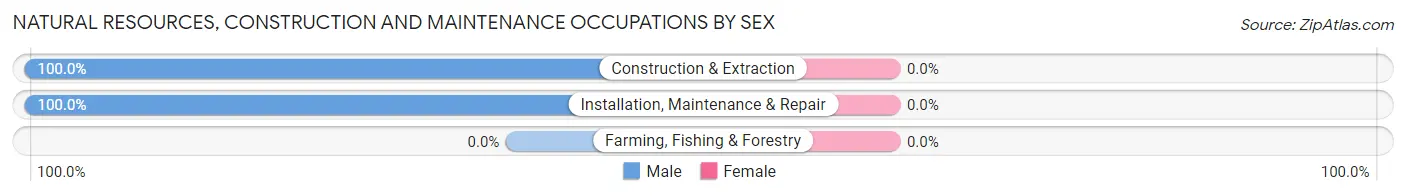
| Occupation | Male | Female |
| Farming, Fishing & Forestry | 0 (0.0%) | 0 (0.0%) |
| Construction & Extraction | 210 (100.0%) | 0 (0.0%) |
| Installation, Maintenance & Repair | 76 (100.0%) | 0 (0.0%) |
| Total (Category) | 286 (100.0%) | 0 (0.0%) |
| Total (Overall) | 1,562 (61.1%) | 994 (38.9%) |
Production, Transportation and Moving Occupations
The most common Production, Transportation and Moving occupations in Garwood borough are Material Moving (122 | 4.8%), Transportation (93 | 3.6%), and Production (63 | 2.5%).
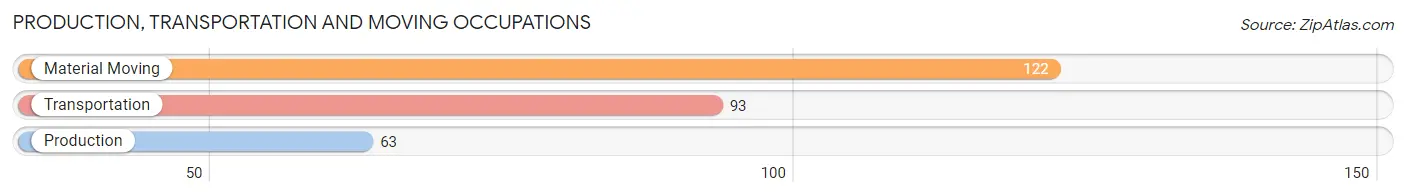
Production, Transportation and Moving Occupations by Sex
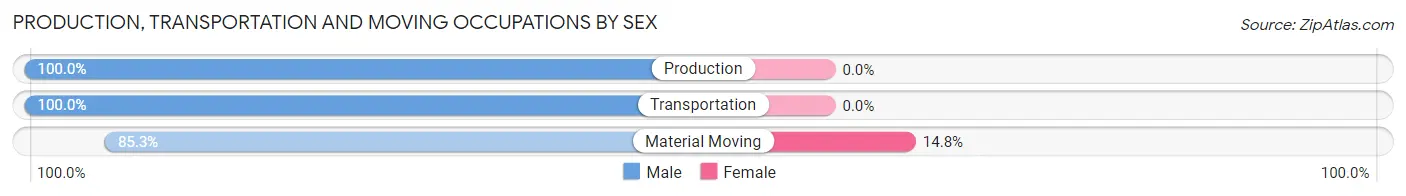
| Occupation | Male | Female |
| Production | 63 (100.0%) | 0 (0.0%) |
| Transportation | 93 (100.0%) | 0 (0.0%) |
| Material Moving | 104 (85.3%) | 18 (14.7%) |
| Total (Category) | 260 (93.5%) | 18 (6.5%) |
| Total (Overall) | 1,562 (61.1%) | 994 (38.9%) |
Employment Industries by Sex in Garwood borough
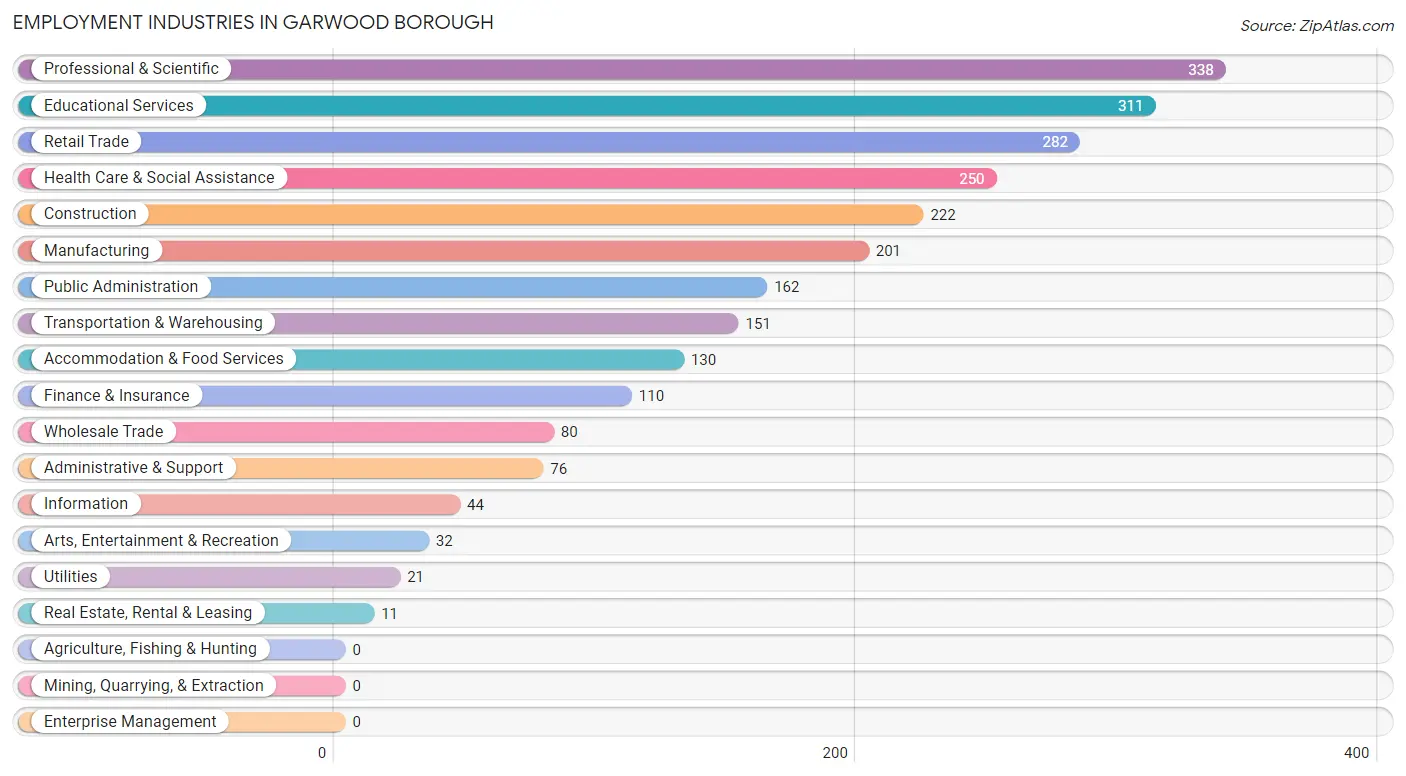
Employment Industries in Garwood borough
The major employment industries in Garwood borough include Professional & Scientific (338 | 13.2%), Educational Services (311 | 12.2%), Retail Trade (282 | 11.0%), Health Care & Social Assistance (250 | 9.8%), and Construction (222 | 8.7%).
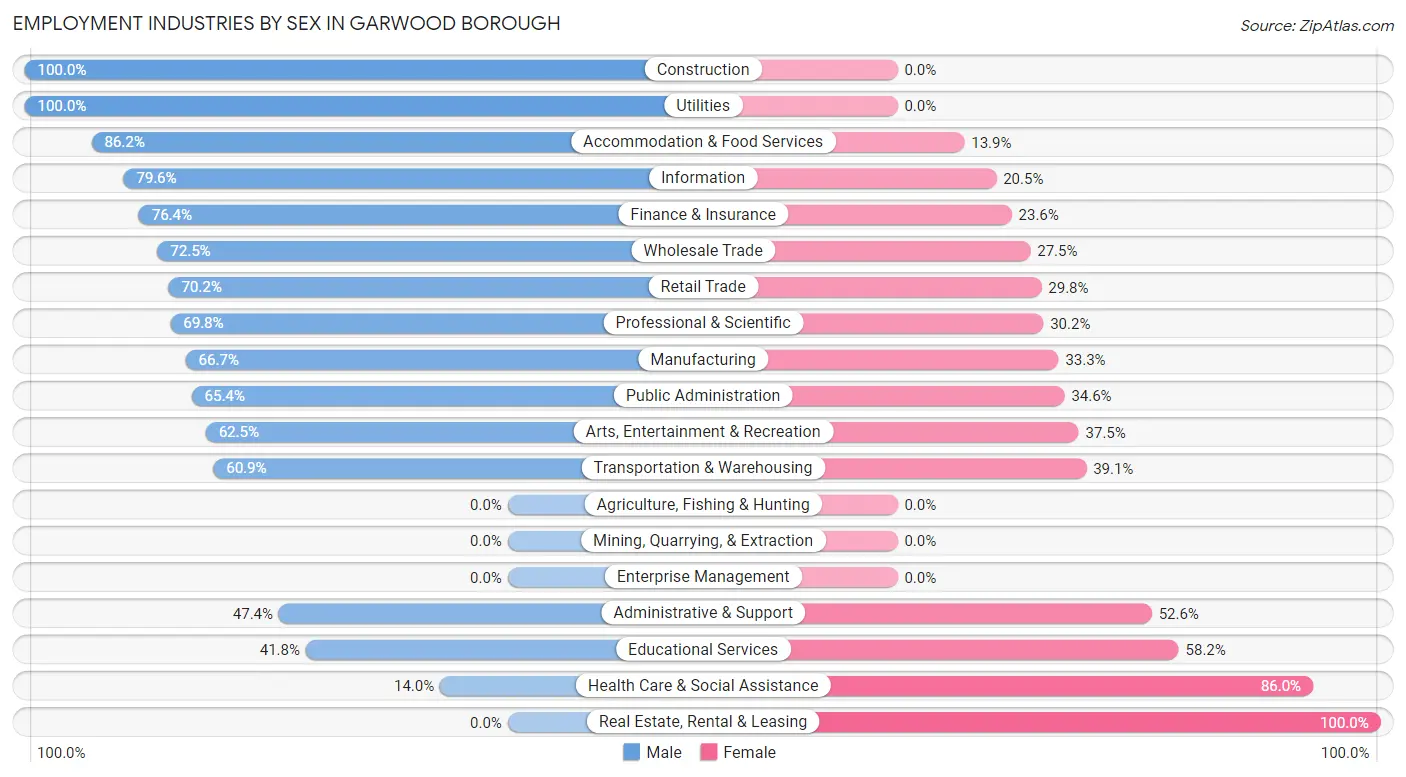
Employment Industries by Sex in Garwood borough
The Garwood borough industries that see more men than women are Construction (100.0%), Utilities (100.0%), and Accommodation & Food Services (86.2%), whereas the industries that tend to have a higher number of women are Real Estate, Rental & Leasing (100.0%), Health Care & Social Assistance (86.0%), and Educational Services (58.2%).
| Industry | Male | Female |
| Agriculture, Fishing & Hunting | 0 (0.0%) | 0 (0.0%) |
| Mining, Quarrying, & Extraction | 0 (0.0%) | 0 (0.0%) |
| Construction | 222 (100.0%) | 0 (0.0%) |
| Manufacturing | 134 (66.7%) | 67 (33.3%) |
| Wholesale Trade | 58 (72.5%) | 22 (27.5%) |
| Retail Trade | 198 (70.2%) | 84 (29.8%) |
| Transportation & Warehousing | 92 (60.9%) | 59 (39.1%) |
| Utilities | 21 (100.0%) | 0 (0.0%) |
| Information | 35 (79.5%) | 9 (20.4%) |
| Finance & Insurance | 84 (76.4%) | 26 (23.6%) |
| Real Estate, Rental & Leasing | 0 (0.0%) | 11 (100.0%) |
| Professional & Scientific | 236 (69.8%) | 102 (30.2%) |
| Enterprise Management | 0 (0.0%) | 0 (0.0%) |
| Administrative & Support | 36 (47.4%) | 40 (52.6%) |
| Educational Services | 130 (41.8%) | 181 (58.2%) |
| Health Care & Social Assistance | 35 (14.0%) | 215 (86.0%) |
| Arts, Entertainment & Recreation | 20 (62.5%) | 12 (37.5%) |
| Accommodation & Food Services | 112 (86.2%) | 18 (13.9%) |
| Public Administration | 106 (65.4%) | 56 (34.6%) |
| Total | 1,562 (61.1%) | 994 (38.9%) |
Education in Garwood borough
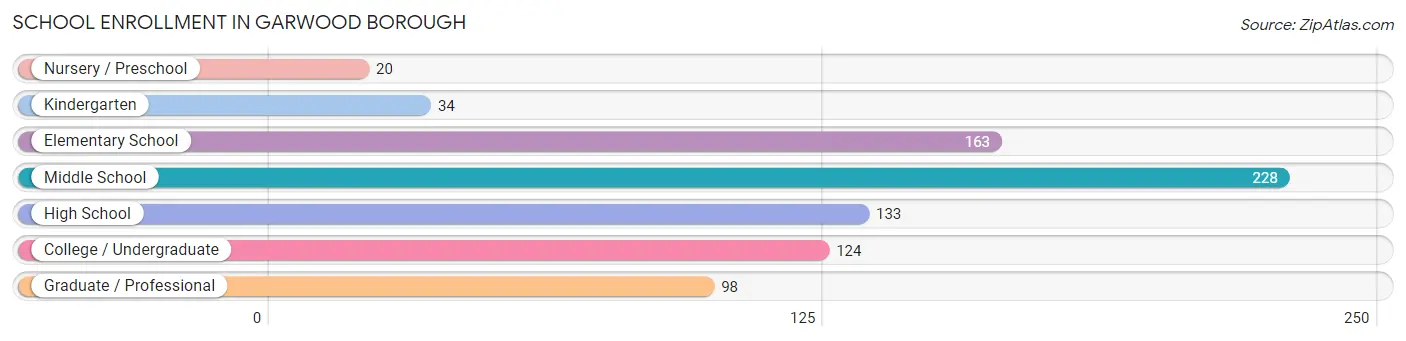
School Enrollment in Garwood borough
The most common levels of schooling among the 800 students in Garwood borough are middle school (228 | 28.5%), elementary school (163 | 20.4%), and high school (133 | 16.6%).
| School Level | # Students | % Students |
| Nursery / Preschool | 20 | 2.5% |
| Kindergarten | 34 | 4.3% |
| Elementary School | 163 | 20.4% |
| Middle School | 228 | 28.5% |
| High School | 133 | 16.6% |
| College / Undergraduate | 124 | 15.5% |
| Graduate / Professional | 98 | 12.2% |
| Total | 800 | 100.0% |
School Enrollment by Age by Funding Source in Garwood borough
Out of a total of 800 students who are enrolled in schools in Garwood borough, 101 (12.6%) attend a private institution, while the remaining 699 (87.4%) are enrolled in public schools. The age group of 3 to 4 year olds has the highest likelihood of being enrolled in private schools, with 13 (100.0% in the age bracket) enrolled. Conversely, the age group of 15 to 17 year olds has the lowest likelihood of being enrolled in a private school, with 155 (100.0% in the age bracket) attending a public institution.
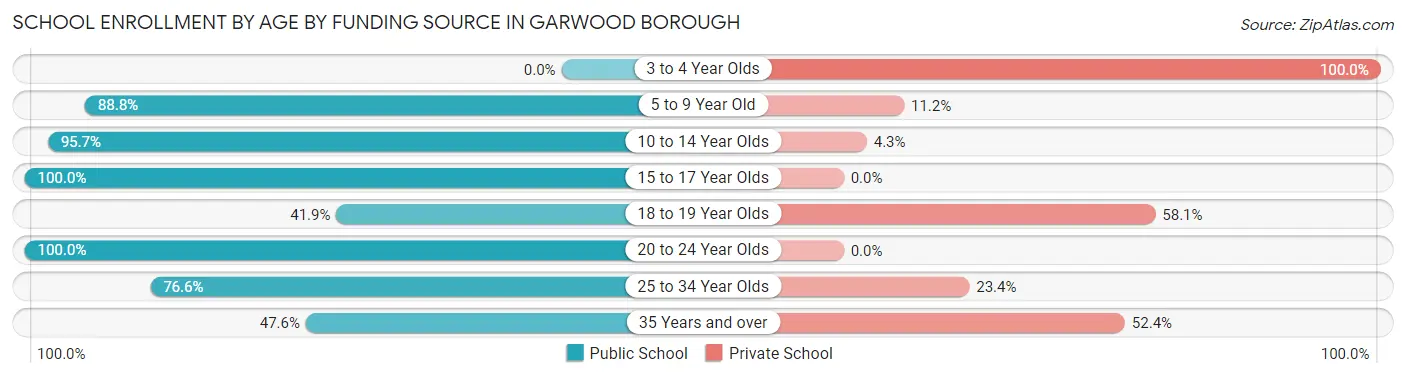
| Age Bracket | Public School | Private School |
| 3 to 4 Year Olds | 0 (0.0%) | 13 (100.0%) |
| 5 to 9 Year Old | 158 (88.8%) | 20 (11.2%) |
| 10 to 14 Year Olds | 222 (95.7%) | 10 (4.3%) |
| 15 to 17 Year Olds | 155 (100.0%) | 0 (0.0%) |
| 18 to 19 Year Olds | 26 (41.9%) | 36 (58.1%) |
| 20 to 24 Year Olds | 92 (100.0%) | 0 (0.0%) |
| 25 to 34 Year Olds | 36 (76.6%) | 11 (23.4%) |
| 35 Years and over | 10 (47.6%) | 11 (52.4%) |
| Total | 699 (87.4%) | 101 (12.6%) |
Educational Attainment by Field of Study in Garwood borough
Business (176 | 11.7%), education (170 | 11.3%), social sciences (160 | 10.7%), literature & languages (144 | 9.6%), and psychology (134 | 8.9%) are the most common fields of study among 1,500 individuals in Garwood borough who have obtained a bachelor's degree or higher.
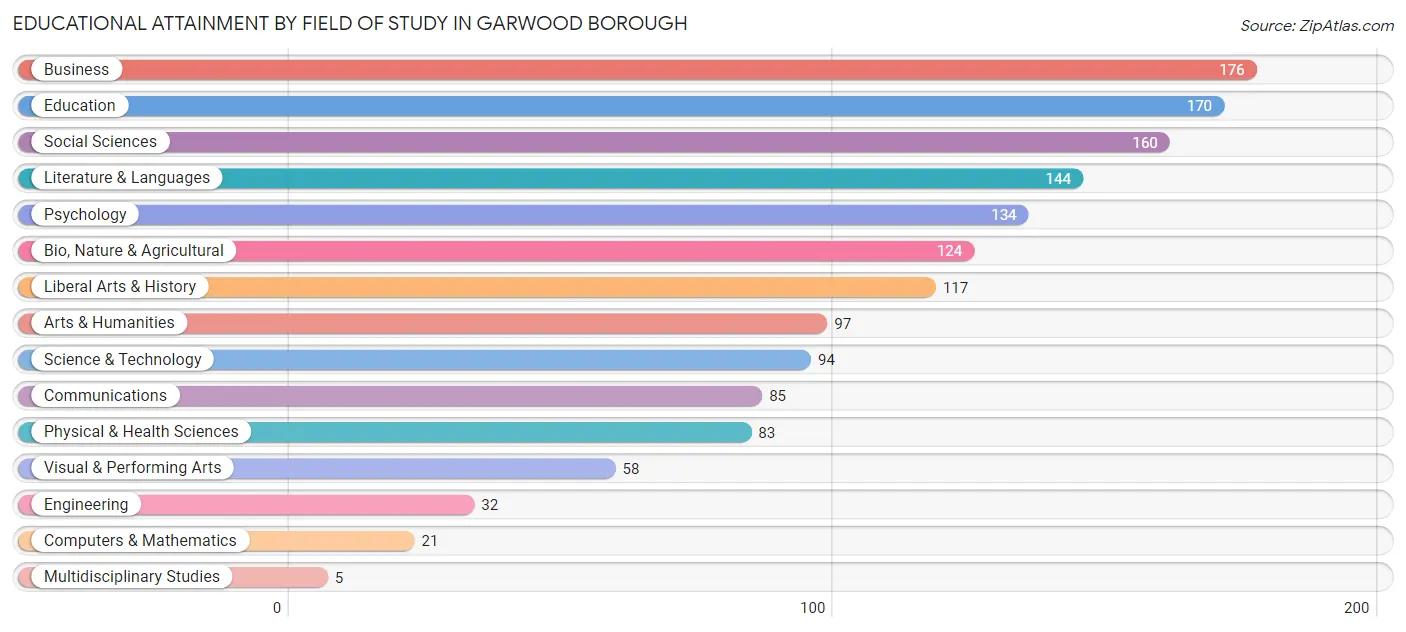
| Field of Study | # Graduates | % Graduates |
| Computers & Mathematics | 21 | 1.4% |
| Bio, Nature & Agricultural | 124 | 8.3% |
| Physical & Health Sciences | 83 | 5.5% |
| Psychology | 134 | 8.9% |
| Social Sciences | 160 | 10.7% |
| Engineering | 32 | 2.1% |
| Multidisciplinary Studies | 5 | 0.3% |
| Science & Technology | 94 | 6.3% |
| Business | 176 | 11.7% |
| Education | 170 | 11.3% |
| Literature & Languages | 144 | 9.6% |
| Liberal Arts & History | 117 | 7.8% |
| Visual & Performing Arts | 58 | 3.9% |
| Communications | 85 | 5.7% |
| Arts & Humanities | 97 | 6.5% |
| Total | 1,500 | 100.0% |
Transportation & Commute in Garwood borough
Vehicle Availability by Sex in Garwood borough
The most prevalent vehicle ownership categories in Garwood borough are males with 2 vehicles (562, accounting for 36.2%) and females with 2 vehicles (447, making up 59.7%).
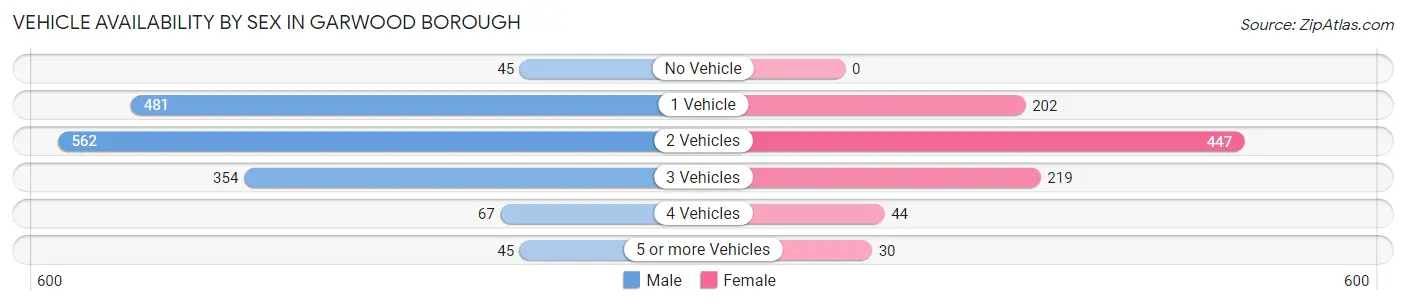
| Vehicles Available | Male | Female |
| No Vehicle | 45 (2.9%) | 0 (0.0%) |
| 1 Vehicle | 481 (30.9%) | 202 (21.4%) |
| 2 Vehicles | 562 (36.2%) | 447 (47.4%) |
| 3 Vehicles | 354 (22.8%) | 219 (23.3%) |
| 4 Vehicles | 67 (4.3%) | 44 (4.7%) |
| 5 or more Vehicles | 45 (2.9%) | 30 (3.2%) |
| Total | 1,554 (100.0%) | 942 (100.0%) |
Commute Time in Garwood borough
The most frequently occuring commute durations in Garwood borough are 20 to 24 minutes (469 commuters, 20.9%), 15 to 19 minutes (336 commuters, 15.0%), and 30 to 34 minutes (271 commuters, 12.1%).
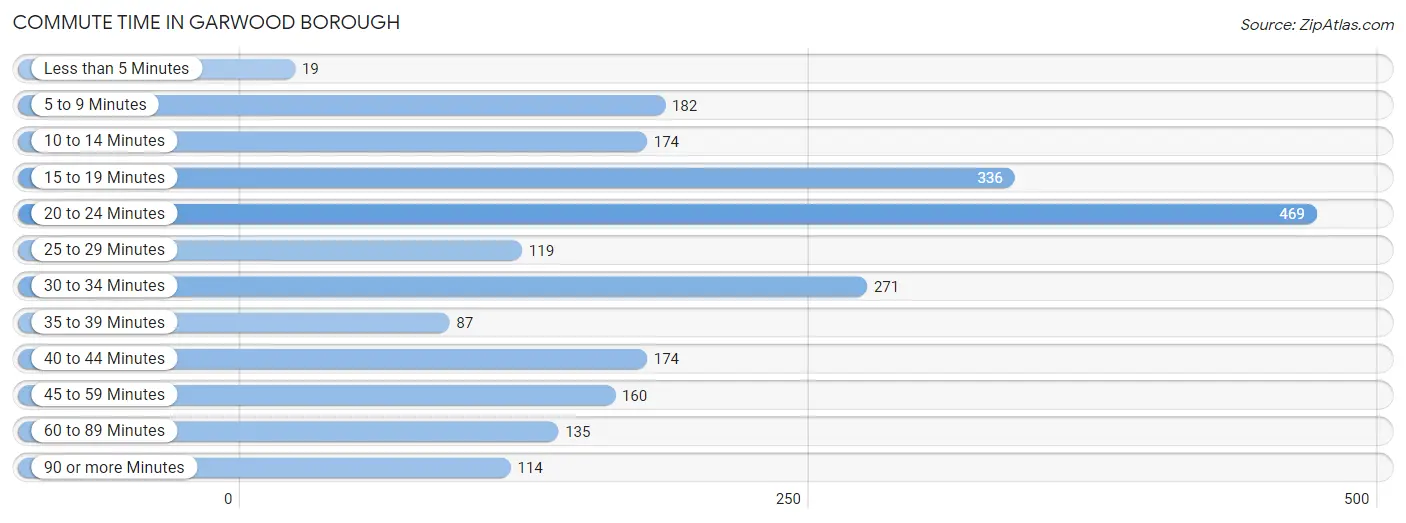
| Commute Time | # Commuters | % Commuters |
| Less than 5 Minutes | 19 | 0.9% |
| 5 to 9 Minutes | 182 | 8.1% |
| 10 to 14 Minutes | 174 | 7.8% |
| 15 to 19 Minutes | 336 | 15.0% |
| 20 to 24 Minutes | 469 | 20.9% |
| 25 to 29 Minutes | 119 | 5.3% |
| 30 to 34 Minutes | 271 | 12.1% |
| 35 to 39 Minutes | 87 | 3.9% |
| 40 to 44 Minutes | 174 | 7.8% |
| 45 to 59 Minutes | 160 | 7.1% |
| 60 to 89 Minutes | 135 | 6.0% |
| 90 or more Minutes | 114 | 5.1% |
Commute Time by Sex in Garwood borough
The most common commute times in Garwood borough are 20 to 24 minutes (269 commuters, 19.2%) for males and 20 to 24 minutes (200 commuters, 23.7%) for females.
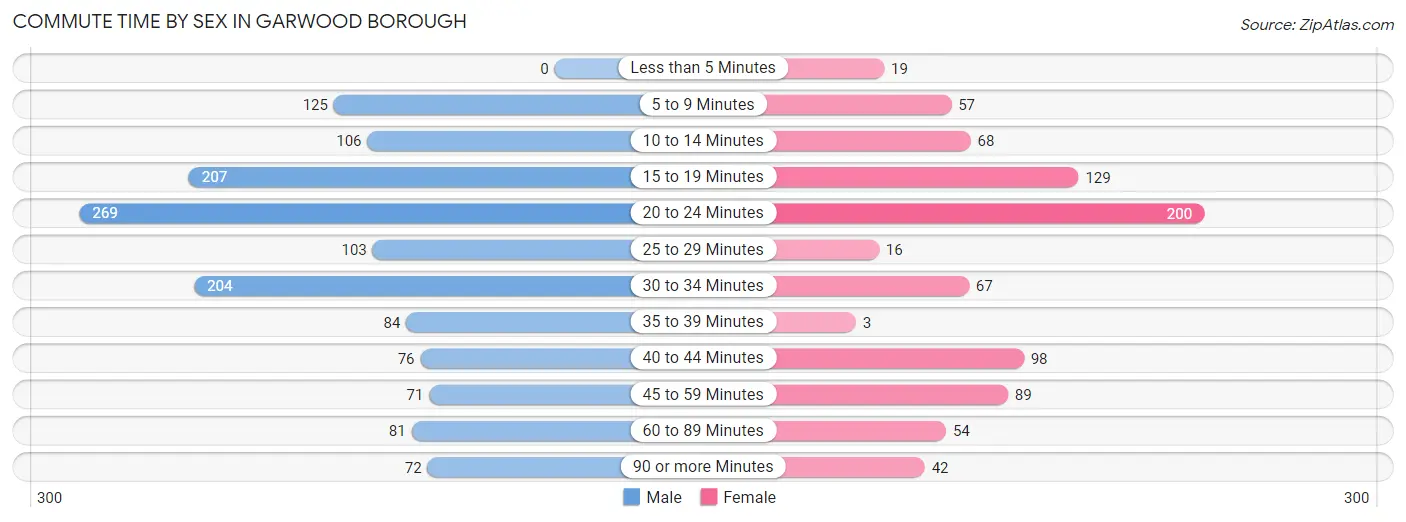
| Commute Time | Male | Female |
| Less than 5 Minutes | 0 (0.0%) | 19 (2.3%) |
| 5 to 9 Minutes | 125 (8.9%) | 57 (6.8%) |
| 10 to 14 Minutes | 106 (7.6%) | 68 (8.1%) |
| 15 to 19 Minutes | 207 (14.8%) | 129 (15.3%) |
| 20 to 24 Minutes | 269 (19.2%) | 200 (23.7%) |
| 25 to 29 Minutes | 103 (7.4%) | 16 (1.9%) |
| 30 to 34 Minutes | 204 (14.6%) | 67 (8.0%) |
| 35 to 39 Minutes | 84 (6.0%) | 3 (0.4%) |
| 40 to 44 Minutes | 76 (5.4%) | 98 (11.6%) |
| 45 to 59 Minutes | 71 (5.1%) | 89 (10.6%) |
| 60 to 89 Minutes | 81 (5.8%) | 54 (6.4%) |
| 90 or more Minutes | 72 (5.1%) | 42 (5.0%) |
Time of Departure to Work by Sex in Garwood borough
The most frequent times of departure to work in Garwood borough are 7:30 AM to 7:59 AM (250, 17.9%) for males and 7:30 AM to 7:59 AM (144, 17.1%) for females.
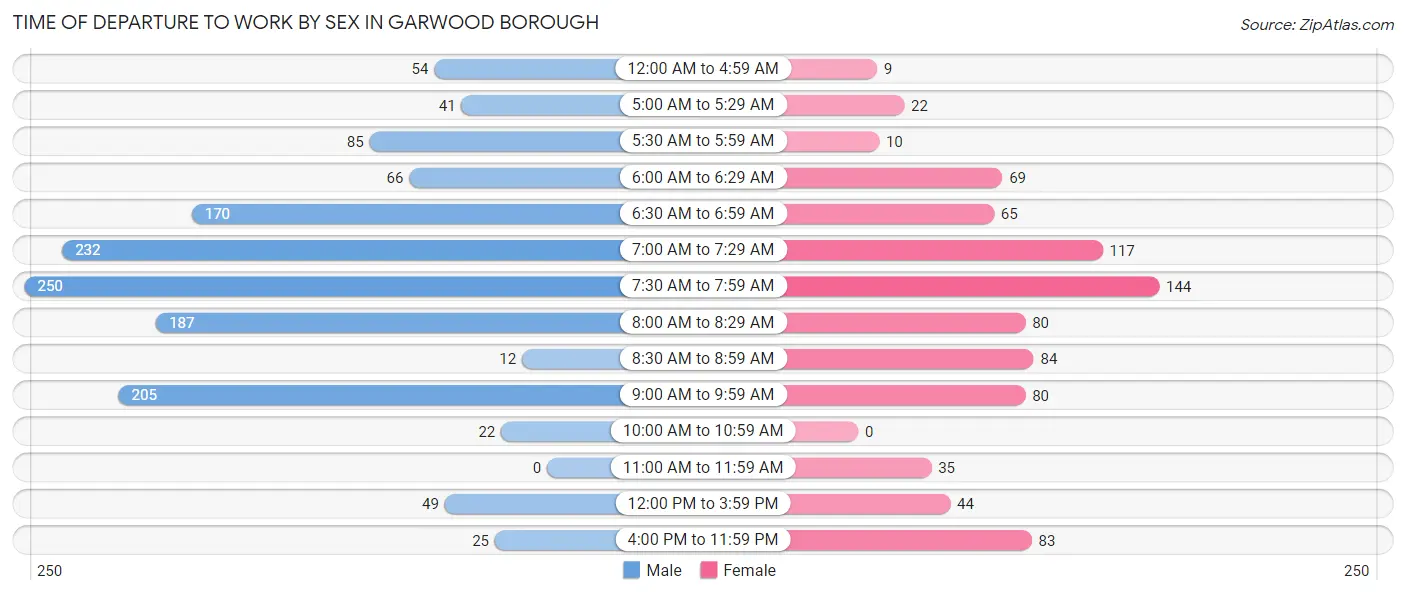
| Time of Departure | Male | Female |
| 12:00 AM to 4:59 AM | 54 (3.9%) | 9 (1.1%) |
| 5:00 AM to 5:29 AM | 41 (2.9%) | 22 (2.6%) |
| 5:30 AM to 5:59 AM | 85 (6.1%) | 10 (1.2%) |
| 6:00 AM to 6:29 AM | 66 (4.7%) | 69 (8.2%) |
| 6:30 AM to 6:59 AM | 170 (12.2%) | 65 (7.7%) |
| 7:00 AM to 7:29 AM | 232 (16.6%) | 117 (13.9%) |
| 7:30 AM to 7:59 AM | 250 (17.9%) | 144 (17.1%) |
| 8:00 AM to 8:29 AM | 187 (13.4%) | 80 (9.5%) |
| 8:30 AM to 8:59 AM | 12 (0.9%) | 84 (10.0%) |
| 9:00 AM to 9:59 AM | 205 (14.7%) | 80 (9.5%) |
| 10:00 AM to 10:59 AM | 22 (1.6%) | 0 (0.0%) |
| 11:00 AM to 11:59 AM | 0 (0.0%) | 35 (4.2%) |
| 12:00 PM to 3:59 PM | 49 (3.5%) | 44 (5.2%) |
| 4:00 PM to 11:59 PM | 25 (1.8%) | 83 (9.9%) |
| Total | 1,398 (100.0%) | 842 (100.0%) |
Housing Occupancy in Garwood borough
Occupancy by Ownership in Garwood borough
Of the total 1,956 dwellings in Garwood borough, owner-occupied units account for 1,000 (51.1%), while renter-occupied units make up 956 (48.9%).
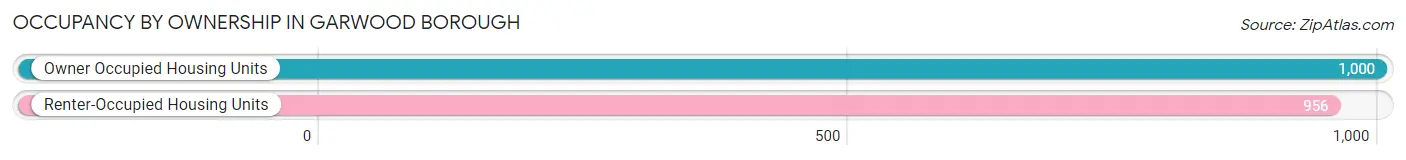
| Occupancy | # Housing Units | % Housing Units |
| Owner Occupied Housing Units | 1,000 | 51.1% |
| Renter-Occupied Housing Units | 956 | 48.9% |
| Total Occupied Housing Units | 1,956 | 100.0% |
Occupancy by Household Size in Garwood borough
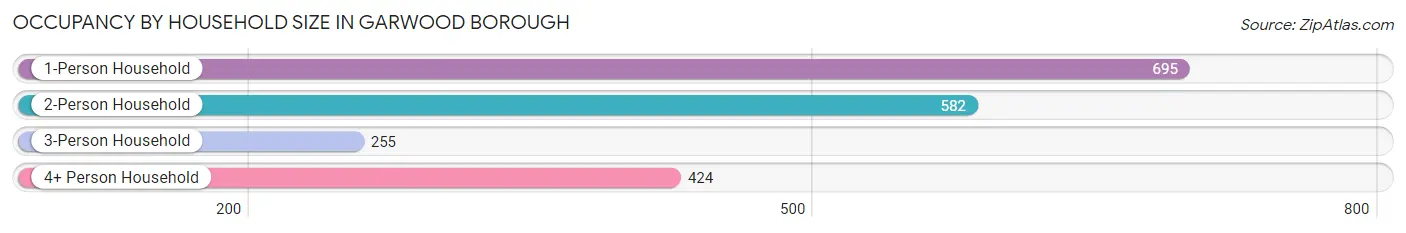
| Household Size | # Housing Units | % Housing Units |
| 1-Person Household | 695 | 35.5% |
| 2-Person Household | 582 | 29.7% |
| 3-Person Household | 255 | 13.0% |
| 4+ Person Household | 424 | 21.7% |
| Total Housing Units | 1,956 | 100.0% |
Occupancy by Ownership by Household Size in Garwood borough
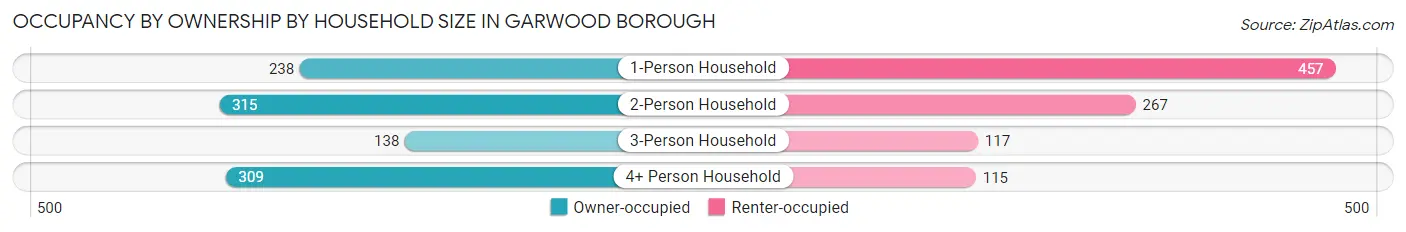
| Household Size | Owner-occupied | Renter-occupied |
| 1-Person Household | 238 (34.2%) | 457 (65.8%) |
| 2-Person Household | 315 (54.1%) | 267 (45.9%) |
| 3-Person Household | 138 (54.1%) | 117 (45.9%) |
| 4+ Person Household | 309 (72.9%) | 115 (27.1%) |
| Total Housing Units | 1,000 (51.1%) | 956 (48.9%) |
Occupancy by Educational Attainment in Garwood borough
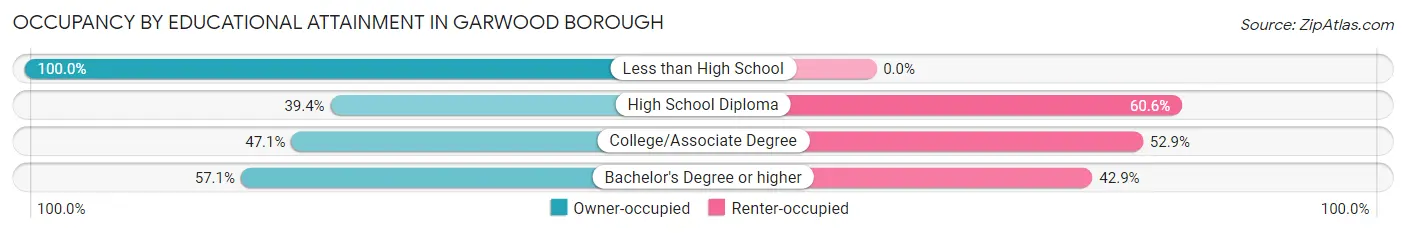
| Household Size | Owner-occupied | Renter-occupied |
| Less than High School | 59 (100.0%) | 0 (0.0%) |
| High School Diploma | 185 (39.4%) | 285 (60.6%) |
| College/Associate Degree | 279 (47.1%) | 313 (52.9%) |
| Bachelor's Degree or higher | 477 (57.1%) | 358 (42.9%) |
Occupancy by Age of Householder in Garwood borough
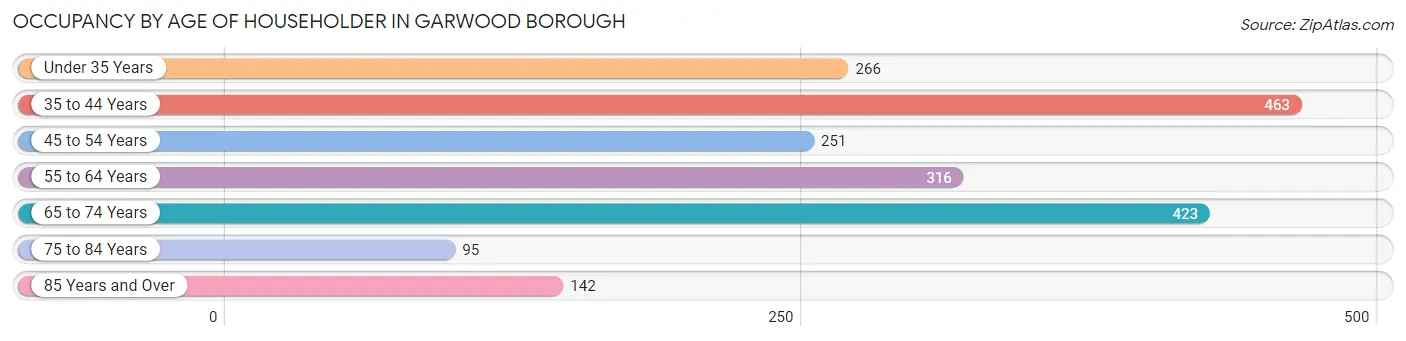
| Age Bracket | # Households | % Households |
| Under 35 Years | 266 | 13.6% |
| 35 to 44 Years | 463 | 23.7% |
| 45 to 54 Years | 251 | 12.8% |
| 55 to 64 Years | 316 | 16.2% |
| 65 to 74 Years | 423 | 21.6% |
| 75 to 84 Years | 95 | 4.9% |
| 85 Years and Over | 142 | 7.3% |
| Total | 1,956 | 100.0% |
Housing Finances in Garwood borough
Median Income by Occupancy in Garwood borough
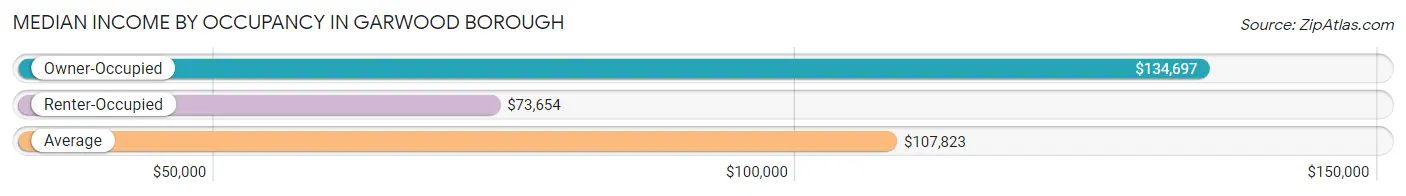
| Occupancy Type | # Households | Median Income |
| Owner-Occupied | 1,000 (51.1%) | $134,697 |
| Renter-Occupied | 956 (48.9%) | $73,654 |
| Average | 1,956 (100.0%) | $107,823 |
Occupancy by Householder Income Bracket in Garwood borough
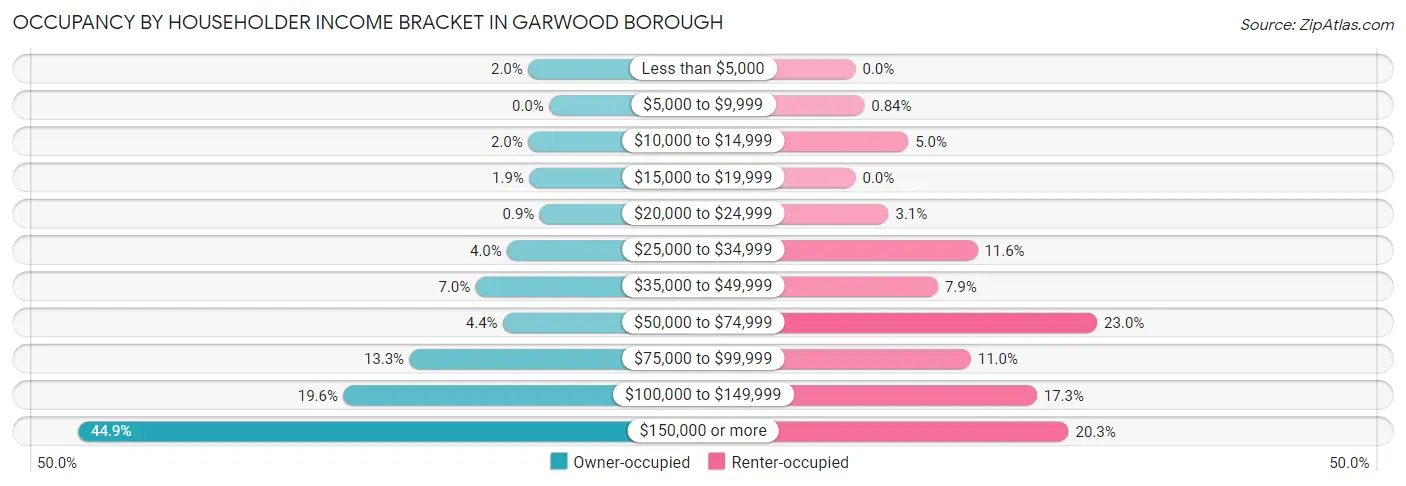
| Income Bracket | Owner-occupied | Renter-occupied |
| Less than $5,000 | 20 (2.0%) | 0 (0.0%) |
| $5,000 to $9,999 | 0 (0.0%) | 8 (0.8%) |
| $10,000 to $14,999 | 20 (2.0%) | 48 (5.0%) |
| $15,000 to $19,999 | 19 (1.9%) | 0 (0.0%) |
| $20,000 to $24,999 | 9 (0.9%) | 30 (3.1%) |
| $25,000 to $34,999 | 40 (4.0%) | 111 (11.6%) |
| $35,000 to $49,999 | 70 (7.0%) | 75 (7.9%) |
| $50,000 to $74,999 | 44 (4.4%) | 220 (23.0%) |
| $75,000 to $99,999 | 133 (13.3%) | 105 (11.0%) |
| $100,000 to $149,999 | 196 (19.6%) | 165 (17.3%) |
| $150,000 or more | 449 (44.9%) | 194 (20.3%) |
| Total | 1,000 (100.0%) | 956 (100.0%) |
Monthly Housing Cost Tiers in Garwood borough
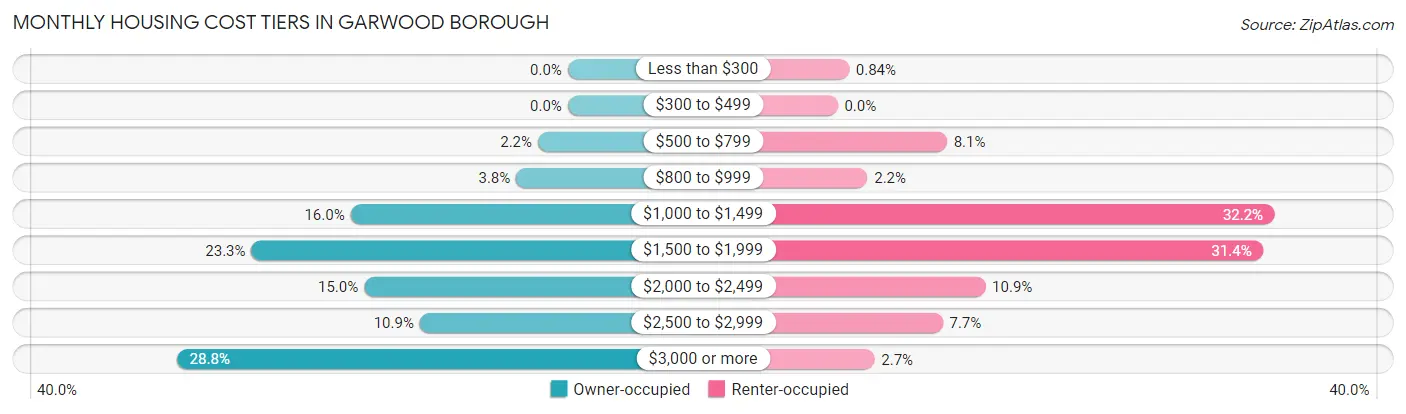
| Monthly Cost | Owner-occupied | Renter-occupied |
| Less than $300 | 0 (0.0%) | 8 (0.8%) |
| $300 to $499 | 0 (0.0%) | 0 (0.0%) |
| $500 to $799 | 22 (2.2%) | 77 (8.1%) |
| $800 to $999 | 38 (3.8%) | 21 (2.2%) |
| $1,000 to $1,499 | 160 (16.0%) | 308 (32.2%) |
| $1,500 to $1,999 | 233 (23.3%) | 300 (31.4%) |
| $2,000 to $2,499 | 150 (15.0%) | 104 (10.9%) |
| $2,500 to $2,999 | 109 (10.9%) | 74 (7.7%) |
| $3,000 or more | 288 (28.8%) | 26 (2.7%) |
| Total | 1,000 (100.0%) | 956 (100.0%) |
Physical Housing Characteristics in Garwood borough
Housing Structures in Garwood borough
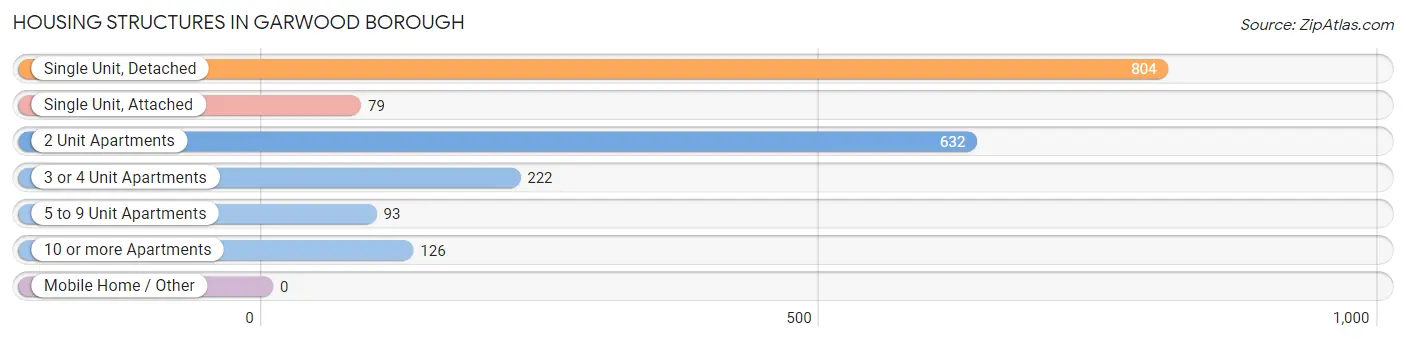
| Structure Type | # Housing Units | % Housing Units |
| Single Unit, Detached | 804 | 41.1% |
| Single Unit, Attached | 79 | 4.0% |
| 2 Unit Apartments | 632 | 32.3% |
| 3 or 4 Unit Apartments | 222 | 11.4% |
| 5 to 9 Unit Apartments | 93 | 4.8% |
| 10 or more Apartments | 126 | 6.4% |
| Mobile Home / Other | 0 | 0.0% |
| Total | 1,956 | 100.0% |
Housing Structures by Occupancy in Garwood borough
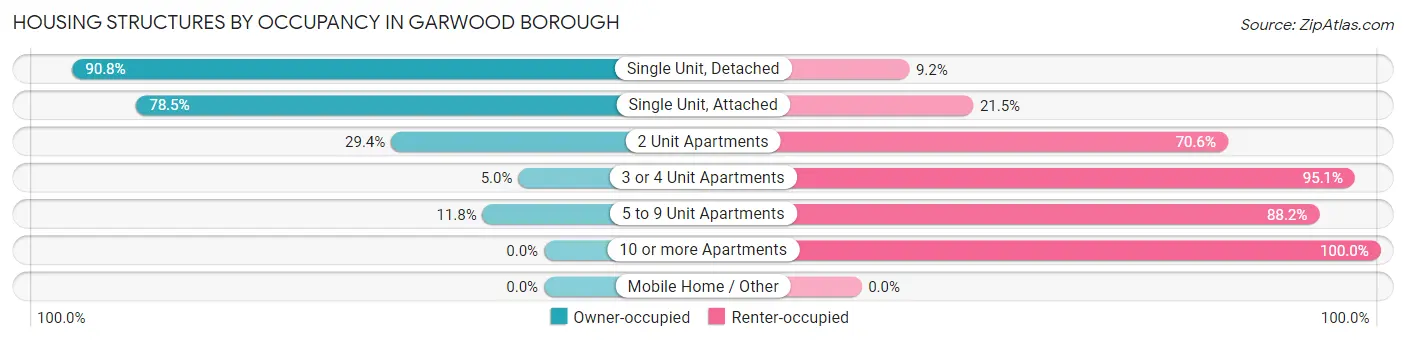
| Structure Type | Owner-occupied | Renter-occupied |
| Single Unit, Detached | 730 (90.8%) | 74 (9.2%) |
| Single Unit, Attached | 62 (78.5%) | 17 (21.5%) |
| 2 Unit Apartments | 186 (29.4%) | 446 (70.6%) |
| 3 or 4 Unit Apartments | 11 (5.0%) | 211 (95.1%) |
| 5 to 9 Unit Apartments | 11 (11.8%) | 82 (88.2%) |
| 10 or more Apartments | 0 (0.0%) | 126 (100.0%) |
| Mobile Home / Other | 0 (0.0%) | 0 (0.0%) |
| Total | 1,000 (51.1%) | 956 (48.9%) |
Housing Structures by Number of Rooms in Garwood borough
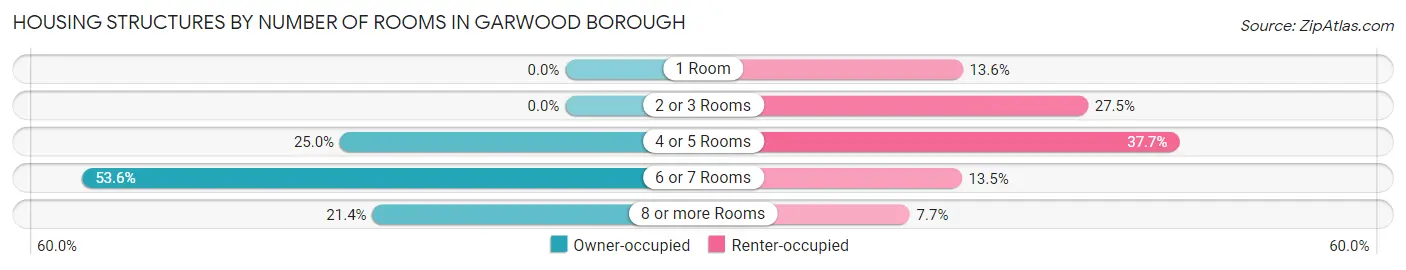
| Number of Rooms | Owner-occupied | Renter-occupied |
| 1 Room | 0 (0.0%) | 130 (13.6%) |
| 2 or 3 Rooms | 0 (0.0%) | 263 (27.5%) |
| 4 or 5 Rooms | 250 (25.0%) | 360 (37.7%) |
| 6 or 7 Rooms | 536 (53.6%) | 129 (13.5%) |
| 8 or more Rooms | 214 (21.4%) | 74 (7.7%) |
| Total | 1,000 (100.0%) | 956 (100.0%) |
Housing Structure by Heating Type in Garwood borough
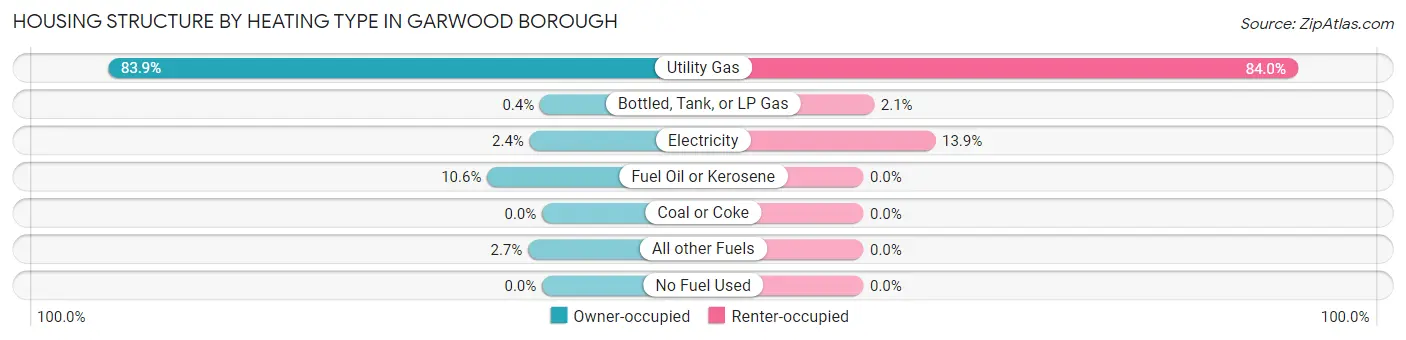
| Heating Type | Owner-occupied | Renter-occupied |
| Utility Gas | 839 (83.9%) | 803 (84.0%) |
| Bottled, Tank, or LP Gas | 4 (0.4%) | 20 (2.1%) |
| Electricity | 24 (2.4%) | 133 (13.9%) |
| Fuel Oil or Kerosene | 106 (10.6%) | 0 (0.0%) |
| Coal or Coke | 0 (0.0%) | 0 (0.0%) |
| All other Fuels | 27 (2.7%) | 0 (0.0%) |
| No Fuel Used | 0 (0.0%) | 0 (0.0%) |
| Total | 1,000 (100.0%) | 956 (100.0%) |
Household Vehicle Usage in Garwood borough
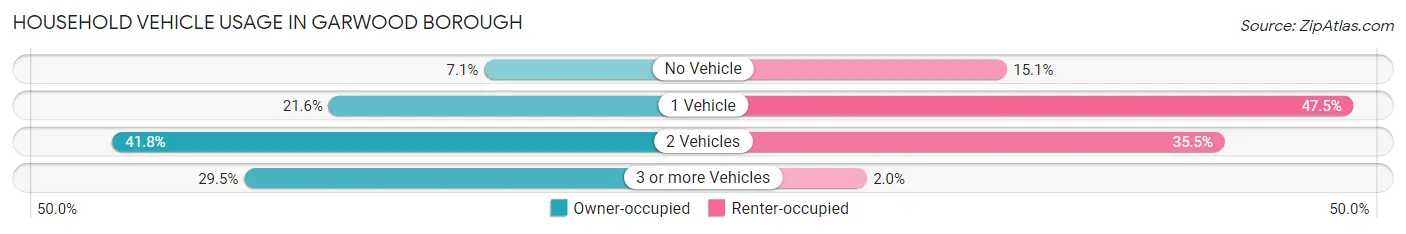
| Vehicles per Household | Owner-occupied | Renter-occupied |
| No Vehicle | 71 (7.1%) | 144 (15.1%) |
| 1 Vehicle | 216 (21.6%) | 454 (47.5%) |
| 2 Vehicles | 418 (41.8%) | 339 (35.5%) |
| 3 or more Vehicles | 295 (29.5%) | 19 (2.0%) |
| Total | 1,000 (100.0%) | 956 (100.0%) |
Real Estate & Mortgages in Garwood borough
Real Estate and Mortgage Overview in Garwood borough
| Characteristic | Without Mortgage | With Mortgage |
| Housing Units | 401 | 599 |
| Median Property Value | $483,300 | $461,700 |
| Median Household Income | $92,679 | $335 |
| Monthly Housing Costs | $1,343 | $273 |
| Real Estate Taxes | $10,001 | $0 |
Property Value by Mortgage Status in Garwood borough
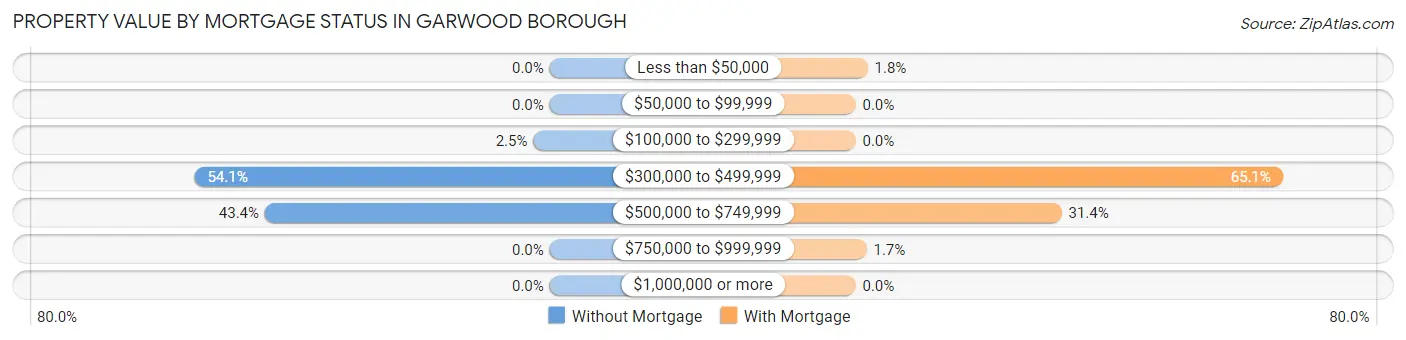
| Property Value | Without Mortgage | With Mortgage |
| Less than $50,000 | 0 (0.0%) | 11 (1.8%) |
| $50,000 to $99,999 | 0 (0.0%) | 0 (0.0%) |
| $100,000 to $299,999 | 10 (2.5%) | 0 (0.0%) |
| $300,000 to $499,999 | 217 (54.1%) | 390 (65.1%) |
| $500,000 to $749,999 | 174 (43.4%) | 188 (31.4%) |
| $750,000 to $999,999 | 0 (0.0%) | 10 (1.7%) |
| $1,000,000 or more | 0 (0.0%) | 0 (0.0%) |
| Total | 401 (100.0%) | 599 (100.0%) |
Household Income by Mortgage Status in Garwood borough
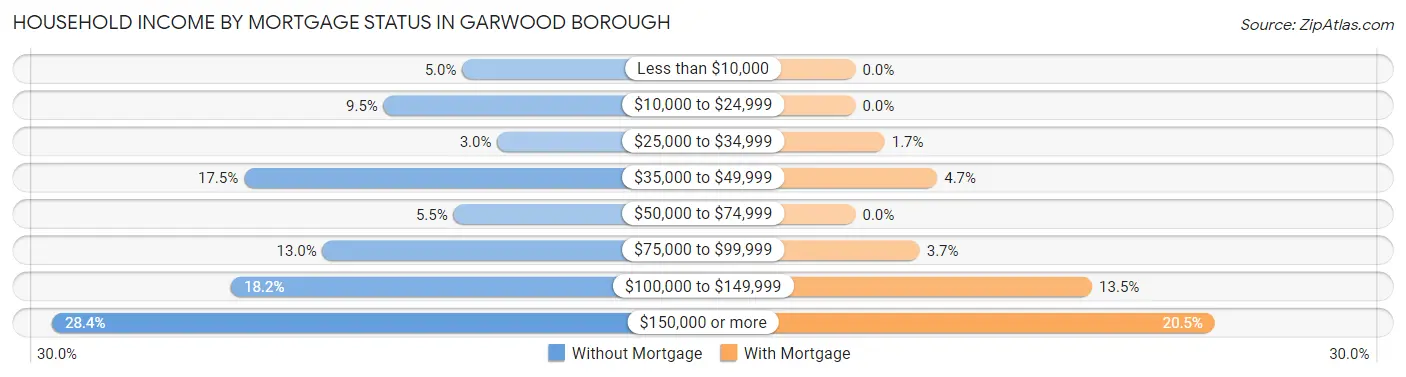
| Household Income | Without Mortgage | With Mortgage |
| Less than $10,000 | 20 (5.0%) | 0 (0.0%) |
| $10,000 to $24,999 | 38 (9.5%) | 0 (0.0%) |
| $25,000 to $34,999 | 12 (3.0%) | 10 (1.7%) |
| $35,000 to $49,999 | 70 (17.5%) | 28 (4.7%) |
| $50,000 to $74,999 | 22 (5.5%) | 0 (0.0%) |
| $75,000 to $99,999 | 52 (13.0%) | 22 (3.7%) |
| $100,000 to $149,999 | 73 (18.2%) | 81 (13.5%) |
| $150,000 or more | 114 (28.4%) | 123 (20.5%) |
| Total | 401 (100.0%) | 599 (100.0%) |
Property Value to Household Income Ratio in Garwood borough
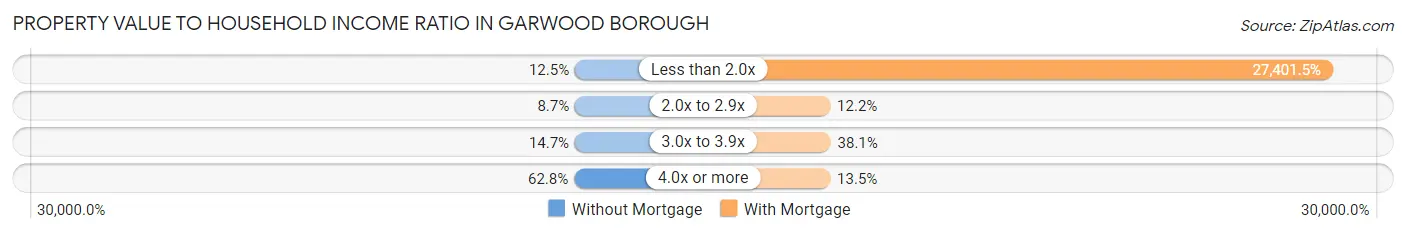
| Value-to-Income Ratio | Without Mortgage | With Mortgage |
| Less than 2.0x | 50 (12.5%) | 164,135 (27,401.5%) |
| 2.0x to 2.9x | 35 (8.7%) | 73 (12.2%) |
| 3.0x to 3.9x | 59 (14.7%) | 228 (38.1%) |
| 4.0x or more | 252 (62.8%) | 81 (13.5%) |
| Total | 401 (100.0%) | 599 (100.0%) |
Real Estate Taxes by Mortgage Status in Garwood borough
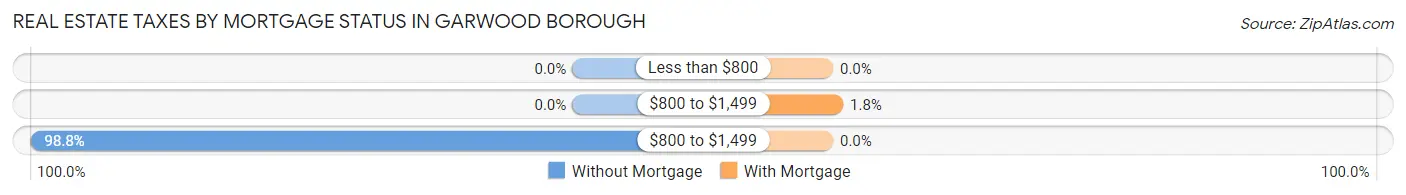
| Property Taxes | Without Mortgage | With Mortgage |
| Less than $800 | 0 (0.0%) | 0 (0.0%) |
| $800 to $1,499 | 0 (0.0%) | 11 (1.8%) |
| $800 to $1,499 | 396 (98.8%) | 0 (0.0%) |
| Total | 401 (100.0%) | 599 (100.0%) |
Health & Disability in Garwood borough
Health Insurance Coverage by Age in Garwood borough
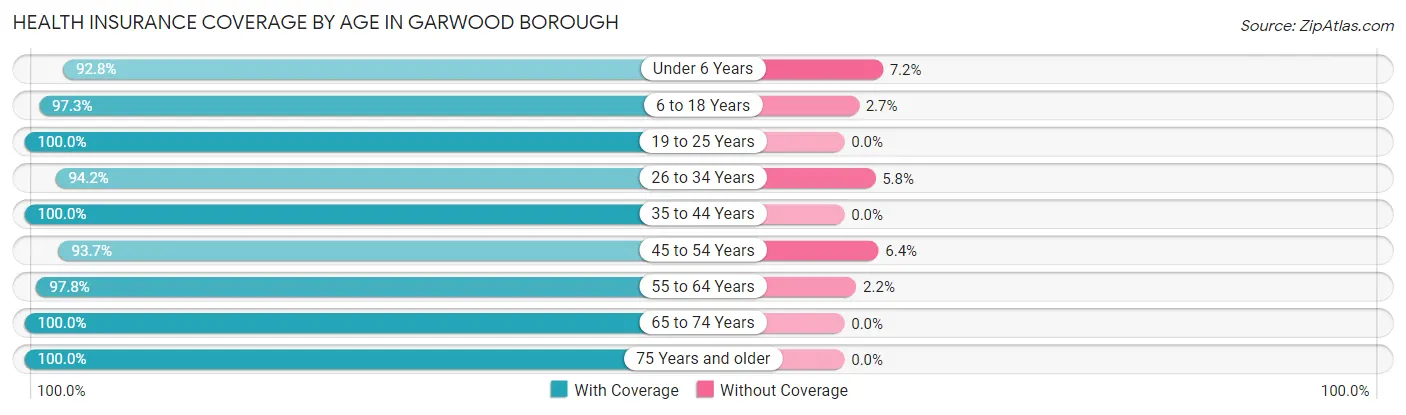
| Age Bracket | With Coverage | Without Coverage |
| Under 6 Years | 220 (92.8%) | 17 (7.2%) |
| 6 to 18 Years | 542 (97.3%) | 15 (2.7%) |
| 19 to 25 Years | 369 (100.0%) | 0 (0.0%) |
| 26 to 34 Years | 556 (94.2%) | 34 (5.8%) |
| 35 to 44 Years | 719 (100.0%) | 0 (0.0%) |
| 45 to 54 Years | 546 (93.6%) | 37 (6.4%) |
| 55 to 64 Years | 530 (97.8%) | 12 (2.2%) |
| 65 to 74 Years | 513 (100.0%) | 0 (0.0%) |
| 75 Years and older | 432 (100.0%) | 0 (0.0%) |
| Total | 4,427 (97.5%) | 115 (2.5%) |
Health Insurance Coverage by Citizenship Status in Garwood borough
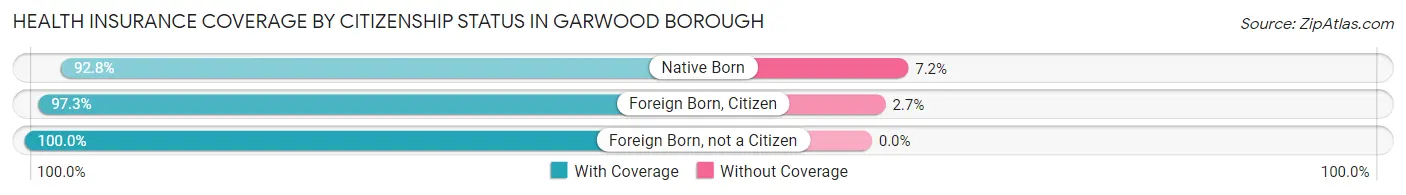
| Citizenship Status | With Coverage | Without Coverage |
| Native Born | 220 (92.8%) | 17 (7.2%) |
| Foreign Born, Citizen | 542 (97.3%) | 15 (2.7%) |
| Foreign Born, not a Citizen | 369 (100.0%) | 0 (0.0%) |
Health Insurance Coverage by Household Income in Garwood borough
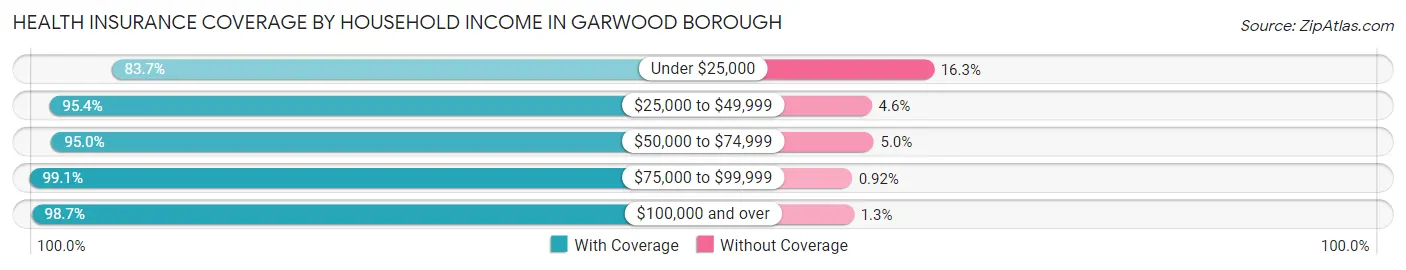
| Household Income | With Coverage | Without Coverage |
| Under $25,000 | 149 (83.7%) | 29 (16.3%) |
| $25,000 to $49,999 | 473 (95.4%) | 23 (4.6%) |
| $50,000 to $74,999 | 379 (95.0%) | 20 (5.0%) |
| $75,000 to $99,999 | 536 (99.1%) | 5 (0.9%) |
| $100,000 and over | 2,890 (98.7%) | 38 (1.3%) |
Public vs Private Health Insurance Coverage by Age in Garwood borough
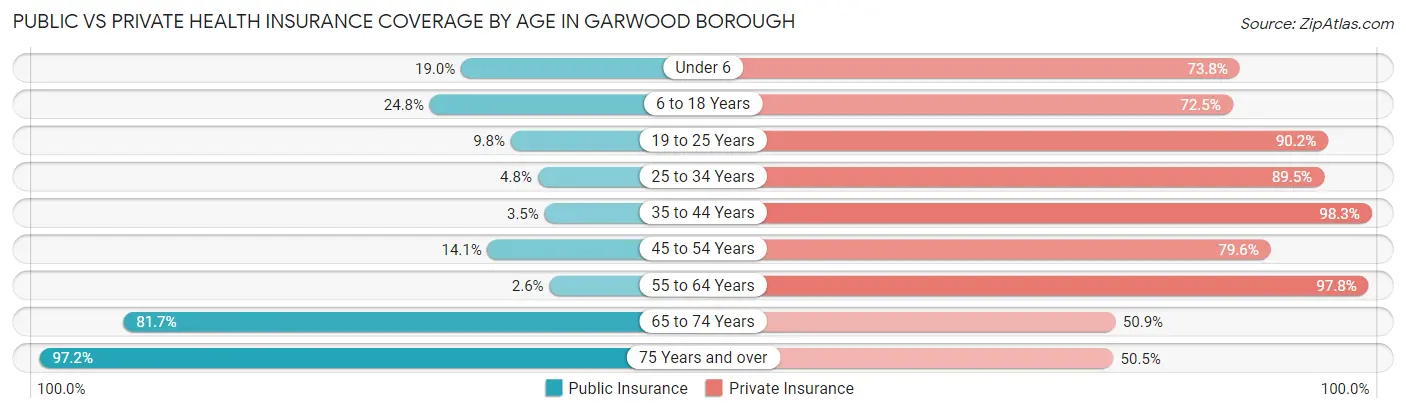
| Age Bracket | Public Insurance | Private Insurance |
| Under 6 | 45 (19.0%) | 175 (73.8%) |
| 6 to 18 Years | 138 (24.8%) | 404 (72.5%) |
| 19 to 25 Years | 36 (9.8%) | 333 (90.2%) |
| 25 to 34 Years | 28 (4.8%) | 528 (89.5%) |
| 35 to 44 Years | 25 (3.5%) | 707 (98.3%) |
| 45 to 54 Years | 82 (14.1%) | 464 (79.6%) |
| 55 to 64 Years | 14 (2.6%) | 530 (97.8%) |
| 65 to 74 Years | 419 (81.7%) | 261 (50.9%) |
| 75 Years and over | 420 (97.2%) | 218 (50.5%) |
| Total | 1,207 (26.6%) | 3,620 (79.7%) |
Disability Status by Sex by Age in Garwood borough
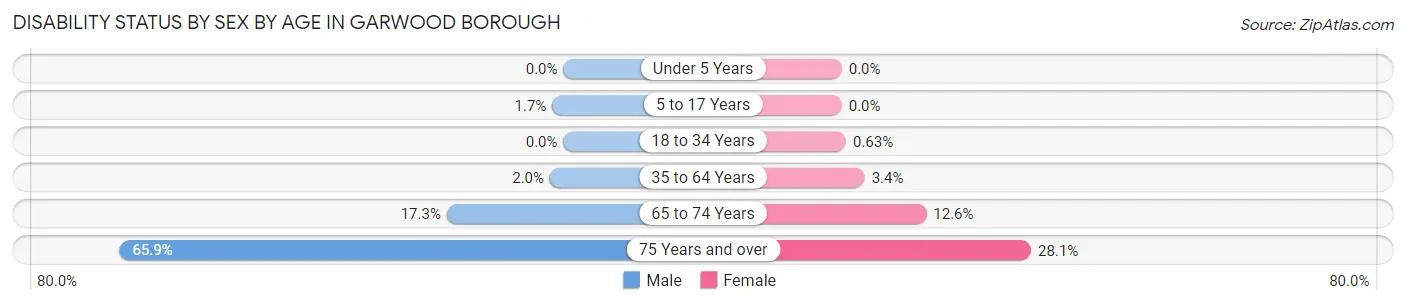
| Age Bracket | Male | Female |
| Under 5 Years | 0 (0.0%) | 0 (0.0%) |
| 5 to 17 Years | 5 (1.7%) | 0 (0.0%) |
| 18 to 34 Years | 0 (0.0%) | 3 (0.6%) |
| 35 to 64 Years | 21 (2.0%) | 27 (3.4%) |
| 65 to 74 Years | 53 (17.3%) | 26 (12.6%) |
| 75 Years and over | 116 (65.9%) | 72 (28.1%) |
Disability Class by Sex by Age in Garwood borough
Disability Class: Hearing Difficulty
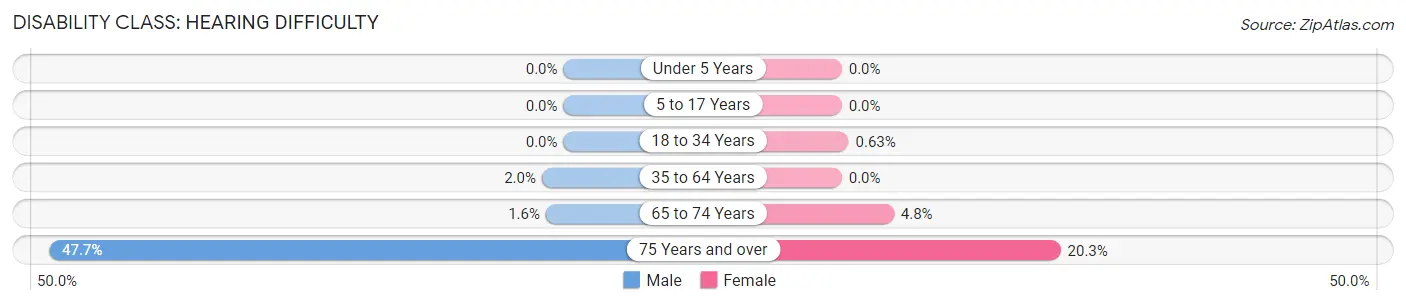
| Age Bracket | Male | Female |
| Under 5 Years | 0 (0.0%) | 0 (0.0%) |
| 5 to 17 Years | 0 (0.0%) | 0 (0.0%) |
| 18 to 34 Years | 0 (0.0%) | 3 (0.6%) |
| 35 to 64 Years | 21 (2.0%) | 0 (0.0%) |
| 65 to 74 Years | 5 (1.6%) | 10 (4.8%) |
| 75 Years and over | 84 (47.7%) | 52 (20.3%) |
Disability Class: Vision Difficulty
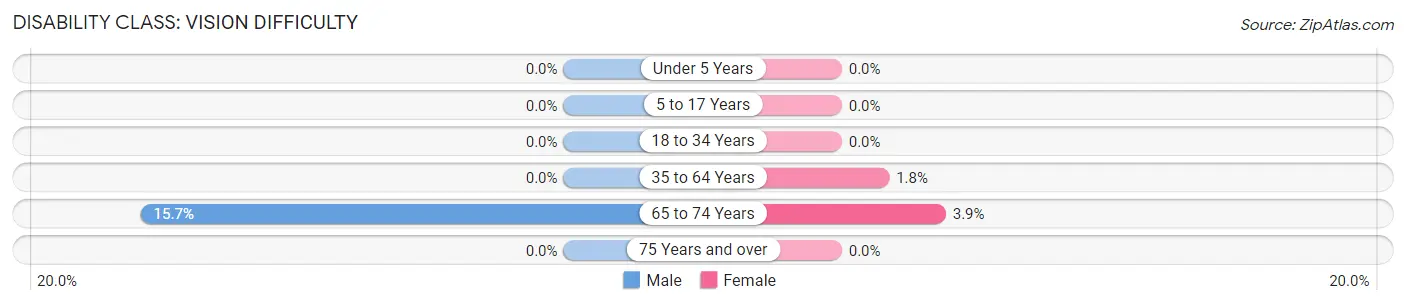
| Age Bracket | Male | Female |
| Under 5 Years | 0 (0.0%) | 0 (0.0%) |
| 5 to 17 Years | 0 (0.0%) | 0 (0.0%) |
| 18 to 34 Years | 0 (0.0%) | 0 (0.0%) |
| 35 to 64 Years | 0 (0.0%) | 14 (1.8%) |
| 65 to 74 Years | 48 (15.7%) | 8 (3.9%) |
| 75 Years and over | 0 (0.0%) | 0 (0.0%) |
Disability Class: Cognitive Difficulty
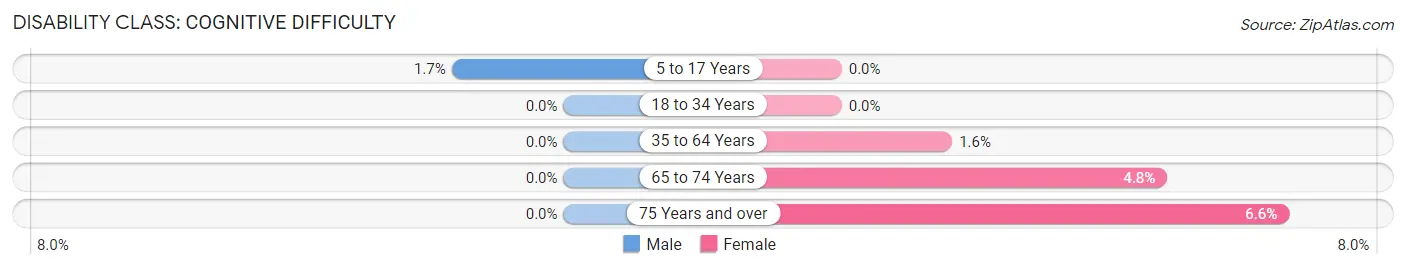
| Age Bracket | Male | Female |
| 5 to 17 Years | 5 (1.7%) | 0 (0.0%) |
| 18 to 34 Years | 0 (0.0%) | 0 (0.0%) |
| 35 to 64 Years | 0 (0.0%) | 13 (1.6%) |
| 65 to 74 Years | 0 (0.0%) | 10 (4.8%) |
| 75 Years and over | 0 (0.0%) | 17 (6.6%) |
Disability Class: Ambulatory Difficulty
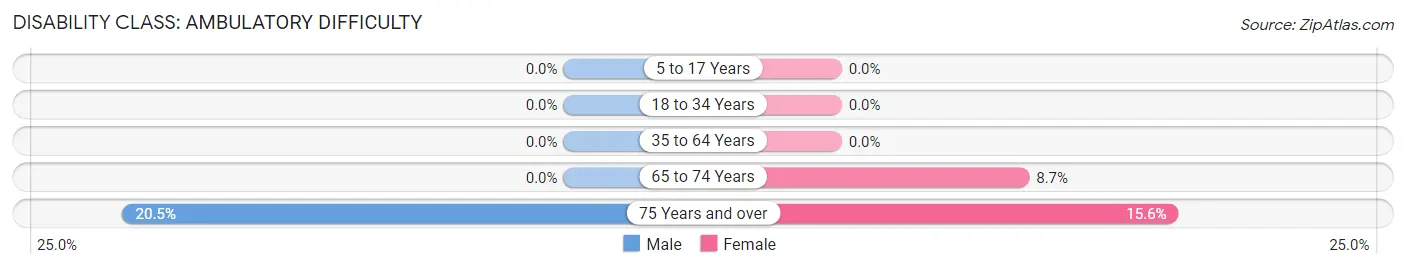
| Age Bracket | Male | Female |
| 5 to 17 Years | 0 (0.0%) | 0 (0.0%) |
| 18 to 34 Years | 0 (0.0%) | 0 (0.0%) |
| 35 to 64 Years | 0 (0.0%) | 0 (0.0%) |
| 65 to 74 Years | 0 (0.0%) | 18 (8.7%) |
| 75 Years and over | 36 (20.4%) | 40 (15.6%) |
Disability Class: Self-Care Difficulty
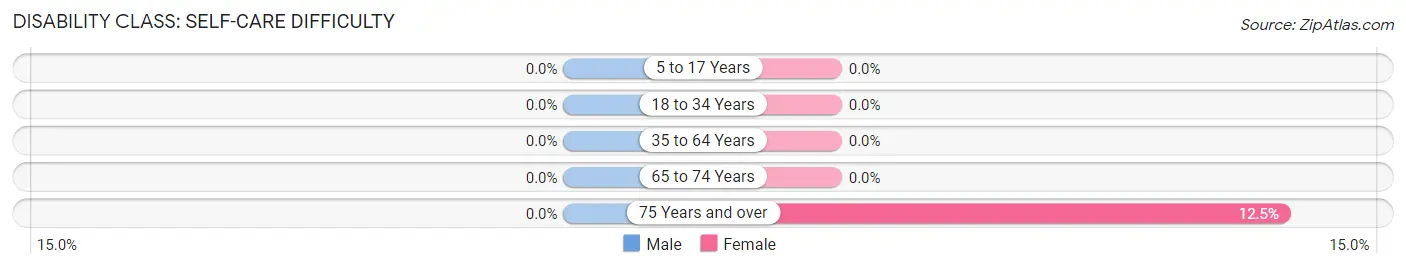
| Age Bracket | Male | Female |
| 5 to 17 Years | 0 (0.0%) | 0 (0.0%) |
| 18 to 34 Years | 0 (0.0%) | 0 (0.0%) |
| 35 to 64 Years | 0 (0.0%) | 0 (0.0%) |
| 65 to 74 Years | 0 (0.0%) | 0 (0.0%) |
| 75 Years and over | 0 (0.0%) | 32 (12.5%) |
Technology Access in Garwood borough
Computing Device Access in Garwood borough
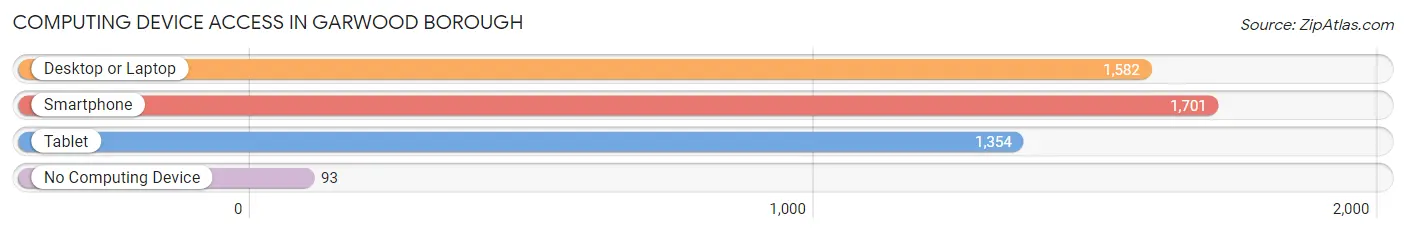
| Device Type | # Households | % Households |
| Desktop or Laptop | 1,582 | 80.9% |
| Smartphone | 1,701 | 87.0% |
| Tablet | 1,354 | 69.2% |
| No Computing Device | 93 | 4.8% |
| Total | 1,956 | 100.0% |
Internet Access in Garwood borough
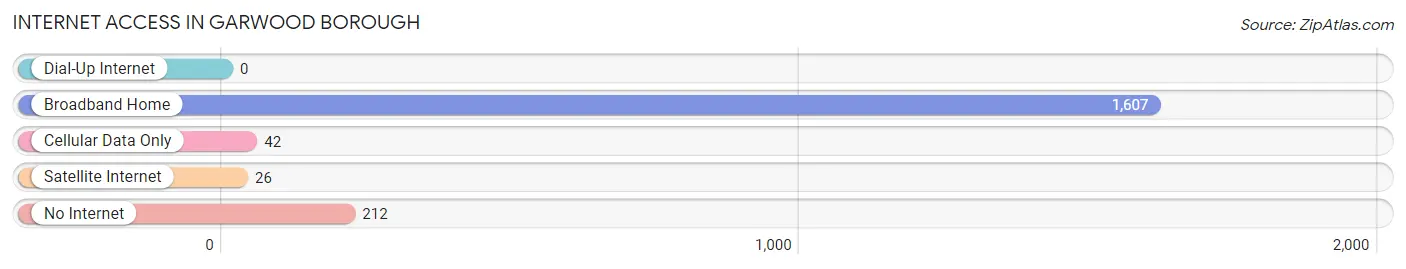
| Internet Type | # Households | % Households |
| Dial-Up Internet | 0 | 0.0% |
| Broadband Home | 1,607 | 82.2% |
| Cellular Data Only | 42 | 2.1% |
| Satellite Internet | 26 | 1.3% |
| No Internet | 212 | 10.8% |
| Total | 1,956 | 100.0% |
Garwood borough Summary
Garwood Borough is a small borough located in Union County, New Jersey. It is situated on the banks of the Rahway River and is bordered by Cranford, Westfield, Clark, and Linden. The borough was incorporated in 1903 and has a population of 4,226 as of the 2010 census.
Geography
Garwood Borough is located at 40°39'17" North, 74°19'45" West (40.654722, -74.329167). It has a total area of 0.6 square miles, all of which is land. The borough is located in the Rahway River Valley and is surrounded by hills. The highest point in the borough is the summit of the Garwood Hill, which is located at an elevation of approximately 200 feet.
Climate
Garwood Borough has a humid subtropical climate, with hot, humid summers and cold, wet winters. The average annual temperature is around 54°F, with an average high of around 78°F in the summer and an average low of around 32°F in the winter. The average annual precipitation is around 45 inches.
Demographics
As of the 2010 census, there were 4,226 people, 1,717 households, and 1,093 families residing in the borough. The population density was 6,945.3 people per square mile. The racial makeup of the borough was 87.2% White, 4.2% African American, 0.2% Native American, 4.7% Asian, 0.1% Pacific Islander, 1.7% from other races, and 2.0% from two or more races. Hispanic or Latino of any race were 8.2% of the population.
The median age in the borough was 41.2 years. 22.2% of residents were under the age of 18; 6.7% were between the ages of 18 and 24; 25.7% were from 25 to 44; 28.7% were from 45 to 64; and 16.5% were 65 years of age or older. The gender makeup of the borough was 48.2% male and 51.8% female.
Economy
Garwood Borough has a diverse economy, with a mix of retail, manufacturing, and service businesses. The largest employers in the borough are the Garwood Public Schools, the Garwood Police Department, and the Garwood Fire Department. Other major employers include the Garwood Medical Center, the Garwood Shopping Center, and the Garwood Industrial Park.
The median household income in the borough was $76,944 in 2017, and the median family income was $90,917. The per capita income was $35,945. About 4.2% of families and 5.3% of the population were below the poverty line, including 6.2% of those under age 18 and 4.2% of those age 65 or over.
Conclusion
Garwood Borough is a small borough located in Union County, New Jersey. It is situated on the banks of the Rahway River and is bordered by Cranford, Westfield, Clark, and Linden. The borough has a population of 4,226 as of the 2010 census and has a diverse economy, with a mix of retail, manufacturing, and service businesses. The median household income in the borough was $76,944 in 2017, and the median family income was $90,917. The per capita income was $35,945. Garwood Borough has a humid subtropical climate, with hot, humid summers and cold, wet winters.
Common Questions
What is Per Capita Income in Garwood borough?
Per Capita income in Garwood borough is $55,478.
What is the Median Family Income in Garwood borough?
Median Family Income in Garwood borough is $142,829.
What is the Median Household income in Garwood borough?
Median Household Income in Garwood borough is $107,823.
What is Income or Wage Gap in Garwood borough?
Income or Wage Gap in Garwood borough is 9.2%.
Women in Garwood borough earn 90.8 cents for every dollar earned by a man.
What is Inequality or Gini Index in Garwood borough?
Inequality or Gini Index in Garwood borough is 0.41.
What is the Total Population of Garwood borough?
Total Population of Garwood borough is 4,542.
What is the Total Male Population of Garwood borough?
Total Male Population of Garwood borough is 2,467.
What is the Total Female Population of Garwood borough?
Total Female Population of Garwood borough is 2,075.
What is the Ratio of Males per 100 Females in Garwood borough?
There are 118.89 Males per 100 Females in Garwood borough.
What is the Ratio of Females per 100 Males in Garwood borough?
There are 84.11 Females per 100 Males in Garwood borough.
What is the Median Population Age in Garwood borough?
Median Population Age in Garwood borough is 41.5 Years.
What is the Average Family Size in Garwood borough
Average Family Size in Garwood borough is 3.1 People.
What is the Average Household Size in Garwood borough
Average Household Size in Garwood borough is 2.3 People.
How Large is the Labor Force in Garwood borough?
There are 2,717 People in the Labor Forcein in Garwood borough.
What is the Percentage of People in the Labor Force in Garwood borough?
70.0% of People are in the Labor Force in Garwood borough.
What is the Unemployment Rate in Garwood borough?
Unemployment Rate in Garwood borough is 6.0%.