Fort Dix, NJ Map & Demographics
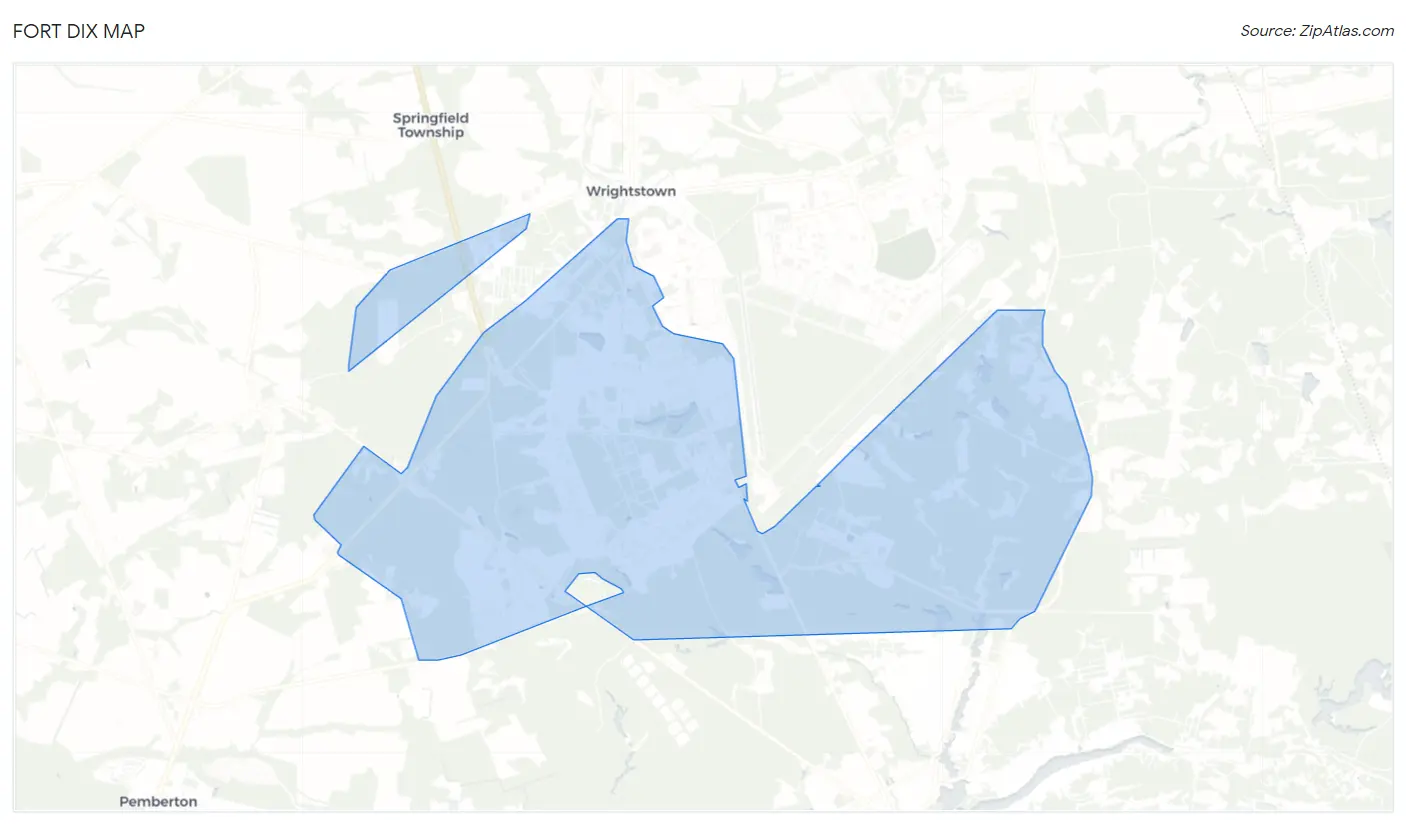
Fort Dix Map
Fort Dix Overview
$16,726
PER CAPITA INCOME
$97,639
AVG FAMILY INCOME
$91,250
AVG HOUSEHOLD INCOME
5.8%
WAGE / INCOME GAP [ % ]
94.2¢/ $1
WAGE / INCOME GAP [ $ ]
0.27
INEQUALITY / GINI INDEX
7,781
TOTAL POPULATION
6,506
MALE POPULATION
1,275
FEMALE POPULATION
510.27
MALES / 100 FEMALES
19.60
FEMALES / 100 MALES
34.7
MEDIAN AGE
3.6
AVG FAMILY SIZE
3.2
AVG HOUSEHOLD SIZE
1,837
LABOR FORCE [ PEOPLE ]
27.7%
PERCENT IN LABOR FORCE
7.0%
UNEMPLOYMENT RATE
Fort Dix Area Codes
Income in Fort Dix
Income Overview in Fort Dix
Per Capita Income in Fort Dix is $16,726, while median incomes of families and households are $97,639 and $91,250 respectively.
| Characteristic | Number | Measure |
| Per Capita Income | 7,781 | $16,726 |
| Median Family Income | 691 | $97,639 |
| Mean Family Income | 691 | $99,015 |
| Median Household Income | 891 | $91,250 |
| Mean Household Income | 891 | $96,664 |
| Income Deficit | 691 | $0 |
| Wage / Income Gap (%) | 7,781 | 5.85% |
| Wage / Income Gap ($) | 7,781 | 94.15¢ per $1 |
| Gini / Inequality Index | 7,781 | 0.27 |
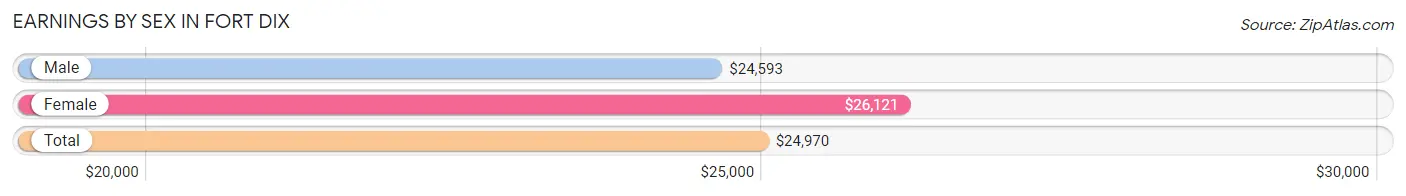
Earnings by Sex in Fort Dix
Average Earnings in Fort Dix are $24,970, $24,593 for men and $26,121 for women, a difference of 5.9%.
| Sex | Number | Average Earnings |
| Male | 3,001 (82.9%) | $24,593 |
| Female | 618 (17.1%) | $26,121 |
| Total | 3,619 (100.0%) | $24,970 |
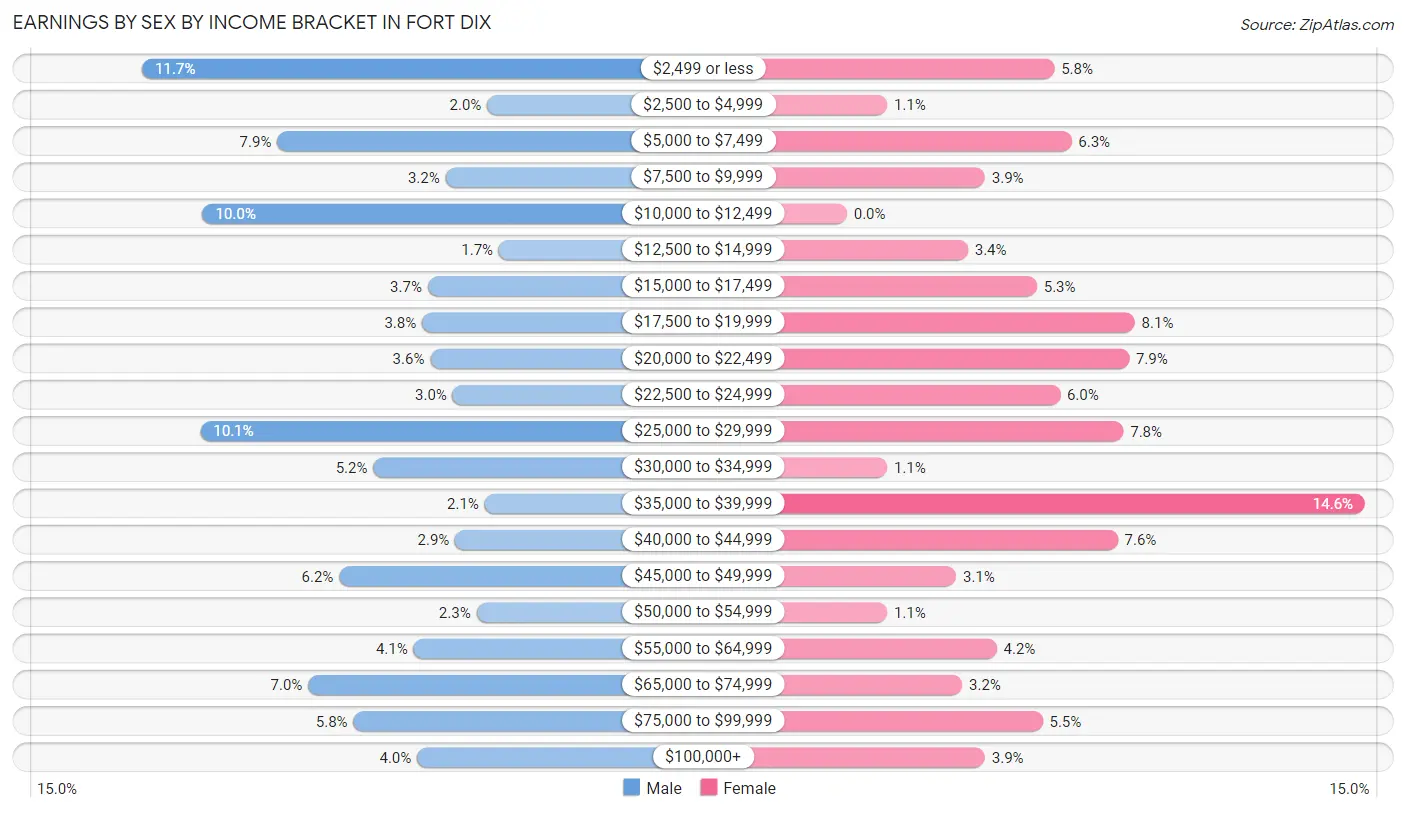
Earnings by Sex by Income Bracket in Fort Dix
The most common earnings brackets in Fort Dix are $2,499 or less for men (351 | 11.7%) and $35,000 to $39,999 for women (90 | 14.6%).
| Income | Male | Female |
| $2,499 or less | 351 (11.7%) | 36 (5.8%) |
| $2,500 to $4,999 | 60 (2.0%) | 7 (1.1%) |
| $5,000 to $7,499 | 237 (7.9%) | 39 (6.3%) |
| $7,500 to $9,999 | 95 (3.2%) | 24 (3.9%) |
| $10,000 to $12,499 | 300 (10.0%) | 0 (0.0%) |
| $12,500 to $14,999 | 50 (1.7%) | 21 (3.4%) |
| $15,000 to $17,499 | 110 (3.7%) | 33 (5.3%) |
| $17,500 to $19,999 | 115 (3.8%) | 50 (8.1%) |
| $20,000 to $22,499 | 108 (3.6%) | 49 (7.9%) |
| $22,500 to $24,999 | 89 (3.0%) | 37 (6.0%) |
| $25,000 to $29,999 | 302 (10.1%) | 48 (7.8%) |
| $30,000 to $34,999 | 156 (5.2%) | 7 (1.1%) |
| $35,000 to $39,999 | 62 (2.1%) | 90 (14.6%) |
| $40,000 to $44,999 | 87 (2.9%) | 47 (7.6%) |
| $45,000 to $49,999 | 185 (6.2%) | 19 (3.1%) |
| $50,000 to $54,999 | 69 (2.3%) | 7 (1.1%) |
| $55,000 to $64,999 | 122 (4.1%) | 26 (4.2%) |
| $65,000 to $74,999 | 211 (7.0%) | 20 (3.2%) |
| $75,000 to $99,999 | 173 (5.8%) | 34 (5.5%) |
| $100,000+ | 119 (4.0%) | 24 (3.9%) |
| Total | 3,001 (100.0%) | 618 (100.0%) |
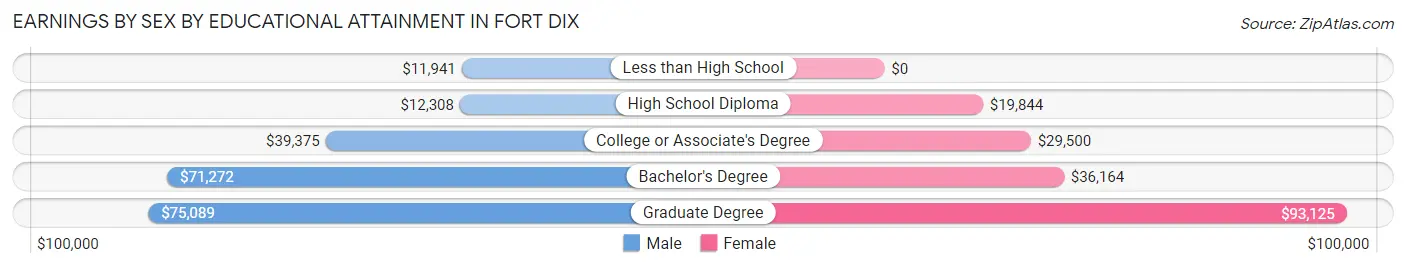
Earnings by Sex by Educational Attainment in Fort Dix
Average earnings in Fort Dix are $21,232 for men and $35,926 for women, a difference of 40.9%. Men with an educational attainment of graduate degree enjoy the highest average annual earnings of $75,089, while those with less than high school education earn the least with $11,941. Women with an educational attainment of graduate degree earn the most with the average annual earnings of $93,125, while those with high school diploma education have the smallest earnings of $19,844.
| Educational Attainment | Male Income | Female Income |
| Less than High School | $11,941 | $0 |
| High School Diploma | $12,308 | $19,844 |
| College or Associate's Degree | $39,375 | $29,500 |
| Bachelor's Degree | $71,272 | $36,164 |
| Graduate Degree | $75,089 | $93,125 |
| Total | $21,232 | $35,926 |
Family Income in Fort Dix
Family Income Brackets in Fort Dix
According to the Fort Dix family income data, there are 221 families falling into the $100,000 to $149,999 income range, which is the most common income bracket and makes up 32.0% of all families. Conversely, the $10,000 to $14,999 income bracket is the least frequent group with only 2 families (0.3%) belonging to this category.
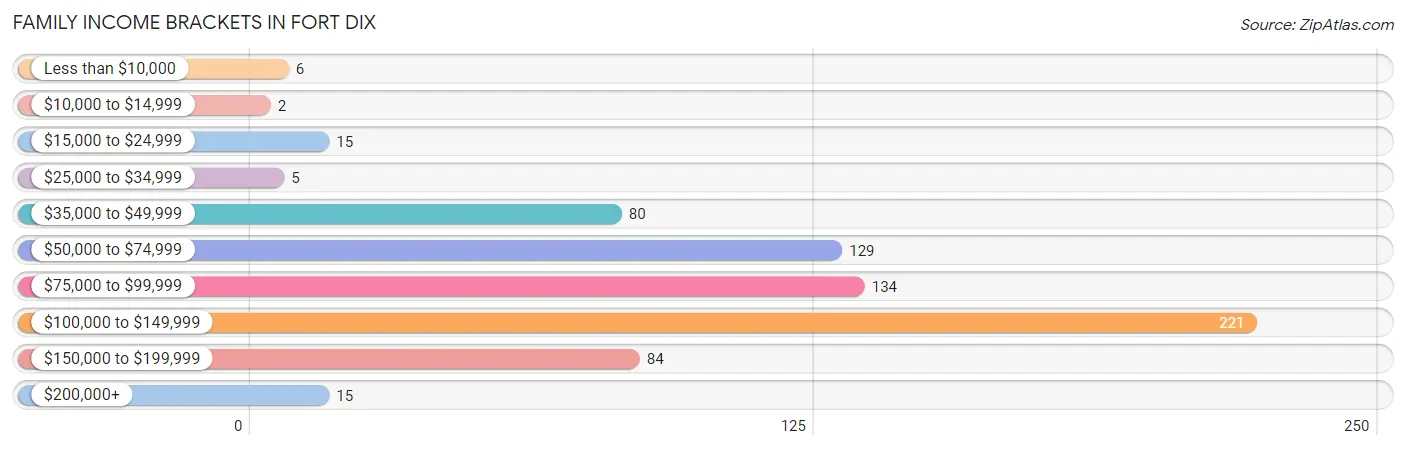
| Income Bracket | # Families | % Families |
| Less than $10,000 | 6 | 0.9% |
| $10,000 to $14,999 | 2 | 0.3% |
| $15,000 to $24,999 | 15 | 2.2% |
| $25,000 to $34,999 | 5 | 0.7% |
| $35,000 to $49,999 | 80 | 11.6% |
| $50,000 to $74,999 | 129 | 18.7% |
| $75,000 to $99,999 | 134 | 19.4% |
| $100,000 to $149,999 | 221 | 32.0% |
| $150,000 to $199,999 | 84 | 12.2% |
| $200,000+ | 15 | 2.2% |
Family Income by Famaliy Size in Fort Dix
6-person families (125 | 18.1%) account for the highest median family income in Fort Dix with $106,228 per family, while 2-person families (175 | 25.3%) have the highest median income of $40,852 per family member.
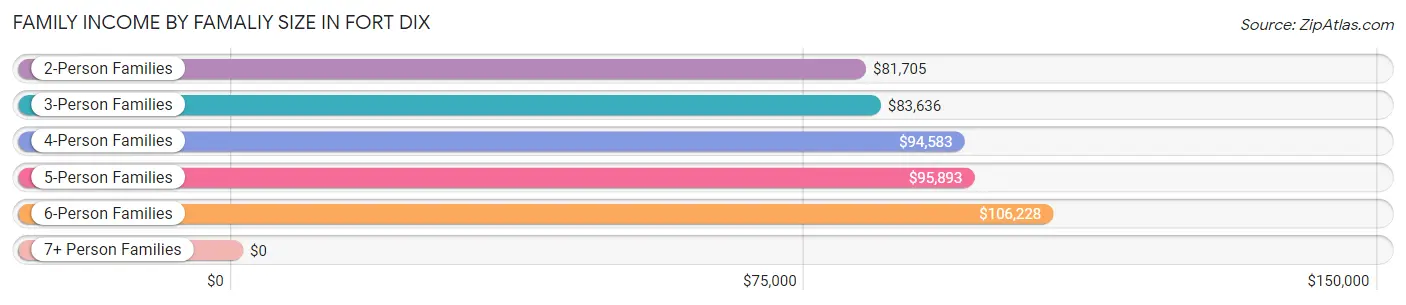
| Income Bracket | # Families | Median Income |
| 2-Person Families | 175 (25.3%) | $81,705 |
| 3-Person Families | 128 (18.5%) | $83,636 |
| 4-Person Families | 158 (22.9%) | $94,583 |
| 5-Person Families | 92 (13.3%) | $95,893 |
| 6-Person Families | 125 (18.1%) | $106,228 |
| 7+ Person Families | 13 (1.9%) | $0 |
| Total | 691 (100.0%) | $97,639 |
Family Income by Number of Earners in Fort Dix
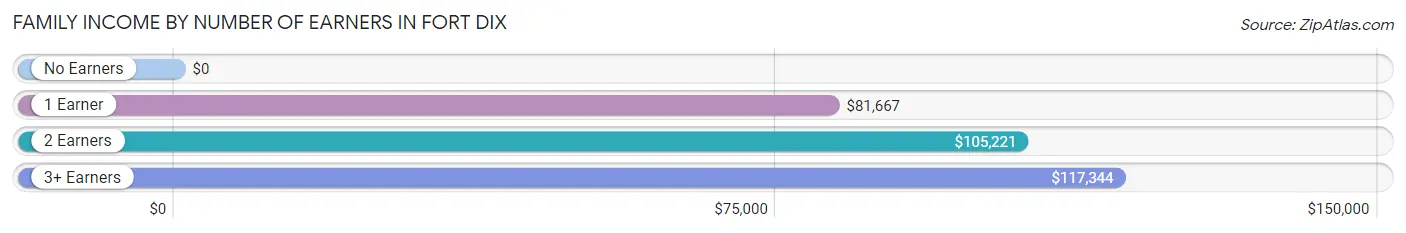
| Number of Earners | # Families | Median Income |
| No Earners | 6 (0.9%) | $0 |
| 1 Earner | 186 (26.9%) | $81,667 |
| 2 Earners | 484 (70.0%) | $105,221 |
| 3+ Earners | 15 (2.2%) | $117,344 |
| Total | 691 (100.0%) | $97,639 |
Household Income in Fort Dix
Household Income Brackets in Fort Dix
With 243 households falling in the category, the $100,000 to $149,999 income range is the most frequent in Fort Dix, accounting for 27.3% of all households. In contrast, only 2 households (0.2%) fall into the $10,000 to $14,999 income bracket, making it the least populous group.
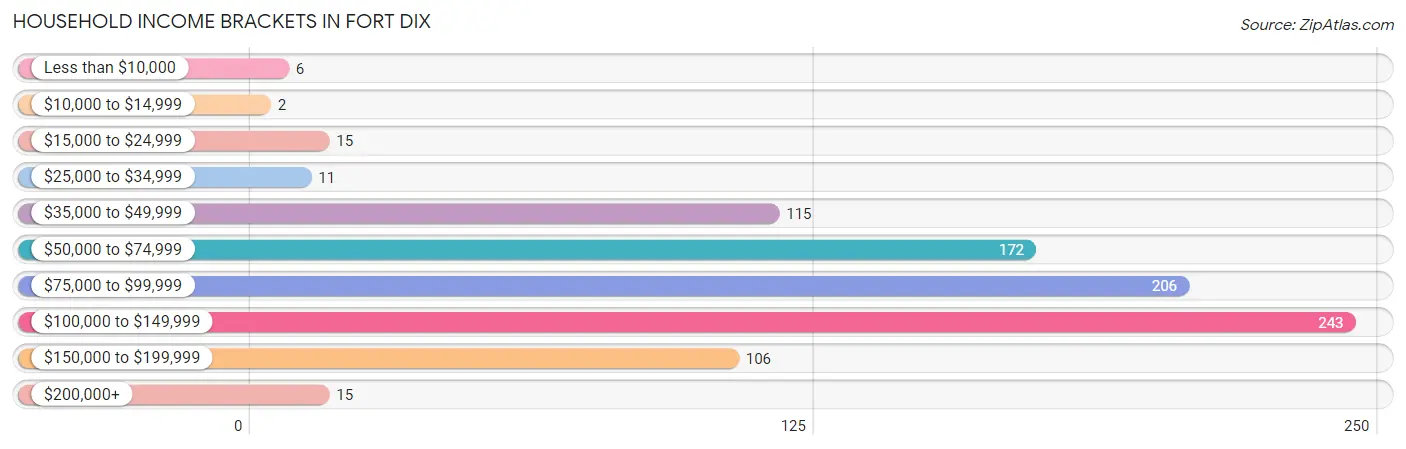
| Income Bracket | # Households | % Households |
| Less than $10,000 | 6 | 0.7% |
| $10,000 to $14,999 | 2 | 0.2% |
| $15,000 to $24,999 | 15 | 1.7% |
| $25,000 to $34,999 | 11 | 1.2% |
| $35,000 to $49,999 | 115 | 12.9% |
| $50,000 to $74,999 | 172 | 19.3% |
| $75,000 to $99,999 | 206 | 23.1% |
| $100,000 to $149,999 | 243 | 27.3% |
| $150,000 to $199,999 | 106 | 11.9% |
| $200,000+ | 15 | 1.7% |
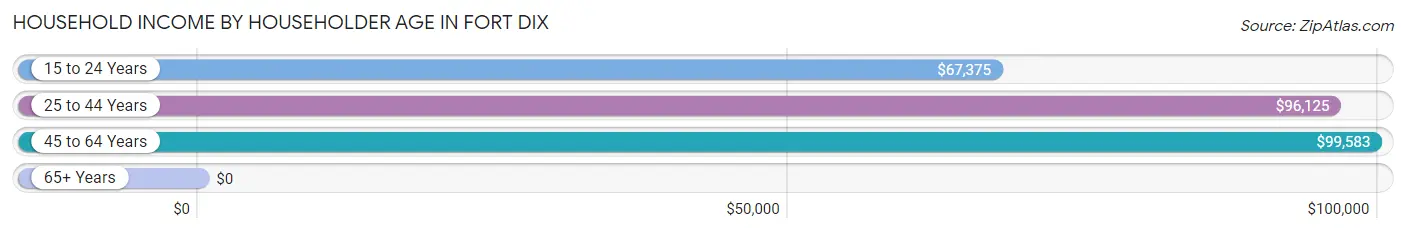
Household Income by Householder Age in Fort Dix
The median household income in Fort Dix is $91,250, with the highest median household income of $99,583 found in the 45 to 64 years age bracket for the primary householder. A total of 92 households (10.3%) fall into this category.
| Income Bracket | # Households | Median Income |
| 15 to 24 Years | 121 (13.6%) | $67,375 |
| 25 to 44 Years | 678 (76.1%) | $96,125 |
| 45 to 64 Years | 92 (10.3%) | $99,583 |
| 65+ Years | 0 (0.0%) | $0 |
| Total | 891 (100.0%) | $91,250 |
Poverty in Fort Dix
Income Below Poverty by Sex and Age in Fort Dix
With 6.0% poverty level for males and 4.3% for females among the residents of Fort Dix, 5 year old males and 55 to 64 year old females are the most vulnerable to poverty, with 22 males (37.3%) and 3 females (100.0%) in their respective age groups living below the poverty level.
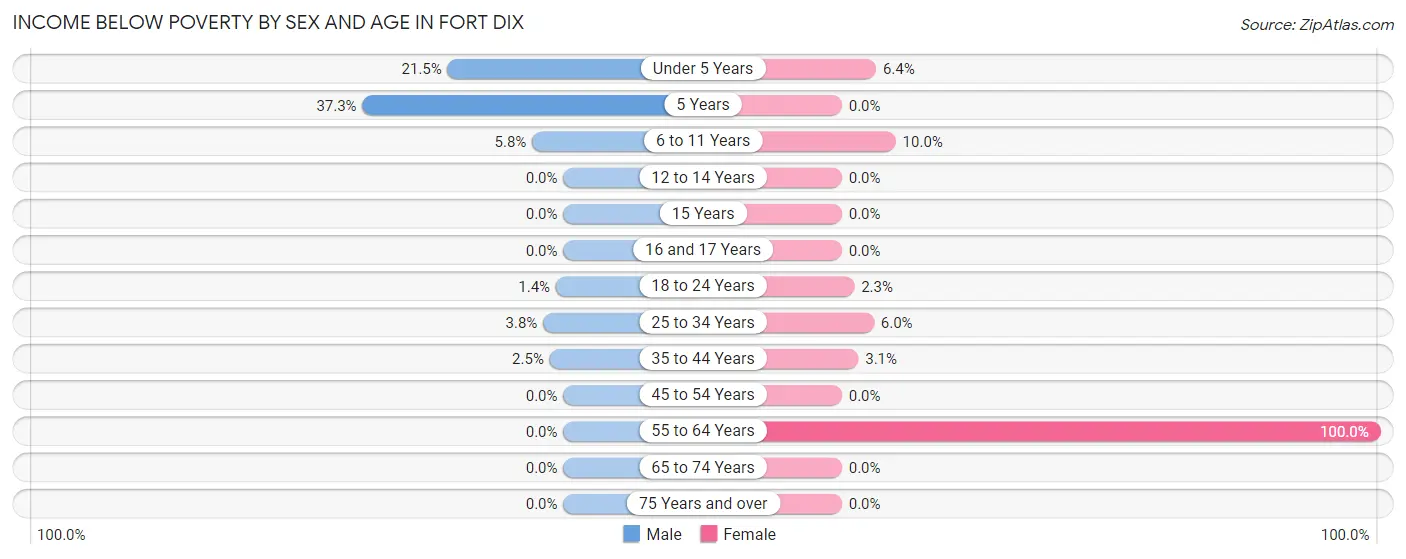
| Age Bracket | Male | Female |
| Under 5 Years | 32 (21.5%) | 8 (6.4%) |
| 5 Years | 22 (37.3%) | 0 (0.0%) |
| 6 to 11 Years | 21 (5.8%) | 13 (10.0%) |
| 12 to 14 Years | 0 (0.0%) | 0 (0.0%) |
| 15 Years | 0 (0.0%) | 0 (0.0%) |
| 16 and 17 Years | 0 (0.0%) | 0 (0.0%) |
| 18 to 24 Years | 2 (1.4%) | 3 (2.3%) |
| 25 to 34 Years | 13 (3.7%) | 16 (5.9%) |
| 35 to 44 Years | 9 (2.5%) | 7 (3.1%) |
| 45 to 54 Years | 0 (0.0%) | 0 (0.0%) |
| 55 to 64 Years | 0 (0.0%) | 3 (100.0%) |
| 65 to 74 Years | 0 (0.0%) | 0 (0.0%) |
| 75 Years and over | 0 (0.0%) | 0 (0.0%) |
| Total | 99 (6.0%) | 50 (4.3%) |
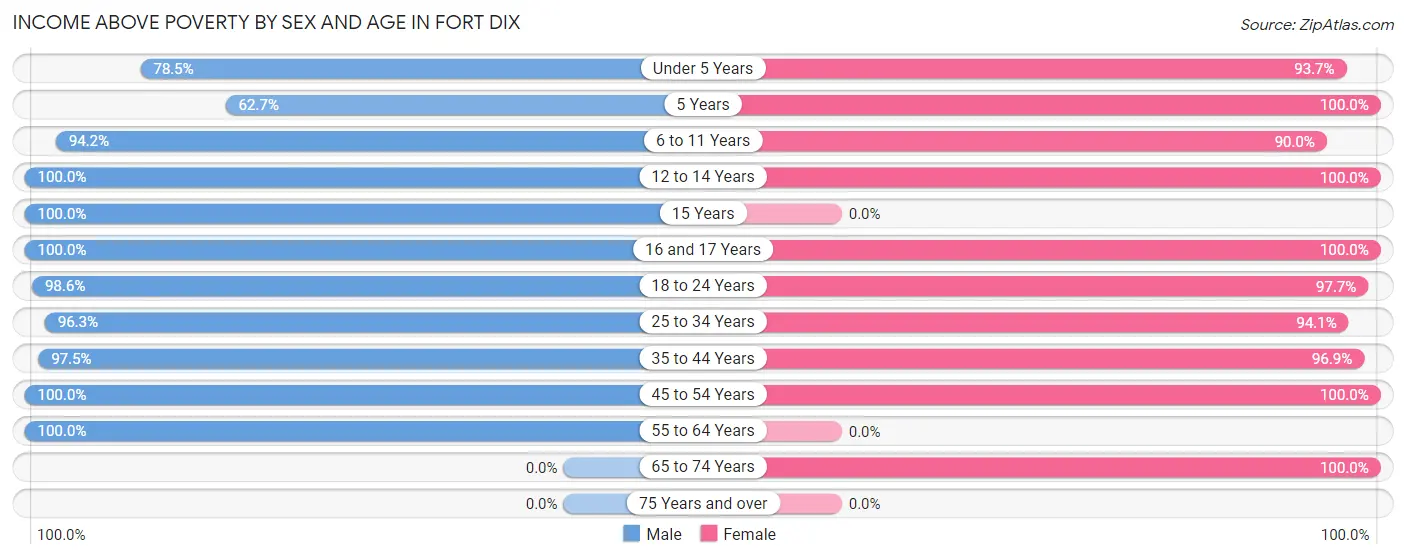
Income Above Poverty by Sex and Age in Fort Dix
According to the poverty statistics in Fort Dix, males aged 12 to 14 years and females aged 5 years are the age groups that are most secure financially, with 100.0% of males and 100.0% of females in these age groups living above the poverty line.
| Age Bracket | Male | Female |
| Under 5 Years | 117 (78.5%) | 118 (93.6%) |
| 5 Years | 37 (62.7%) | 10 (100.0%) |
| 6 to 11 Years | 342 (94.2%) | 117 (90.0%) |
| 12 to 14 Years | 121 (100.0%) | 175 (100.0%) |
| 15 Years | 17 (100.0%) | 0 (0.0%) |
| 16 and 17 Years | 13 (100.0%) | 19 (100.0%) |
| 18 to 24 Years | 143 (98.6%) | 127 (97.7%) |
| 25 to 34 Years | 334 (96.3%) | 253 (94.1%) |
| 35 to 44 Years | 347 (97.5%) | 222 (96.9%) |
| 45 to 54 Years | 83 (100.0%) | 61 (100.0%) |
| 55 to 64 Years | 2 (100.0%) | 0 (0.0%) |
| 65 to 74 Years | 0 (0.0%) | 9 (100.0%) |
| 75 Years and over | 0 (0.0%) | 0 (0.0%) |
| Total | 1,556 (94.0%) | 1,111 (95.7%) |
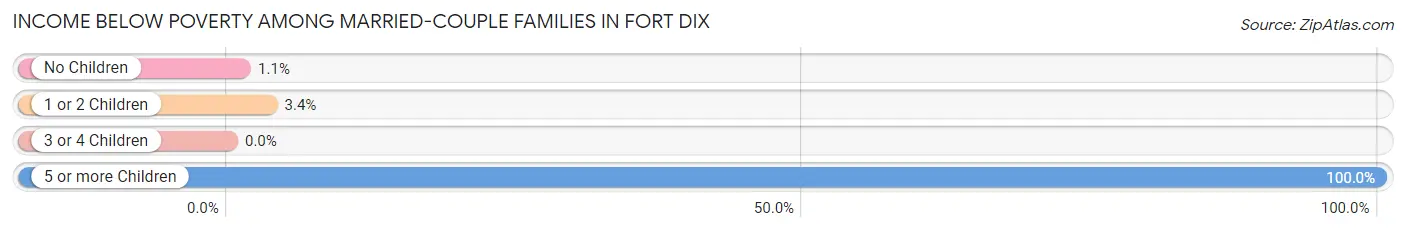
Income Below Poverty Among Married-Couple Families in Fort Dix
The poverty statistics for married-couple families in Fort Dix show that 3.7% or 24 of the total 656 families live below the poverty line. Families with 5 or more children have the highest poverty rate of 100.0%, comprising of 13 families. On the other hand, families with 3 or 4 children have the lowest poverty rate of 0.0%, which includes 0 families.
| Children | Above Poverty | Below Poverty |
| No Children | 174 (98.9%) | 2 (1.1%) |
| 1 or 2 Children | 253 (96.6%) | 9 (3.4%) |
| 3 or 4 Children | 205 (100.0%) | 0 (0.0%) |
| 5 or more Children | 0 (0.0%) | 13 (100.0%) |
| Total | 632 (96.3%) | 24 (3.7%) |
Income Below Poverty Among Single-Parent Households in Fort Dix
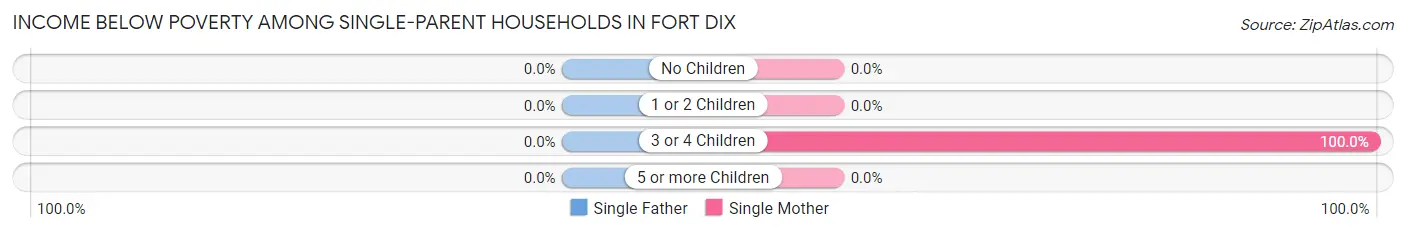
| Children | Single Father | Single Mother |
| No Children | 0 (0.0%) | 0 (0.0%) |
| 1 or 2 Children | 0 (0.0%) | 0 (0.0%) |
| 3 or 4 Children | 0 (0.0%) | 6 (100.0%) |
| 5 or more Children | 0 (0.0%) | 0 (0.0%) |
| Total | 0 (0.0%) | 6 (20.7%) |
Income Below Poverty Among Married-Couple vs Single-Parent Households in Fort Dix
The poverty data for Fort Dix shows that 24 of the married-couple family households (3.7%) and 6 of the single-parent households (17.1%) are living below the poverty level. Within the married-couple family households, those with 5 or more children have the highest poverty rate, with 13 households (100.0%) falling below the poverty line. Among the single-parent households, those with 3 or 4 children have the highest poverty rate, with 6 household (100.0%) living below poverty.
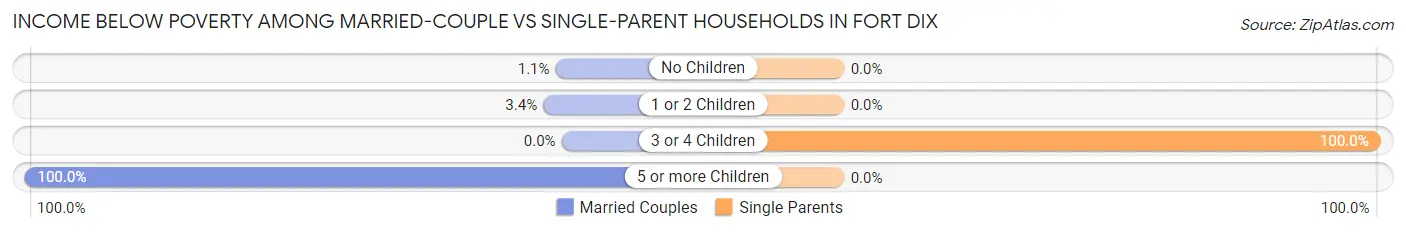
| Children | Married-Couple Families | Single-Parent Households |
| No Children | 2 (1.1%) | 0 (0.0%) |
| 1 or 2 Children | 9 (3.4%) | 0 (0.0%) |
| 3 or 4 Children | 0 (0.0%) | 6 (100.0%) |
| 5 or more Children | 13 (100.0%) | 0 (0.0%) |
| Total | 24 (3.7%) | 6 (17.1%) |
Race in Fort Dix
The most populous races in Fort Dix are White / Caucasian (4,422 | 56.8%), Black / African American (2,583 | 33.2%), and Hispanic or Latino (2,088 | 26.8%).
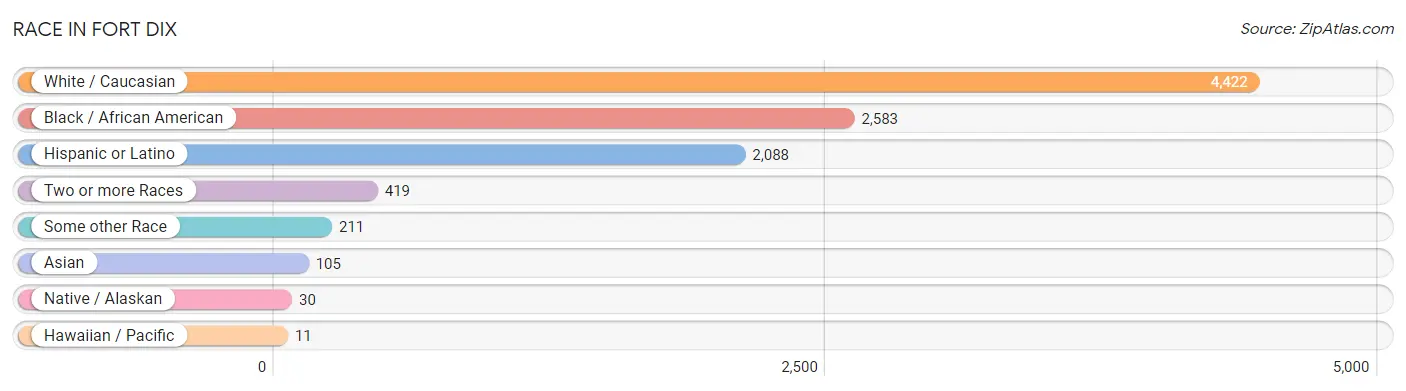
| Race | # Population | % Population |
| Asian | 105 | 1.3% |
| Black / African American | 2,583 | 33.2% |
| Hawaiian / Pacific | 11 | 0.1% |
| Hispanic or Latino | 2,088 | 26.8% |
| Native / Alaskan | 30 | 0.4% |
| White / Caucasian | 4,422 | 56.8% |
| Two or more Races | 419 | 5.4% |
| Some other Race | 211 | 2.7% |
| Total | 7,781 | 100.0% |
Ancestry in Fort Dix
The most populous ancestries reported in Fort Dix are Puerto Rican (980 | 12.6%), Irish (522 | 6.7%), German (454 | 5.8%), Italian (256 | 3.3%), and English (207 | 2.7%), together accounting for 31.1% of all Fort Dix residents.
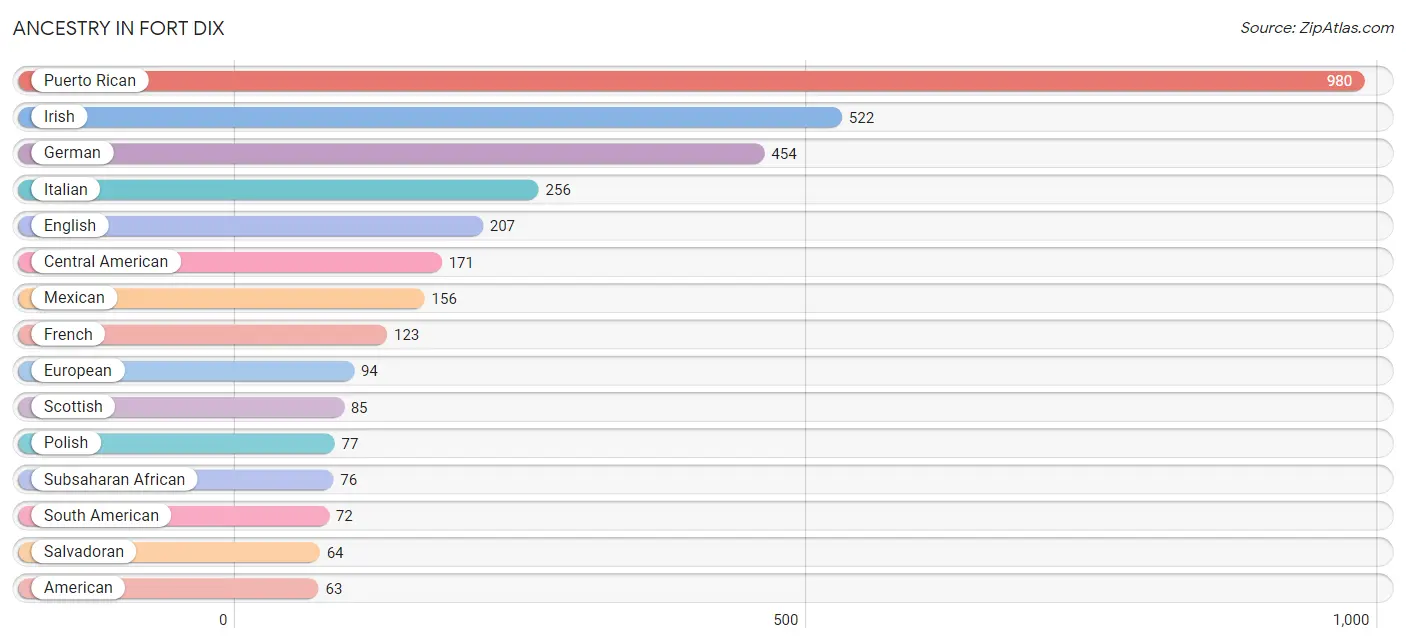
| Ancestry | # Population | % Population |
| African | 62 | 0.8% |
| American | 63 | 0.8% |
| Arab | 32 | 0.4% |
| Bhutanese | 6 | 0.1% |
| Blackfeet | 5 | 0.1% |
| Brazilian | 21 | 0.3% |
| British | 20 | 0.3% |
| British West Indian | 9 | 0.1% |
| Bulgarian | 1 | 0.0% |
| Burmese | 52 | 0.7% |
| Central American | 171 | 2.2% |
| Central American Indian | 13 | 0.2% |
| Choctaw | 13 | 0.2% |
| Colombian | 31 | 0.4% |
| Cuban | 28 | 0.4% |
| Czech | 12 | 0.2% |
| Danish | 20 | 0.3% |
| Dominican | 53 | 0.7% |
| Dutch | 12 | 0.2% |
| Eastern European | 10 | 0.1% |
| Ecuadorian | 23 | 0.3% |
| English | 207 | 2.7% |
| Ethiopian | 12 | 0.2% |
| European | 94 | 1.2% |
| French | 123 | 1.6% |
| French Canadian | 7 | 0.1% |
| German | 454 | 5.8% |
| Greek | 21 | 0.3% |
| Guatemalan | 34 | 0.4% |
| Guyanese | 11 | 0.1% |
| Haitian | 37 | 0.5% |
| Honduran | 46 | 0.6% |
| Indian (Asian) | 27 | 0.4% |
| Irish | 522 | 6.7% |
| Italian | 256 | 3.3% |
| Jamaican | 45 | 0.6% |
| Kenyan | 2 | 0.0% |
| Korean | 20 | 0.3% |
| Latvian | 20 | 0.3% |
| Lebanese | 10 | 0.1% |
| Lithuanian | 9 | 0.1% |
| Lumbee | 4 | 0.1% |
| Mexican | 156 | 2.0% |
| Moroccan | 10 | 0.1% |
| Native Hawaiian | 17 | 0.2% |
| Navajo | 7 | 0.1% |
| Nicaraguan | 6 | 0.1% |
| Norwegian | 54 | 0.7% |
| Palestinian | 12 | 0.2% |
| Panamanian | 21 | 0.3% |
| Peruvian | 2 | 0.0% |
| Polish | 77 | 1.0% |
| Portuguese | 23 | 0.3% |
| Puerto Rican | 980 | 12.6% |
| Russian | 24 | 0.3% |
| Salvadoran | 64 | 0.8% |
| Scandinavian | 30 | 0.4% |
| Scotch-Irish | 48 | 0.6% |
| Scottish | 85 | 1.1% |
| Sioux | 13 | 0.2% |
| Slovak | 5 | 0.1% |
| South American | 72 | 0.9% |
| Spaniard | 19 | 0.2% |
| Spanish | 6 | 0.1% |
| Sri Lankan | 21 | 0.3% |
| Subsaharan African | 76 | 1.0% |
| Swedish | 15 | 0.2% |
| Thai | 46 | 0.6% |
| Trinidadian and Tobagonian | 1 | 0.0% |
| Ukrainian | 4 | 0.1% |
| Venezuelan | 16 | 0.2% |
| Welsh | 5 | 0.1% |
| West Indian | 36 | 0.5% | View All 73 Rows |
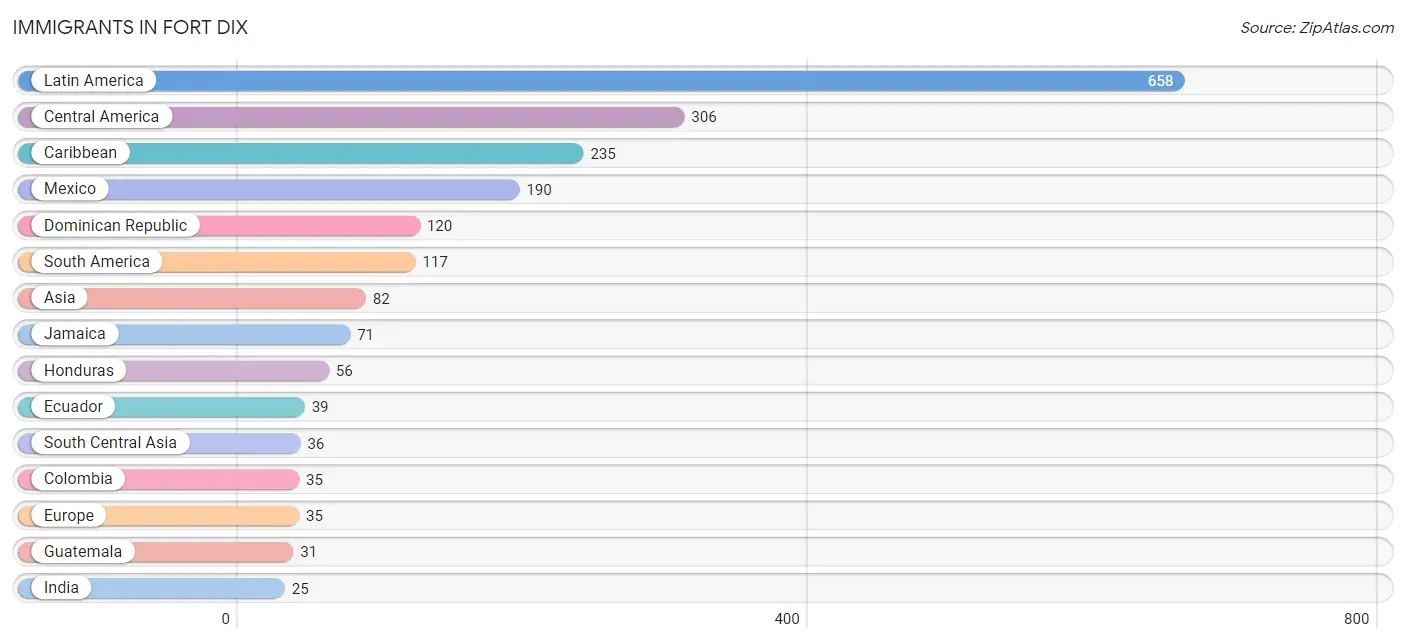
Immigrants in Fort Dix
The most numerous immigrant groups reported in Fort Dix came from Latin America (658 | 8.5%), Central America (306 | 3.9%), Caribbean (235 | 3.0%), Mexico (190 | 2.4%), and Dominican Republic (120 | 1.5%), together accounting for 19.4% of all Fort Dix residents.
| Immigration Origin | # Population | % Population |
| Africa | 10 | 0.1% |
| Asia | 82 | 1.1% |
| Australia | 8 | 0.1% |
| Bosnia and Herzegovina | 8 | 0.1% |
| Brazil | 16 | 0.2% |
| Canada | 5 | 0.1% |
| Caribbean | 235 | 3.0% |
| Central America | 306 | 3.9% |
| China | 9 | 0.1% |
| Colombia | 35 | 0.4% |
| Cuba | 9 | 0.1% |
| Dominica | 14 | 0.2% |
| Dominican Republic | 120 | 1.5% |
| Eastern Africa | 2 | 0.0% |
| Eastern Asia | 10 | 0.1% |
| Eastern Europe | 9 | 0.1% |
| Ecuador | 39 | 0.5% |
| El Salvador | 23 | 0.3% |
| England | 7 | 0.1% |
| Europe | 35 | 0.4% |
| Germany | 14 | 0.2% |
| Grenada | 8 | 0.1% |
| Guatemala | 31 | 0.4% |
| Guyana | 18 | 0.2% |
| Haiti | 13 | 0.2% |
| Honduras | 56 | 0.7% |
| India | 25 | 0.3% |
| Jamaica | 71 | 0.9% |
| Kenya | 2 | 0.0% |
| Korea | 1 | 0.0% |
| Latin America | 658 | 8.5% |
| Mexico | 190 | 2.4% |
| Nicaragua | 6 | 0.1% |
| Northern Europe | 7 | 0.1% |
| Oceania | 8 | 0.1% |
| Pakistan | 11 | 0.1% |
| Peru | 8 | 0.1% |
| Philippines | 14 | 0.2% |
| Portugal | 5 | 0.1% |
| South America | 117 | 1.5% |
| South Central Asia | 36 | 0.5% |
| South Eastern Asia | 24 | 0.3% |
| Southern Europe | 5 | 0.1% |
| Ukraine | 1 | 0.0% |
| Vietnam | 10 | 0.1% |
| Western Africa | 8 | 0.1% |
| Western Europe | 14 | 0.2% | View All 47 Rows |
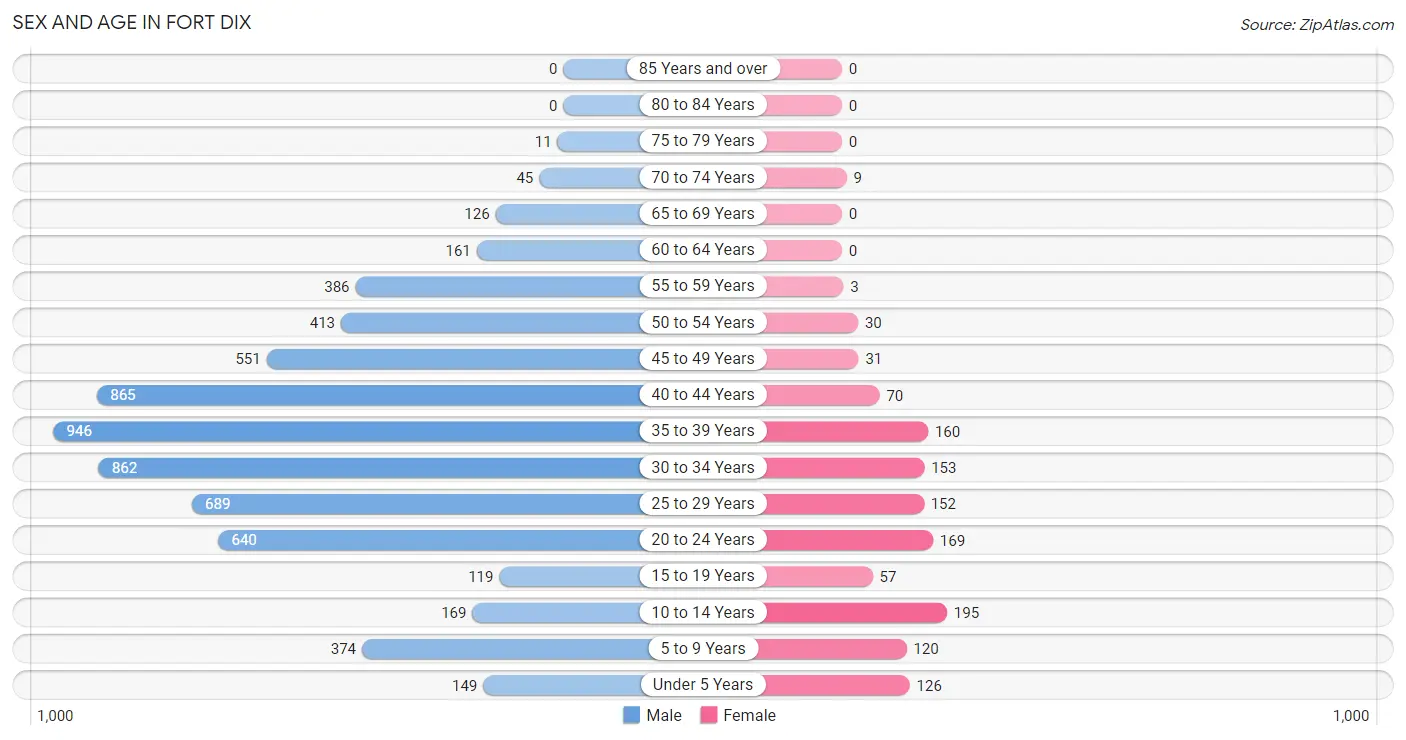
Sex and Age in Fort Dix
Sex and Age in Fort Dix
The most populous age groups in Fort Dix are 35 to 39 Years (946 | 14.5%) for men and 10 to 14 Years (195 | 15.3%) for women.
| Age Bracket | Male | Female |
| Under 5 Years | 149 (2.3%) | 126 (9.9%) |
| 5 to 9 Years | 374 (5.8%) | 120 (9.4%) |
| 10 to 14 Years | 169 (2.6%) | 195 (15.3%) |
| 15 to 19 Years | 119 (1.8%) | 57 (4.5%) |
| 20 to 24 Years | 640 (9.8%) | 169 (13.3%) |
| 25 to 29 Years | 689 (10.6%) | 152 (11.9%) |
| 30 to 34 Years | 862 (13.3%) | 153 (12.0%) |
| 35 to 39 Years | 946 (14.5%) | 160 (12.6%) |
| 40 to 44 Years | 865 (13.3%) | 70 (5.5%) |
| 45 to 49 Years | 551 (8.5%) | 31 (2.4%) |
| 50 to 54 Years | 413 (6.4%) | 30 (2.4%) |
| 55 to 59 Years | 386 (5.9%) | 3 (0.2%) |
| 60 to 64 Years | 161 (2.5%) | 0 (0.0%) |
| 65 to 69 Years | 126 (1.9%) | 0 (0.0%) |
| 70 to 74 Years | 45 (0.7%) | 9 (0.7%) |
| 75 to 79 Years | 11 (0.2%) | 0 (0.0%) |
| 80 to 84 Years | 0 (0.0%) | 0 (0.0%) |
| 85 Years and over | 0 (0.0%) | 0 (0.0%) |
| Total | 6,506 (100.0%) | 1,275 (100.0%) |
Families and Households in Fort Dix
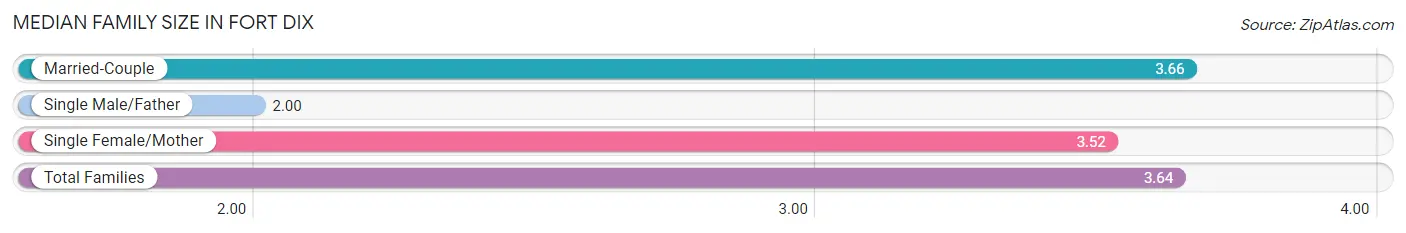
Median Family Size in Fort Dix
The median family size in Fort Dix is 3.64 persons per family, with married-couple families (656 | 94.9%) accounting for the largest median family size of 3.66 persons per family. On the other hand, single male/father families (6 | 0.9%) represent the smallest median family size with 2.00 persons per family.
| Family Type | # Families | Family Size |
| Married-Couple | 656 (94.9%) | 3.66 |
| Single Male/Father | 6 (0.9%) | 2.00 |
| Single Female/Mother | 29 (4.2%) | 3.52 |
| Total Families | 691 (100.0%) | 3.64 |
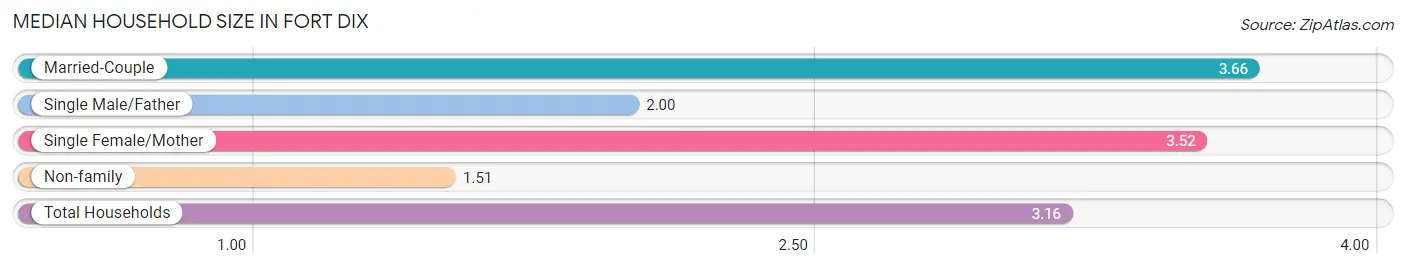
Median Household Size in Fort Dix
The median household size in Fort Dix is 3.16 persons per household, with married-couple households (656 | 73.6%) accounting for the largest median household size of 3.66 persons per household. non-family households (200 | 22.5%) represent the smallest median household size with 1.51 persons per household.
| Household Type | # Households | Household Size |
| Married-Couple | 656 (73.6%) | 3.66 |
| Single Male/Father | 6 (0.7%) | 2.00 |
| Single Female/Mother | 29 (3.3%) | 3.52 |
| Non-family | 200 (22.5%) | 1.51 |
| Total Households | 891 (100.0%) | 3.16 |
Household Size by Marriage Status in Fort Dix
Out of a total of 891 households in Fort Dix, 691 (77.5%) are family households, while 200 (22.5%) are nonfamily households. The most numerous type of family households are 2-person households, comprising 175, and the most common type of nonfamily households are 1-person households, comprising 132.
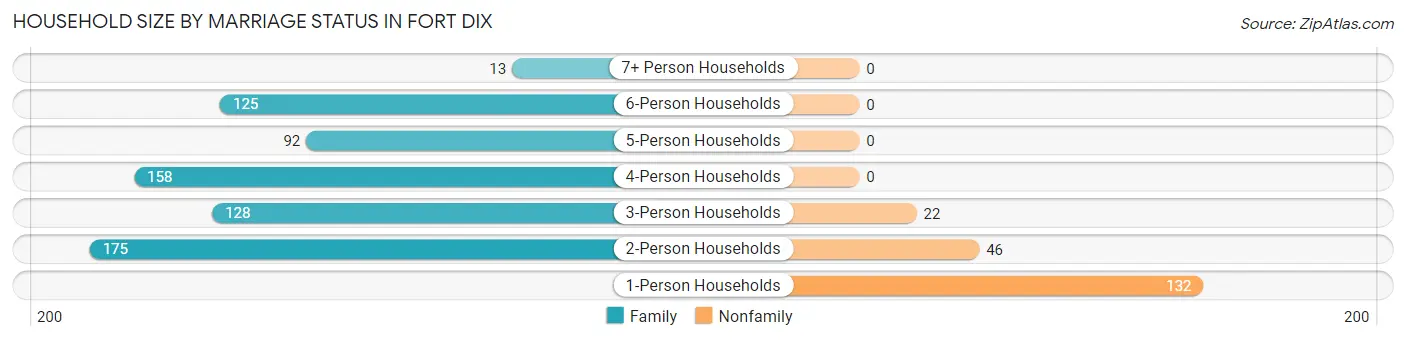
| Household Size | Family Households | Nonfamily Households |
| 1-Person Households | - | 132 (14.8%) |
| 2-Person Households | 175 (19.6%) | 46 (5.2%) |
| 3-Person Households | 128 (14.4%) | 22 (2.5%) |
| 4-Person Households | 158 (17.7%) | 0 (0.0%) |
| 5-Person Households | 92 (10.3%) | 0 (0.0%) |
| 6-Person Households | 125 (14.0%) | 0 (0.0%) |
| 7+ Person Households | 13 (1.5%) | 0 (0.0%) |
| Total | 691 (77.5%) | 200 (22.5%) |
Female Fertility in Fort Dix
Fertility by Age in Fort Dix
Average fertility rate in Fort Dix is 47.0 births per 1,000 women. Women in the age bracket of 20 to 34 years have the highest fertility rate with 80.0 births per 1,000 women. Women in the age bracket of 20 to 34 years acount for 100.0% of all women with births.
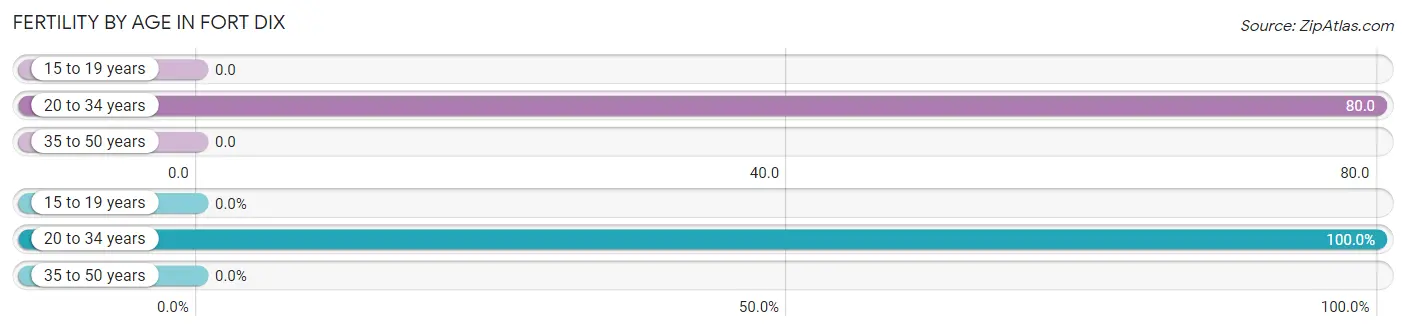
| Age Bracket | Women with Births | Births / 1,000 Women |
| 15 to 19 years | 0 (0.0%) | 0.0 |
| 20 to 34 years | 38 (100.0%) | 80.0 |
| 35 to 50 years | 0 (0.0%) | 0.0 |
| Total | 38 (100.0%) | 47.0 |
Fertility by Age by Marriage Status in Fort Dix
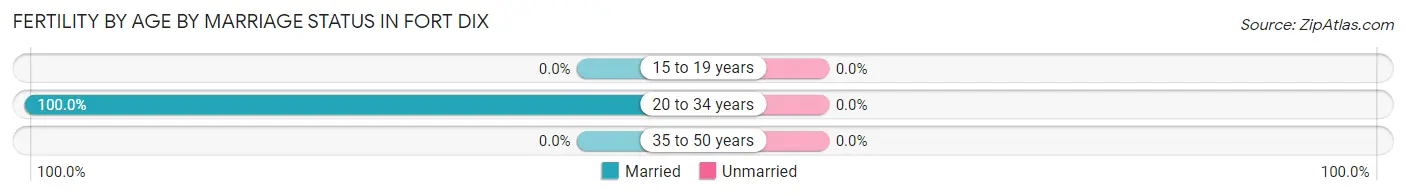
| Age Bracket | Married | Unmarried |
| 15 to 19 years | 0 (0.0%) | 0 (0.0%) |
| 20 to 34 years | 38 (100.0%) | 0 (0.0%) |
| 35 to 50 years | 0 (0.0%) | 0 (0.0%) |
| Total | 38 (100.0%) | 0 (0.0%) |
Fertility by Education in Fort Dix
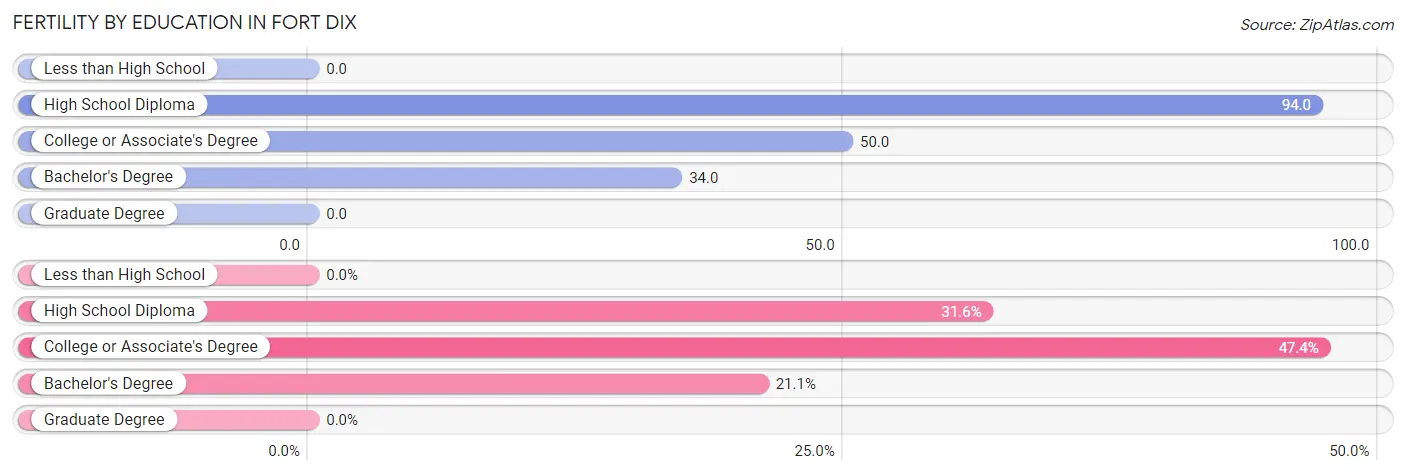
| Educational Attainment | Women with Births | Births / 1,000 Women |
| Less than High School | 0 (0.0%) | 0.0 |
| High School Diploma | 12 (31.6%) | 94.0 |
| College or Associate's Degree | 18 (47.4%) | 50.0 |
| Bachelor's Degree | 8 (21.0%) | 34.0 |
| Graduate Degree | 0 (0.0%) | 0.0 |
| Total | 38 (100.0%) | 47.0 |
Fertility by Education by Marriage Status in Fort Dix
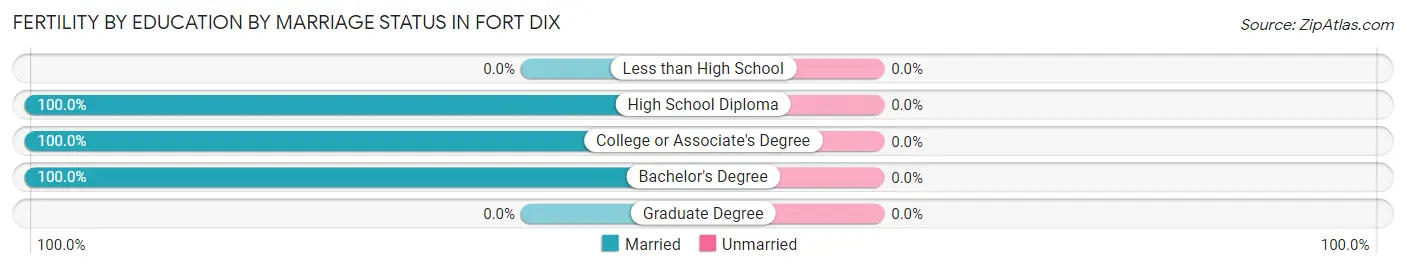
| Educational Attainment | Married | Unmarried |
| Less than High School | 0 (0.0%) | 0 (0.0%) |
| High School Diploma | 12 (100.0%) | 0 (0.0%) |
| College or Associate's Degree | 18 (100.0%) | 0 (0.0%) |
| Bachelor's Degree | 8 (100.0%) | 0 (0.0%) |
| Graduate Degree | 0 (0.0%) | 0 (0.0%) |
| Total | 38 (100.0%) | 0 (0.0%) |
Employment Characteristics in Fort Dix
Employment by Class of Employer in Fort Dix
Among the 1,783 employed individuals in Fort Dix, federal government employees (1,502 | 84.2%), private company employees (212 | 11.9%), and not-for-profit organizations (30 | 1.7%) make up the most common classes of employment.
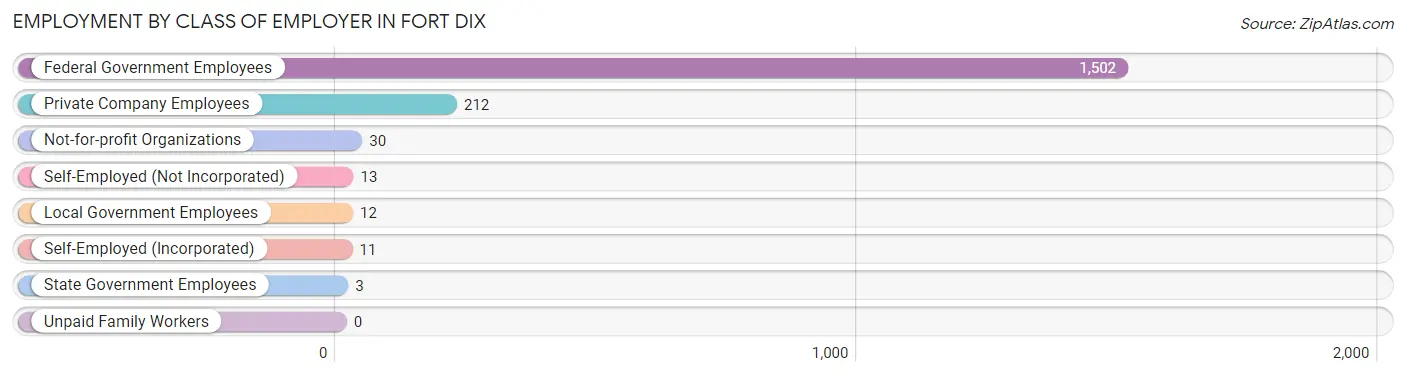
| Employer Class | # Employees | % Employees |
| Private Company Employees | 212 | 11.9% |
| Self-Employed (Incorporated) | 11 | 0.6% |
| Self-Employed (Not Incorporated) | 13 | 0.7% |
| Not-for-profit Organizations | 30 | 1.7% |
| Local Government Employees | 12 | 0.7% |
| State Government Employees | 3 | 0.2% |
| Federal Government Employees | 1,502 | 84.2% |
| Unpaid Family Workers | 0 | 0.0% |
| Total | 1,783 | 100.0% |
Employment Status by Age in Fort Dix
According to the labor force statistics for Fort Dix, out of the total population over 16 years of age (6,631), 27.7% or 1,837 individuals are in the labor force, with 7.0% or 129 of them unemployed. The age group with the highest labor force participation rate is 20 to 24 years, with 68.1% or 551 individuals in the labor force. Within the labor force, the 25 to 29 years age range has the highest percentage of unemployed individuals, with 15.4% or 49 of them being unemployed.
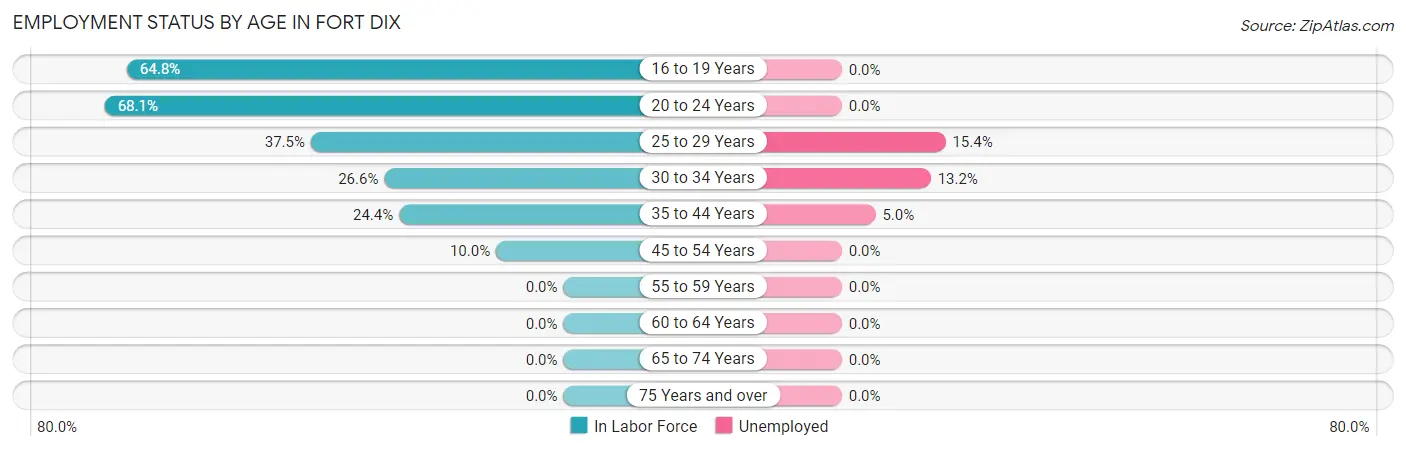
| Age Bracket | In Labor Force | Unemployed |
| 16 to 19 Years | 103 (64.8%) | 0 (0.0%) |
| 20 to 24 Years | 551 (68.1%) | 0 (0.0%) |
| 25 to 29 Years | 315 (37.5%) | 49 (15.4%) |
| 30 to 34 Years | 270 (26.6%) | 36 (13.2%) |
| 35 to 44 Years | 498 (24.4%) | 25 (5.0%) |
| 45 to 54 Years | 102 (10.0%) | 0 (0.0%) |
| 55 to 59 Years | 0 (0.0%) | 0 (0.0%) |
| 60 to 64 Years | 0 (0.0%) | 0 (0.0%) |
| 65 to 74 Years | 0 (0.0%) | 0 (0.0%) |
| 75 Years and over | 0 (0.0%) | 0 (0.0%) |
| Total | 1,837 (27.7%) | 129 (7.0%) |
Employment Status by Educational Attainment in Fort Dix
According to labor force statistics for Fort Dix, 21.6% of individuals (1,182) out of the total population between 25 and 64 years of age (5,472) are in the labor force, with 9.5% or 112 of them being unemployed. The group with the highest labor force participation rate are those with the educational attainment of bachelor's degree or higher, with 68.5% or 561 individuals in the labor force. Within the labor force, individuals with college / associate degree education have the highest percentage of unemployment, with 19.3% or 89 of them being unemployed.
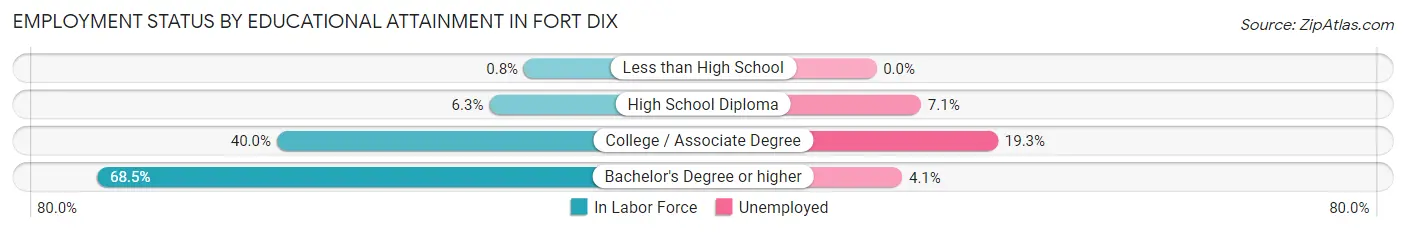
| Educational Attainment | In Labor Force | Unemployed |
| Less than High School | 8 (0.8%) | 0 (0.0%) |
| High School Diploma | 155 (6.3%) | 175 (7.1%) |
| College / Associate Degree | 461 (40.0%) | 222 (19.3%) |
| Bachelor's Degree or higher | 561 (68.5%) | 34 (4.1%) |
| Total | 1,182 (21.6%) | 520 (9.5%) |
Employment Occupations by Sex in Fort Dix
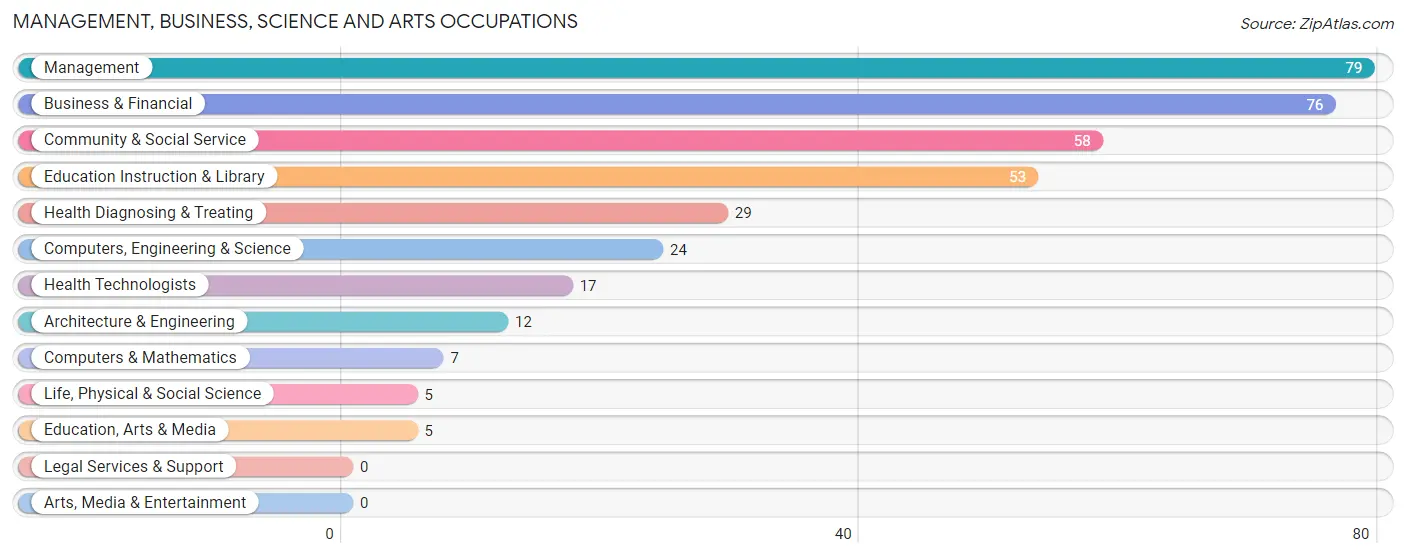
Management, Business, Science and Arts Occupations
The most common Management, Business, Science and Arts occupations in Fort Dix are Management (79 | 17.0%), Business & Financial (76 | 16.4%), Community & Social Service (58 | 12.5%), Education Instruction & Library (53 | 11.4%), and Health Diagnosing & Treating (29 | 6.2%).
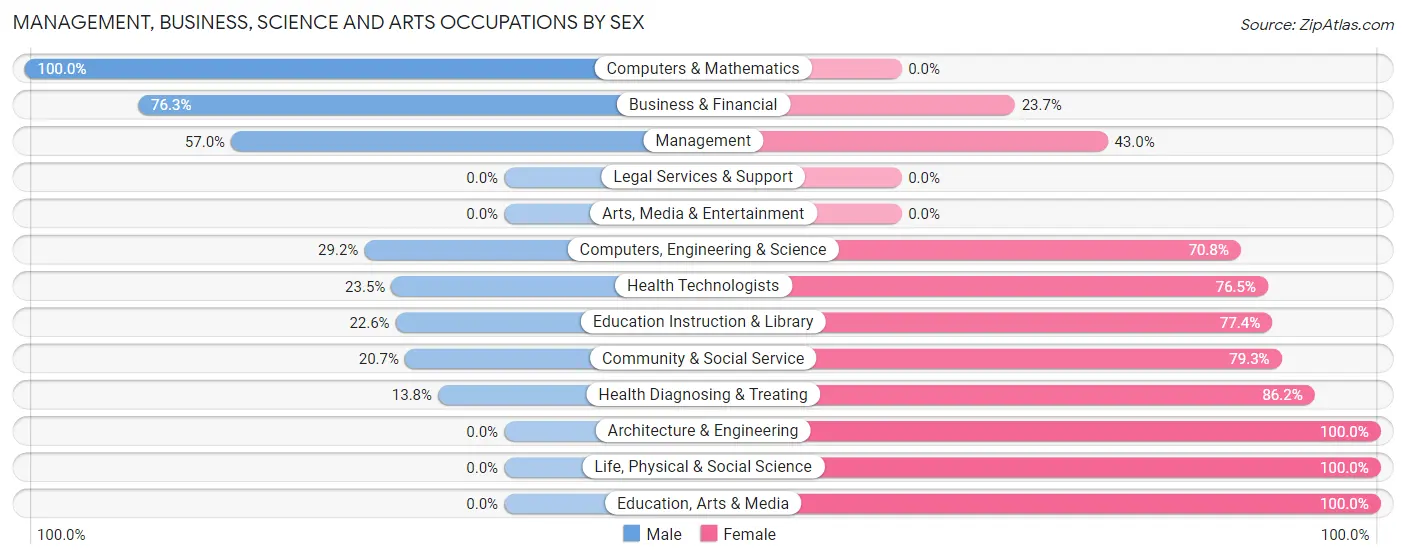
Management, Business, Science and Arts Occupations by Sex
Within the Management, Business, Science and Arts occupations in Fort Dix, the most male-oriented occupations are Computers & Mathematics (100.0%), Business & Financial (76.3%), and Management (57.0%), while the most female-oriented occupations are Architecture & Engineering (100.0%), Life, Physical & Social Science (100.0%), and Education, Arts & Media (100.0%).
| Occupation | Male | Female |
| Management | 45 (57.0%) | 34 (43.0%) |
| Business & Financial | 58 (76.3%) | 18 (23.7%) |
| Computers, Engineering & Science | 7 (29.2%) | 17 (70.8%) |
| Computers & Mathematics | 7 (100.0%) | 0 (0.0%) |
| Architecture & Engineering | 0 (0.0%) | 12 (100.0%) |
| Life, Physical & Social Science | 0 (0.0%) | 5 (100.0%) |
| Community & Social Service | 12 (20.7%) | 46 (79.3%) |
| Education, Arts & Media | 0 (0.0%) | 5 (100.0%) |
| Legal Services & Support | 0 (0.0%) | 0 (0.0%) |
| Education Instruction & Library | 12 (22.6%) | 41 (77.4%) |
| Arts, Media & Entertainment | 0 (0.0%) | 0 (0.0%) |
| Health Diagnosing & Treating | 4 (13.8%) | 25 (86.2%) |
| Health Technologists | 4 (23.5%) | 13 (76.5%) |
| Total (Category) | 126 (47.4%) | 140 (52.6%) |
| Total (Overall) | 162 (34.9%) | 302 (65.1%) |
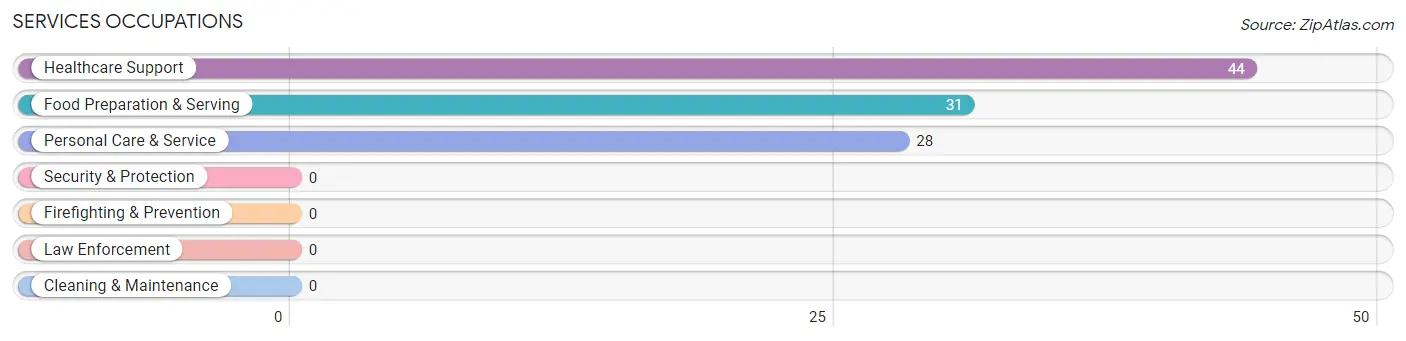
Services Occupations
The most common Services occupations in Fort Dix are Healthcare Support (44 | 9.5%), Food Preparation & Serving (31 | 6.7%), and Personal Care & Service (28 | 6.0%).
Services Occupations by Sex
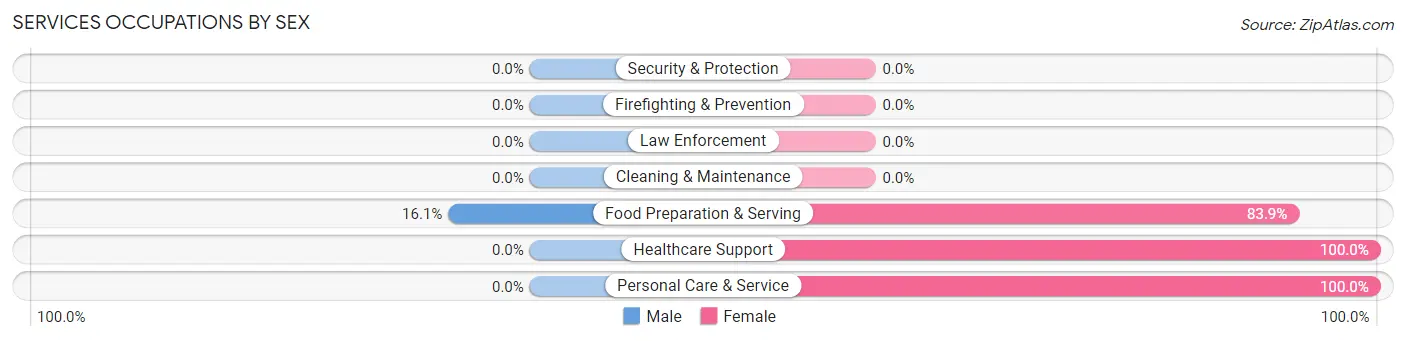
| Occupation | Male | Female |
| Healthcare Support | 0 (0.0%) | 44 (100.0%) |
| Security & Protection | 0 (0.0%) | 0 (0.0%) |
| Firefighting & Prevention | 0 (0.0%) | 0 (0.0%) |
| Law Enforcement | 0 (0.0%) | 0 (0.0%) |
| Food Preparation & Serving | 5 (16.1%) | 26 (83.9%) |
| Cleaning & Maintenance | 0 (0.0%) | 0 (0.0%) |
| Personal Care & Service | 0 (0.0%) | 28 (100.0%) |
| Total (Category) | 5 (4.9%) | 98 (95.2%) |
| Total (Overall) | 162 (34.9%) | 302 (65.1%) |
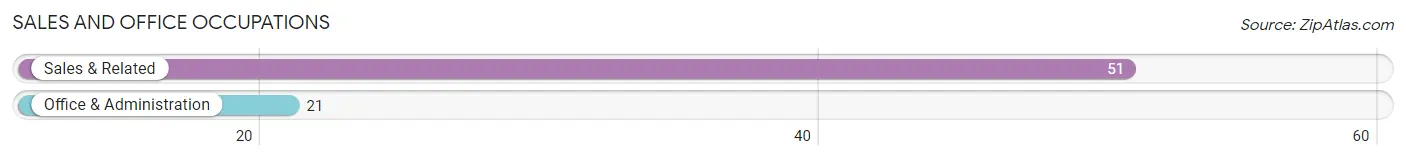
Sales and Office Occupations
The most common Sales and Office occupations in Fort Dix are Sales & Related (51 | 11.0%), and Office & Administration (21 | 4.5%).
Sales and Office Occupations by Sex
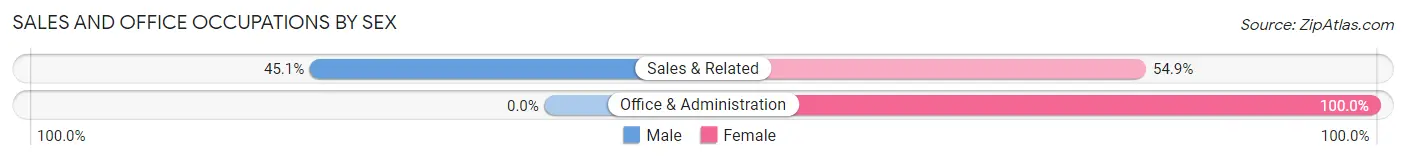
| Occupation | Male | Female |
| Sales & Related | 23 (45.1%) | 28 (54.9%) |
| Office & Administration | 0 (0.0%) | 21 (100.0%) |
| Total (Category) | 23 (31.9%) | 49 (68.1%) |
| Total (Overall) | 162 (34.9%) | 302 (65.1%) |
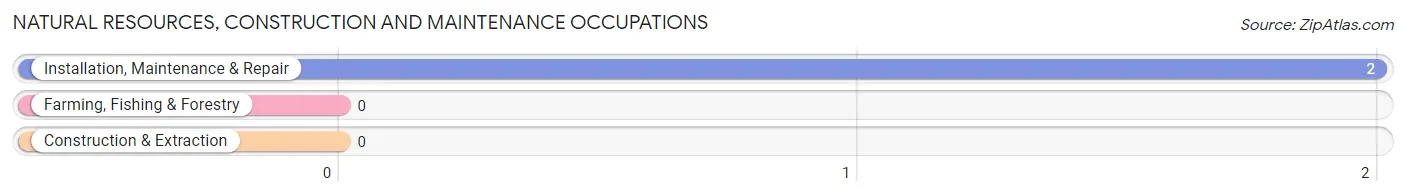
Natural Resources, Construction and Maintenance Occupations
The most common Natural Resources, Construction and Maintenance occupations in Fort Dix are , and Installation, Maintenance & Repair (2 | 0.4%).
Natural Resources, Construction and Maintenance Occupations by Sex
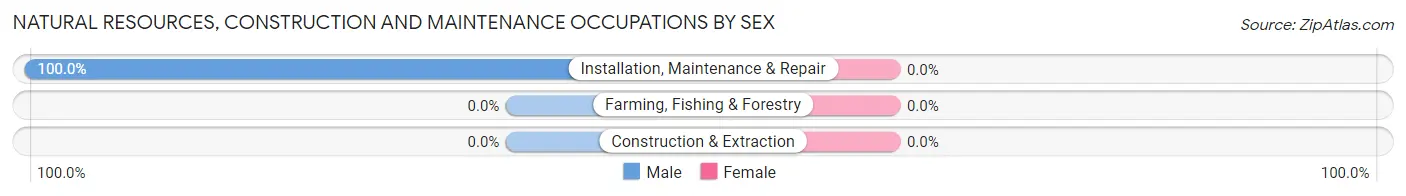
| Occupation | Male | Female |
| Farming, Fishing & Forestry | 0 (0.0%) | 0 (0.0%) |
| Construction & Extraction | 0 (0.0%) | 0 (0.0%) |
| Installation, Maintenance & Repair | 2 (100.0%) | 0 (0.0%) |
| Total (Category) | 2 (100.0%) | 0 (0.0%) |
| Total (Overall) | 162 (34.9%) | 302 (65.1%) |
Production, Transportation and Moving Occupations
The most common Production, Transportation and Moving occupations in Fort Dix are Material Moving (16 | 3.5%), and Production (5 | 1.1%).
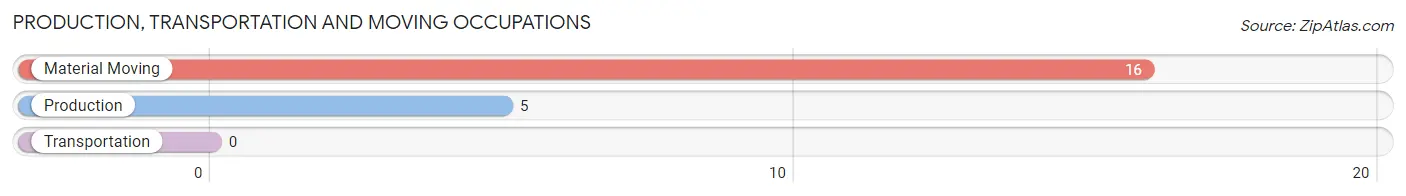
Production, Transportation and Moving Occupations by Sex
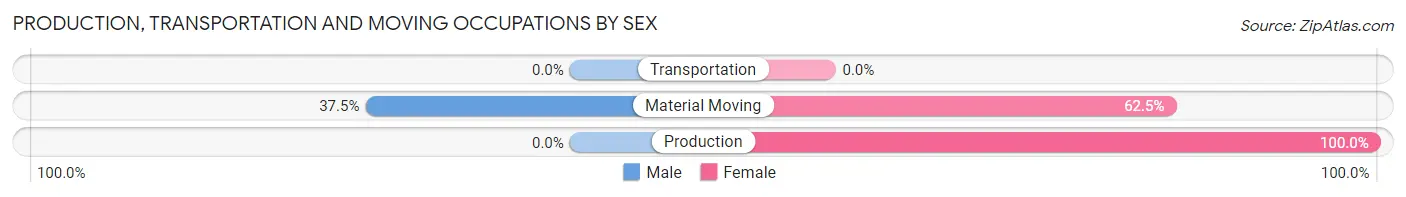
| Occupation | Male | Female |
| Production | 0 (0.0%) | 5 (100.0%) |
| Transportation | 0 (0.0%) | 0 (0.0%) |
| Material Moving | 6 (37.5%) | 10 (62.5%) |
| Total (Category) | 6 (28.6%) | 15 (71.4%) |
| Total (Overall) | 162 (34.9%) | 302 (65.1%) |
Employment Industries by Sex in Fort Dix
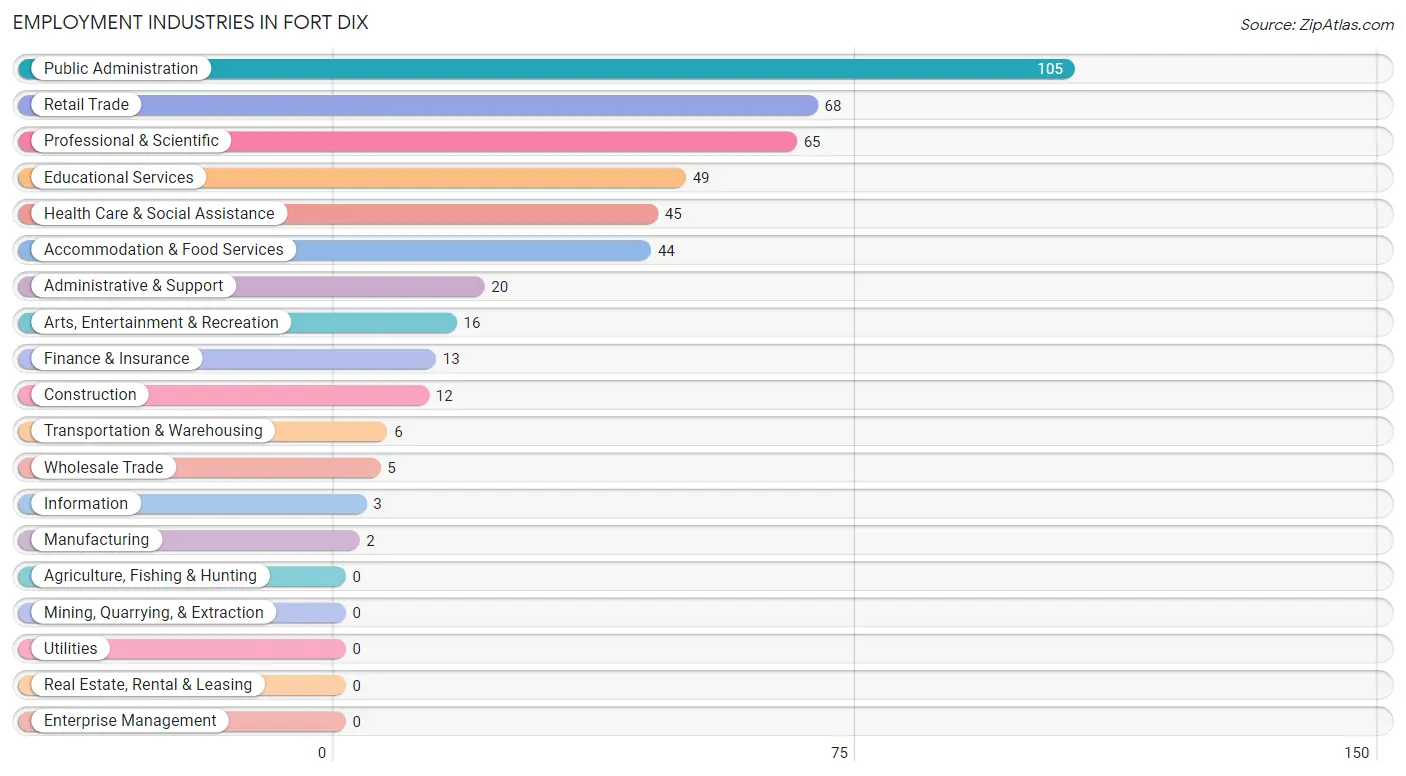
Employment Industries in Fort Dix
The major employment industries in Fort Dix include Public Administration (105 | 22.6%), Retail Trade (68 | 14.7%), Professional & Scientific (65 | 14.0%), Educational Services (49 | 10.6%), and Health Care & Social Assistance (45 | 9.7%).
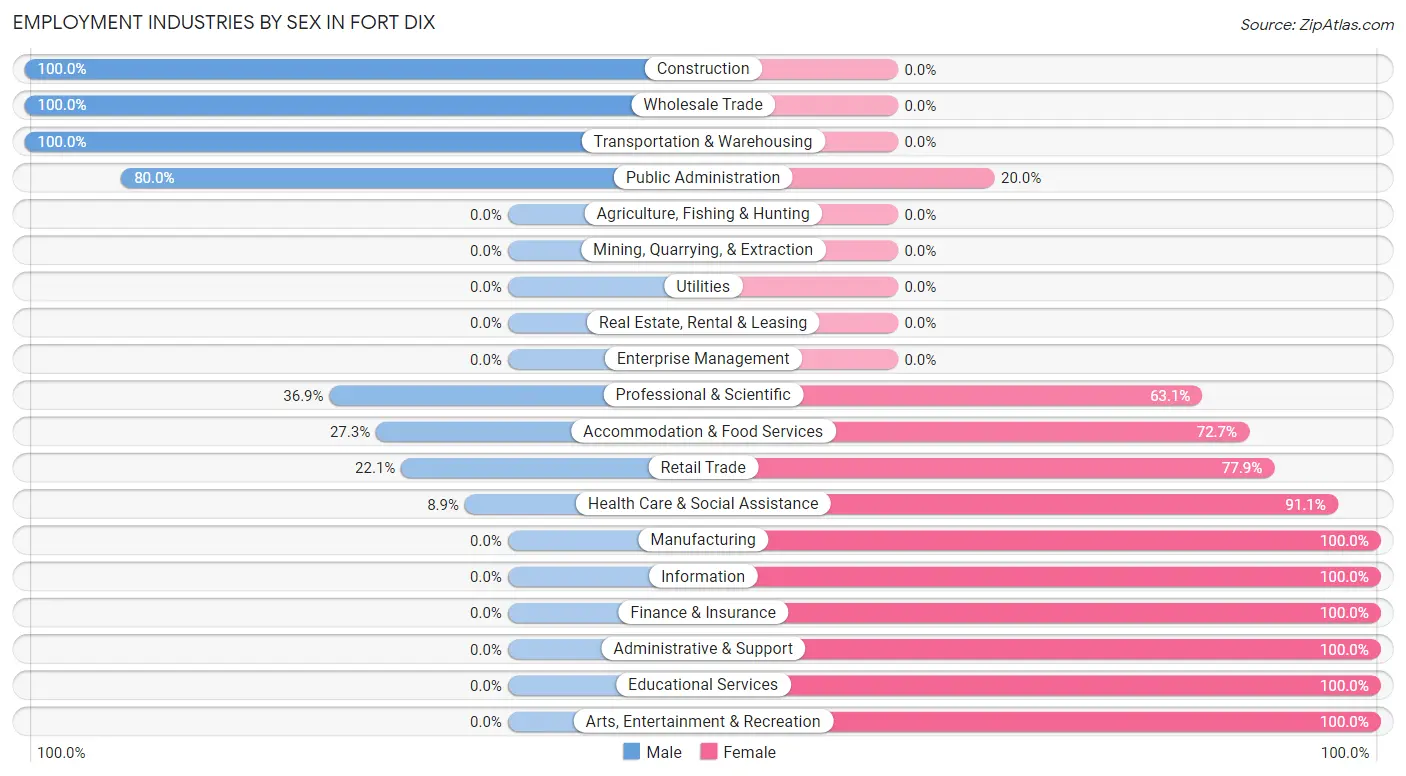
Employment Industries by Sex in Fort Dix
The Fort Dix industries that see more men than women are Construction (100.0%), Wholesale Trade (100.0%), and Transportation & Warehousing (100.0%), whereas the industries that tend to have a higher number of women are Manufacturing (100.0%), Information (100.0%), and Finance & Insurance (100.0%).
| Industry | Male | Female |
| Agriculture, Fishing & Hunting | 0 (0.0%) | 0 (0.0%) |
| Mining, Quarrying, & Extraction | 0 (0.0%) | 0 (0.0%) |
| Construction | 12 (100.0%) | 0 (0.0%) |
| Manufacturing | 0 (0.0%) | 2 (100.0%) |
| Wholesale Trade | 5 (100.0%) | 0 (0.0%) |
| Retail Trade | 15 (22.1%) | 53 (77.9%) |
| Transportation & Warehousing | 6 (100.0%) | 0 (0.0%) |
| Utilities | 0 (0.0%) | 0 (0.0%) |
| Information | 0 (0.0%) | 3 (100.0%) |
| Finance & Insurance | 0 (0.0%) | 13 (100.0%) |
| Real Estate, Rental & Leasing | 0 (0.0%) | 0 (0.0%) |
| Professional & Scientific | 24 (36.9%) | 41 (63.1%) |
| Enterprise Management | 0 (0.0%) | 0 (0.0%) |
| Administrative & Support | 0 (0.0%) | 20 (100.0%) |
| Educational Services | 0 (0.0%) | 49 (100.0%) |
| Health Care & Social Assistance | 4 (8.9%) | 41 (91.1%) |
| Arts, Entertainment & Recreation | 0 (0.0%) | 16 (100.0%) |
| Accommodation & Food Services | 12 (27.3%) | 32 (72.7%) |
| Public Administration | 84 (80.0%) | 21 (20.0%) |
| Total | 162 (34.9%) | 302 (65.1%) |
Education in Fort Dix
School Enrollment in Fort Dix
The most common levels of schooling among the 1,606 students in Fort Dix are college / undergraduate (521 | 32.4%), elementary school (384 | 23.9%), and middle school (338 | 21.0%).
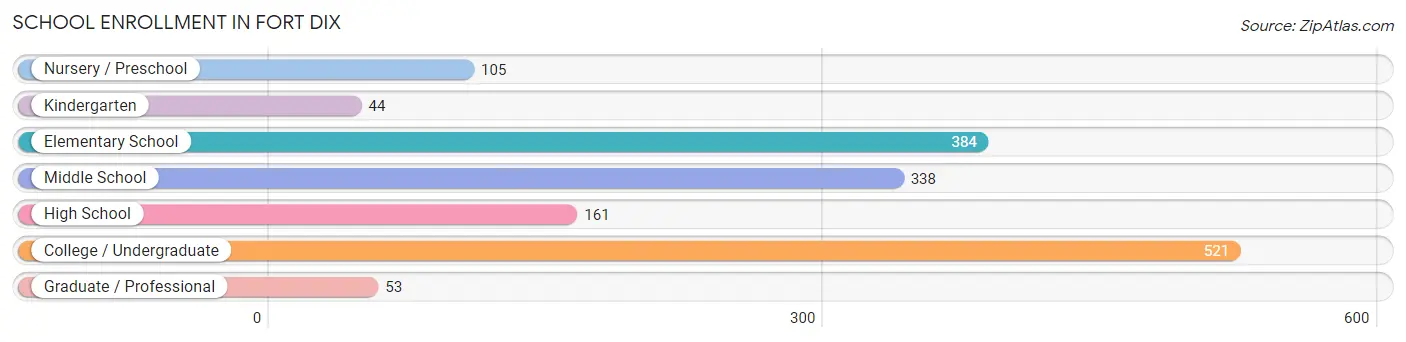
| School Level | # Students | % Students |
| Nursery / Preschool | 105 | 6.5% |
| Kindergarten | 44 | 2.7% |
| Elementary School | 384 | 23.9% |
| Middle School | 338 | 21.0% |
| High School | 161 | 10.0% |
| College / Undergraduate | 521 | 32.4% |
| Graduate / Professional | 53 | 3.3% |
| Total | 1,606 | 100.0% |
School Enrollment by Age by Funding Source in Fort Dix
Out of a total of 1,606 students who are enrolled in schools in Fort Dix, 491 (30.6%) attend a private institution, while the remaining 1,115 (69.4%) are enrolled in public schools. The age group of 5 to 9 year old has the highest likelihood of being enrolled in private schools, with 212 (49.3% in the age bracket) enrolled. Conversely, the age group of 35 years and over has the lowest likelihood of being enrolled in a private school, with 154 (96.3% in the age bracket) attending a public institution.
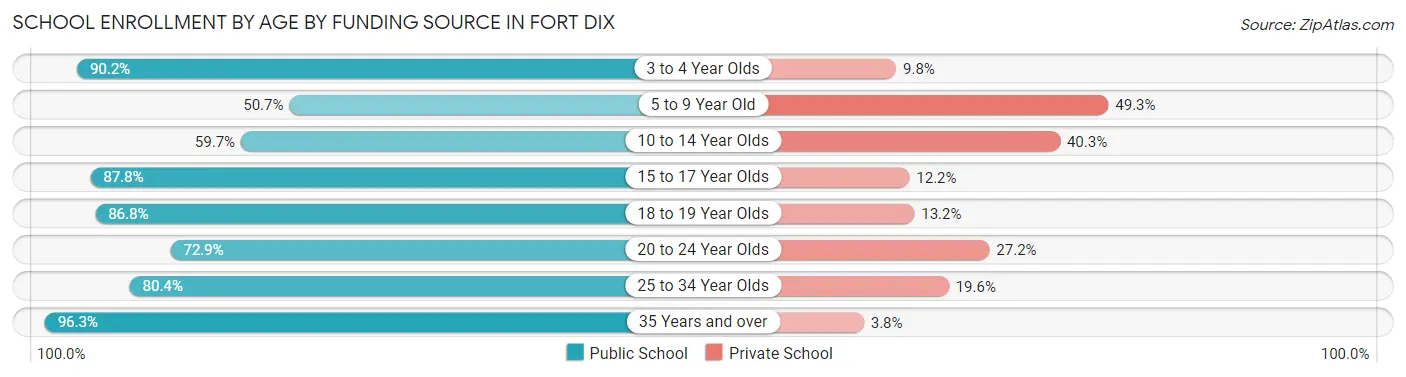
| Age Bracket | Public School | Private School |
| 3 to 4 Year Olds | 74 (90.2%) | 8 (9.8%) |
| 5 to 9 Year Old | 218 (50.7%) | 212 (49.3%) |
| 10 to 14 Year Olds | 209 (59.7%) | 141 (40.3%) |
| 15 to 17 Year Olds | 43 (87.8%) | 6 (12.2%) |
| 18 to 19 Year Olds | 33 (86.8%) | 5 (13.2%) |
| 20 to 24 Year Olds | 161 (72.9%) | 60 (27.2%) |
| 25 to 34 Year Olds | 222 (80.4%) | 54 (19.6%) |
| 35 Years and over | 154 (96.3%) | 6 (3.7%) |
| Total | 1,115 (69.4%) | 491 (30.6%) |
Educational Attainment by Field of Study in Fort Dix
Arts & humanities (208 | 23.5%), business (207 | 23.4%), science & technology (142 | 16.1%), education (58 | 6.6%), and bio, nature & agricultural (56 | 6.3%) are the most common fields of study among 885 individuals in Fort Dix who have obtained a bachelor's degree or higher.
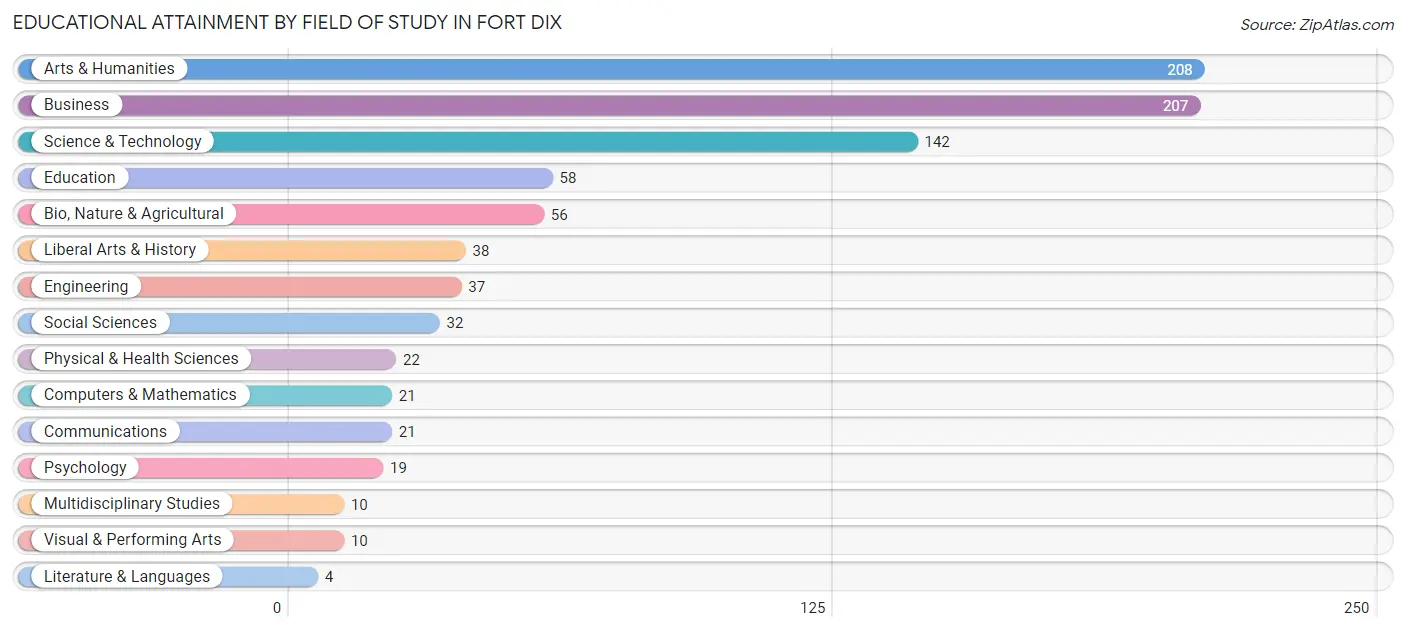
| Field of Study | # Graduates | % Graduates |
| Computers & Mathematics | 21 | 2.4% |
| Bio, Nature & Agricultural | 56 | 6.3% |
| Physical & Health Sciences | 22 | 2.5% |
| Psychology | 19 | 2.1% |
| Social Sciences | 32 | 3.6% |
| Engineering | 37 | 4.2% |
| Multidisciplinary Studies | 10 | 1.1% |
| Science & Technology | 142 | 16.1% |
| Business | 207 | 23.4% |
| Education | 58 | 6.6% |
| Literature & Languages | 4 | 0.4% |
| Liberal Arts & History | 38 | 4.3% |
| Visual & Performing Arts | 10 | 1.1% |
| Communications | 21 | 2.4% |
| Arts & Humanities | 208 | 23.5% |
| Total | 885 | 100.0% |
Transportation & Commute in Fort Dix
Vehicle Availability by Sex in Fort Dix
The most prevalent vehicle ownership categories in Fort Dix are males with 2 vehicles (479, accounting for 52.7%) and females with 2 vehicles (276, making up 130.5%).
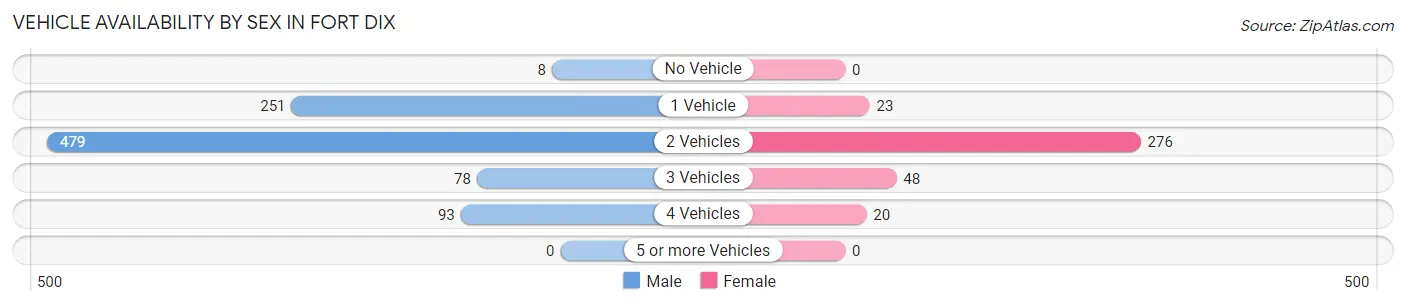
| Vehicles Available | Male | Female |
| No Vehicle | 8 (0.9%) | 0 (0.0%) |
| 1 Vehicle | 251 (27.6%) | 23 (6.3%) |
| 2 Vehicles | 479 (52.7%) | 276 (75.2%) |
| 3 Vehicles | 78 (8.6%) | 48 (13.1%) |
| 4 Vehicles | 93 (10.2%) | 20 (5.4%) |
| 5 or more Vehicles | 0 (0.0%) | 0 (0.0%) |
| Total | 909 (100.0%) | 367 (100.0%) |
Commute Time in Fort Dix
The most frequently occuring commute durations in Fort Dix are 5 to 9 minutes (423 commuters, 25.8%), 10 to 14 minutes (391 commuters, 23.9%), and 15 to 19 minutes (331 commuters, 20.2%).
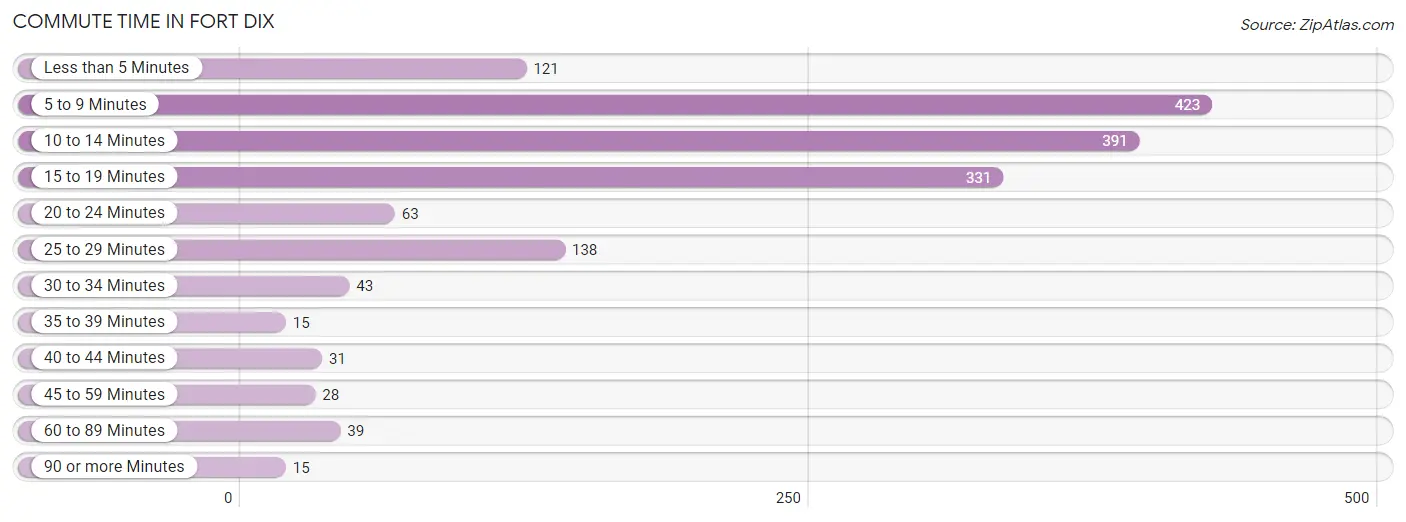
| Commute Time | # Commuters | % Commuters |
| Less than 5 Minutes | 121 | 7.4% |
| 5 to 9 Minutes | 423 | 25.8% |
| 10 to 14 Minutes | 391 | 23.9% |
| 15 to 19 Minutes | 331 | 20.2% |
| 20 to 24 Minutes | 63 | 3.8% |
| 25 to 29 Minutes | 138 | 8.4% |
| 30 to 34 Minutes | 43 | 2.6% |
| 35 to 39 Minutes | 15 | 0.9% |
| 40 to 44 Minutes | 31 | 1.9% |
| 45 to 59 Minutes | 28 | 1.7% |
| 60 to 89 Minutes | 39 | 2.4% |
| 90 or more Minutes | 15 | 0.9% |
Commute Time by Sex in Fort Dix
The most common commute times in Fort Dix are 5 to 9 minutes (311 commuters, 25.7%) for males and 5 to 9 minutes (112 commuters, 26.2%) for females.
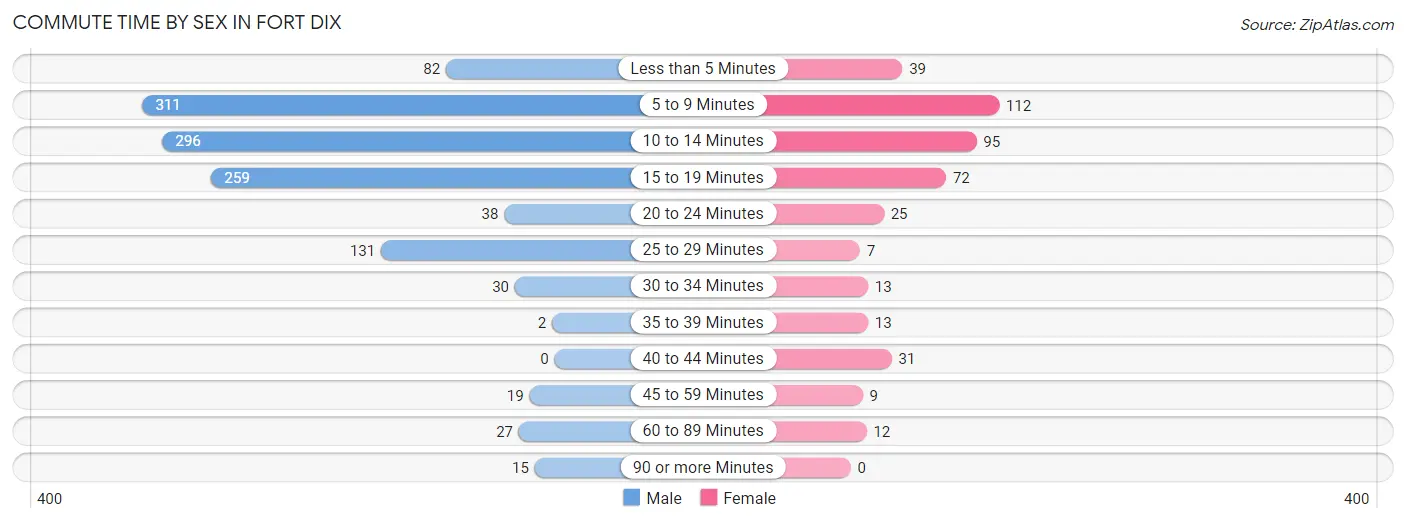
| Commute Time | Male | Female |
| Less than 5 Minutes | 82 (6.8%) | 39 (9.1%) |
| 5 to 9 Minutes | 311 (25.7%) | 112 (26.2%) |
| 10 to 14 Minutes | 296 (24.5%) | 95 (22.2%) |
| 15 to 19 Minutes | 259 (21.4%) | 72 (16.8%) |
| 20 to 24 Minutes | 38 (3.1%) | 25 (5.8%) |
| 25 to 29 Minutes | 131 (10.8%) | 7 (1.6%) |
| 30 to 34 Minutes | 30 (2.5%) | 13 (3.0%) |
| 35 to 39 Minutes | 2 (0.2%) | 13 (3.0%) |
| 40 to 44 Minutes | 0 (0.0%) | 31 (7.2%) |
| 45 to 59 Minutes | 19 (1.6%) | 9 (2.1%) |
| 60 to 89 Minutes | 27 (2.2%) | 12 (2.8%) |
| 90 or more Minutes | 15 (1.2%) | 0 (0.0%) |
Time of Departure to Work by Sex in Fort Dix
The most frequent times of departure to work in Fort Dix are 7:00 AM to 7:29 AM (331, 27.4%) for males and 7:00 AM to 7:29 AM (141, 32.9%) for females.
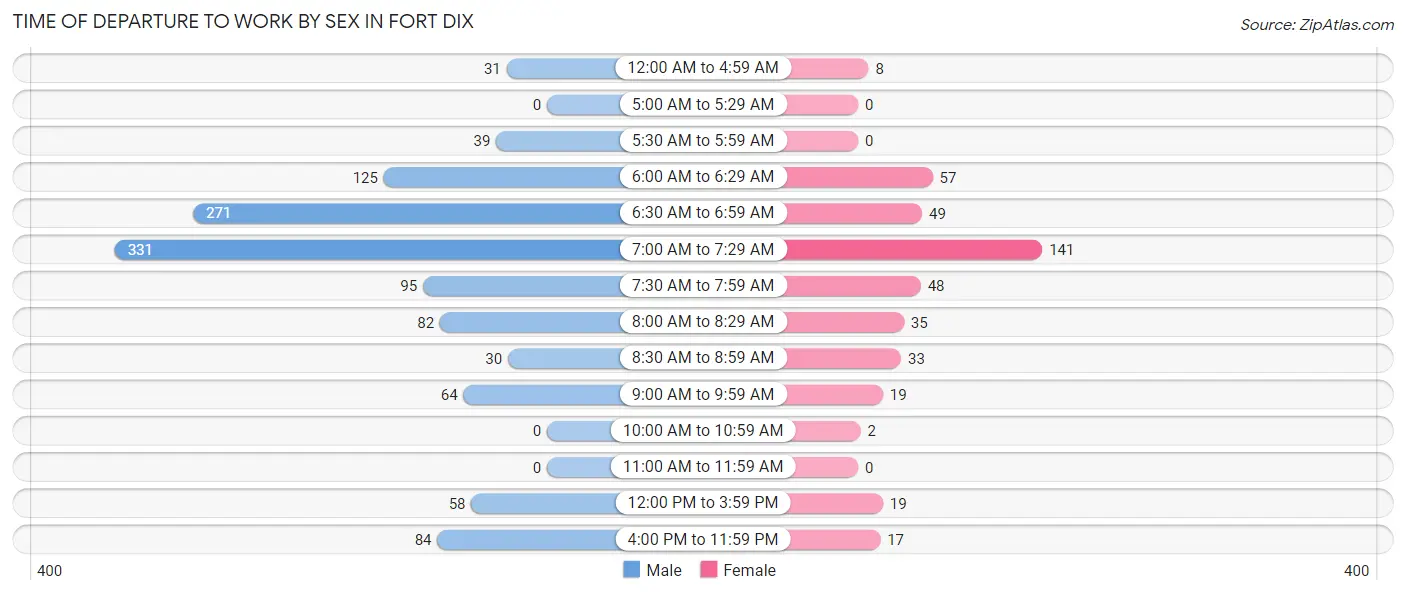
| Time of Departure | Male | Female |
| 12:00 AM to 4:59 AM | 31 (2.6%) | 8 (1.9%) |
| 5:00 AM to 5:29 AM | 0 (0.0%) | 0 (0.0%) |
| 5:30 AM to 5:59 AM | 39 (3.2%) | 0 (0.0%) |
| 6:00 AM to 6:29 AM | 125 (10.3%) | 57 (13.3%) |
| 6:30 AM to 6:59 AM | 271 (22.4%) | 49 (11.5%) |
| 7:00 AM to 7:29 AM | 331 (27.4%) | 141 (32.9%) |
| 7:30 AM to 7:59 AM | 95 (7.9%) | 48 (11.2%) |
| 8:00 AM to 8:29 AM | 82 (6.8%) | 35 (8.2%) |
| 8:30 AM to 8:59 AM | 30 (2.5%) | 33 (7.7%) |
| 9:00 AM to 9:59 AM | 64 (5.3%) | 19 (4.4%) |
| 10:00 AM to 10:59 AM | 0 (0.0%) | 2 (0.5%) |
| 11:00 AM to 11:59 AM | 0 (0.0%) | 0 (0.0%) |
| 12:00 PM to 3:59 PM | 58 (4.8%) | 19 (4.4%) |
| 4:00 PM to 11:59 PM | 84 (6.9%) | 17 (4.0%) |
| Total | 1,210 (100.0%) | 428 (100.0%) |
Housing Occupancy in Fort Dix
Occupancy by Ownership in Fort Dix
Of the total 891 dwellings in Fort Dix, owner-occupied units account for 2 (0.2%), while renter-occupied units make up 889 (99.8%).
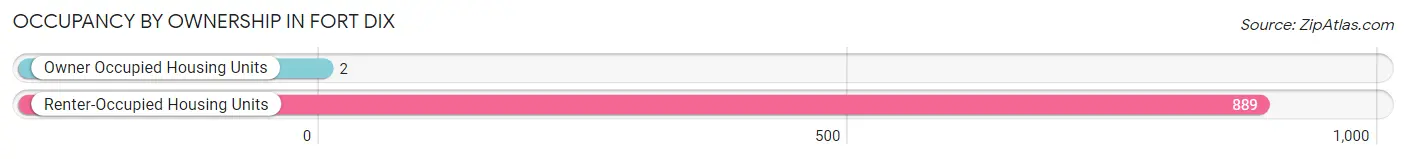
| Occupancy | # Housing Units | % Housing Units |
| Owner Occupied Housing Units | 2 | 0.2% |
| Renter-Occupied Housing Units | 889 | 99.8% |
| Total Occupied Housing Units | 891 | 100.0% |
Occupancy by Household Size in Fort Dix
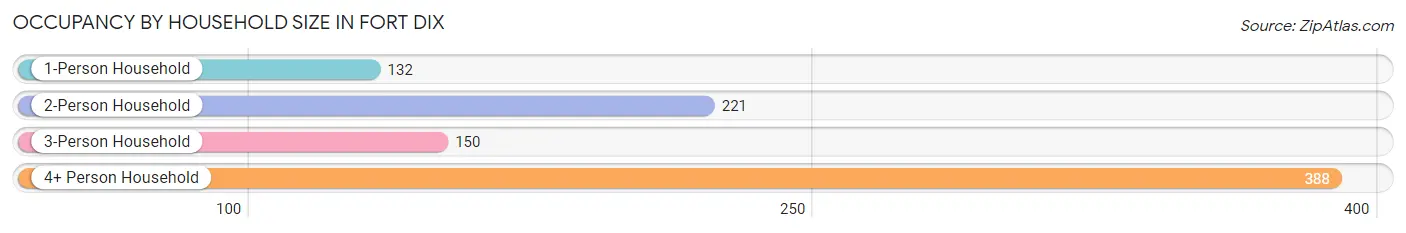
| Household Size | # Housing Units | % Housing Units |
| 1-Person Household | 132 | 14.8% |
| 2-Person Household | 221 | 24.8% |
| 3-Person Household | 150 | 16.8% |
| 4+ Person Household | 388 | 43.5% |
| Total Housing Units | 891 | 100.0% |
Occupancy by Ownership by Household Size in Fort Dix
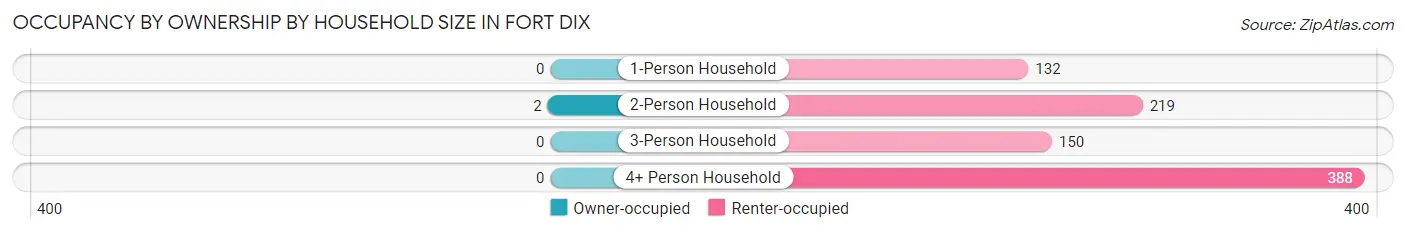
| Household Size | Owner-occupied | Renter-occupied |
| 1-Person Household | 0 (0.0%) | 132 (100.0%) |
| 2-Person Household | 2 (0.9%) | 219 (99.1%) |
| 3-Person Household | 0 (0.0%) | 150 (100.0%) |
| 4+ Person Household | 0 (0.0%) | 388 (100.0%) |
| Total Housing Units | 2 (0.2%) | 889 (99.8%) |
Occupancy by Educational Attainment in Fort Dix
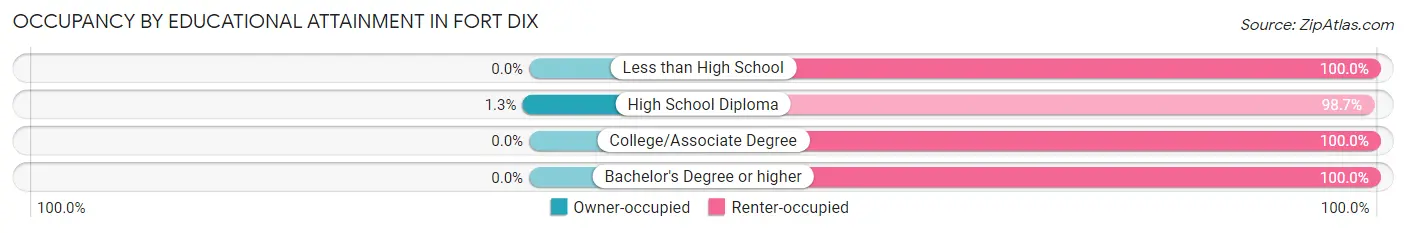
| Household Size | Owner-occupied | Renter-occupied |
| Less than High School | 0 (0.0%) | 7 (100.0%) |
| High School Diploma | 2 (1.3%) | 148 (98.7%) |
| College/Associate Degree | 0 (0.0%) | 335 (100.0%) |
| Bachelor's Degree or higher | 0 (0.0%) | 399 (100.0%) |
Occupancy by Age of Householder in Fort Dix
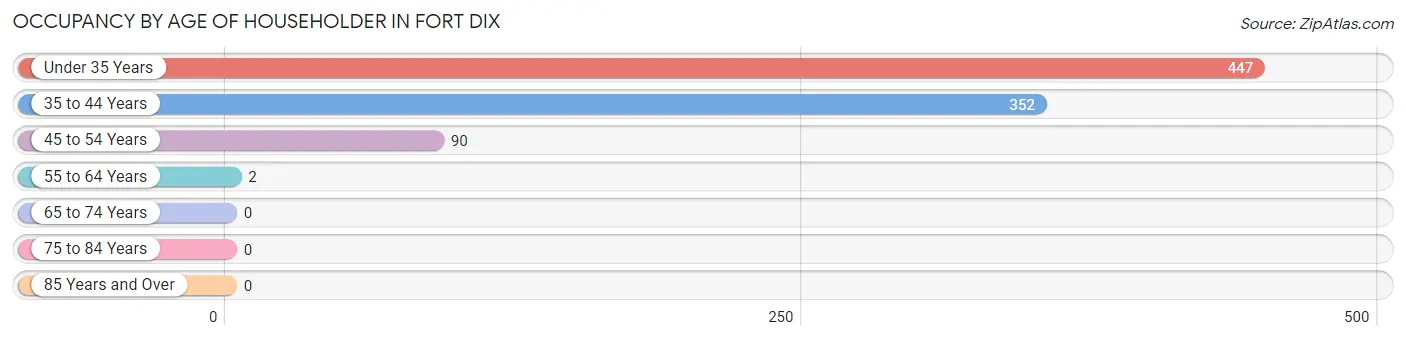
| Age Bracket | # Households | % Households |
| Under 35 Years | 447 | 50.2% |
| 35 to 44 Years | 352 | 39.5% |
| 45 to 54 Years | 90 | 10.1% |
| 55 to 64 Years | 2 | 0.2% |
| 65 to 74 Years | 0 | 0.0% |
| 75 to 84 Years | 0 | 0.0% |
| 85 Years and Over | 0 | 0.0% |
| Total | 891 | 100.0% |
Housing Finances in Fort Dix
Median Income by Occupancy in Fort Dix
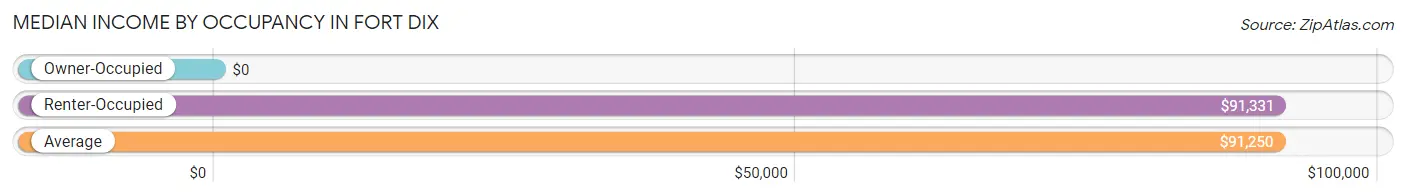
| Occupancy Type | # Households | Median Income |
| Owner-Occupied | 2 (0.2%) | $0 |
| Renter-Occupied | 889 (99.8%) | $91,331 |
| Average | 891 (100.0%) | $91,250 |
Occupancy by Householder Income Bracket in Fort Dix
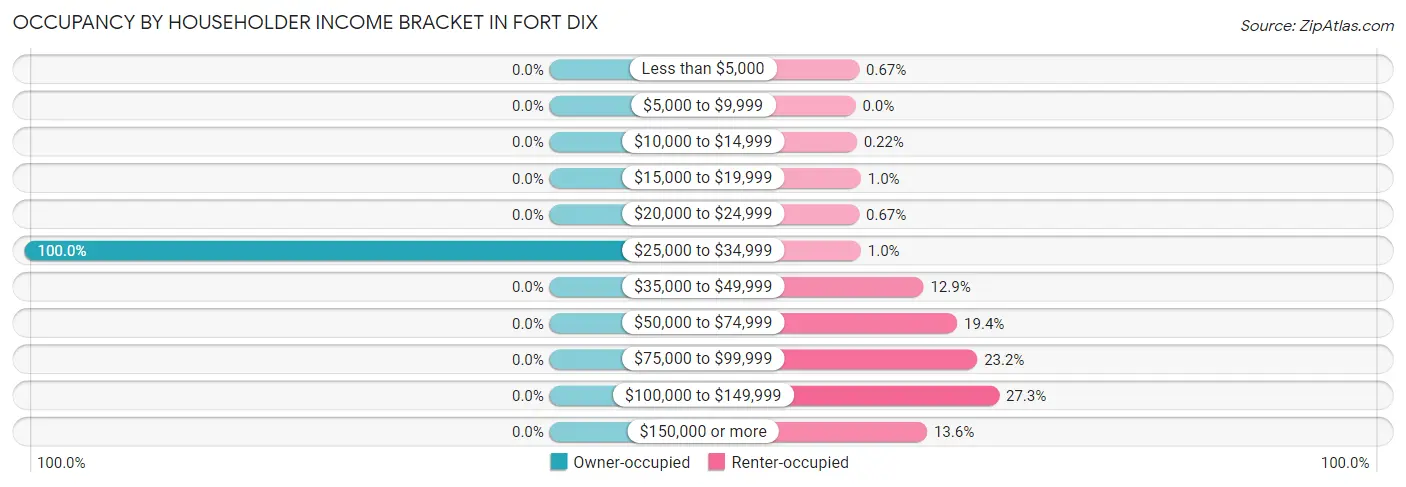
| Income Bracket | Owner-occupied | Renter-occupied |
| Less than $5,000 | 0 (0.0%) | 6 (0.7%) |
| $5,000 to $9,999 | 0 (0.0%) | 0 (0.0%) |
| $10,000 to $14,999 | 0 (0.0%) | 2 (0.2%) |
| $15,000 to $19,999 | 0 (0.0%) | 9 (1.0%) |
| $20,000 to $24,999 | 0 (0.0%) | 6 (0.7%) |
| $25,000 to $34,999 | 2 (100.0%) | 9 (1.0%) |
| $35,000 to $49,999 | 0 (0.0%) | 115 (12.9%) |
| $50,000 to $74,999 | 0 (0.0%) | 172 (19.4%) |
| $75,000 to $99,999 | 0 (0.0%) | 206 (23.2%) |
| $100,000 to $149,999 | 0 (0.0%) | 243 (27.3%) |
| $150,000 or more | 0 (0.0%) | 121 (13.6%) |
| Total | 2 (100.0%) | 889 (100.0%) |
Monthly Housing Cost Tiers in Fort Dix
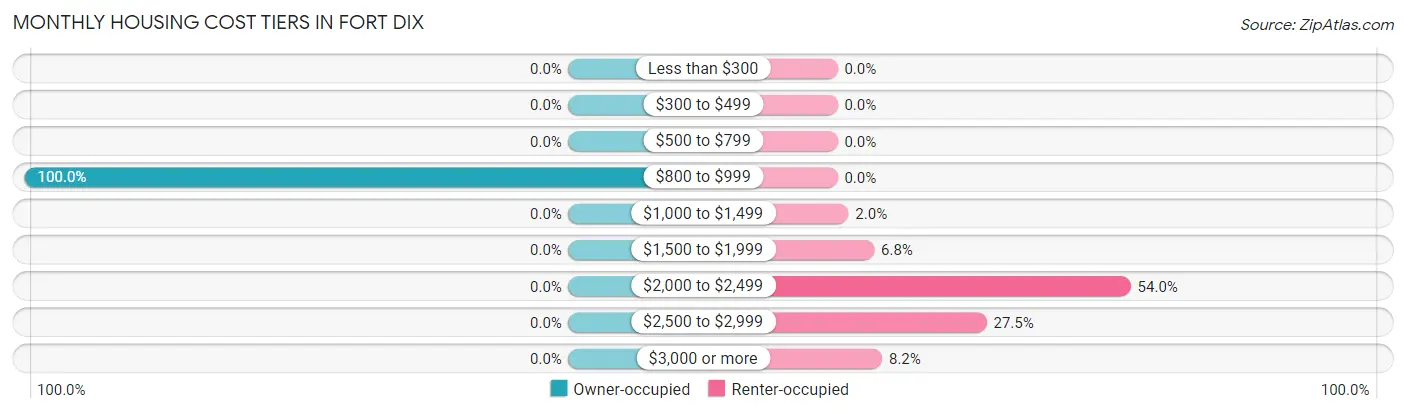
| Monthly Cost | Owner-occupied | Renter-occupied |
| Less than $300 | 0 (0.0%) | 0 (0.0%) |
| $300 to $499 | 0 (0.0%) | 0 (0.0%) |
| $500 to $799 | 0 (0.0%) | 0 (0.0%) |
| $800 to $999 | 2 (100.0%) | 0 (0.0%) |
| $1,000 to $1,499 | 0 (0.0%) | 18 (2.0%) |
| $1,500 to $1,999 | 0 (0.0%) | 60 (6.8%) |
| $2,000 to $2,499 | 0 (0.0%) | 480 (54.0%) |
| $2,500 to $2,999 | 0 (0.0%) | 244 (27.5%) |
| $3,000 or more | 0 (0.0%) | 73 (8.2%) |
| Total | 2 (100.0%) | 889 (100.0%) |
Physical Housing Characteristics in Fort Dix
Housing Structures in Fort Dix
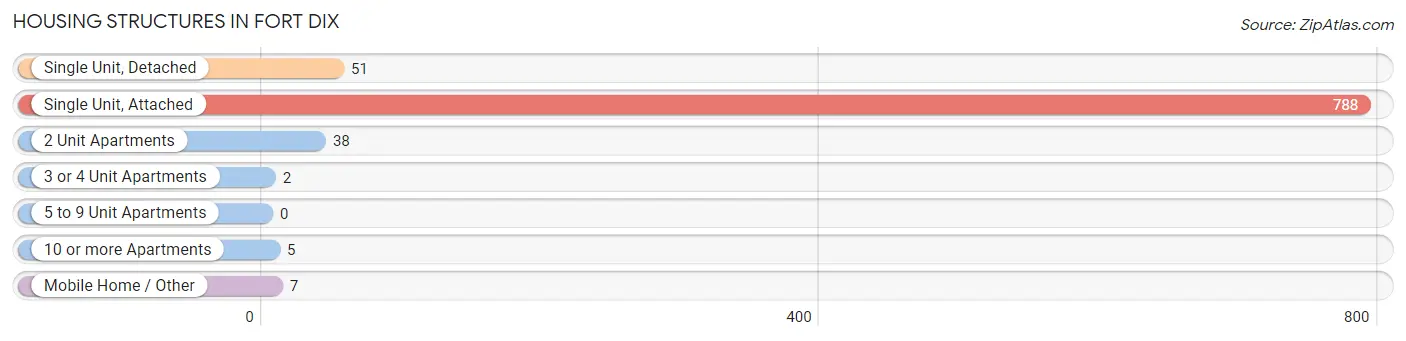
| Structure Type | # Housing Units | % Housing Units |
| Single Unit, Detached | 51 | 5.7% |
| Single Unit, Attached | 788 | 88.4% |
| 2 Unit Apartments | 38 | 4.3% |
| 3 or 4 Unit Apartments | 2 | 0.2% |
| 5 to 9 Unit Apartments | 0 | 0.0% |
| 10 or more Apartments | 5 | 0.6% |
| Mobile Home / Other | 7 | 0.8% |
| Total | 891 | 100.0% |
Housing Structures by Occupancy in Fort Dix
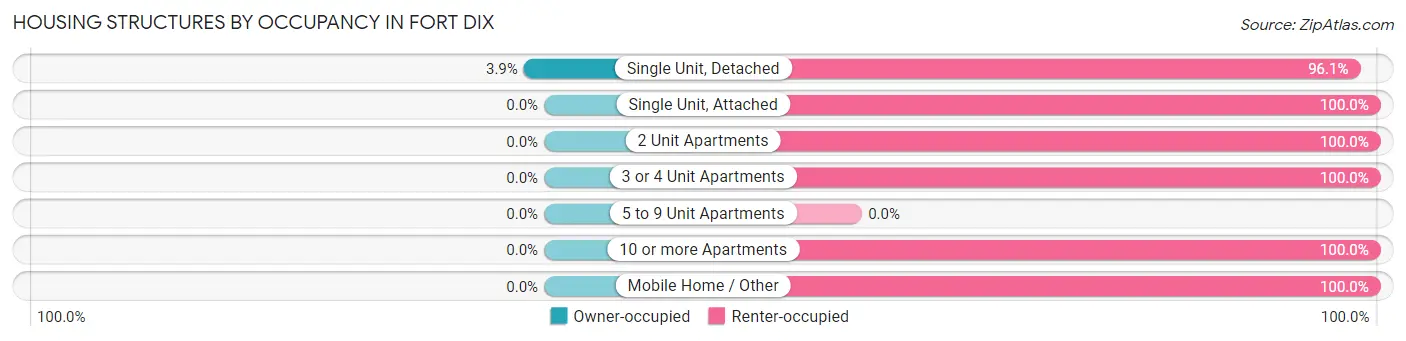
| Structure Type | Owner-occupied | Renter-occupied |
| Single Unit, Detached | 2 (3.9%) | 49 (96.1%) |
| Single Unit, Attached | 0 (0.0%) | 788 (100.0%) |
| 2 Unit Apartments | 0 (0.0%) | 38 (100.0%) |
| 3 or 4 Unit Apartments | 0 (0.0%) | 2 (100.0%) |
| 5 to 9 Unit Apartments | 0 (0.0%) | 0 (0.0%) |
| 10 or more Apartments | 0 (0.0%) | 5 (100.0%) |
| Mobile Home / Other | 0 (0.0%) | 7 (100.0%) |
| Total | 2 (0.2%) | 889 (99.8%) |
Housing Structures by Number of Rooms in Fort Dix
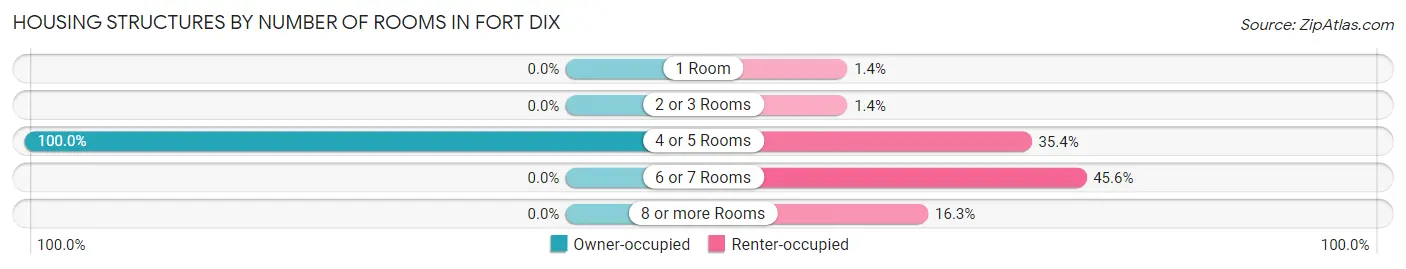
| Number of Rooms | Owner-occupied | Renter-occupied |
| 1 Room | 0 (0.0%) | 12 (1.3%) |
| 2 or 3 Rooms | 0 (0.0%) | 12 (1.3%) |
| 4 or 5 Rooms | 2 (100.0%) | 315 (35.4%) |
| 6 or 7 Rooms | 0 (0.0%) | 405 (45.6%) |
| 8 or more Rooms | 0 (0.0%) | 145 (16.3%) |
| Total | 2 (100.0%) | 889 (100.0%) |
Housing Structure by Heating Type in Fort Dix
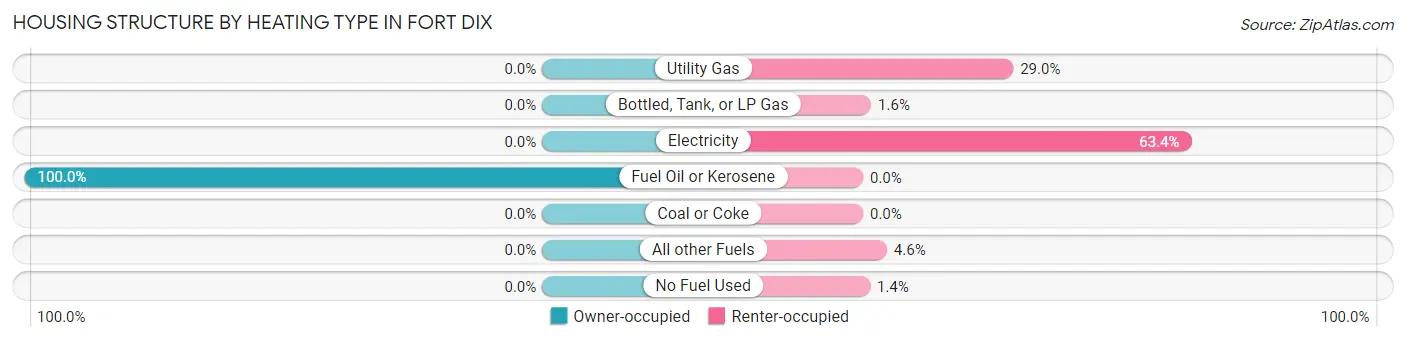
| Heating Type | Owner-occupied | Renter-occupied |
| Utility Gas | 0 (0.0%) | 258 (29.0%) |
| Bottled, Tank, or LP Gas | 0 (0.0%) | 14 (1.6%) |
| Electricity | 0 (0.0%) | 564 (63.4%) |
| Fuel Oil or Kerosene | 2 (100.0%) | 0 (0.0%) |
| Coal or Coke | 0 (0.0%) | 0 (0.0%) |
| All other Fuels | 0 (0.0%) | 41 (4.6%) |
| No Fuel Used | 0 (0.0%) | 12 (1.3%) |
| Total | 2 (100.0%) | 889 (100.0%) |
Household Vehicle Usage in Fort Dix
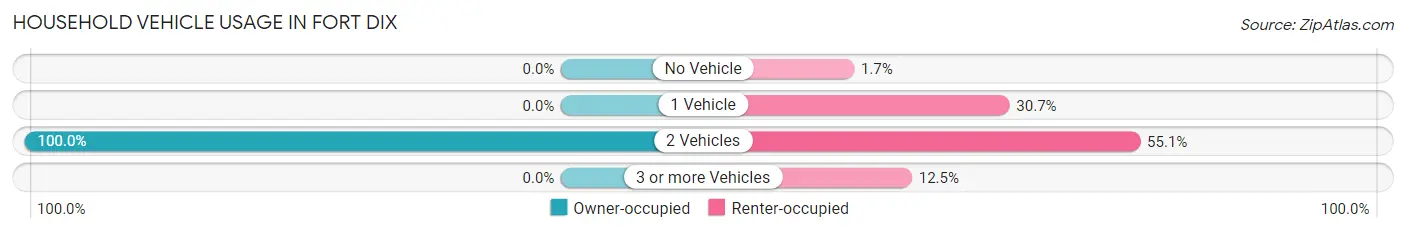
| Vehicles per Household | Owner-occupied | Renter-occupied |
| No Vehicle | 0 (0.0%) | 15 (1.7%) |
| 1 Vehicle | 0 (0.0%) | 273 (30.7%) |
| 2 Vehicles | 2 (100.0%) | 490 (55.1%) |
| 3 or more Vehicles | 0 (0.0%) | 111 (12.5%) |
| Total | 2 (100.0%) | 889 (100.0%) |
Real Estate & Mortgages in Fort Dix
Real Estate and Mortgage Overview in Fort Dix
| Characteristic | Without Mortgage | With Mortgage |
| Housing Units | 0 | 2 |
| Median Property Value | - | - |
| Median Household Income | - | - |
| Monthly Housing Costs | - | - |
| Real Estate Taxes | - | - |
Property Value by Mortgage Status in Fort Dix
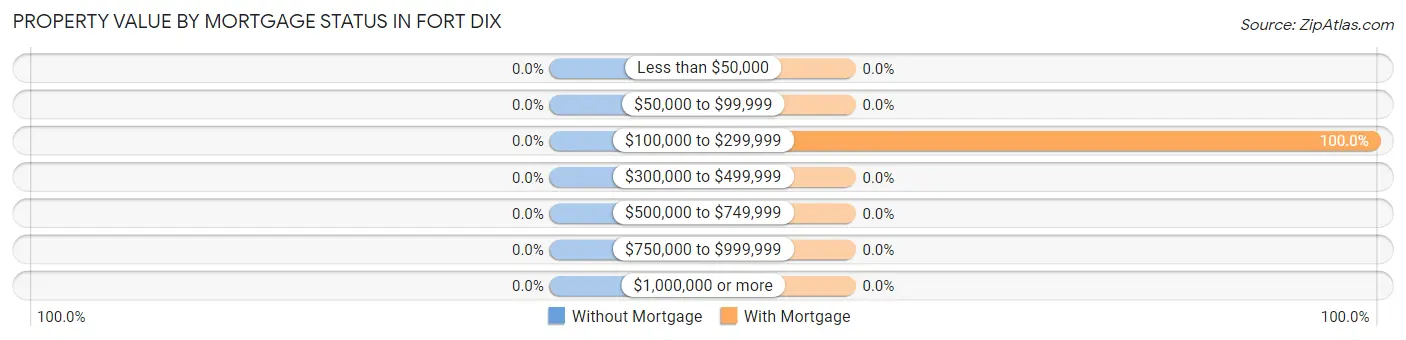
| Property Value | Without Mortgage | With Mortgage |
| Less than $50,000 | 0 (0.0%) | 0 (0.0%) |
| $50,000 to $99,999 | 0 (0.0%) | 0 (0.0%) |
| $100,000 to $299,999 | 0 (0.0%) | 2 (100.0%) |
| $300,000 to $499,999 | 0 (0.0%) | 0 (0.0%) |
| $500,000 to $749,999 | 0 (0.0%) | 0 (0.0%) |
| $750,000 to $999,999 | 0 (0.0%) | 0 (0.0%) |
| $1,000,000 or more | 0 (0.0%) | 0 (0.0%) |
| Total | 0 (0.0%) | 2 (100.0%) |
Household Income by Mortgage Status in Fort Dix
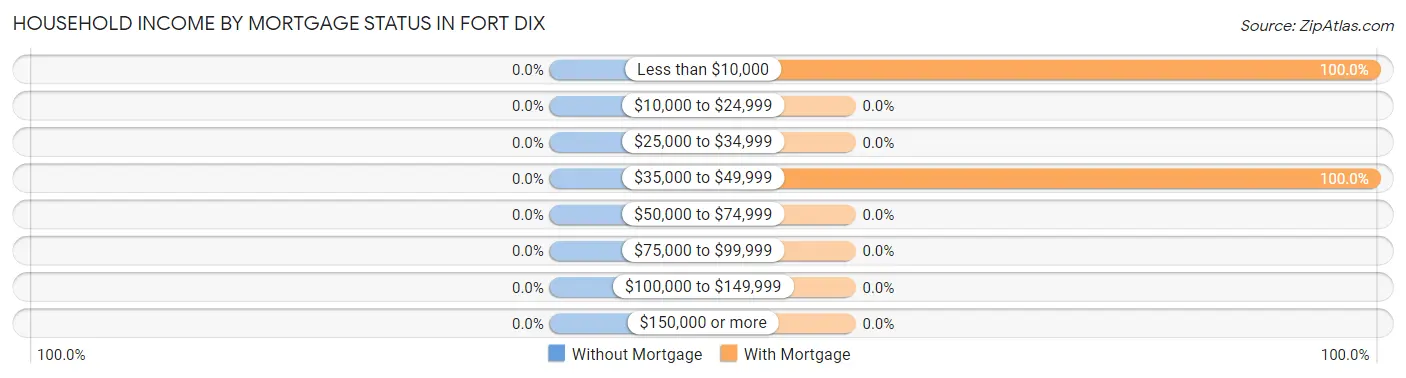
| Household Income | Without Mortgage | With Mortgage |
| Less than $10,000 | 0 (0.0%) | 2 (100.0%) |
| $10,000 to $24,999 | 0 (0.0%) | 0 (0.0%) |
| $25,000 to $34,999 | 0 (0.0%) | 0 (0.0%) |
| $35,000 to $49,999 | 0 (0.0%) | 2 (100.0%) |
| $50,000 to $74,999 | 0 (0.0%) | 0 (0.0%) |
| $75,000 to $99,999 | 0 (0.0%) | 0 (0.0%) |
| $100,000 to $149,999 | 0 (0.0%) | 0 (0.0%) |
| $150,000 or more | 0 (0.0%) | 0 (0.0%) |
| Total | 0 (0.0%) | 2 (100.0%) |
Property Value to Household Income Ratio in Fort Dix
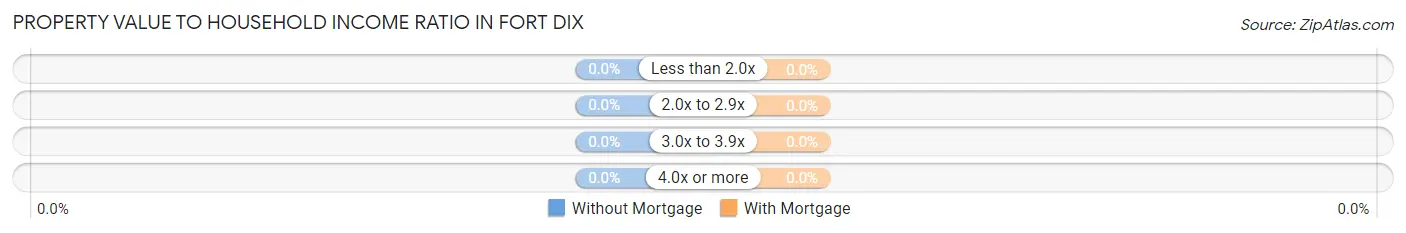
| Value-to-Income Ratio | Without Mortgage | With Mortgage |
| Less than 2.0x | 0 (0.0%) | 0 (0.0%) |
| 2.0x to 2.9x | 0 (0.0%) | 0 (0.0%) |
| 3.0x to 3.9x | 0 (0.0%) | 0 (0.0%) |
| 4.0x or more | 0 (0.0%) | 0 (0.0%) |
| Total | 0 (0.0%) | 2 (100.0%) |
Real Estate Taxes by Mortgage Status in Fort Dix
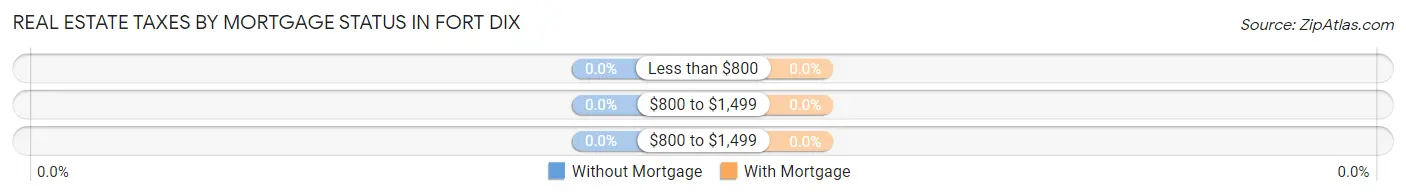
| Property Taxes | Without Mortgage | With Mortgage |
| Less than $800 | 0 (0.0%) | 0 (0.0%) |
| $800 to $1,499 | 0 (0.0%) | 0 (0.0%) |
| $800 to $1,499 | 0 (0.0%) | 0 (0.0%) |
| Total | 0 (0.0%) | 2 (100.0%) |
Health & Disability in Fort Dix
Health Insurance Coverage by Age in Fort Dix
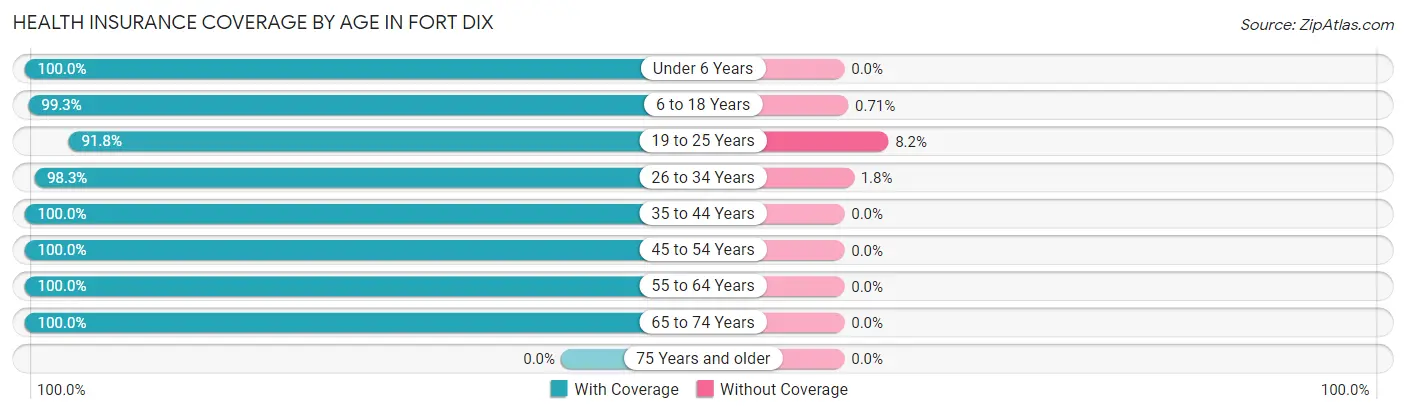
| Age Bracket | With Coverage | Without Coverage |
| Under 6 Years | 344 (100.0%) | 0 (0.0%) |
| 6 to 18 Years | 835 (99.3%) | 6 (0.7%) |
| 19 to 25 Years | 157 (91.8%) | 14 (8.2%) |
| 26 to 34 Years | 280 (98.3%) | 5 (1.8%) |
| 35 to 44 Years | 248 (100.0%) | 0 (0.0%) |
| 45 to 54 Years | 79 (100.0%) | 0 (0.0%) |
| 55 to 64 Years | 5 (100.0%) | 0 (0.0%) |
| 65 to 74 Years | 9 (100.0%) | 0 (0.0%) |
| 75 Years and older | 0 (0.0%) | 0 (0.0%) |
| Total | 1,957 (98.7%) | 25 (1.3%) |
Health Insurance Coverage by Citizenship Status in Fort Dix
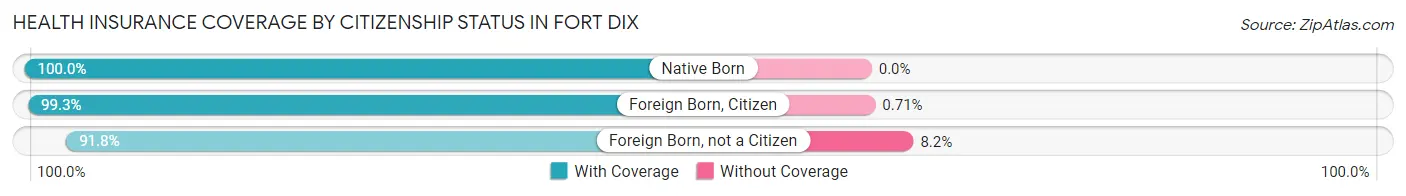
| Citizenship Status | With Coverage | Without Coverage |
| Native Born | 344 (100.0%) | 0 (0.0%) |
| Foreign Born, Citizen | 835 (99.3%) | 6 (0.7%) |
| Foreign Born, not a Citizen | 157 (91.8%) | 14 (8.2%) |
Health Insurance Coverage by Household Income in Fort Dix
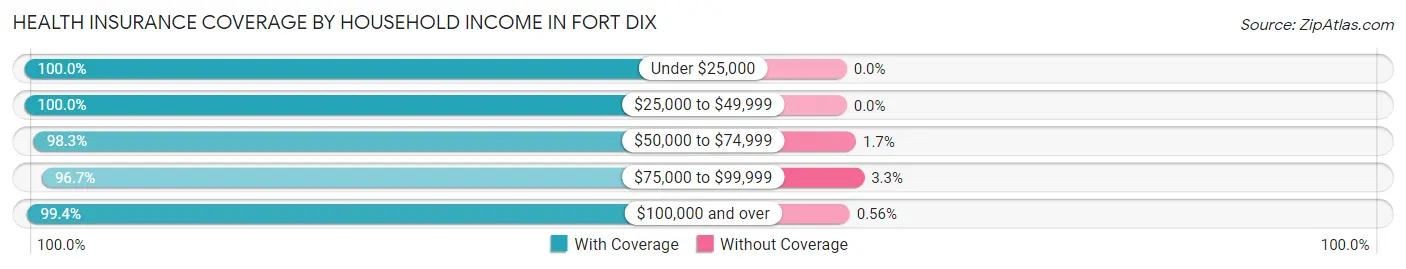
| Household Income | With Coverage | Without Coverage |
| Under $25,000 | 68 (100.0%) | 0 (0.0%) |
| $25,000 to $49,999 | 227 (100.0%) | 0 (0.0%) |
| $50,000 to $74,999 | 341 (98.3%) | 6 (1.7%) |
| $75,000 to $99,999 | 416 (96.7%) | 14 (3.3%) |
| $100,000 and over | 893 (99.4%) | 5 (0.6%) |
Public vs Private Health Insurance Coverage by Age in Fort Dix
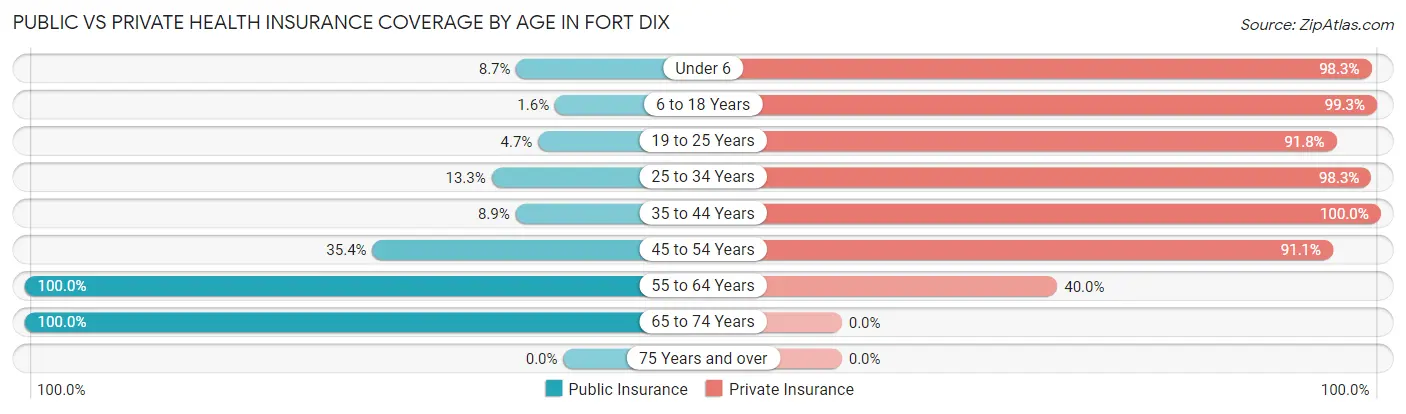
| Age Bracket | Public Insurance | Private Insurance |
| Under 6 | 30 (8.7%) | 338 (98.3%) |
| 6 to 18 Years | 13 (1.5%) | 835 (99.3%) |
| 19 to 25 Years | 8 (4.7%) | 157 (91.8%) |
| 25 to 34 Years | 38 (13.3%) | 280 (98.3%) |
| 35 to 44 Years | 22 (8.9%) | 248 (100.0%) |
| 45 to 54 Years | 28 (35.4%) | 72 (91.1%) |
| 55 to 64 Years | 5 (100.0%) | 2 (40.0%) |
| 65 to 74 Years | 9 (100.0%) | 0 (0.0%) |
| 75 Years and over | 0 (0.0%) | 0 (0.0%) |
| Total | 153 (7.7%) | 1,932 (97.5%) |
Disability Status by Sex by Age in Fort Dix
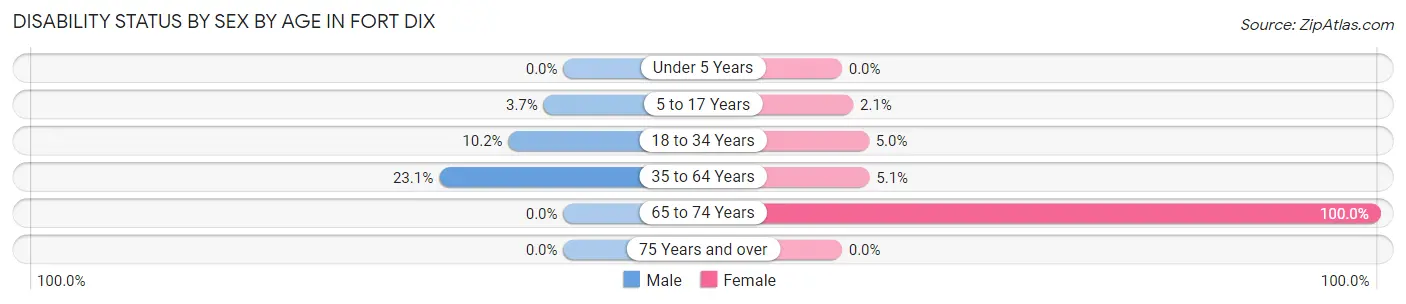
| Age Bracket | Male | Female |
| Under 5 Years | 0 (0.0%) | 0 (0.0%) |
| 5 to 17 Years | 21 (3.7%) | 7 (2.1%) |
| 18 to 34 Years | 10 (10.2%) | 18 (5.0%) |
| 35 to 64 Years | 18 (23.1%) | 13 (5.1%) |
| 65 to 74 Years | 0 (0.0%) | 9 (100.0%) |
| 75 Years and over | 0 (0.0%) | 0 (0.0%) |
Disability Class by Sex by Age in Fort Dix
Disability Class: Hearing Difficulty
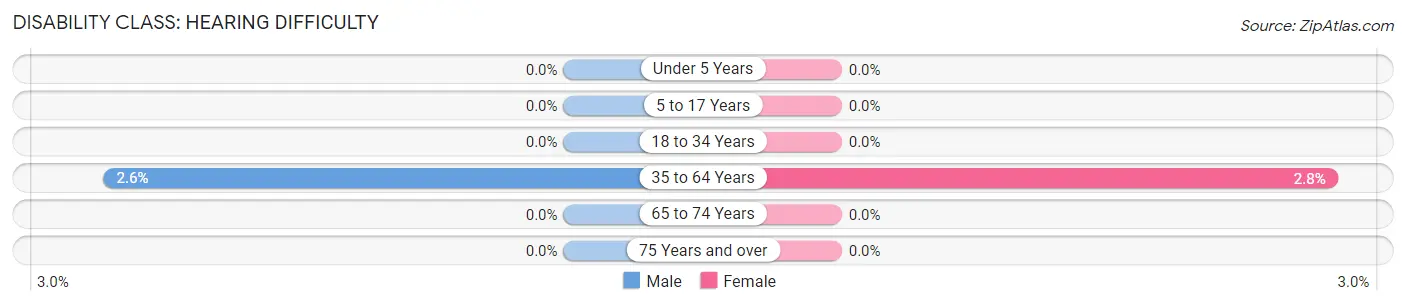
| Age Bracket | Male | Female |
| Under 5 Years | 0 (0.0%) | 0 (0.0%) |
| 5 to 17 Years | 0 (0.0%) | 0 (0.0%) |
| 18 to 34 Years | 0 (0.0%) | 0 (0.0%) |
| 35 to 64 Years | 2 (2.6%) | 7 (2.8%) |
| 65 to 74 Years | 0 (0.0%) | 0 (0.0%) |
| 75 Years and over | 0 (0.0%) | 0 (0.0%) |
Disability Class: Vision Difficulty
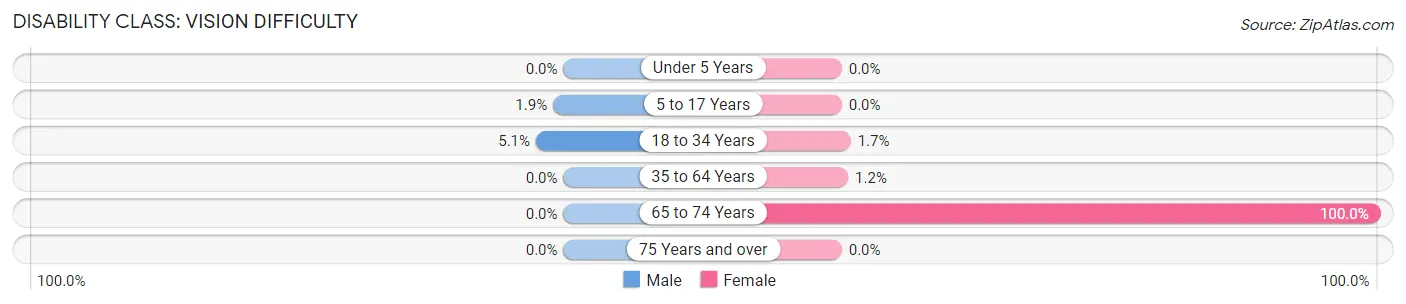
| Age Bracket | Male | Female |
| Under 5 Years | 0 (0.0%) | 0 (0.0%) |
| 5 to 17 Years | 11 (1.9%) | 0 (0.0%) |
| 18 to 34 Years | 5 (5.1%) | 6 (1.7%) |
| 35 to 64 Years | 0 (0.0%) | 3 (1.2%) |
| 65 to 74 Years | 0 (0.0%) | 9 (100.0%) |
| 75 Years and over | 0 (0.0%) | 0 (0.0%) |
Disability Class: Cognitive Difficulty
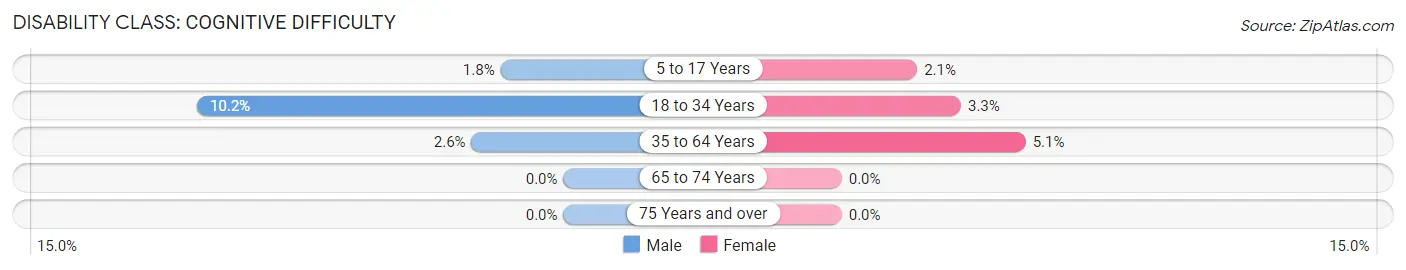
| Age Bracket | Male | Female |
| 5 to 17 Years | 10 (1.8%) | 7 (2.1%) |
| 18 to 34 Years | 10 (10.2%) | 12 (3.3%) |
| 35 to 64 Years | 2 (2.6%) | 13 (5.1%) |
| 65 to 74 Years | 0 (0.0%) | 0 (0.0%) |
| 75 Years and over | 0 (0.0%) | 0 (0.0%) |
Disability Class: Ambulatory Difficulty
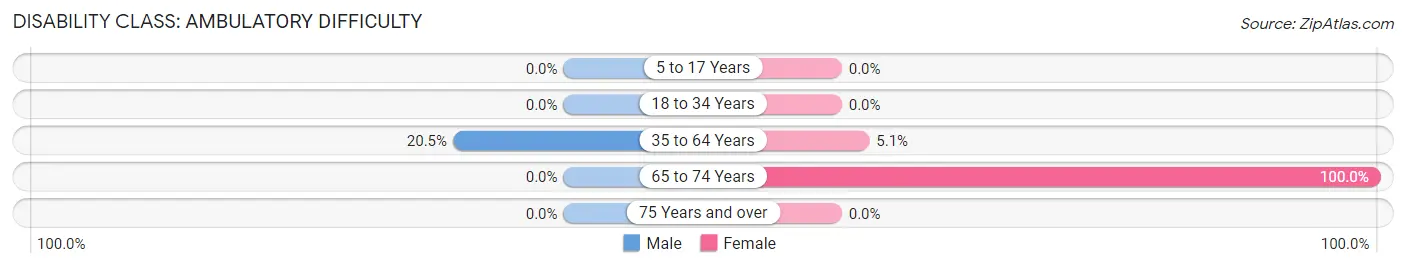
| Age Bracket | Male | Female |
| 5 to 17 Years | 0 (0.0%) | 0 (0.0%) |
| 18 to 34 Years | 0 (0.0%) | 0 (0.0%) |
| 35 to 64 Years | 16 (20.5%) | 13 (5.1%) |
| 65 to 74 Years | 0 (0.0%) | 9 (100.0%) |
| 75 Years and over | 0 (0.0%) | 0 (0.0%) |
Disability Class: Self-Care Difficulty
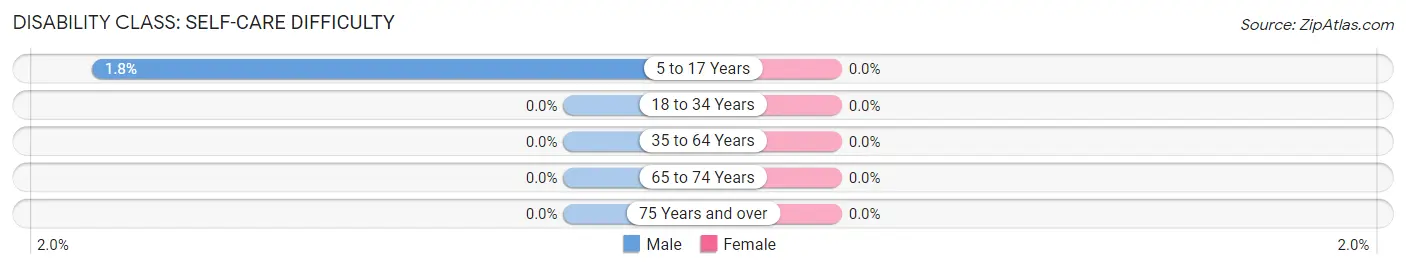
| Age Bracket | Male | Female |
| 5 to 17 Years | 10 (1.8%) | 0 (0.0%) |
| 18 to 34 Years | 0 (0.0%) | 0 (0.0%) |
| 35 to 64 Years | 0 (0.0%) | 0 (0.0%) |
| 65 to 74 Years | 0 (0.0%) | 0 (0.0%) |
| 75 Years and over | 0 (0.0%) | 0 (0.0%) |
Technology Access in Fort Dix
Computing Device Access in Fort Dix
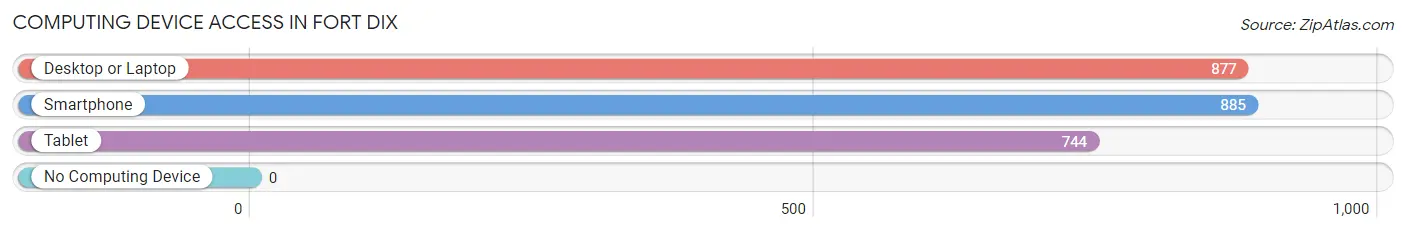
| Device Type | # Households | % Households |
| Desktop or Laptop | 877 | 98.4% |
| Smartphone | 885 | 99.3% |
| Tablet | 744 | 83.5% |
| No Computing Device | 0 | 0.0% |
| Total | 891 | 100.0% |
Internet Access in Fort Dix
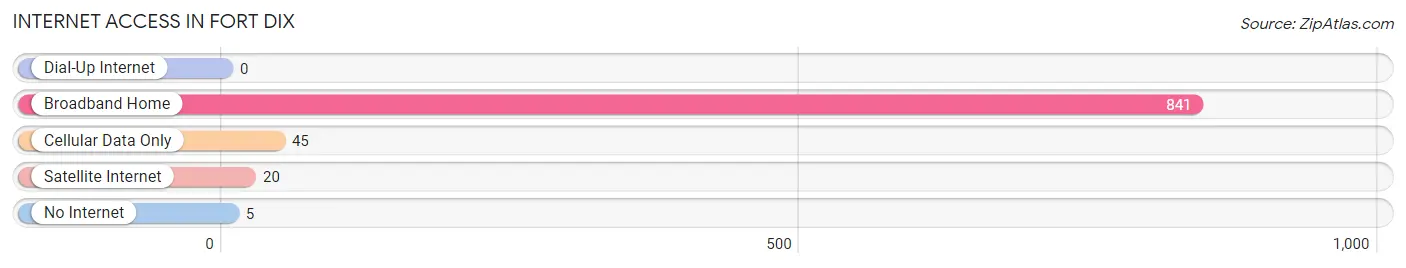
| Internet Type | # Households | % Households |
| Dial-Up Internet | 0 | 0.0% |
| Broadband Home | 841 | 94.4% |
| Cellular Data Only | 45 | 5.1% |
| Satellite Internet | 20 | 2.2% |
| No Internet | 5 | 0.6% |
| Total | 891 | 100.0% |
Fort Dix Summary
Fort Dix is a United States Army installation located in Burlington County, New Jersey. It is located approximately 16 miles southeast of Trenton and is part of Joint Base McGuire-Dix-Lakehurst, the largest military base in the state. The base is home to the 87th Air Base Wing, which provides support to the Air Force, Army, Navy, and Marine Corps.
History
Fort Dix was established in 1917 as Camp Dix, a training camp for World War I soldiers. The camp was named after Major General John Adams Dix, a veteran of the War of 1812 and the Civil War. In 1939, the camp was renamed Fort Dix and was used to train soldiers for World War II. During the Cold War, the base was used to train troops for the Korean War and Vietnam War. In the late 1980s, the base was used to house Haitian refugees. In the 1990s, the base was used to house Cuban refugees.
In 2009, Fort Dix was merged with two other military bases in the area, McGuire Air Force Base and Lakehurst Naval Air Station, to form Joint Base McGuire-Dix-Lakehurst. The base is now home to the 87th Air Base Wing, which provides support to the Air Force, Army, Navy, and Marine Corps.
Geography
Fort Dix is located in Burlington County, New Jersey, approximately 16 miles southeast of Trenton. The base is situated on approximately 16,000 acres of land and is bordered by the towns of Pemberton, Wrightstown, and New Hanover. The base is located near the Delaware River and is approximately 40 miles from Philadelphia and 90 miles from New York City.
Economy
Fort Dix is a major economic driver for the region. The base is home to more than 10,000 military personnel and civilian employees, and has an annual economic impact of more than $2 billion. The base is also home to a variety of businesses, including a shopping center, a movie theater, a bowling alley, and a golf course.
Demographics
As of 2019, the population of Fort Dix was estimated to be 10,845. The racial makeup of the base was 79.3% White, 8.2% African American, 5.2% Hispanic or Latino, 3.2% Asian, and 4.1% other. The median household income was $50,945, and the median age was 33.7 years. The base is home to a variety of religious denominations, including Protestant, Catholic, Jewish, and Muslim.
Common Questions
What is Per Capita Income in Fort Dix?
Per Capita income in Fort Dix is $16,726.
What is the Median Family Income in Fort Dix?
Median Family Income in Fort Dix is $97,639.
What is the Median Household income in Fort Dix?
Median Household Income in Fort Dix is $91,250.
What is Income or Wage Gap in Fort Dix?
Income or Wage Gap in Fort Dix is 5.8%.
Women in Fort Dix earn 94.2 cents for every dollar earned by a man.
What is Inequality or Gini Index in Fort Dix?
Inequality or Gini Index in Fort Dix is 0.27.
What is the Total Population of Fort Dix?
Total Population of Fort Dix is 7,781.
What is the Total Male Population of Fort Dix?
Total Male Population of Fort Dix is 6,506.
What is the Total Female Population of Fort Dix?
Total Female Population of Fort Dix is 1,275.
What is the Ratio of Males per 100 Females in Fort Dix?
There are 510.27 Males per 100 Females in Fort Dix.
What is the Ratio of Females per 100 Males in Fort Dix?
There are 19.60 Females per 100 Males in Fort Dix.
What is the Median Population Age in Fort Dix?
Median Population Age in Fort Dix is 34.7 Years.
What is the Average Family Size in Fort Dix
Average Family Size in Fort Dix is 3.6 People.
What is the Average Household Size in Fort Dix
Average Household Size in Fort Dix is 3.2 People.
How Large is the Labor Force in Fort Dix?
There are 1,837 People in the Labor Forcein in Fort Dix.
What is the Percentage of People in the Labor Force in Fort Dix?
27.7% of People are in the Labor Force in Fort Dix.
What is the Unemployment Rate in Fort Dix?
Unemployment Rate in Fort Dix is 7.0%.