Delaware, NJ Map & Demographics
Delaware Map
Delaware Overview
$51,534
PER CAPITA INCOME
$142,656
AVG FAMILY INCOME
$56,875
AVG HOUSEHOLD INCOME
0.40
INEQUALITY / GINI INDEX
125
TOTAL POPULATION
74
MALE POPULATION
51
FEMALE POPULATION
145.10
MALES / 100 FEMALES
68.92
FEMALES / 100 MALES
40.9
MEDIAN AGE
2.0
AVG FAMILY SIZE
1.8
AVG HOUSEHOLD SIZE
76
LABOR FORCE [ PEOPLE ]
65.5%
PERCENT IN LABOR FORCE
26.3%
UNEMPLOYMENT RATE
Delaware Zip Codes
Delaware Area Codes
Income in Delaware
Income Overview in Delaware
Per Capita Income in Delaware is $51,534, while median incomes of families and households are $142,656 and $56,875 respectively.
| Characteristic | Number | Measure |
| Per Capita Income | 125 | $51,534 |
| Median Family Income | 27 | $142,656 |
| Mean Family Income | 27 | $140,074 |
| Median Household Income | 61 | $56,875 |
| Mean Household Income | 61 | $105,726 |
| Income Deficit | 27 | $0 |
| Wage / Income Gap (%) | 125 | 0.00% |
| Wage / Income Gap ($) | 125 | 100.00¢ per $1 |
| Gini / Inequality Index | 125 | 0.40 |
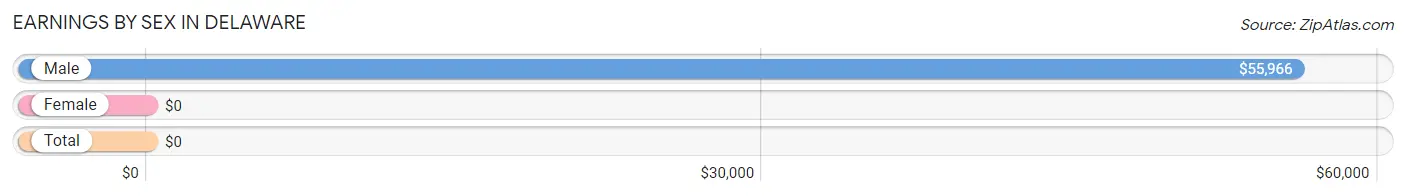
Earnings by Sex in Delaware
| Sex | Number | Average Earnings |
| Male | 51 (70.8%) | $55,966 |
| Female | 21 (29.2%) | $0 |
| Total | 72 (100.0%) | $0 |
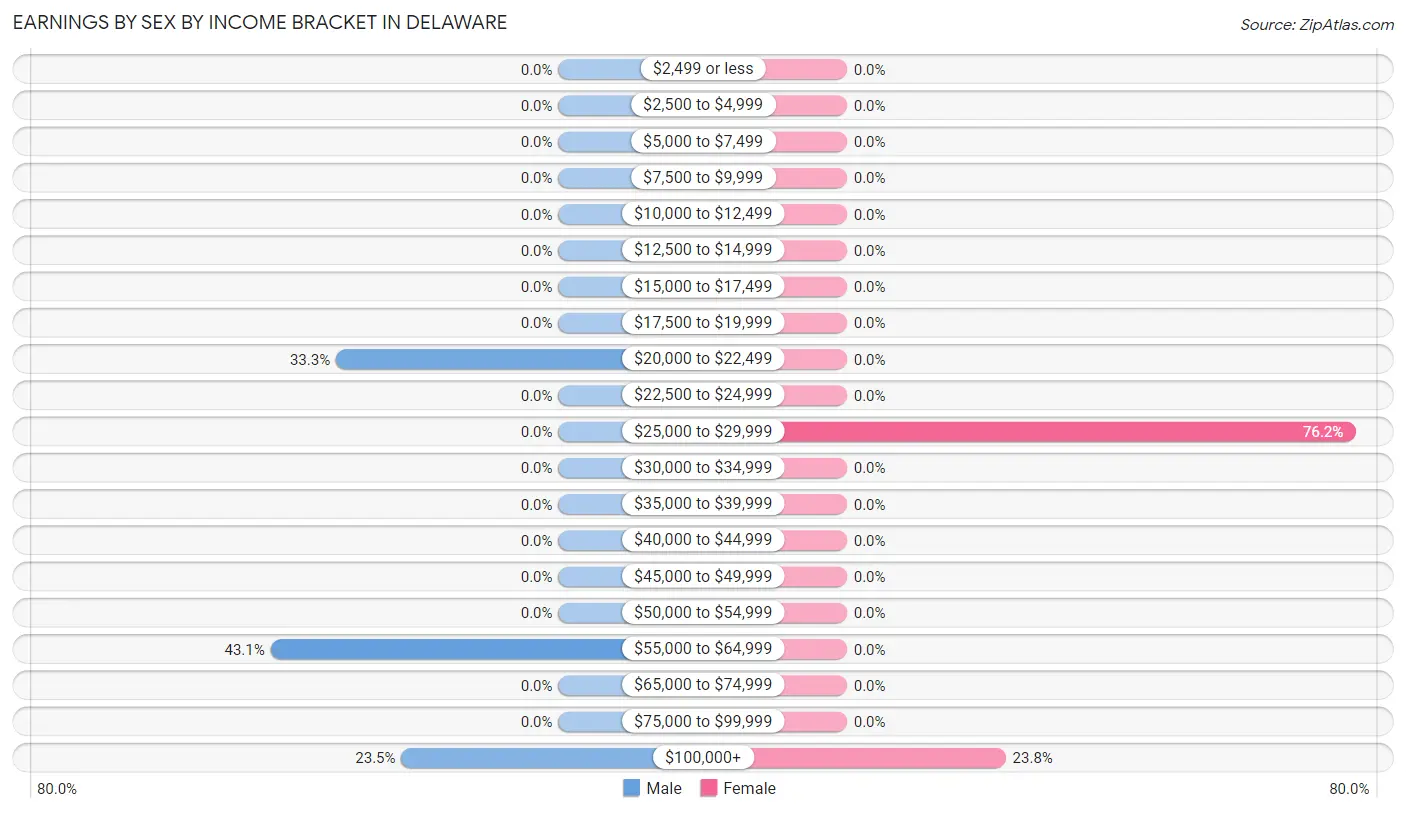
Earnings by Sex by Income Bracket in Delaware
The most common earnings brackets in Delaware are $55,000 to $64,999 for men (22 | 43.1%) and $25,000 to $29,999 for women (16 | 76.2%).
| Income | Male | Female |
| $2,499 or less | 0 (0.0%) | 0 (0.0%) |
| $2,500 to $4,999 | 0 (0.0%) | 0 (0.0%) |
| $5,000 to $7,499 | 0 (0.0%) | 0 (0.0%) |
| $7,500 to $9,999 | 0 (0.0%) | 0 (0.0%) |
| $10,000 to $12,499 | 0 (0.0%) | 0 (0.0%) |
| $12,500 to $14,999 | 0 (0.0%) | 0 (0.0%) |
| $15,000 to $17,499 | 0 (0.0%) | 0 (0.0%) |
| $17,500 to $19,999 | 0 (0.0%) | 0 (0.0%) |
| $20,000 to $22,499 | 17 (33.3%) | 0 (0.0%) |
| $22,500 to $24,999 | 0 (0.0%) | 0 (0.0%) |
| $25,000 to $29,999 | 0 (0.0%) | 16 (76.2%) |
| $30,000 to $34,999 | 0 (0.0%) | 0 (0.0%) |
| $35,000 to $39,999 | 0 (0.0%) | 0 (0.0%) |
| $40,000 to $44,999 | 0 (0.0%) | 0 (0.0%) |
| $45,000 to $49,999 | 0 (0.0%) | 0 (0.0%) |
| $50,000 to $54,999 | 0 (0.0%) | 0 (0.0%) |
| $55,000 to $64,999 | 22 (43.1%) | 0 (0.0%) |
| $65,000 to $74,999 | 0 (0.0%) | 0 (0.0%) |
| $75,000 to $99,999 | 0 (0.0%) | 0 (0.0%) |
| $100,000+ | 12 (23.5%) | 5 (23.8%) |
| Total | 51 (100.0%) | 21 (100.0%) |
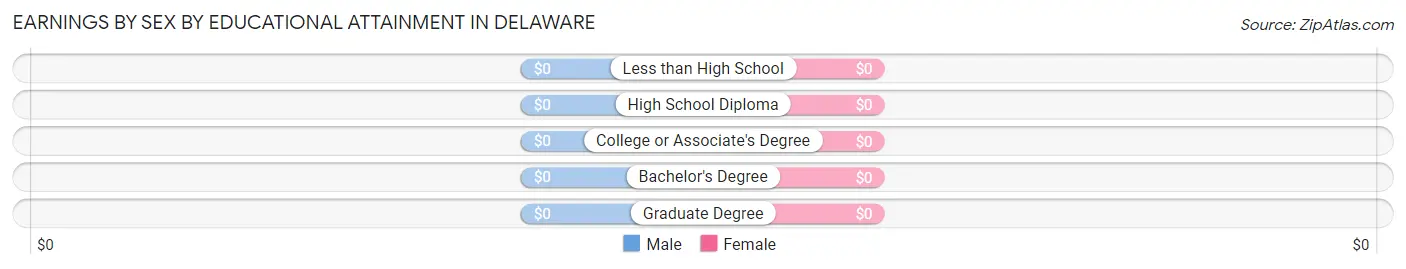
Earnings by Sex by Educational Attainment in Delaware
| Educational Attainment | Male Income | Female Income |
| Less than High School | - | - |
| High School Diploma | - | - |
| College or Associate's Degree | - | - |
| Bachelor's Degree | - | - |
| Graduate Degree | - | - |
| Total | $55,966 | $0 |
Family Income in Delaware
Family Income Brackets in Delaware
According to the Delaware family income data, there are 12 families falling into the $100,000 to $149,999 income range, which is the most common income bracket and makes up 44.4% of all families.
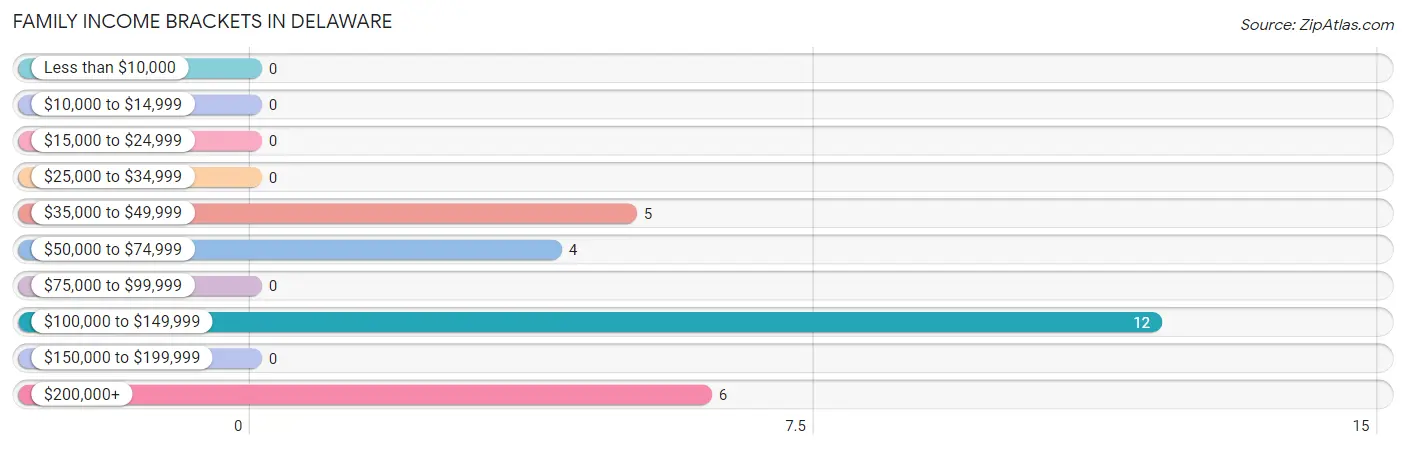
| Income Bracket | # Families | % Families |
| Less than $10,000 | 0 | 0.0% |
| $10,000 to $14,999 | 0 | 0.0% |
| $15,000 to $24,999 | 0 | 0.0% |
| $25,000 to $34,999 | 0 | 0.0% |
| $35,000 to $49,999 | 5 | 18.5% |
| $50,000 to $74,999 | 4 | 14.8% |
| $75,000 to $99,999 | 0 | 0.0% |
| $100,000 to $149,999 | 12 | 44.4% |
| $150,000 to $199,999 | 0 | 0.0% |
| $200,000+ | 6 | 22.2% |
Family Income by Famaliy Size in Delaware
2-person families (27 | 100.0%) account for the highest median family income in Delaware with $142,656 per family, while 2-person families (27 | 100.0%) have the highest median income of $71,328 per family member.
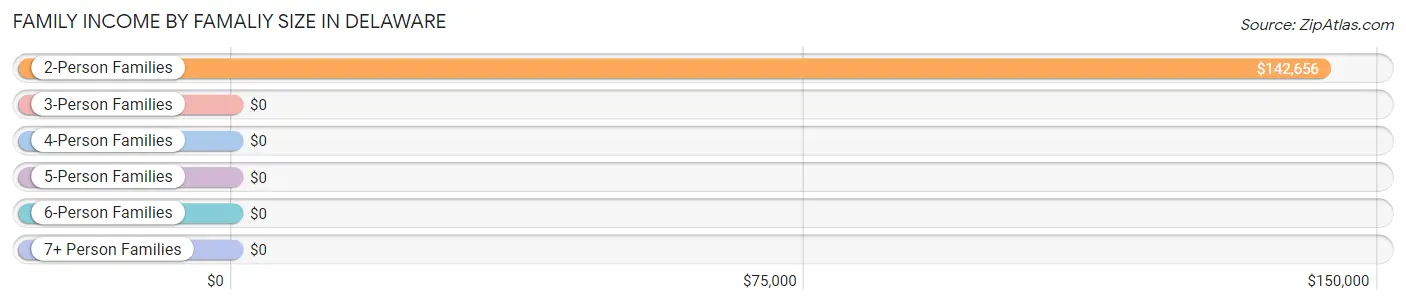
| Income Bracket | # Families | Median Income |
| 2-Person Families | 27 (100.0%) | $142,656 |
| 3-Person Families | 0 (0.0%) | $0 |
| 4-Person Families | 0 (0.0%) | $0 |
| 5-Person Families | 0 (0.0%) | $0 |
| 6-Person Families | 0 (0.0%) | $0 |
| 7+ Person Families | 0 (0.0%) | $0 |
| Total | 27 (100.0%) | $142,656 |
Family Income by Number of Earners in Delaware
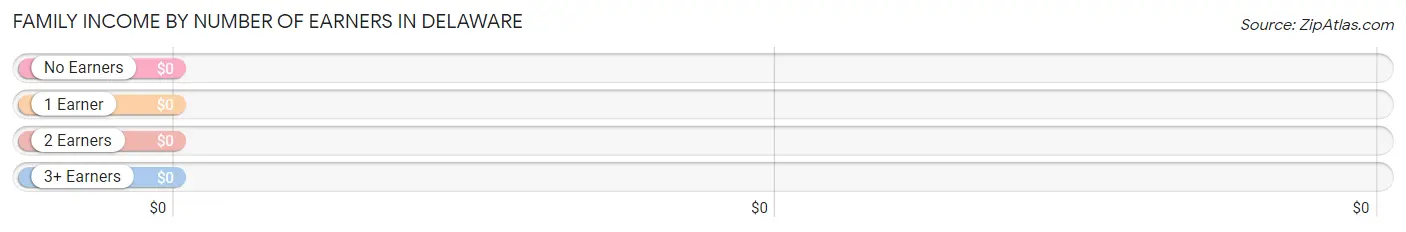
| Number of Earners | # Families | Median Income |
| No Earners | 17 (63.0%) | $0 |
| 1 Earner | 4 (14.8%) | $0 |
| 2 Earners | 6 (22.2%) | $0 |
| 3+ Earners | 0 (0.0%) | $0 |
| Total | 27 (100.0%) | $142,656 |
Household Income in Delaware
Household Income Brackets in Delaware
With 38 households falling in the category, the $50,000 to $74,999 income range is the most frequent in Delaware, accounting for 62.3% of all households.
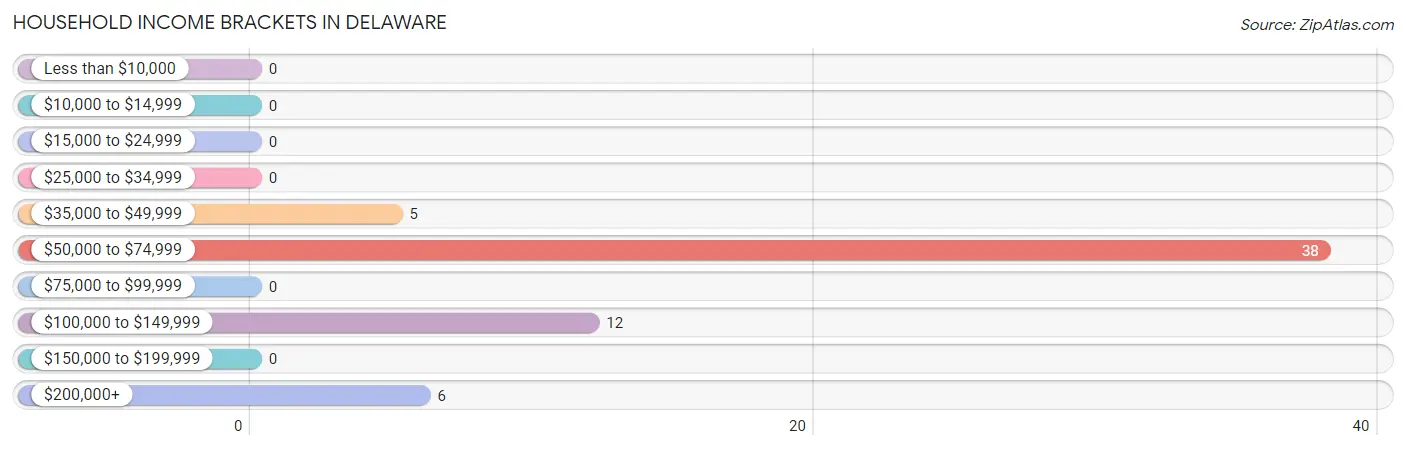
| Income Bracket | # Households | % Households |
| Less than $10,000 | 0 | 0.0% |
| $10,000 to $14,999 | 0 | 0.0% |
| $15,000 to $24,999 | 0 | 0.0% |
| $25,000 to $34,999 | 0 | 0.0% |
| $35,000 to $49,999 | 5 | 8.2% |
| $50,000 to $74,999 | 38 | 62.3% |
| $75,000 to $99,999 | 0 | 0.0% |
| $100,000 to $149,999 | 12 | 19.7% |
| $150,000 to $199,999 | 0 | 0.0% |
| $200,000+ | 6 | 9.8% |
Household Income by Householder Age in Delaware
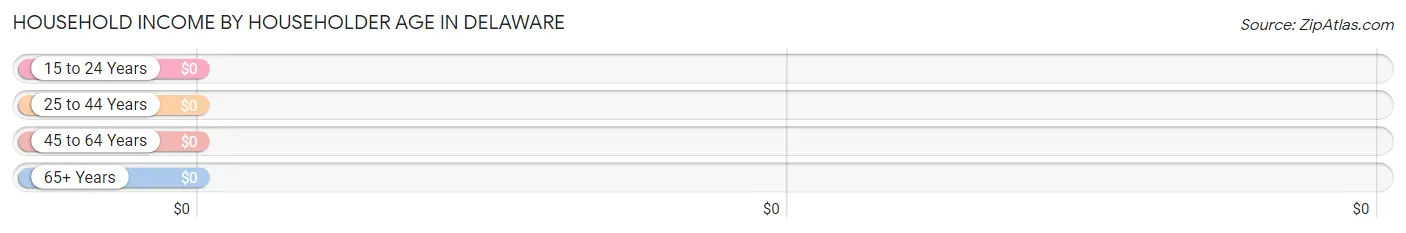
| Income Bracket | # Households | Median Income |
| 15 to 24 Years | 0 (0.0%) | $0 |
| 25 to 44 Years | 34 (55.7%) | $0 |
| 45 to 64 Years | 6 (9.8%) | $0 |
| 65+ Years | 21 (34.4%) | $0 |
| Total | 61 (100.0%) | $56,875 |
Poverty in Delaware
Income Below Poverty by Sex and Age in Delaware
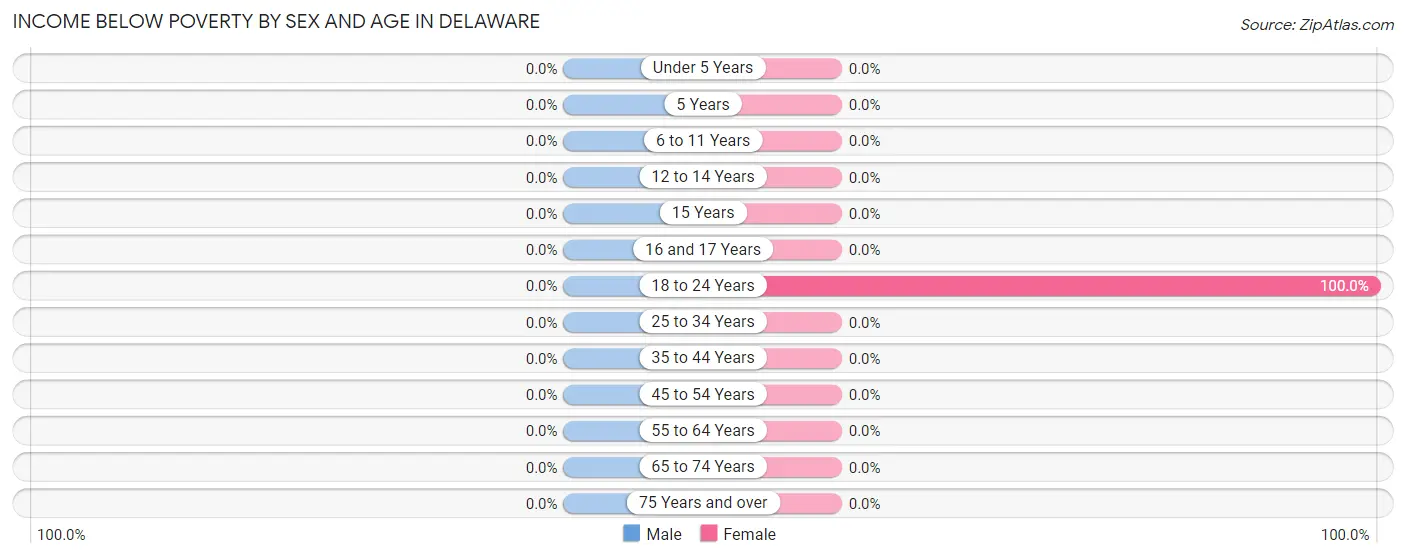
| Age Bracket | Male | Female |
| Under 5 Years | 0 (0.0%) | 0 (0.0%) |
| 5 Years | 0 (0.0%) | 0 (0.0%) |
| 6 to 11 Years | 0 (0.0%) | 0 (0.0%) |
| 12 to 14 Years | 0 (0.0%) | 0 (0.0%) |
| 15 Years | 0 (0.0%) | 0 (0.0%) |
| 16 and 17 Years | 0 (0.0%) | 0 (0.0%) |
| 18 to 24 Years | 0 (0.0%) | 4 (100.0%) |
| 25 to 34 Years | 0 (0.0%) | 0 (0.0%) |
| 35 to 44 Years | 0 (0.0%) | 0 (0.0%) |
| 45 to 54 Years | 0 (0.0%) | 0 (0.0%) |
| 55 to 64 Years | 0 (0.0%) | 0 (0.0%) |
| 65 to 74 Years | 0 (0.0%) | 0 (0.0%) |
| 75 Years and over | 0 (0.0%) | 0 (0.0%) |
| Total | 0 (0.0%) | 4 (8.7%) |
Income Above Poverty by Sex and Age in Delaware
According to the poverty statistics in Delaware, males aged 25 to 34 years and females aged 35 to 44 years are the age groups that are most secure financially, with 100.0% of males and 100.0% of females in these age groups living above the poverty line.
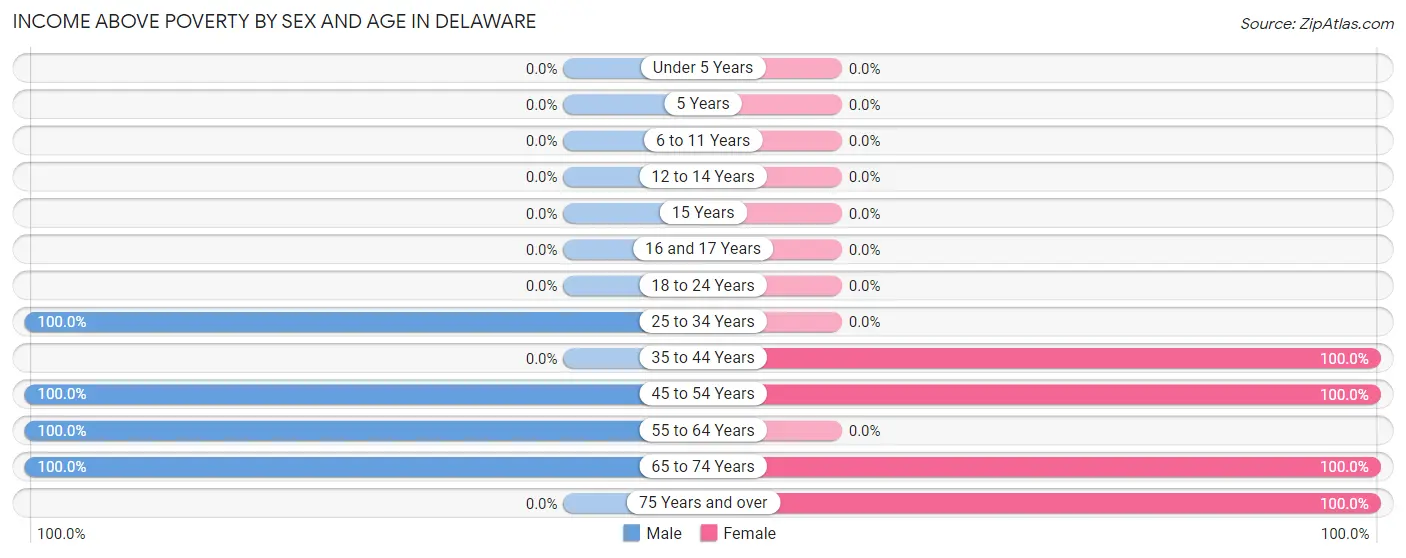
| Age Bracket | Male | Female |
| Under 5 Years | 0 (0.0%) | 0 (0.0%) |
| 5 Years | 0 (0.0%) | 0 (0.0%) |
| 6 to 11 Years | 0 (0.0%) | 0 (0.0%) |
| 12 to 14 Years | 0 (0.0%) | 0 (0.0%) |
| 15 Years | 0 (0.0%) | 0 (0.0%) |
| 16 and 17 Years | 0 (0.0%) | 0 (0.0%) |
| 18 to 24 Years | 0 (0.0%) | 0 (0.0%) |
| 25 to 34 Years | 35 (100.0%) | 0 (0.0%) |
| 35 to 44 Years | 0 (0.0%) | 16 (100.0%) |
| 45 to 54 Years | 12 (100.0%) | 5 (100.0%) |
| 55 to 64 Years | 6 (100.0%) | 0 (0.0%) |
| 65 to 74 Years | 17 (100.0%) | 16 (100.0%) |
| 75 Years and over | 0 (0.0%) | 5 (100.0%) |
| Total | 70 (100.0%) | 42 (91.3%) |
Income Below Poverty Among Married-Couple Families in Delaware
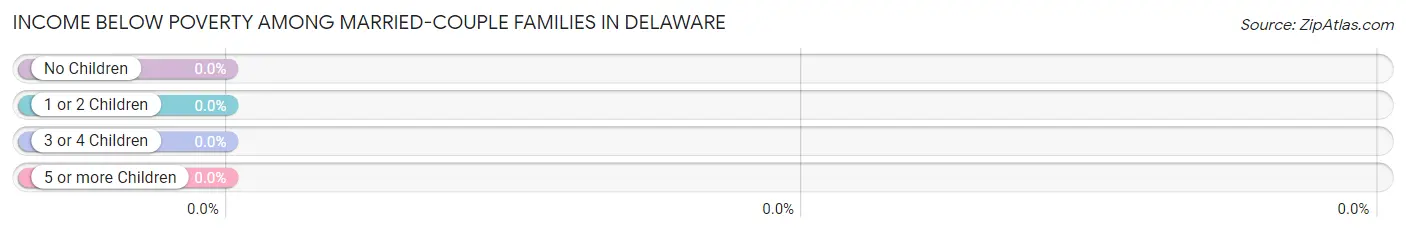
| Children | Above Poverty | Below Poverty |
| No Children | 22 (100.0%) | 0 (0.0%) |
| 1 or 2 Children | 0 (0.0%) | 0 (0.0%) |
| 3 or 4 Children | 0 (0.0%) | 0 (0.0%) |
| 5 or more Children | 0 (0.0%) | 0 (0.0%) |
| Total | 22 (100.0%) | 0 (0.0%) |
Income Below Poverty Among Single-Parent Households in Delaware
| Children | Single Father | Single Mother |
| No Children | 0 (0.0%) | 0 (0.0%) |
| 1 or 2 Children | 0 (0.0%) | 0 (0.0%) |
| 3 or 4 Children | 0 (0.0%) | 0 (0.0%) |
| 5 or more Children | 0 (0.0%) | 0 (0.0%) |
| Total | 0 (0.0%) | 0 (0.0%) |
Income Below Poverty Among Married-Couple vs Single-Parent Households in Delaware
| Children | Married-Couple Families | Single-Parent Households |
| No Children | 0 (0.0%) | 0 (0.0%) |
| 1 or 2 Children | 0 (0.0%) | 0 (0.0%) |
| 3 or 4 Children | 0 (0.0%) | 0 (0.0%) |
| 5 or more Children | 0 (0.0%) | 0 (0.0%) |
| Total | 0 (0.0%) | 0 (0.0%) |
Race in Delaware
The most populous races in Delaware are White / Caucasian (112 | 89.6%), and Black / African American (13 | 10.4%).
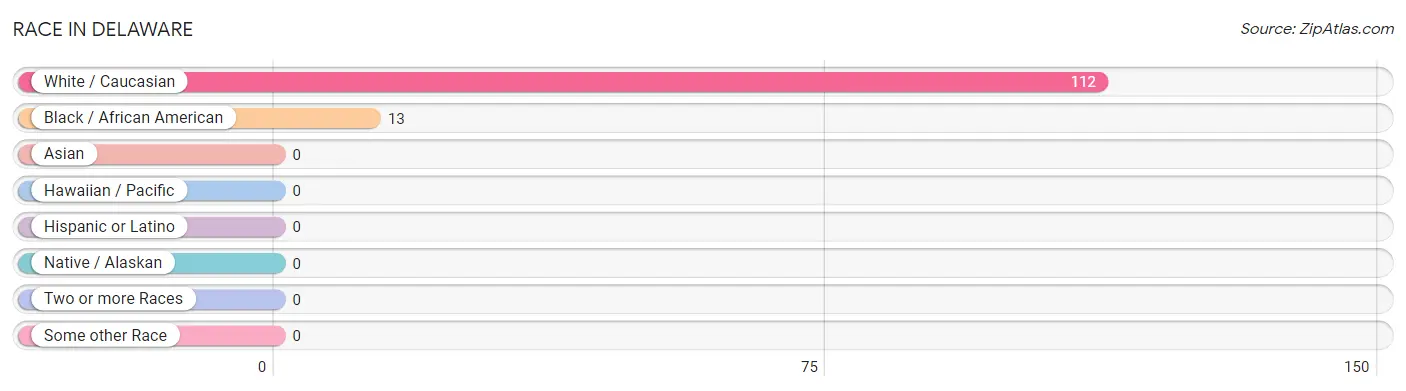
| Race | # Population | % Population |
| Asian | 0 | 0.0% |
| Black / African American | 13 | 10.4% |
| Hawaiian / Pacific | 0 | 0.0% |
| Hispanic or Latino | 0 | 0.0% |
| Native / Alaskan | 0 | 0.0% |
| White / Caucasian | 112 | 89.6% |
| Two or more Races | 0 | 0.0% |
| Some other Race | 0 | 0.0% |
| Total | 125 | 100.0% |
Ancestry in Delaware
The most populous ancestries reported in Delaware are German (33 | 26.4%), Dutch (24 | 19.2%), American (11 | 8.8%), Hungarian (8 | 6.4%), and Irish (8 | 6.4%), together accounting for 67.2% of all Delaware residents.
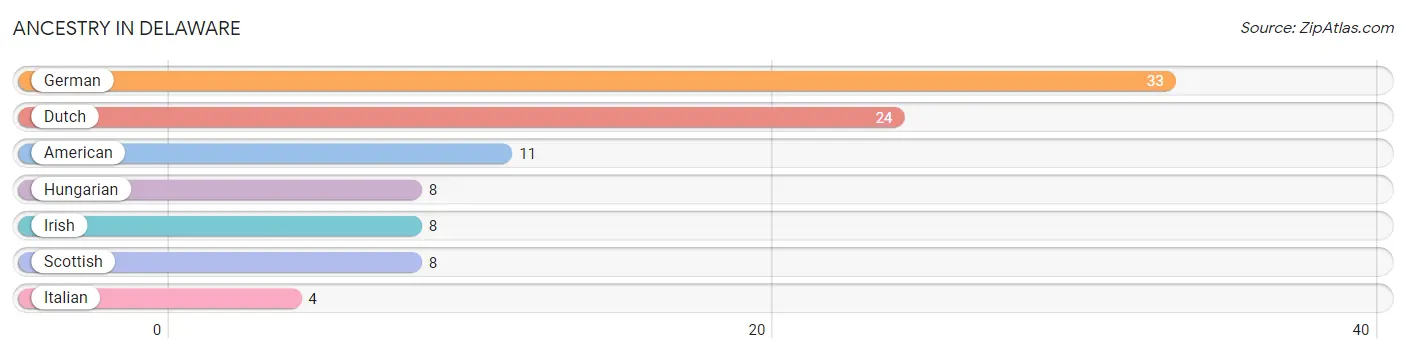
| Ancestry | # Population | % Population |
| American | 11 | 8.8% |
| Dutch | 24 | 19.2% |
| German | 33 | 26.4% |
| Hungarian | 8 | 6.4% |
| Irish | 8 | 6.4% |
| Italian | 4 | 3.2% |
| Scottish | 8 | 6.4% | View All 7 Rows |
Immigrants in Delaware

| Immigration Origin | # Population | % Population | View All 0 Rows |
Sex and Age in Delaware
Sex and Age in Delaware
The most populous age groups in Delaware are 30 to 34 Years (35 | 47.3%) for men and 40 to 44 Years (16 | 31.4%) for women.
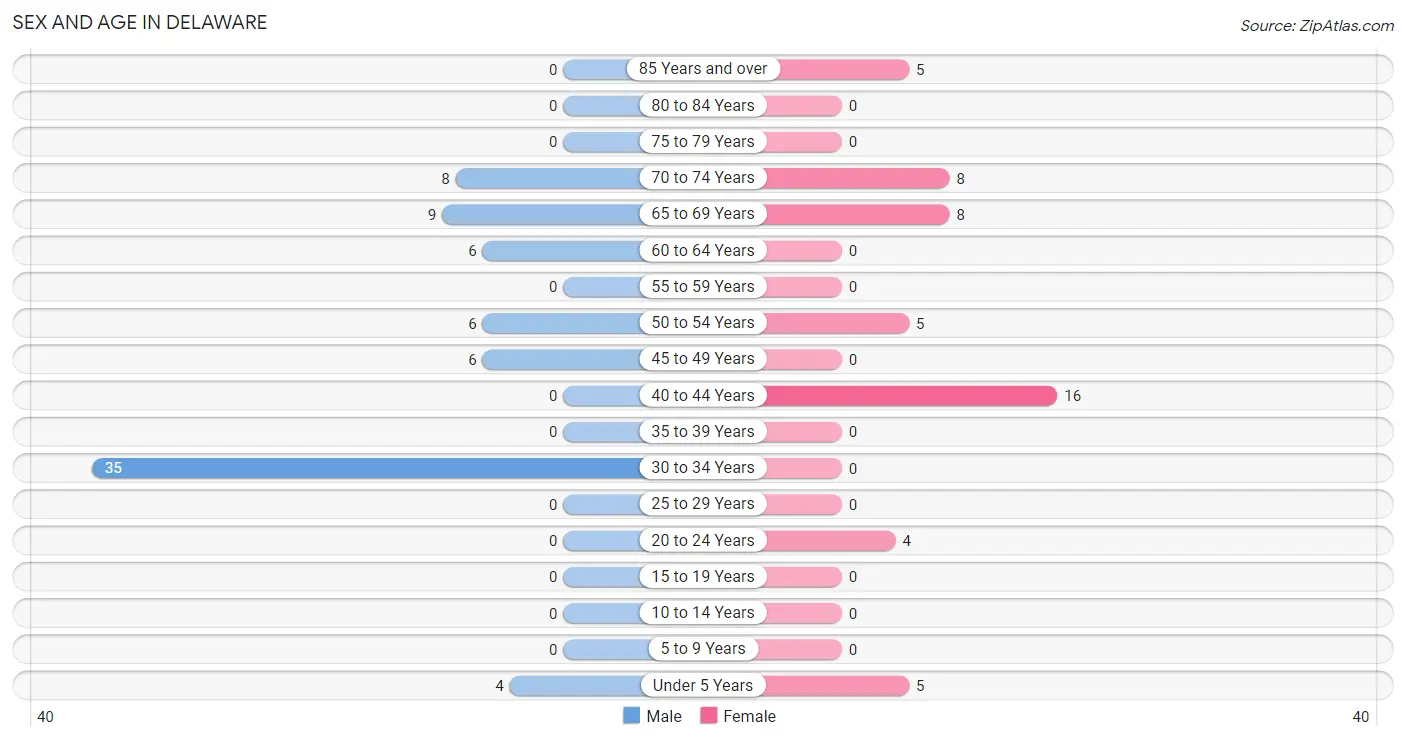
| Age Bracket | Male | Female |
| Under 5 Years | 4 (5.4%) | 5 (9.8%) |
| 5 to 9 Years | 0 (0.0%) | 0 (0.0%) |
| 10 to 14 Years | 0 (0.0%) | 0 (0.0%) |
| 15 to 19 Years | 0 (0.0%) | 0 (0.0%) |
| 20 to 24 Years | 0 (0.0%) | 4 (7.8%) |
| 25 to 29 Years | 0 (0.0%) | 0 (0.0%) |
| 30 to 34 Years | 35 (47.3%) | 0 (0.0%) |
| 35 to 39 Years | 0 (0.0%) | 0 (0.0%) |
| 40 to 44 Years | 0 (0.0%) | 16 (31.4%) |
| 45 to 49 Years | 6 (8.1%) | 0 (0.0%) |
| 50 to 54 Years | 6 (8.1%) | 5 (9.8%) |
| 55 to 59 Years | 0 (0.0%) | 0 (0.0%) |
| 60 to 64 Years | 6 (8.1%) | 0 (0.0%) |
| 65 to 69 Years | 9 (12.2%) | 8 (15.7%) |
| 70 to 74 Years | 8 (10.8%) | 8 (15.7%) |
| 75 to 79 Years | 0 (0.0%) | 0 (0.0%) |
| 80 to 84 Years | 0 (0.0%) | 0 (0.0%) |
| 85 Years and over | 0 (0.0%) | 5 (9.8%) |
| Total | 74 (100.0%) | 51 (100.0%) |
Families and Households in Delaware
Median Family Size in Delaware
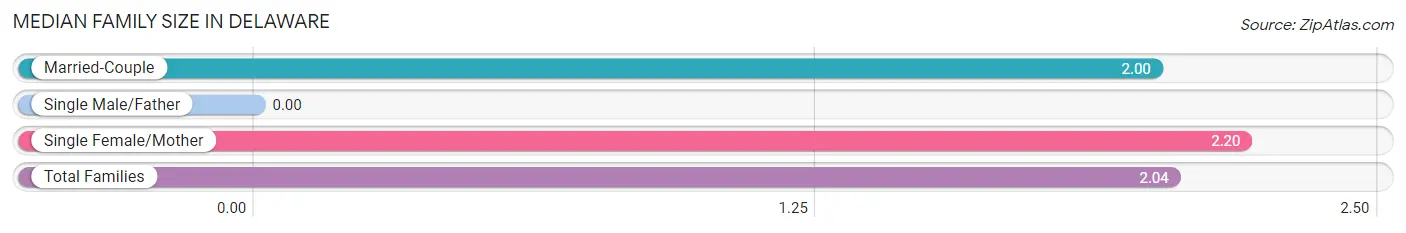
| Family Type | # Families | Family Size |
| Married-Couple | 22 (81.5%) | 2.00 |
| Single Male/Father | 0 (0.0%) | - |
| Single Female/Mother | 5 (18.5%) | 2.20 |
| Total Families | 27 (100.0%) | 2.04 |
Median Household Size in Delaware
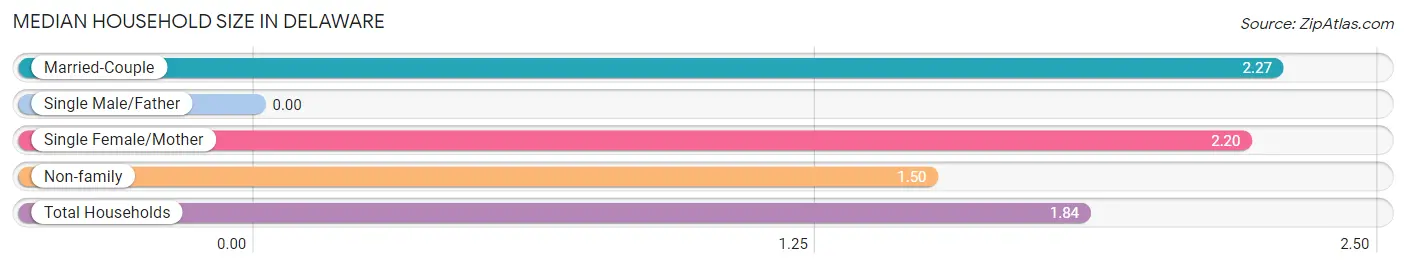
| Household Type | # Households | Household Size |
| Married-Couple | 22 (36.1%) | 2.27 |
| Single Male/Father | 0 (0.0%) | - |
| Single Female/Mother | 5 (8.2%) | 2.20 |
| Non-family | 34 (55.7%) | 1.50 |
| Total Households | 61 (100.0%) | 1.84 |
Household Size by Marriage Status in Delaware
Out of a total of 61 households in Delaware, 27 (44.3%) are family households, while 34 (55.7%) are nonfamily households. The most numerous type of family households are 2-person households, comprising 21, and the most common type of nonfamily households are 1-person households, comprising 18.
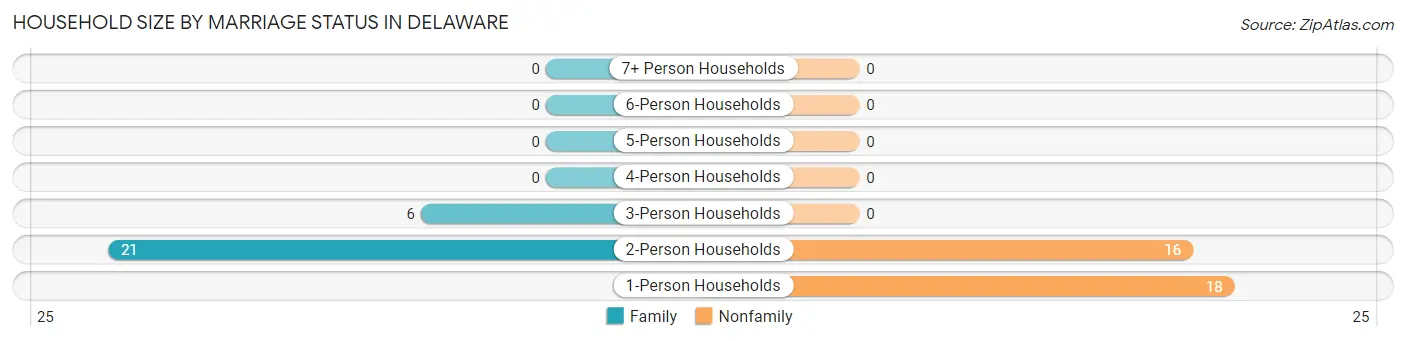
| Household Size | Family Households | Nonfamily Households |
| 1-Person Households | - | 18 (29.5%) |
| 2-Person Households | 21 (34.4%) | 16 (26.2%) |
| 3-Person Households | 6 (9.8%) | 0 (0.0%) |
| 4-Person Households | 0 (0.0%) | 0 (0.0%) |
| 5-Person Households | 0 (0.0%) | 0 (0.0%) |
| 6-Person Households | 0 (0.0%) | 0 (0.0%) |
| 7+ Person Households | 0 (0.0%) | 0 (0.0%) |
| Total | 27 (44.3%) | 34 (55.7%) |
Female Fertility in Delaware
Fertility by Age in Delaware
| Age Bracket | Women with Births | Births / 1,000 Women |
| 15 to 19 years | 0 (0.0%) | 0.0 |
| 20 to 34 years | 0 (0.0%) | 0.0 |
| 35 to 50 years | 0 (0.0%) | 0.0 |
| Total | 0 (0.0%) | 0.0 |
Fertility by Age by Marriage Status in Delaware
| Age Bracket | Married | Unmarried |
| 15 to 19 years | 0 (0.0%) | 0 (0.0%) |
| 20 to 34 years | 0 (0.0%) | 0 (0.0%) |
| 35 to 50 years | 0 (0.0%) | 0 (0.0%) |
| Total | 0 (0.0%) | 0 (0.0%) |
Fertility by Education in Delaware
| Educational Attainment | Women with Births | Births / 1,000 Women |
| Less than High School | 0 (0.0%) | 0.0 |
| High School Diploma | 0 (0.0%) | 0.0 |
| College or Associate's Degree | 0 (0.0%) | 0.0 |
| Bachelor's Degree | 0 (0.0%) | 0.0 |
| Graduate Degree | 0 (0.0%) | 0.0 |
| Total | 0 (0.0%) | 0.0 |
Fertility by Education by Marriage Status in Delaware
| Educational Attainment | Married | Unmarried |
| Less than High School | 0 (0.0%) | 0 (0.0%) |
| High School Diploma | 0 (0.0%) | 0 (0.0%) |
| College or Associate's Degree | 0 (0.0%) | 0 (0.0%) |
| Bachelor's Degree | 0 (0.0%) | 0 (0.0%) |
| Graduate Degree | 0 (0.0%) | 0 (0.0%) |
| Total | 0 (0.0%) | 0 (0.0%) |
Employment Characteristics in Delaware
Employment by Class of Employer in Delaware
Among the 56 employed individuals in Delaware, , and private company employees (56 | 100.0%) make up the most common classes of employment.
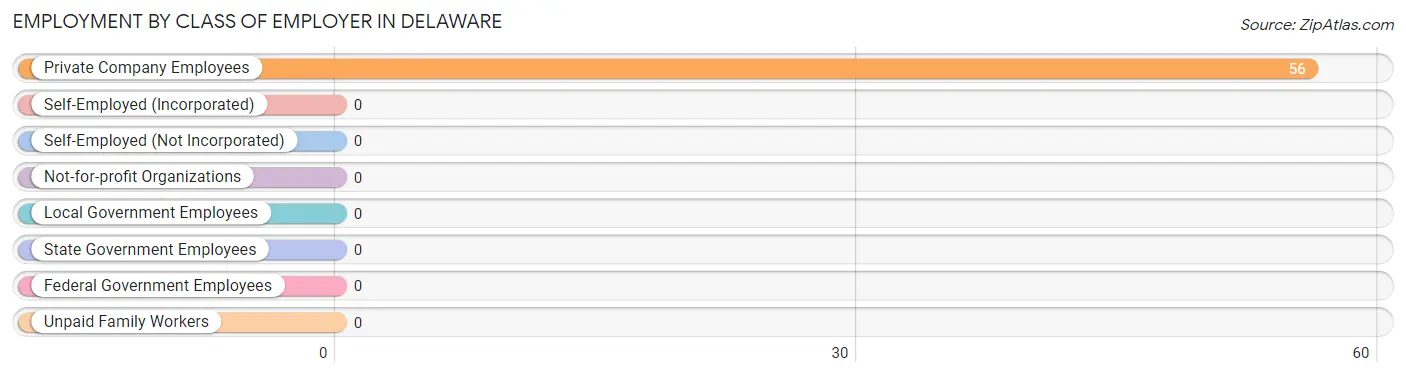
| Employer Class | # Employees | % Employees |
| Private Company Employees | 56 | 100.0% |
| Self-Employed (Incorporated) | 0 | 0.0% |
| Self-Employed (Not Incorporated) | 0 | 0.0% |
| Not-for-profit Organizations | 0 | 0.0% |
| Local Government Employees | 0 | 0.0% |
| State Government Employees | 0 | 0.0% |
| Federal Government Employees | 0 | 0.0% |
| Unpaid Family Workers | 0 | 0.0% |
| Total | 56 | 100.0% |
Employment Status by Age in Delaware
According to the labor force statistics for Delaware, out of the total population over 16 years of age (116), 65.5% or 76 individuals are in the labor force, with 26.3% or 20 of them unemployed. The age group with the highest labor force participation rate is 20 to 24 years, with 100.0% or 4 individuals in the labor force. Within the labor force, the 20 to 24 years age range has the highest percentage of unemployed individuals, with 100.0% or 4 of them being unemployed.
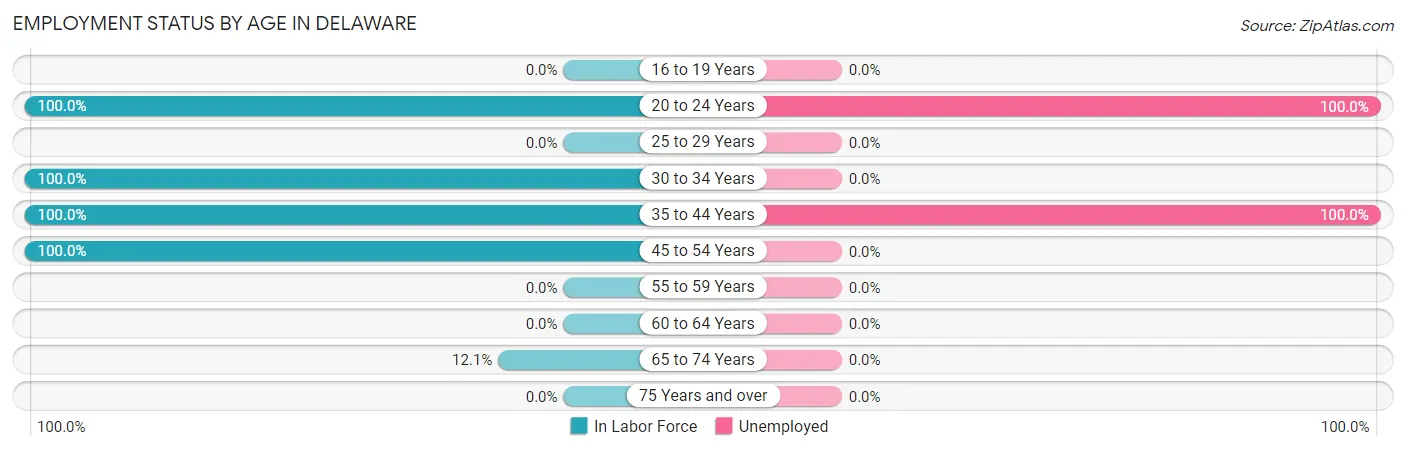
| Age Bracket | In Labor Force | Unemployed |
| 16 to 19 Years | 0 (0.0%) | 0 (0.0%) |
| 20 to 24 Years | 4 (100.0%) | 4 (100.0%) |
| 25 to 29 Years | 0 (0.0%) | 0 (0.0%) |
| 30 to 34 Years | 35 (100.0%) | 0 (0.0%) |
| 35 to 44 Years | 16 (100.0%) | 16 (100.0%) |
| 45 to 54 Years | 17 (100.0%) | 0 (0.0%) |
| 55 to 59 Years | 0 (0.0%) | 0 (0.0%) |
| 60 to 64 Years | 0 (0.0%) | 0 (0.0%) |
| 65 to 74 Years | 4 (12.1%) | 0 (0.0%) |
| 75 Years and over | 0 (0.0%) | 0 (0.0%) |
| Total | 76 (65.5%) | 20 (26.3%) |
Employment Status by Educational Attainment in Delaware
According to labor force statistics for Delaware, 91.9% of individuals (68) out of the total population between 25 and 64 years of age (74) are in the labor force, with 23.5% or 16 of them being unemployed. The group with the highest labor force participation rate are those with the educational attainment of college / associate degree, with 100.0% or 38 individuals in the labor force. Within the labor force, individuals with college / associate degree education have the highest percentage of unemployment, with 42.1% or 16 of them being unemployed.
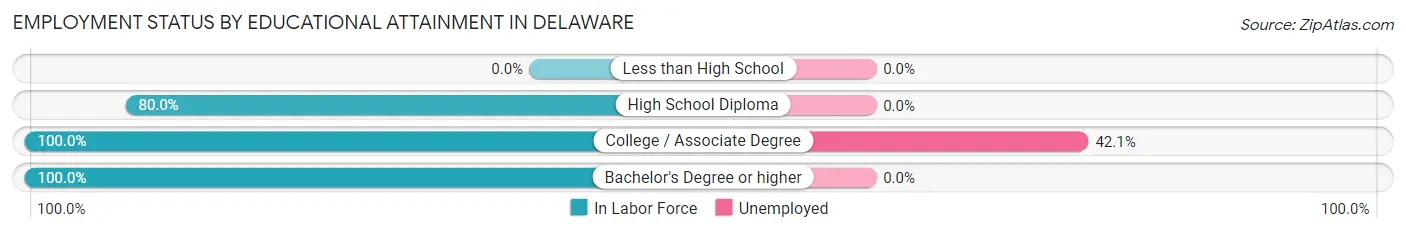
| Educational Attainment | In Labor Force | Unemployed |
| Less than High School | 0 (0.0%) | 0 (0.0%) |
| High School Diploma | 24 (80.0%) | 0 (0.0%) |
| College / Associate Degree | 38 (100.0%) | 16 (42.1%) |
| Bachelor's Degree or higher | 6 (100.0%) | 0 (0.0%) |
| Total | 68 (91.9%) | 17 (23.5%) |
Employment Occupations by Sex in Delaware
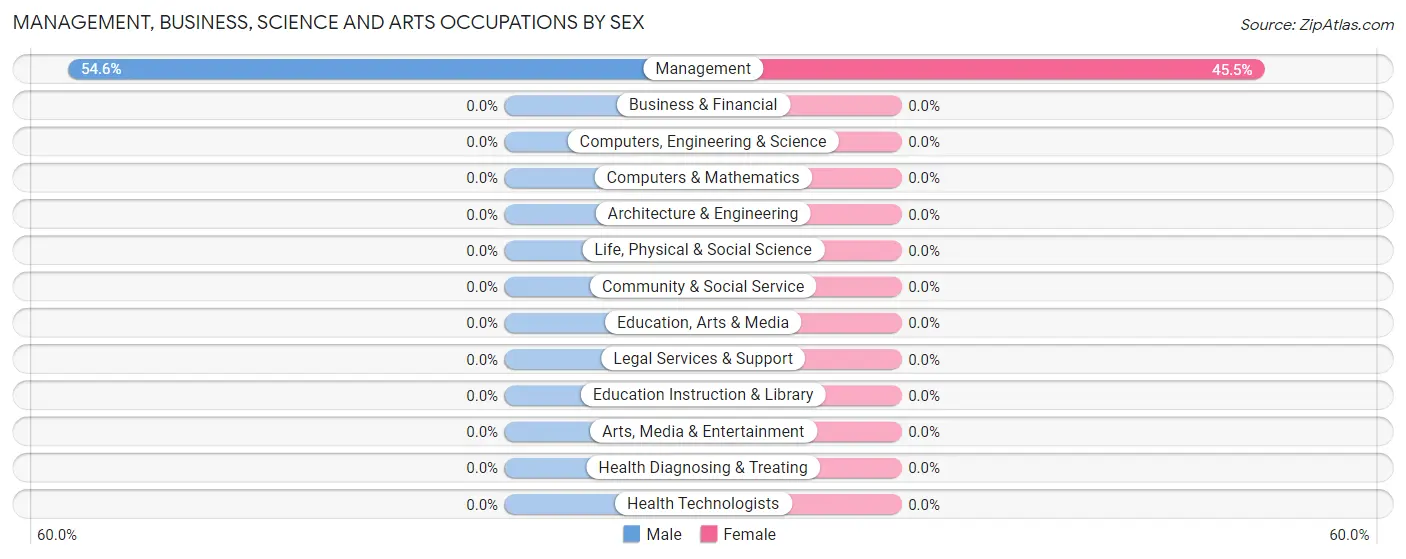
Management, Business, Science and Arts Occupations
The most common Management, Business, Science and Arts occupations in Delaware are , and Management (11 | 19.6%).
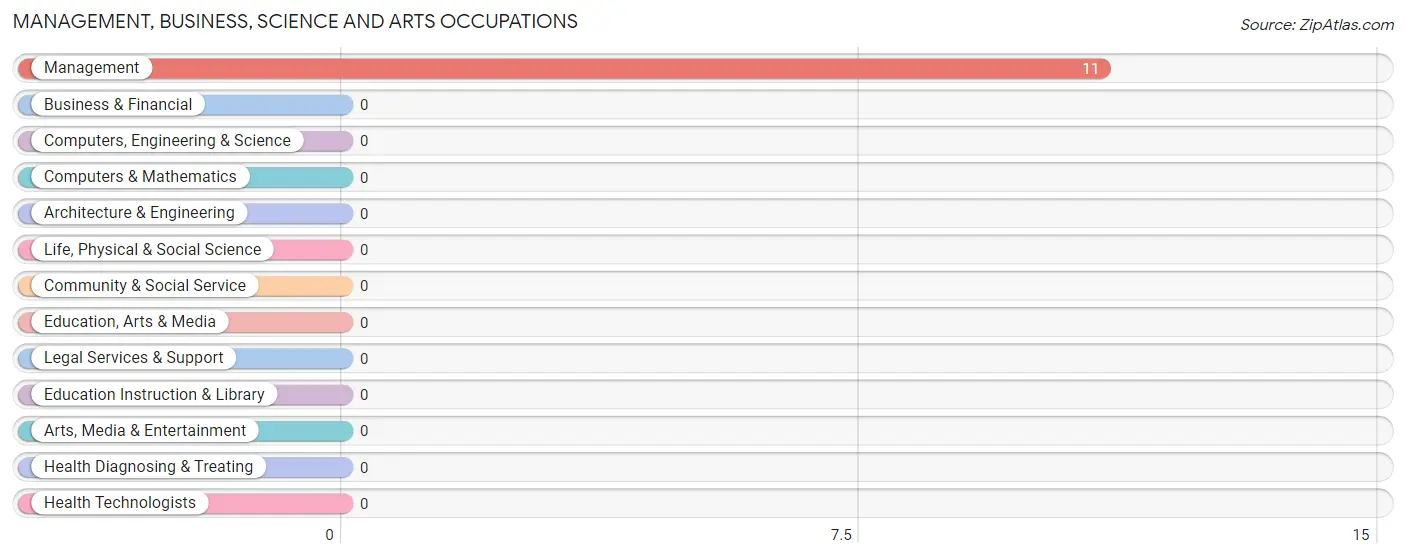
Management, Business, Science and Arts Occupations by Sex
| Occupation | Male | Female |
| Management | 6 (54.5%) | 5 (45.5%) |
| Business & Financial | 0 (0.0%) | 0 (0.0%) |
| Computers, Engineering & Science | 0 (0.0%) | 0 (0.0%) |
| Computers & Mathematics | 0 (0.0%) | 0 (0.0%) |
| Architecture & Engineering | 0 (0.0%) | 0 (0.0%) |
| Life, Physical & Social Science | 0 (0.0%) | 0 (0.0%) |
| Community & Social Service | 0 (0.0%) | 0 (0.0%) |
| Education, Arts & Media | 0 (0.0%) | 0 (0.0%) |
| Legal Services & Support | 0 (0.0%) | 0 (0.0%) |
| Education Instruction & Library | 0 (0.0%) | 0 (0.0%) |
| Arts, Media & Entertainment | 0 (0.0%) | 0 (0.0%) |
| Health Diagnosing & Treating | 0 (0.0%) | 0 (0.0%) |
| Health Technologists | 0 (0.0%) | 0 (0.0%) |
| Total (Category) | 6 (54.5%) | 5 (45.5%) |
| Total (Overall) | 51 (91.1%) | 5 (8.9%) |
Services Occupations
Services Occupations by Sex
| Occupation | Male | Female |
| Healthcare Support | 0 (0.0%) | 0 (0.0%) |
| Security & Protection | 0 (0.0%) | 0 (0.0%) |
| Firefighting & Prevention | 0 (0.0%) | 0 (0.0%) |
| Law Enforcement | 0 (0.0%) | 0 (0.0%) |
| Food Preparation & Serving | 0 (0.0%) | 0 (0.0%) |
| Cleaning & Maintenance | 0 (0.0%) | 0 (0.0%) |
| Personal Care & Service | 0 (0.0%) | 0 (0.0%) |
| Total (Category) | 0 (0.0%) | 0 (0.0%) |
| Total (Overall) | 51 (91.1%) | 5 (8.9%) |
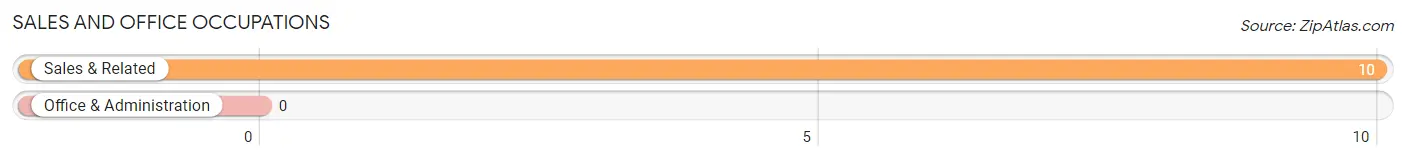
Sales and Office Occupations
The most common Sales and Office occupations in Delaware are , and Sales & Related (10 | 17.9%).
Sales and Office Occupations by Sex

| Occupation | Male | Female |
| Sales & Related | 10 (100.0%) | 0 (0.0%) |
| Office & Administration | 0 (0.0%) | 0 (0.0%) |
| Total (Category) | 10 (100.0%) | 0 (0.0%) |
| Total (Overall) | 51 (91.1%) | 5 (8.9%) |
Natural Resources, Construction and Maintenance Occupations
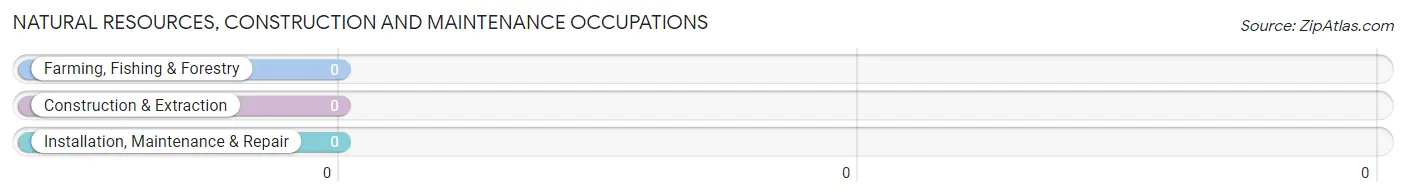
Natural Resources, Construction and Maintenance Occupations by Sex
| Occupation | Male | Female |
| Farming, Fishing & Forestry | 0 (0.0%) | 0 (0.0%) |
| Construction & Extraction | 0 (0.0%) | 0 (0.0%) |
| Installation, Maintenance & Repair | 0 (0.0%) | 0 (0.0%) |
| Total (Category) | 0 (0.0%) | 0 (0.0%) |
| Total (Overall) | 51 (91.1%) | 5 (8.9%) |
Production, Transportation and Moving Occupations
The most common Production, Transportation and Moving occupations in Delaware are Transportation (18 | 32.1%), and Material Moving (17 | 30.4%).
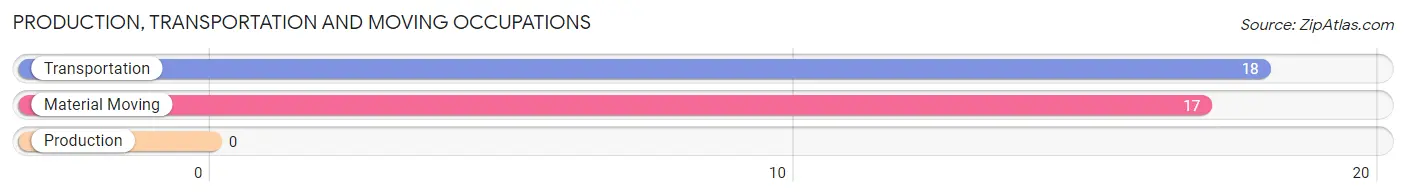
Production, Transportation and Moving Occupations by Sex
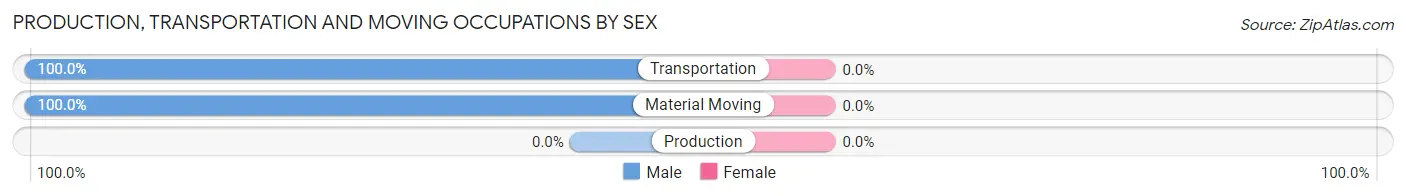
| Occupation | Male | Female |
| Production | 0 (0.0%) | 0 (0.0%) |
| Transportation | 18 (100.0%) | 0 (0.0%) |
| Material Moving | 17 (100.0%) | 0 (0.0%) |
| Total (Category) | 35 (100.0%) | 0 (0.0%) |
| Total (Overall) | 51 (91.1%) | 5 (8.9%) |
Employment Industries by Sex in Delaware
Employment Industries in Delaware
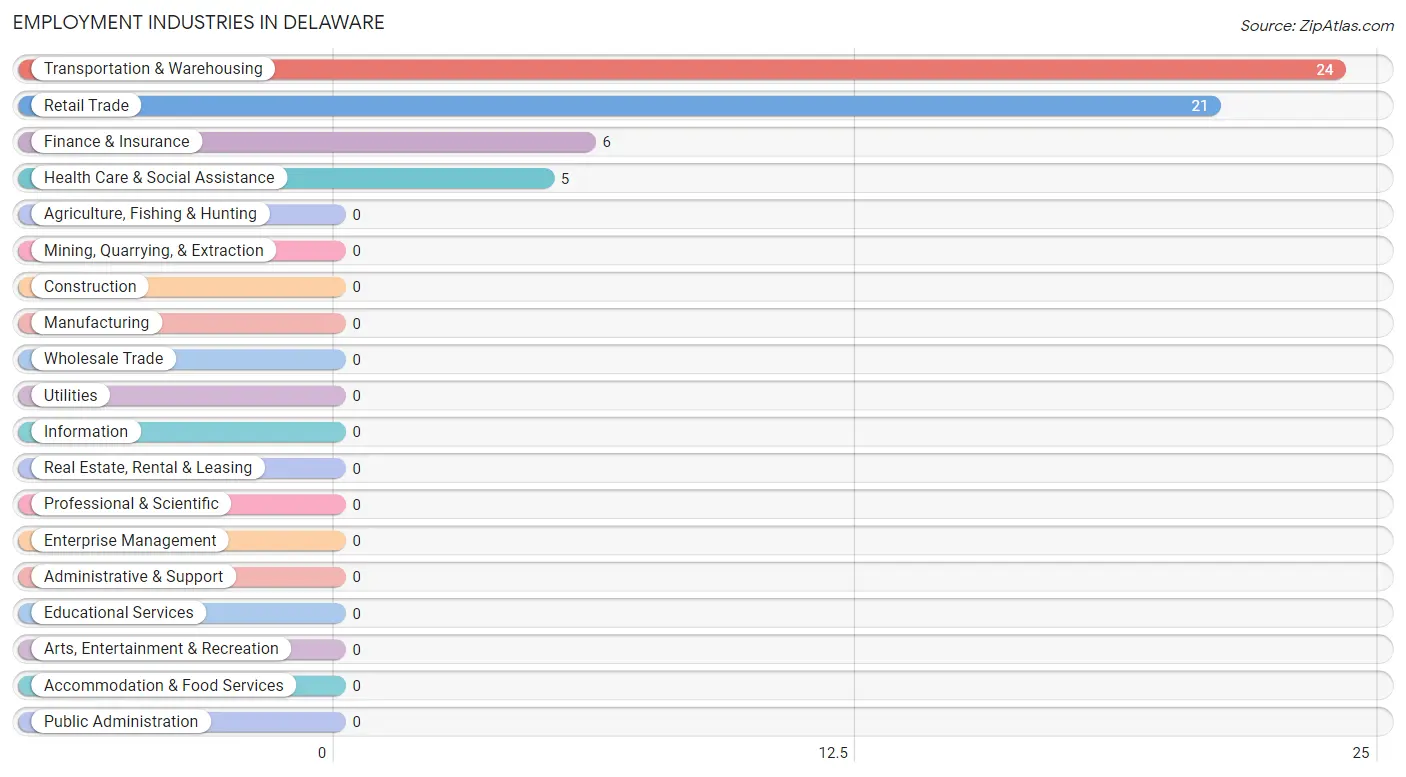
The major employment industries in Delaware include Transportation & Warehousing (24 | 42.9%), Retail Trade (21 | 37.5%), Finance & Insurance (6 | 10.7%), and Health Care & Social Assistance (5 | 8.9%).
Employment Industries by Sex in Delaware
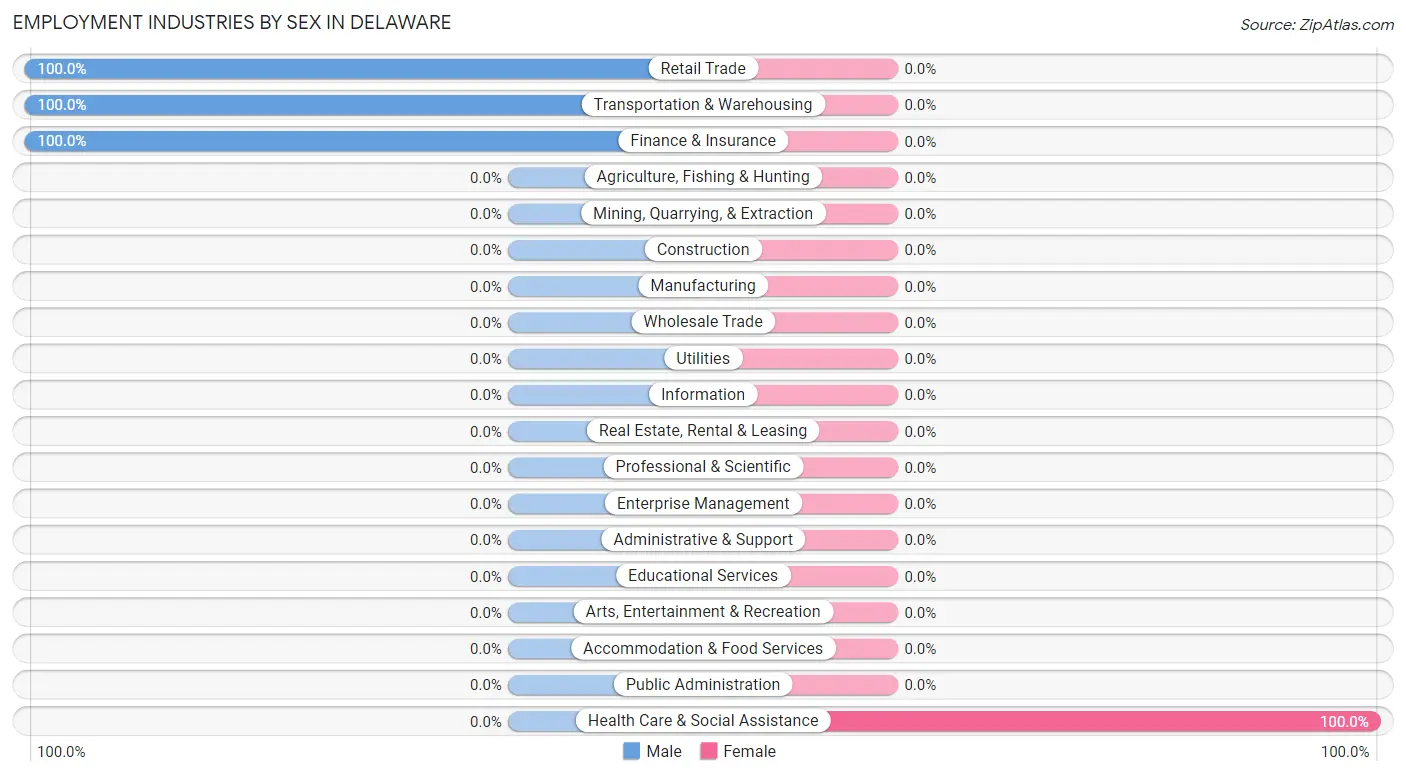
| Industry | Male | Female |
| Agriculture, Fishing & Hunting | 0 (0.0%) | 0 (0.0%) |
| Mining, Quarrying, & Extraction | 0 (0.0%) | 0 (0.0%) |
| Construction | 0 (0.0%) | 0 (0.0%) |
| Manufacturing | 0 (0.0%) | 0 (0.0%) |
| Wholesale Trade | 0 (0.0%) | 0 (0.0%) |
| Retail Trade | 21 (100.0%) | 0 (0.0%) |
| Transportation & Warehousing | 24 (100.0%) | 0 (0.0%) |
| Utilities | 0 (0.0%) | 0 (0.0%) |
| Information | 0 (0.0%) | 0 (0.0%) |
| Finance & Insurance | 6 (100.0%) | 0 (0.0%) |
| Real Estate, Rental & Leasing | 0 (0.0%) | 0 (0.0%) |
| Professional & Scientific | 0 (0.0%) | 0 (0.0%) |
| Enterprise Management | 0 (0.0%) | 0 (0.0%) |
| Administrative & Support | 0 (0.0%) | 0 (0.0%) |
| Educational Services | 0 (0.0%) | 0 (0.0%) |
| Health Care & Social Assistance | 0 (0.0%) | 5 (100.0%) |
| Arts, Entertainment & Recreation | 0 (0.0%) | 0 (0.0%) |
| Accommodation & Food Services | 0 (0.0%) | 0 (0.0%) |
| Public Administration | 0 (0.0%) | 0 (0.0%) |
| Total | 51 (91.1%) | 5 (8.9%) |
Education in Delaware
School Enrollment in Delaware
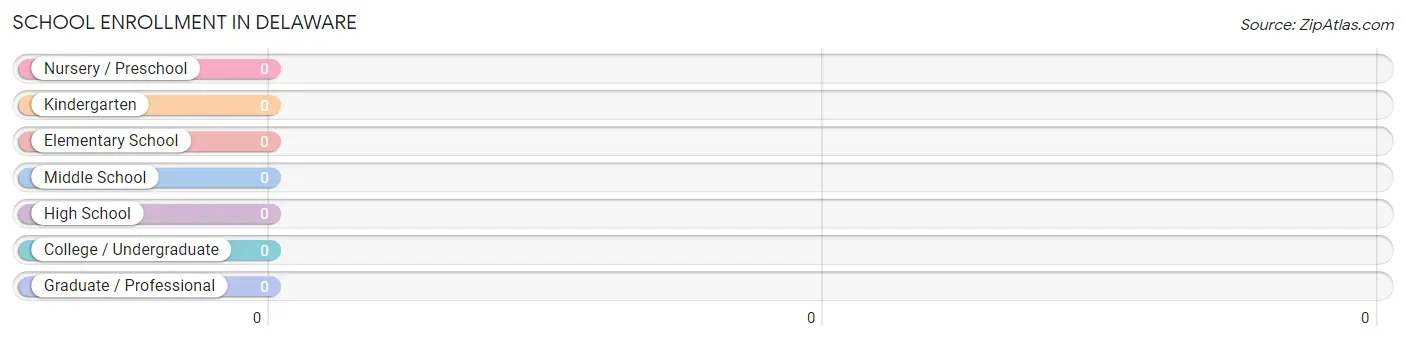
| School Level | # Students | % Students |
| Nursery / Preschool | 0 | 0.0% |
| Kindergarten | 0 | 0.0% |
| Elementary School | 0 | 0.0% |
| Middle School | 0 | 0.0% |
| High School | 0 | 0.0% |
| College / Undergraduate | 0 | 0.0% |
| Graduate / Professional | 0 | 0.0% |
| Total | 0 | 0.0% |
School Enrollment by Age by Funding Source in Delaware
| Age Bracket | Public School | Private School |
| 3 to 4 Year Olds | 0 (0.0%) | 0 (0.0%) |
| 5 to 9 Year Old | 0 (0.0%) | 0 (0.0%) |
| 10 to 14 Year Olds | 0 (0.0%) | 0 (0.0%) |
| 15 to 17 Year Olds | 0 (0.0%) | 0 (0.0%) |
| 18 to 19 Year Olds | 0 (0.0%) | 0 (0.0%) |
| 20 to 24 Year Olds | 0 (0.0%) | 0 (0.0%) |
| 25 to 34 Year Olds | 0 (0.0%) | 0 (0.0%) |
| 35 Years and over | 0 (0.0%) | 0 (0.0%) |
| Total | 0 (0.0%) | 0 (0.0%) |
Educational Attainment by Field of Study in Delaware
Liberal arts & history (8 | 36.4%), visual & performing arts (8 | 36.4%), and physical & health sciences (6 | 27.3%) are the most common fields of study among 22 individuals in Delaware who have obtained a bachelor's degree or higher.
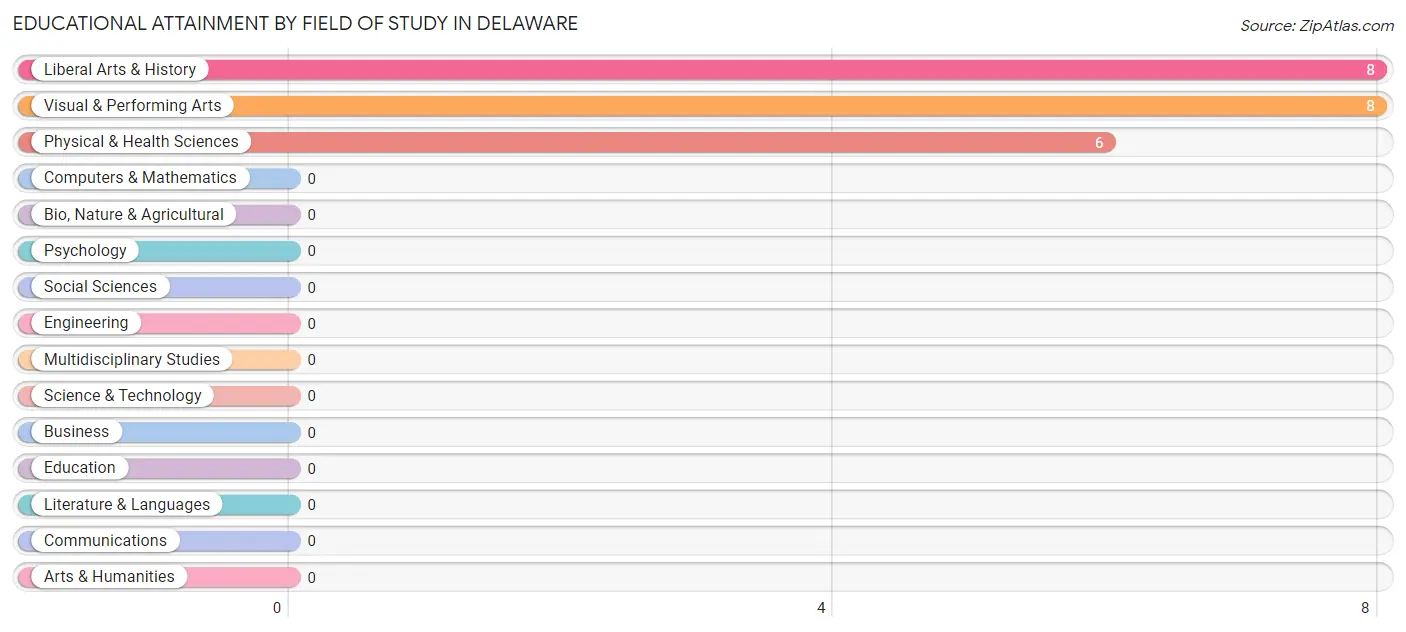
| Field of Study | # Graduates | % Graduates |
| Computers & Mathematics | 0 | 0.0% |
| Bio, Nature & Agricultural | 0 | 0.0% |
| Physical & Health Sciences | 6 | 27.3% |
| Psychology | 0 | 0.0% |
| Social Sciences | 0 | 0.0% |
| Engineering | 0 | 0.0% |
| Multidisciplinary Studies | 0 | 0.0% |
| Science & Technology | 0 | 0.0% |
| Business | 0 | 0.0% |
| Education | 0 | 0.0% |
| Literature & Languages | 0 | 0.0% |
| Liberal Arts & History | 8 | 36.4% |
| Visual & Performing Arts | 8 | 36.4% |
| Communications | 0 | 0.0% |
| Arts & Humanities | 0 | 0.0% |
| Total | 22 | 100.0% |
Transportation & Commute in Delaware
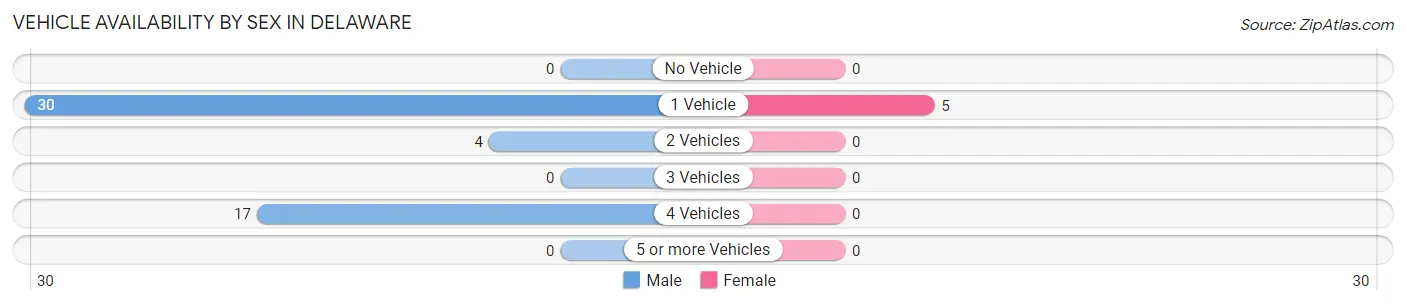
Vehicle Availability by Sex in Delaware
The most prevalent vehicle ownership categories in Delaware are males with 1 vehicle (30, accounting for 58.8%) and females with 1 vehicle (5, making up 600.0%).
| Vehicles Available | Male | Female |
| No Vehicle | 0 (0.0%) | 0 (0.0%) |
| 1 Vehicle | 30 (58.8%) | 5 (100.0%) |
| 2 Vehicles | 4 (7.8%) | 0 (0.0%) |
| 3 Vehicles | 0 (0.0%) | 0 (0.0%) |
| 4 Vehicles | 17 (33.3%) | 0 (0.0%) |
| 5 or more Vehicles | 0 (0.0%) | 0 (0.0%) |
| Total | 51 (100.0%) | 5 (100.0%) |
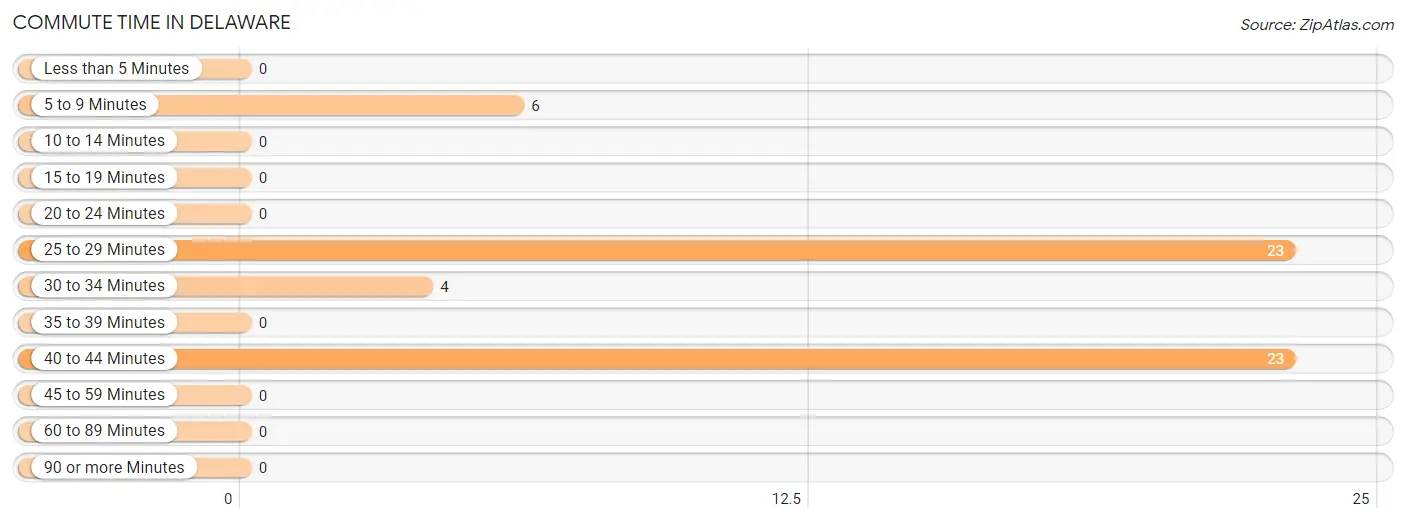
Commute Time in Delaware
The most frequently occuring commute durations in Delaware are 25 to 29 minutes (23 commuters, 41.1%), 40 to 44 minutes (23 commuters, 41.1%), and 5 to 9 minutes (6 commuters, 10.7%).
| Commute Time | # Commuters | % Commuters |
| Less than 5 Minutes | 0 | 0.0% |
| 5 to 9 Minutes | 6 | 10.7% |
| 10 to 14 Minutes | 0 | 0.0% |
| 15 to 19 Minutes | 0 | 0.0% |
| 20 to 24 Minutes | 0 | 0.0% |
| 25 to 29 Minutes | 23 | 41.1% |
| 30 to 34 Minutes | 4 | 7.1% |
| 35 to 39 Minutes | 0 | 0.0% |
| 40 to 44 Minutes | 23 | 41.1% |
| 45 to 59 Minutes | 0 | 0.0% |
| 60 to 89 Minutes | 0 | 0.0% |
| 90 or more Minutes | 0 | 0.0% |
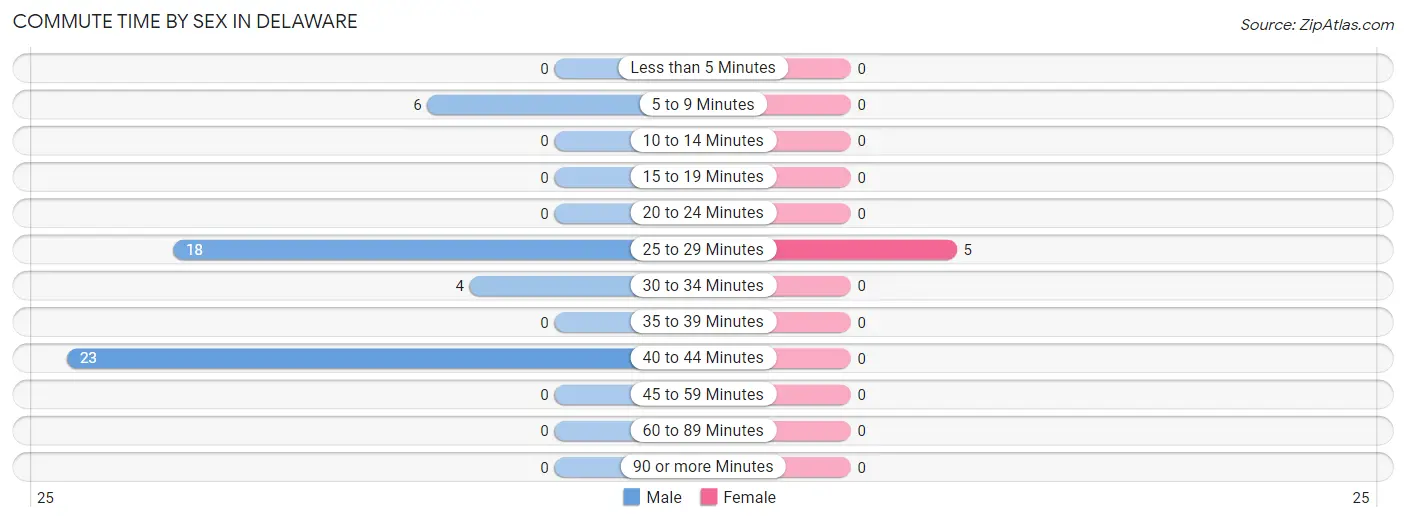
Commute Time by Sex in Delaware
The most common commute times in Delaware are 40 to 44 minutes (23 commuters, 45.1%) for males and 25 to 29 minutes (5 commuters, 100.0%) for females.
| Commute Time | Male | Female |
| Less than 5 Minutes | 0 (0.0%) | 0 (0.0%) |
| 5 to 9 Minutes | 6 (11.8%) | 0 (0.0%) |
| 10 to 14 Minutes | 0 (0.0%) | 0 (0.0%) |
| 15 to 19 Minutes | 0 (0.0%) | 0 (0.0%) |
| 20 to 24 Minutes | 0 (0.0%) | 0 (0.0%) |
| 25 to 29 Minutes | 18 (35.3%) | 5 (100.0%) |
| 30 to 34 Minutes | 4 (7.8%) | 0 (0.0%) |
| 35 to 39 Minutes | 0 (0.0%) | 0 (0.0%) |
| 40 to 44 Minutes | 23 (45.1%) | 0 (0.0%) |
| 45 to 59 Minutes | 0 (0.0%) | 0 (0.0%) |
| 60 to 89 Minutes | 0 (0.0%) | 0 (0.0%) |
| 90 or more Minutes | 0 (0.0%) | 0 (0.0%) |
Time of Departure to Work by Sex in Delaware
The most frequent times of departure to work in Delaware are 6:00 AM to 6:29 AM (23, 45.1%) for males and 5:30 AM to 5:59 AM (5, 100.0%) for females.
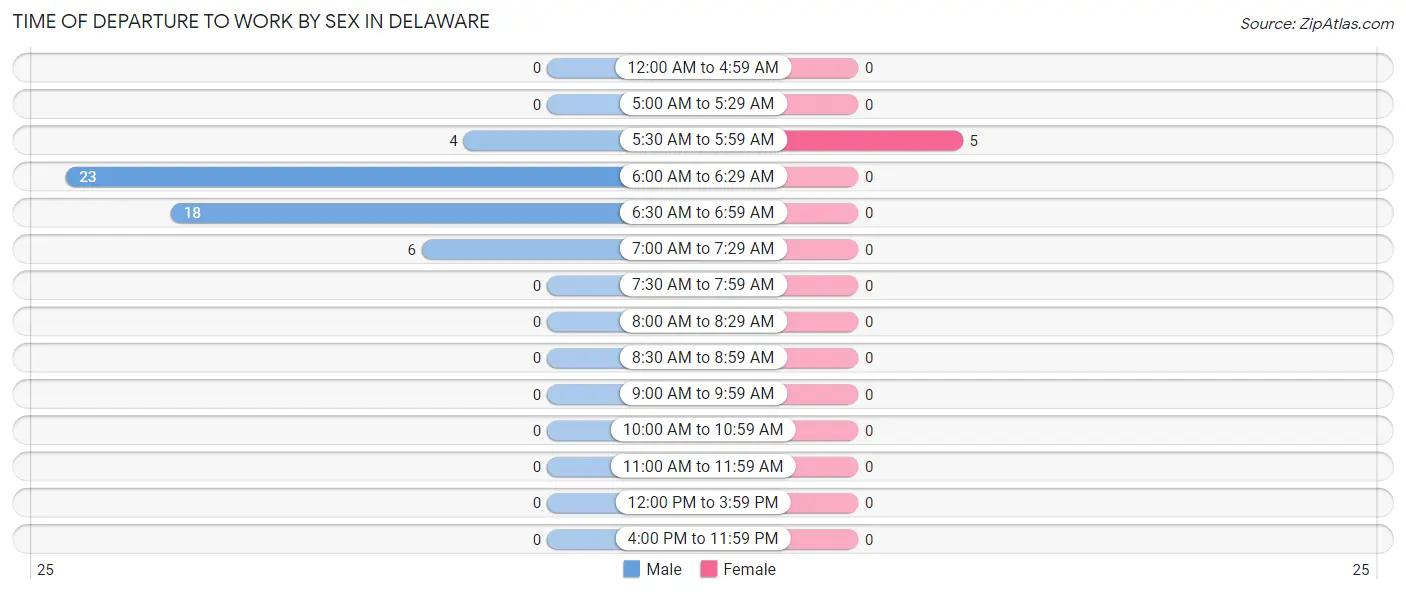
| Time of Departure | Male | Female |
| 12:00 AM to 4:59 AM | 0 (0.0%) | 0 (0.0%) |
| 5:00 AM to 5:29 AM | 0 (0.0%) | 0 (0.0%) |
| 5:30 AM to 5:59 AM | 4 (7.8%) | 5 (100.0%) |
| 6:00 AM to 6:29 AM | 23 (45.1%) | 0 (0.0%) |
| 6:30 AM to 6:59 AM | 18 (35.3%) | 0 (0.0%) |
| 7:00 AM to 7:29 AM | 6 (11.8%) | 0 (0.0%) |
| 7:30 AM to 7:59 AM | 0 (0.0%) | 0 (0.0%) |
| 8:00 AM to 8:29 AM | 0 (0.0%) | 0 (0.0%) |
| 8:30 AM to 8:59 AM | 0 (0.0%) | 0 (0.0%) |
| 9:00 AM to 9:59 AM | 0 (0.0%) | 0 (0.0%) |
| 10:00 AM to 10:59 AM | 0 (0.0%) | 0 (0.0%) |
| 11:00 AM to 11:59 AM | 0 (0.0%) | 0 (0.0%) |
| 12:00 PM to 3:59 PM | 0 (0.0%) | 0 (0.0%) |
| 4:00 PM to 11:59 PM | 0 (0.0%) | 0 (0.0%) |
| Total | 51 (100.0%) | 5 (100.0%) |
Housing Occupancy in Delaware
Occupancy by Ownership in Delaware
Of the total 61 dwellings in Delaware, owner-occupied units account for 61 (100.0%), while renter-occupied units make up 0 (0.0%).
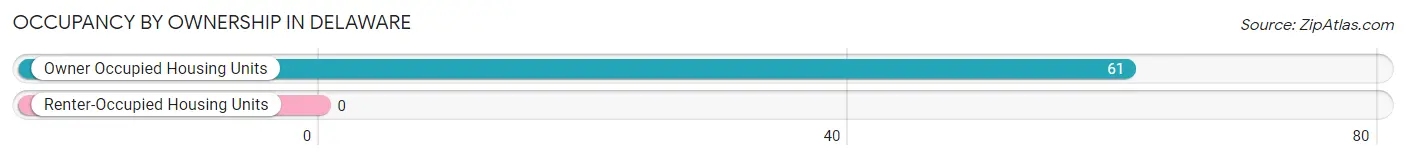
| Occupancy | # Housing Units | % Housing Units |
| Owner Occupied Housing Units | 61 | 100.0% |
| Renter-Occupied Housing Units | 0 | 0.0% |
| Total Occupied Housing Units | 61 | 100.0% |
Occupancy by Household Size in Delaware
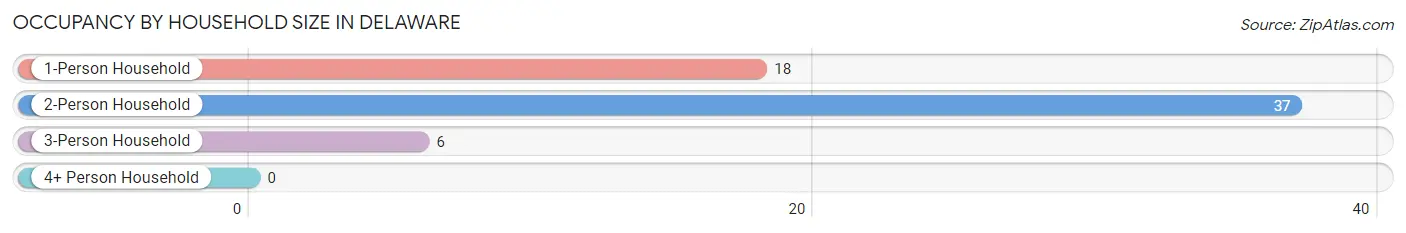
| Household Size | # Housing Units | % Housing Units |
| 1-Person Household | 18 | 29.5% |
| 2-Person Household | 37 | 60.7% |
| 3-Person Household | 6 | 9.8% |
| 4+ Person Household | 0 | 0.0% |
| Total Housing Units | 61 | 100.0% |
Occupancy by Ownership by Household Size in Delaware
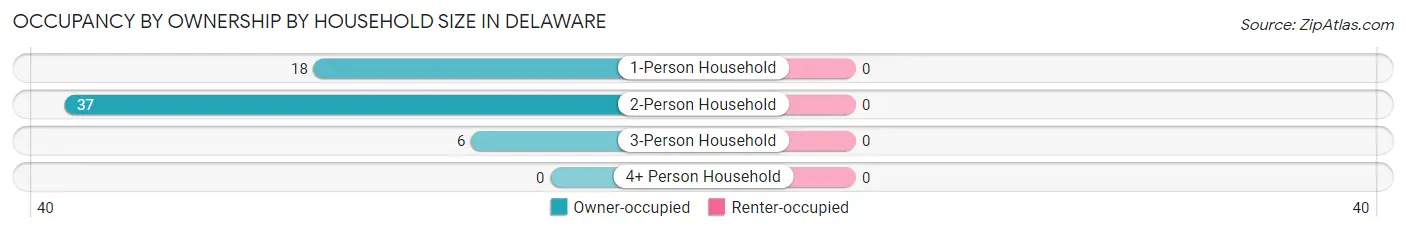
| Household Size | Owner-occupied | Renter-occupied |
| 1-Person Household | 18 (100.0%) | 0 (0.0%) |
| 2-Person Household | 37 (100.0%) | 0 (0.0%) |
| 3-Person Household | 6 (100.0%) | 0 (0.0%) |
| 4+ Person Household | 0 (0.0%) | 0 (0.0%) |
| Total Housing Units | 61 (100.0%) | 0 (0.0%) |
Occupancy by Educational Attainment in Delaware
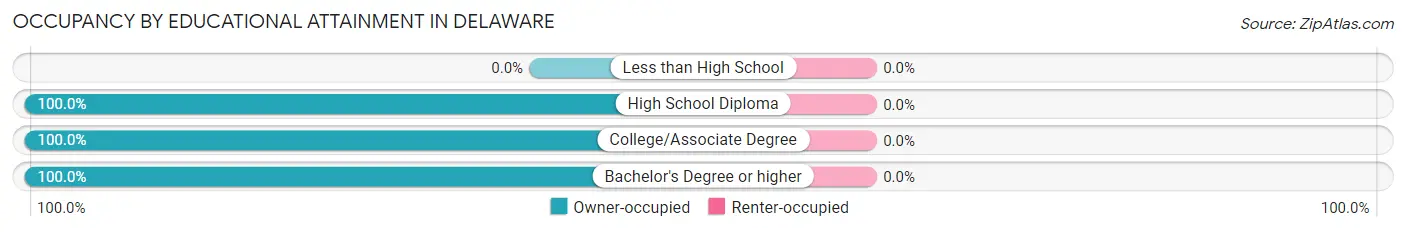
| Household Size | Owner-occupied | Renter-occupied |
| Less than High School | 0 (0.0%) | 0 (0.0%) |
| High School Diploma | 23 (100.0%) | 0 (0.0%) |
| College/Associate Degree | 24 (100.0%) | 0 (0.0%) |
| Bachelor's Degree or higher | 14 (100.0%) | 0 (0.0%) |
Occupancy by Age of Householder in Delaware
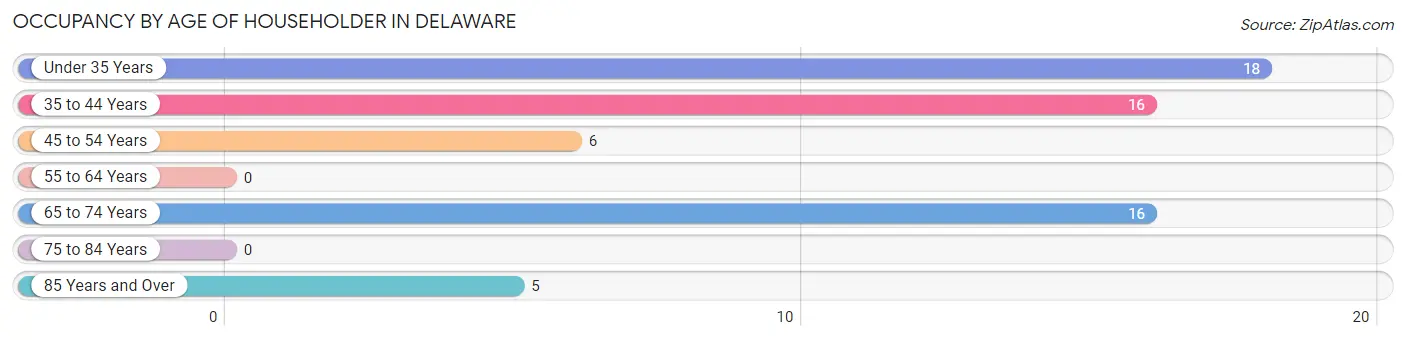
| Age Bracket | # Households | % Households |
| Under 35 Years | 18 | 29.5% |
| 35 to 44 Years | 16 | 26.2% |
| 45 to 54 Years | 6 | 9.8% |
| 55 to 64 Years | 0 | 0.0% |
| 65 to 74 Years | 16 | 26.2% |
| 75 to 84 Years | 0 | 0.0% |
| 85 Years and Over | 5 | 8.2% |
| Total | 61 | 100.0% |
Housing Finances in Delaware
Median Income by Occupancy in Delaware
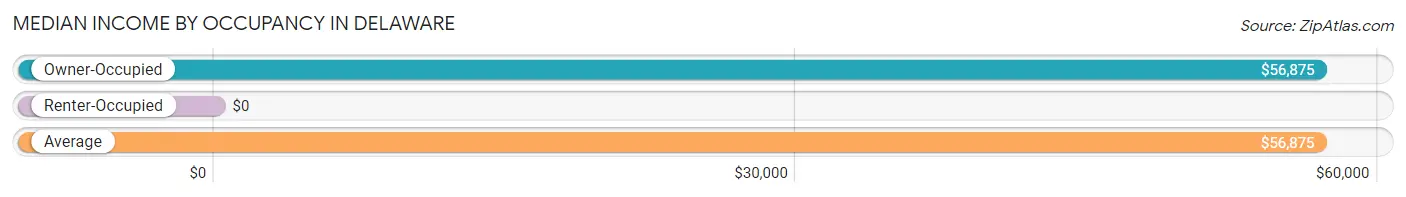
| Occupancy Type | # Households | Median Income |
| Owner-Occupied | 61 (100.0%) | $56,875 |
| Renter-Occupied | 0 (0.0%) | $0 |
| Average | 61 (100.0%) | $56,875 |
Occupancy by Householder Income Bracket in Delaware
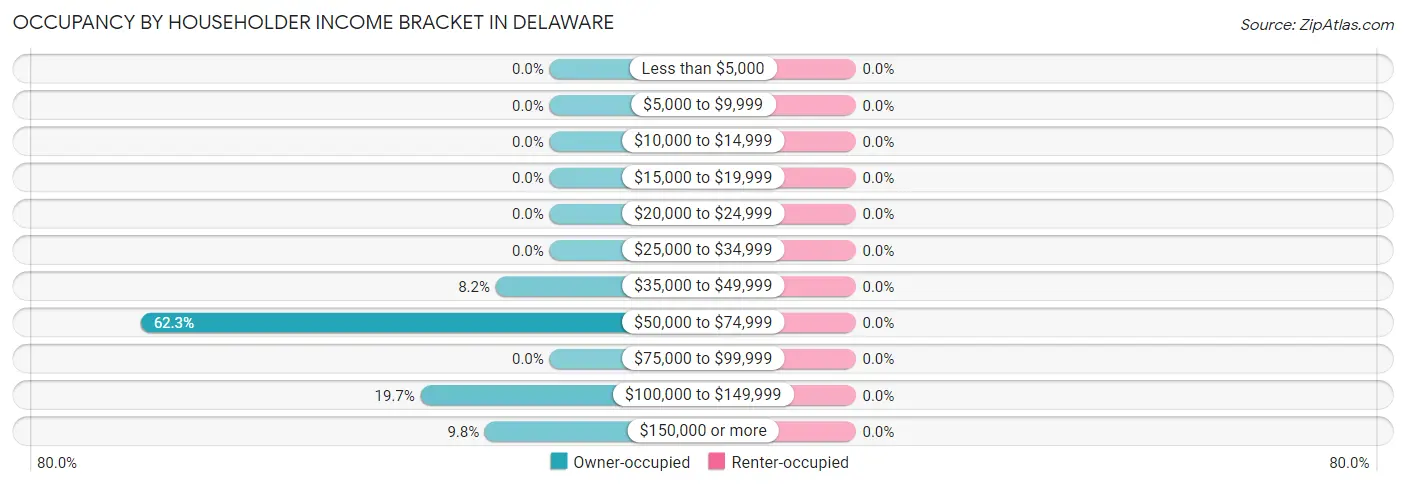
| Income Bracket | Owner-occupied | Renter-occupied |
| Less than $5,000 | 0 (0.0%) | 0 (0.0%) |
| $5,000 to $9,999 | 0 (0.0%) | 0 (0.0%) |
| $10,000 to $14,999 | 0 (0.0%) | 0 (0.0%) |
| $15,000 to $19,999 | 0 (0.0%) | 0 (0.0%) |
| $20,000 to $24,999 | 0 (0.0%) | 0 (0.0%) |
| $25,000 to $34,999 | 0 (0.0%) | 0 (0.0%) |
| $35,000 to $49,999 | 5 (8.2%) | 0 (0.0%) |
| $50,000 to $74,999 | 38 (62.3%) | 0 (0.0%) |
| $75,000 to $99,999 | 0 (0.0%) | 0 (0.0%) |
| $100,000 to $149,999 | 12 (19.7%) | 0 (0.0%) |
| $150,000 or more | 6 (9.8%) | 0 (0.0%) |
| Total | 61 (100.0%) | 0 (0.0%) |
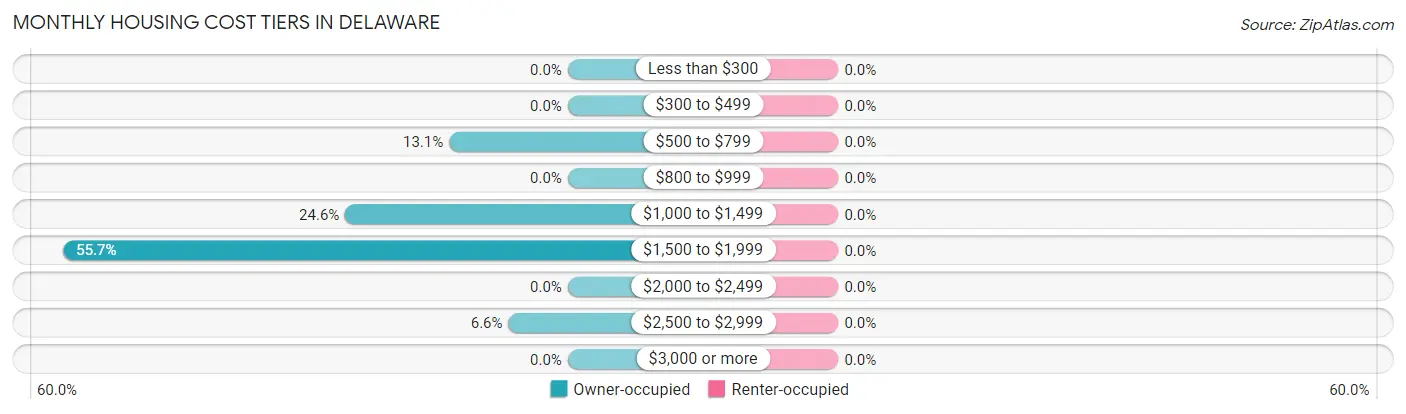
Monthly Housing Cost Tiers in Delaware
| Monthly Cost | Owner-occupied | Renter-occupied |
| Less than $300 | 0 (0.0%) | 0 (0.0%) |
| $300 to $499 | 0 (0.0%) | 0 (0.0%) |
| $500 to $799 | 8 (13.1%) | 0 (0.0%) |
| $800 to $999 | 0 (0.0%) | 0 (0.0%) |
| $1,000 to $1,499 | 15 (24.6%) | 0 (0.0%) |
| $1,500 to $1,999 | 34 (55.7%) | 0 (0.0%) |
| $2,000 to $2,499 | 0 (0.0%) | 0 (0.0%) |
| $2,500 to $2,999 | 4 (6.6%) | 0 (0.0%) |
| $3,000 or more | 0 (0.0%) | 0 (0.0%) |
| Total | 61 (100.0%) | 0 (0.0%) |
Physical Housing Characteristics in Delaware
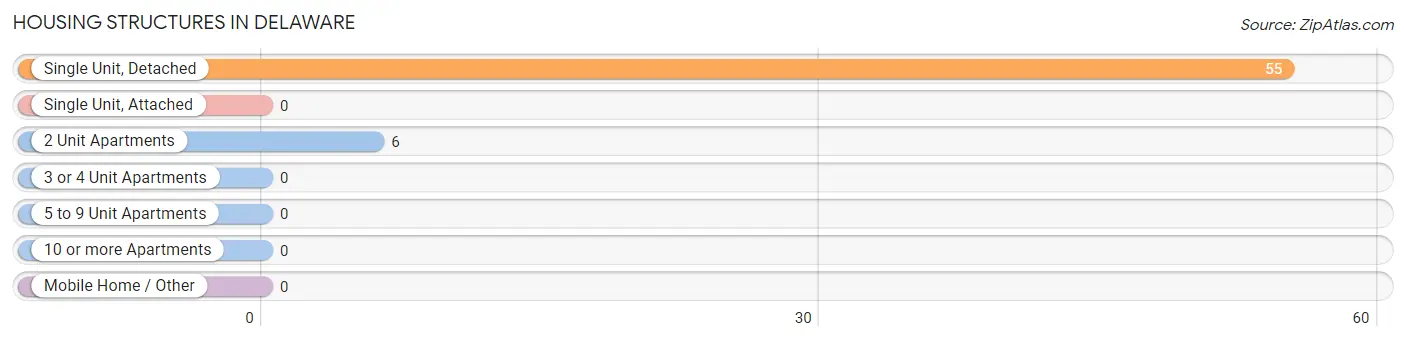
Housing Structures in Delaware
| Structure Type | # Housing Units | % Housing Units |
| Single Unit, Detached | 55 | 90.2% |
| Single Unit, Attached | 0 | 0.0% |
| 2 Unit Apartments | 6 | 9.8% |
| 3 or 4 Unit Apartments | 0 | 0.0% |
| 5 to 9 Unit Apartments | 0 | 0.0% |
| 10 or more Apartments | 0 | 0.0% |
| Mobile Home / Other | 0 | 0.0% |
| Total | 61 | 100.0% |
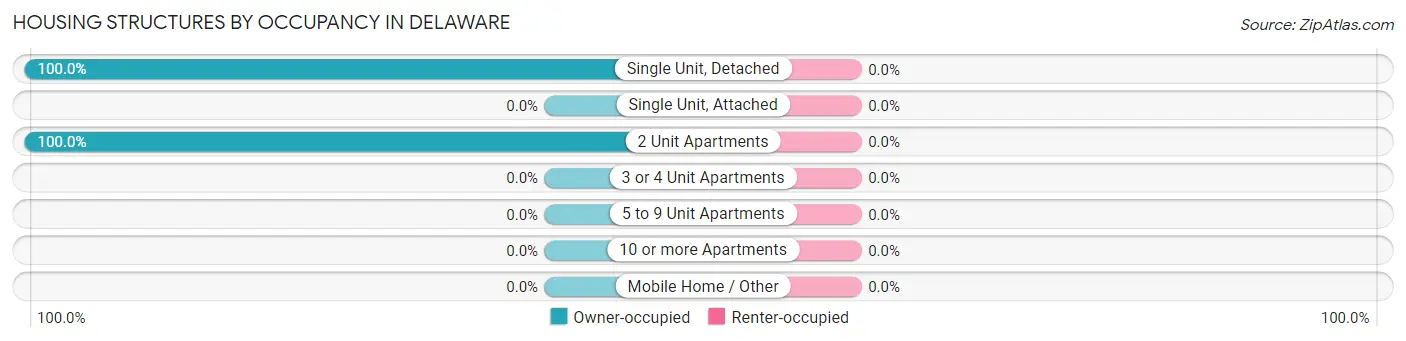
Housing Structures by Occupancy in Delaware
| Structure Type | Owner-occupied | Renter-occupied |
| Single Unit, Detached | 55 (100.0%) | 0 (0.0%) |
| Single Unit, Attached | 0 (0.0%) | 0 (0.0%) |
| 2 Unit Apartments | 6 (100.0%) | 0 (0.0%) |
| 3 or 4 Unit Apartments | 0 (0.0%) | 0 (0.0%) |
| 5 to 9 Unit Apartments | 0 (0.0%) | 0 (0.0%) |
| 10 or more Apartments | 0 (0.0%) | 0 (0.0%) |
| Mobile Home / Other | 0 (0.0%) | 0 (0.0%) |
| Total | 61 (100.0%) | 0 (0.0%) |
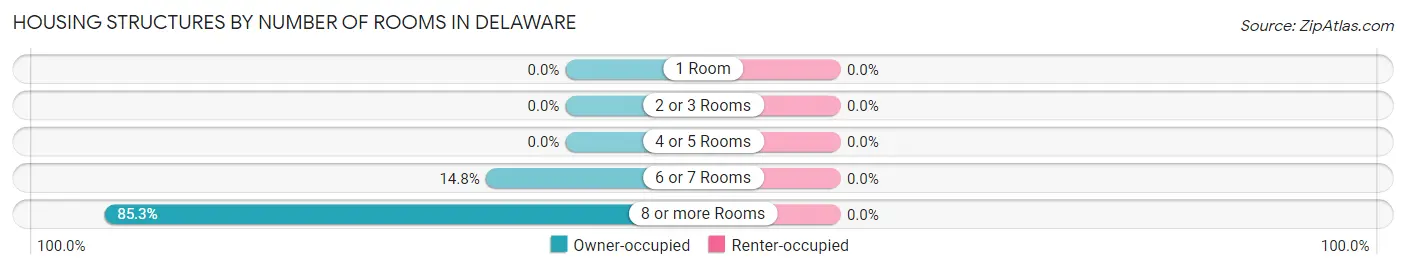
Housing Structures by Number of Rooms in Delaware
| Number of Rooms | Owner-occupied | Renter-occupied |
| 1 Room | 0 (0.0%) | 0 (0.0%) |
| 2 or 3 Rooms | 0 (0.0%) | 0 (0.0%) |
| 4 or 5 Rooms | 0 (0.0%) | 0 (0.0%) |
| 6 or 7 Rooms | 9 (14.7%) | 0 (0.0%) |
| 8 or more Rooms | 52 (85.3%) | 0 (0.0%) |
| Total | 61 (100.0%) | 0 (0.0%) |
Housing Structure by Heating Type in Delaware
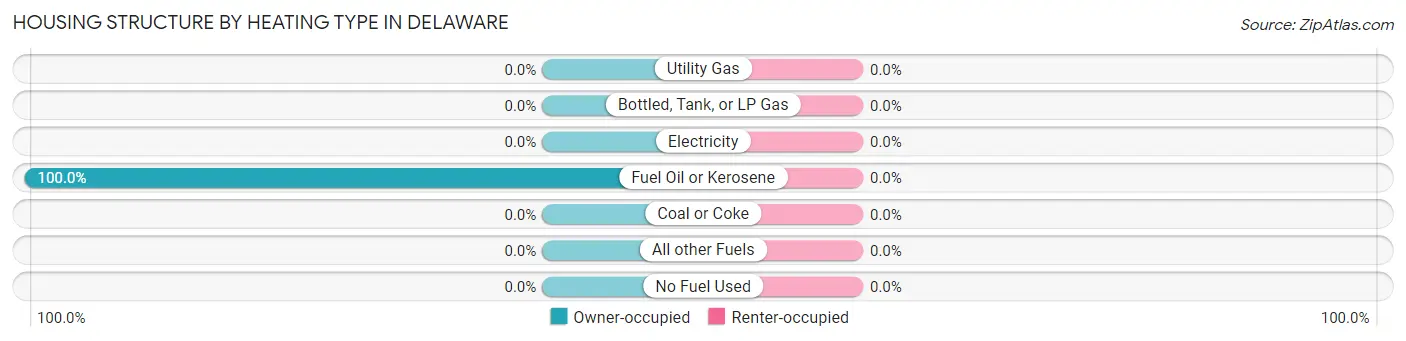
| Heating Type | Owner-occupied | Renter-occupied |
| Utility Gas | 0 (0.0%) | 0 (0.0%) |
| Bottled, Tank, or LP Gas | 0 (0.0%) | 0 (0.0%) |
| Electricity | 0 (0.0%) | 0 (0.0%) |
| Fuel Oil or Kerosene | 61 (100.0%) | 0 (0.0%) |
| Coal or Coke | 0 (0.0%) | 0 (0.0%) |
| All other Fuels | 0 (0.0%) | 0 (0.0%) |
| No Fuel Used | 0 (0.0%) | 0 (0.0%) |
| Total | 61 (100.0%) | 0 (0.0%) |
Household Vehicle Usage in Delaware
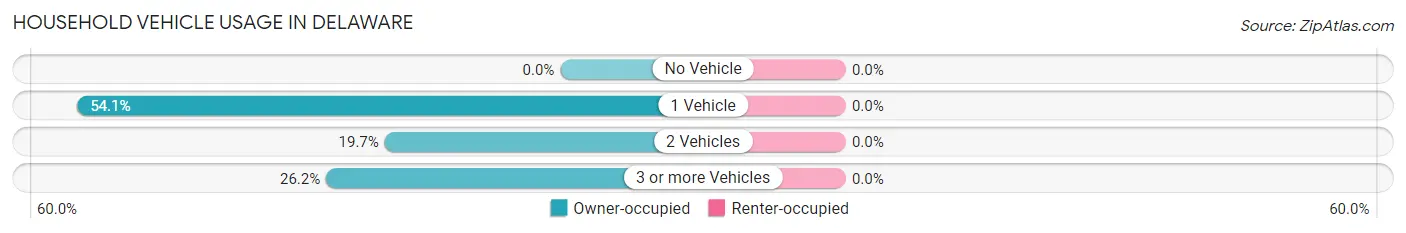
| Vehicles per Household | Owner-occupied | Renter-occupied |
| No Vehicle | 0 (0.0%) | 0 (0.0%) |
| 1 Vehicle | 33 (54.1%) | 0 (0.0%) |
| 2 Vehicles | 12 (19.7%) | 0 (0.0%) |
| 3 or more Vehicles | 16 (26.2%) | 0 (0.0%) |
| Total | 61 (100.0%) | 0 (0.0%) |
Real Estate & Mortgages in Delaware
Real Estate and Mortgage Overview in Delaware
| Characteristic | Without Mortgage | With Mortgage |
| Housing Units | 15 | 46 |
| Median Property Value | - | - |
| Median Household Income | - | - |
| Monthly Housing Costs | $1,142 | $0 |
| Real Estate Taxes | $7,083 | $8 |
Property Value by Mortgage Status in Delaware
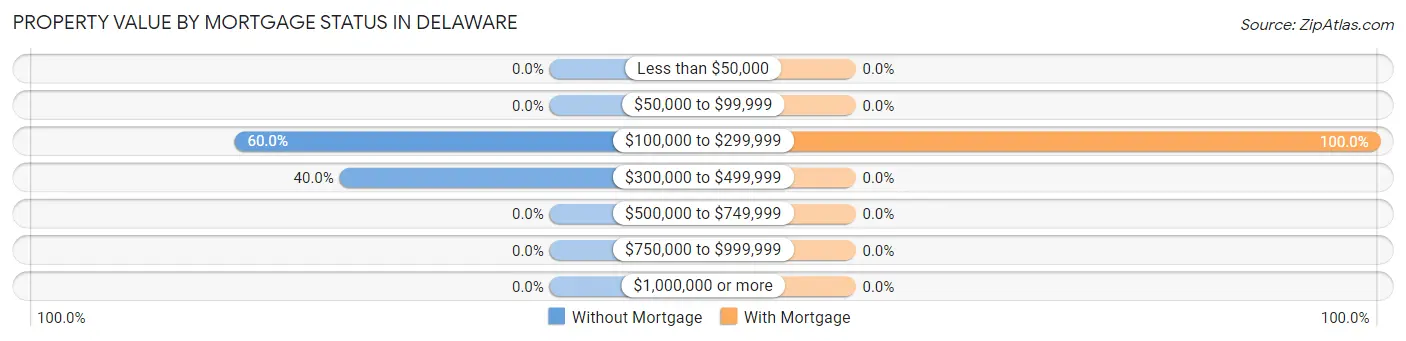
| Property Value | Without Mortgage | With Mortgage |
| Less than $50,000 | 0 (0.0%) | 0 (0.0%) |
| $50,000 to $99,999 | 0 (0.0%) | 0 (0.0%) |
| $100,000 to $299,999 | 9 (60.0%) | 46 (100.0%) |
| $300,000 to $499,999 | 6 (40.0%) | 0 (0.0%) |
| $500,000 to $749,999 | 0 (0.0%) | 0 (0.0%) |
| $750,000 to $999,999 | 0 (0.0%) | 0 (0.0%) |
| $1,000,000 or more | 0 (0.0%) | 0 (0.0%) |
| Total | 15 (100.0%) | 46 (100.0%) |
Household Income by Mortgage Status in Delaware
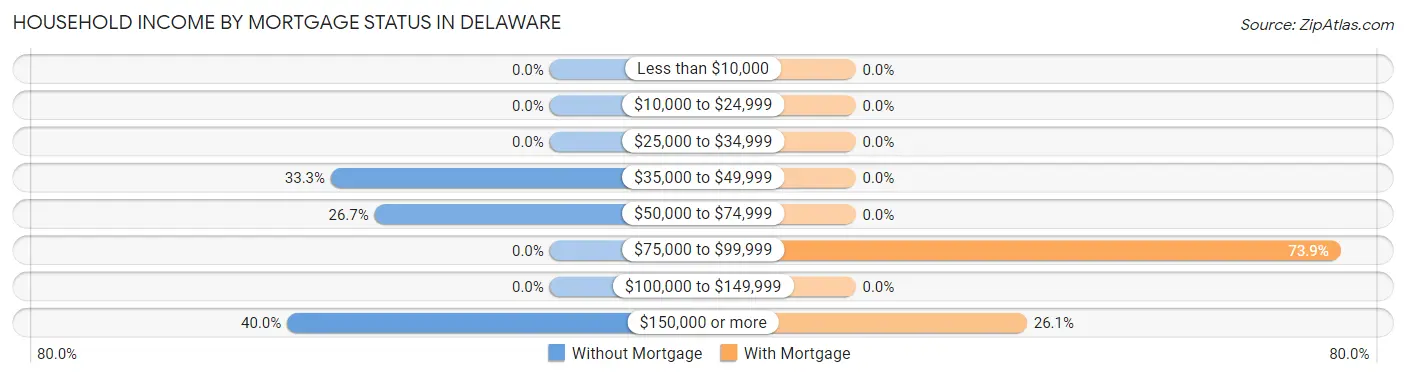
| Household Income | Without Mortgage | With Mortgage |
| Less than $10,000 | 0 (0.0%) | 0 (0.0%) |
| $10,000 to $24,999 | 0 (0.0%) | 0 (0.0%) |
| $25,000 to $34,999 | 0 (0.0%) | 0 (0.0%) |
| $35,000 to $49,999 | 5 (33.3%) | 0 (0.0%) |
| $50,000 to $74,999 | 4 (26.7%) | 0 (0.0%) |
| $75,000 to $99,999 | 0 (0.0%) | 34 (73.9%) |
| $100,000 to $149,999 | 0 (0.0%) | 0 (0.0%) |
| $150,000 or more | 6 (40.0%) | 12 (26.1%) |
| Total | 15 (100.0%) | 46 (100.0%) |
Property Value to Household Income Ratio in Delaware
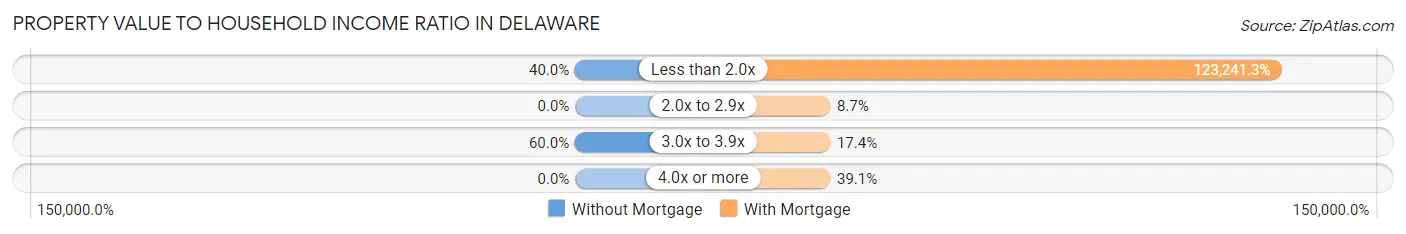
| Value-to-Income Ratio | Without Mortgage | With Mortgage |
| Less than 2.0x | 6 (40.0%) | 56,691 (123,241.3%) |
| 2.0x to 2.9x | 0 (0.0%) | 4 (8.7%) |
| 3.0x to 3.9x | 9 (60.0%) | 8 (17.4%) |
| 4.0x or more | 0 (0.0%) | 18 (39.1%) |
| Total | 15 (100.0%) | 46 (100.0%) |
Real Estate Taxes by Mortgage Status in Delaware
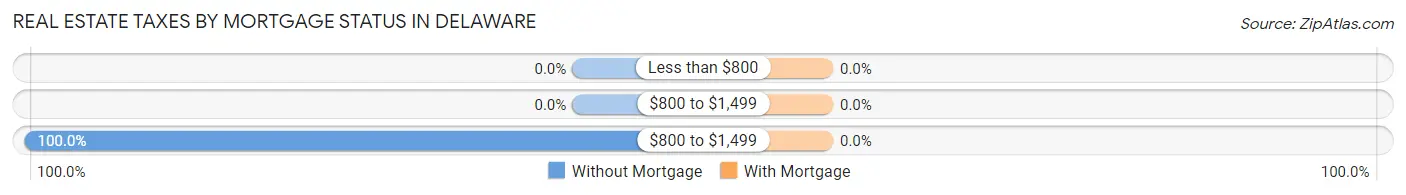
| Property Taxes | Without Mortgage | With Mortgage |
| Less than $800 | 0 (0.0%) | 0 (0.0%) |
| $800 to $1,499 | 0 (0.0%) | 0 (0.0%) |
| $800 to $1,499 | 15 (100.0%) | 0 (0.0%) |
| Total | 15 (100.0%) | 46 (100.0%) |
Health & Disability in Delaware
Health Insurance Coverage by Age in Delaware
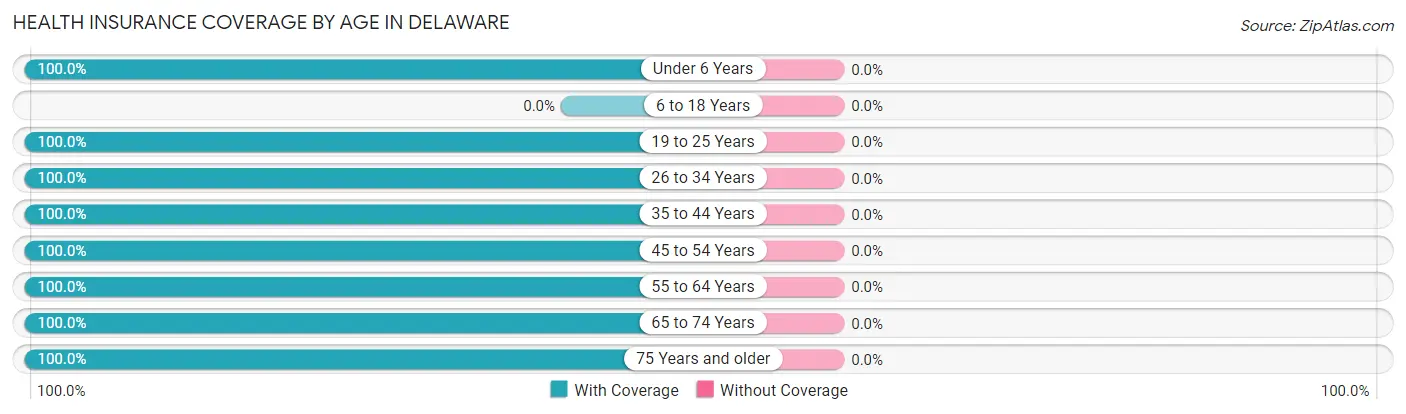
| Age Bracket | With Coverage | Without Coverage |
| Under 6 Years | 9 (100.0%) | 0 (0.0%) |
| 6 to 18 Years | 0 (0.0%) | 0 (0.0%) |
| 19 to 25 Years | 4 (100.0%) | 0 (0.0%) |
| 26 to 34 Years | 35 (100.0%) | 0 (0.0%) |
| 35 to 44 Years | 16 (100.0%) | 0 (0.0%) |
| 45 to 54 Years | 17 (100.0%) | 0 (0.0%) |
| 55 to 64 Years | 6 (100.0%) | 0 (0.0%) |
| 65 to 74 Years | 33 (100.0%) | 0 (0.0%) |
| 75 Years and older | 5 (100.0%) | 0 (0.0%) |
| Total | 125 (100.0%) | 0 (0.0%) |
Health Insurance Coverage by Citizenship Status in Delaware
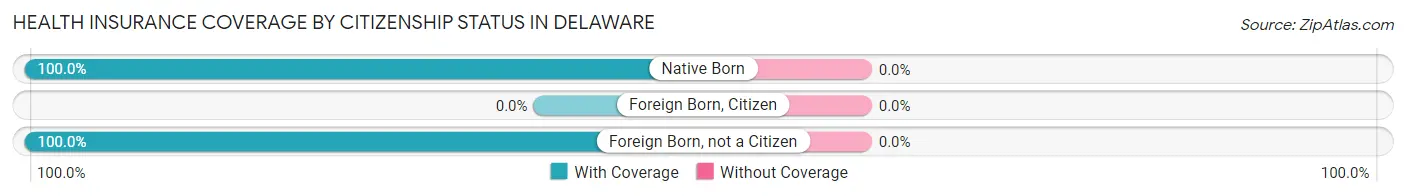
| Citizenship Status | With Coverage | Without Coverage |
| Native Born | 9 (100.0%) | 0 (0.0%) |
| Foreign Born, Citizen | 0 (0.0%) | 0 (0.0%) |
| Foreign Born, not a Citizen | 4 (100.0%) | 0 (0.0%) |
Health Insurance Coverage by Household Income in Delaware
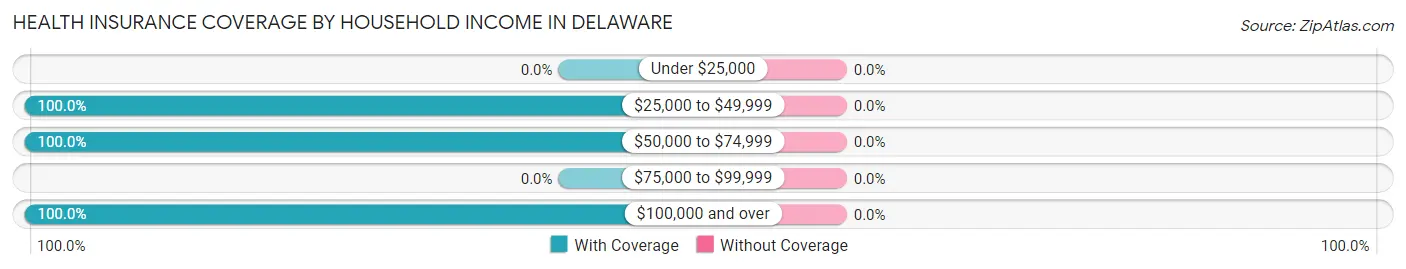
| Household Income | With Coverage | Without Coverage |
| Under $25,000 | 0 (0.0%) | 0 (0.0%) |
| $25,000 to $49,999 | 11 (100.0%) | 0 (0.0%) |
| $50,000 to $74,999 | 60 (100.0%) | 0 (0.0%) |
| $75,000 to $99,999 | 0 (0.0%) | 0 (0.0%) |
| $100,000 and over | 41 (100.0%) | 0 (0.0%) |
Public vs Private Health Insurance Coverage by Age in Delaware
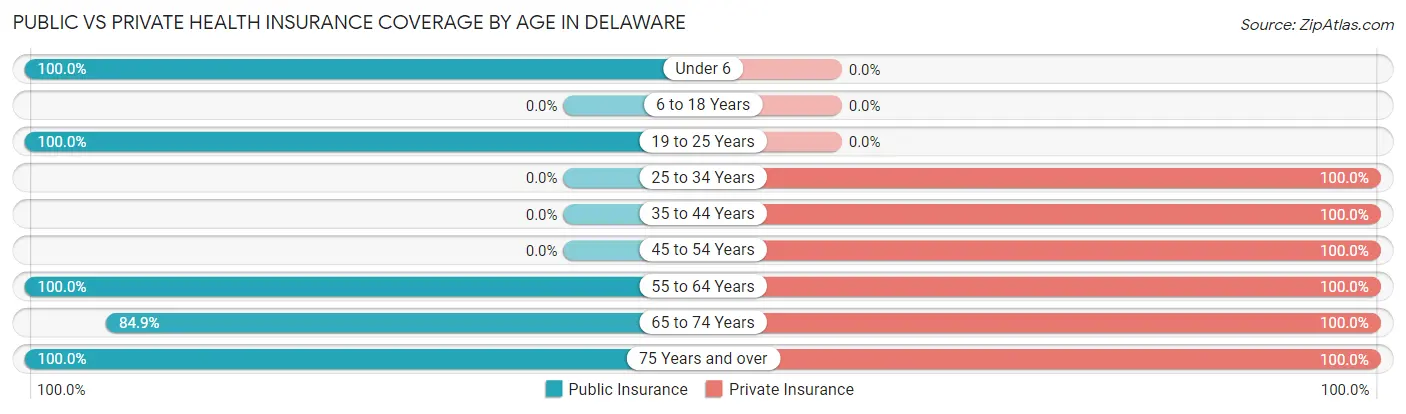
| Age Bracket | Public Insurance | Private Insurance |
| Under 6 | 9 (100.0%) | 0 (0.0%) |
| 6 to 18 Years | 0 (0.0%) | 0 (0.0%) |
| 19 to 25 Years | 4 (100.0%) | 0 (0.0%) |
| 25 to 34 Years | 0 (0.0%) | 35 (100.0%) |
| 35 to 44 Years | 0 (0.0%) | 16 (100.0%) |
| 45 to 54 Years | 0 (0.0%) | 17 (100.0%) |
| 55 to 64 Years | 6 (100.0%) | 6 (100.0%) |
| 65 to 74 Years | 28 (84.9%) | 33 (100.0%) |
| 75 Years and over | 5 (100.0%) | 5 (100.0%) |
| Total | 52 (41.6%) | 112 (89.6%) |
Disability Status by Sex by Age in Delaware
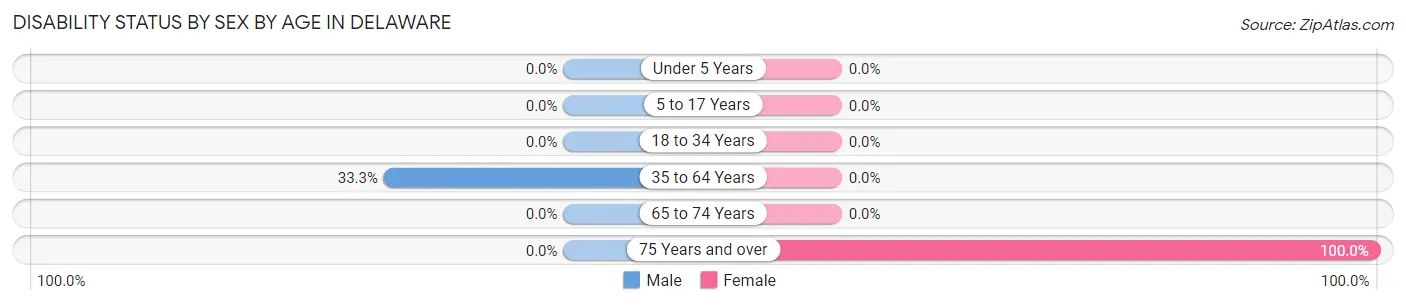
| Age Bracket | Male | Female |
| Under 5 Years | 0 (0.0%) | 0 (0.0%) |
| 5 to 17 Years | 0 (0.0%) | 0 (0.0%) |
| 18 to 34 Years | 0 (0.0%) | 0 (0.0%) |
| 35 to 64 Years | 6 (33.3%) | 0 (0.0%) |
| 65 to 74 Years | 0 (0.0%) | 0 (0.0%) |
| 75 Years and over | 0 (0.0%) | 5 (100.0%) |
Disability Class by Sex by Age in Delaware
Disability Class: Hearing Difficulty
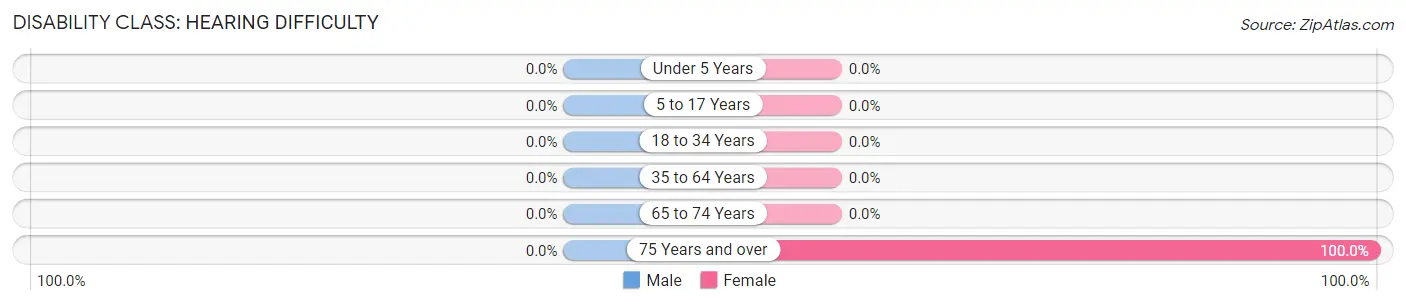
| Age Bracket | Male | Female |
| Under 5 Years | 0 (0.0%) | 0 (0.0%) |
| 5 to 17 Years | 0 (0.0%) | 0 (0.0%) |
| 18 to 34 Years | 0 (0.0%) | 0 (0.0%) |
| 35 to 64 Years | 0 (0.0%) | 0 (0.0%) |
| 65 to 74 Years | 0 (0.0%) | 0 (0.0%) |
| 75 Years and over | 0 (0.0%) | 5 (100.0%) |
Disability Class: Vision Difficulty

| Age Bracket | Male | Female |
| Under 5 Years | 0 (0.0%) | 0 (0.0%) |
| 5 to 17 Years | 0 (0.0%) | 0 (0.0%) |
| 18 to 34 Years | 0 (0.0%) | 0 (0.0%) |
| 35 to 64 Years | 0 (0.0%) | 0 (0.0%) |
| 65 to 74 Years | 0 (0.0%) | 0 (0.0%) |
| 75 Years and over | 0 (0.0%) | 0 (0.0%) |
Disability Class: Cognitive Difficulty
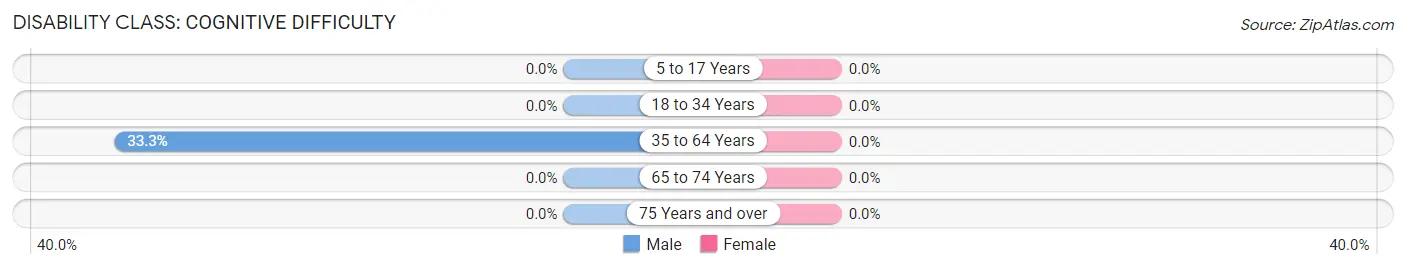
| Age Bracket | Male | Female |
| 5 to 17 Years | 0 (0.0%) | 0 (0.0%) |
| 18 to 34 Years | 0 (0.0%) | 0 (0.0%) |
| 35 to 64 Years | 6 (33.3%) | 0 (0.0%) |
| 65 to 74 Years | 0 (0.0%) | 0 (0.0%) |
| 75 Years and over | 0 (0.0%) | 0 (0.0%) |
Disability Class: Ambulatory Difficulty
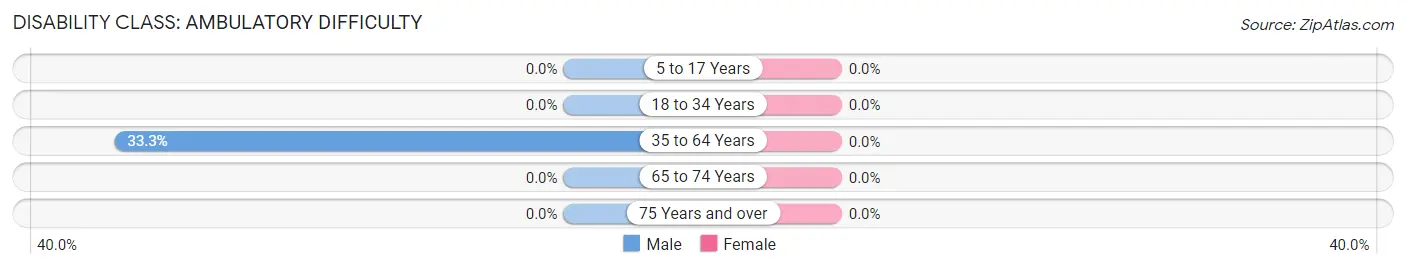
| Age Bracket | Male | Female |
| 5 to 17 Years | 0 (0.0%) | 0 (0.0%) |
| 18 to 34 Years | 0 (0.0%) | 0 (0.0%) |
| 35 to 64 Years | 6 (33.3%) | 0 (0.0%) |
| 65 to 74 Years | 0 (0.0%) | 0 (0.0%) |
| 75 Years and over | 0 (0.0%) | 0 (0.0%) |
Disability Class: Self-Care Difficulty
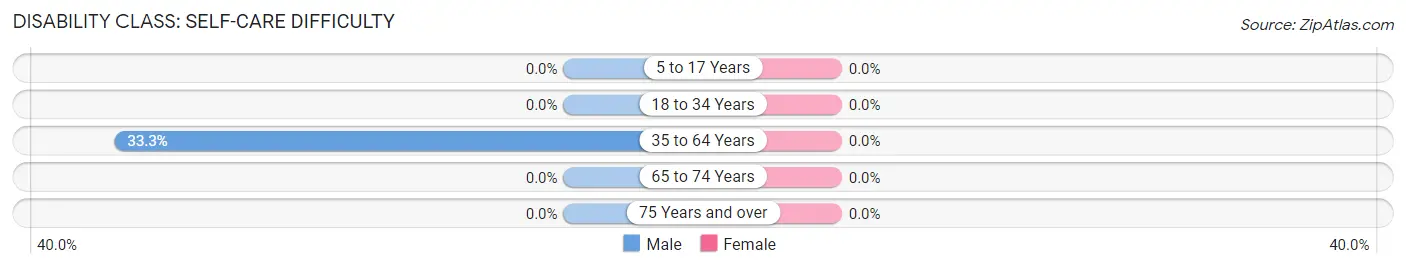
| Age Bracket | Male | Female |
| 5 to 17 Years | 0 (0.0%) | 0 (0.0%) |
| 18 to 34 Years | 0 (0.0%) | 0 (0.0%) |
| 35 to 64 Years | 6 (33.3%) | 0 (0.0%) |
| 65 to 74 Years | 0 (0.0%) | 0 (0.0%) |
| 75 Years and over | 0 (0.0%) | 0 (0.0%) |
Technology Access in Delaware
Computing Device Access in Delaware
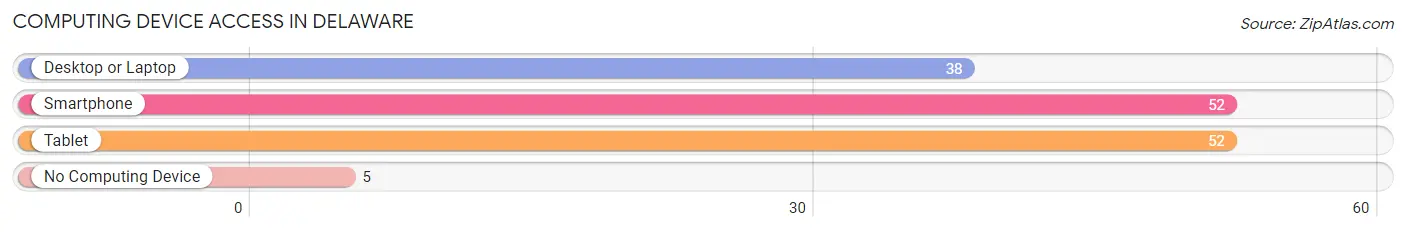
| Device Type | # Households | % Households |
| Desktop or Laptop | 38 | 62.3% |
| Smartphone | 52 | 85.3% |
| Tablet | 52 | 85.3% |
| No Computing Device | 5 | 8.2% |
| Total | 61 | 100.0% |
Internet Access in Delaware
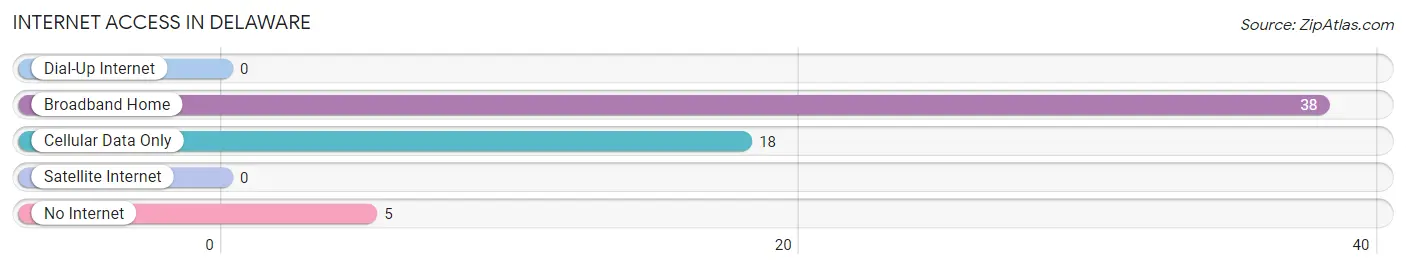
| Internet Type | # Households | % Households |
| Dial-Up Internet | 0 | 0.0% |
| Broadband Home | 38 | 62.3% |
| Cellular Data Only | 18 | 29.5% |
| Satellite Internet | 0 | 0.0% |
| No Internet | 5 | 8.2% |
| Total | 61 | 100.0% |
Delaware Summary
Delaware is a state located in the Mid-Atlantic region of the United States. It is bordered by Pennsylvania to the north, Maryland to the east and south, and the Atlantic Ocean to the east and south. Delaware is the second smallest state in the United States, with an area of only 1,982 square miles. It is the sixth most populous state, with a population of 945,934 as of 2019.
History
Delaware was first inhabited by Native Americans, including the Lenape, Nanticoke, and Susquehannock tribes. The first European settlers arrived in the area in 1631, when the Dutch established a trading post at Zwaanendael. The area was later claimed by the English, who established the colony of Delaware in 1664. Delaware was one of the original thirteen colonies that declared independence from Britain in 1776. It was the first state to ratify the United States Constitution in 1787, and was the first state to join the Union.
Geography
Delaware is located in the Mid-Atlantic region of the United States. It is bordered by Pennsylvania to the north, Maryland to the east and south, and the Atlantic Ocean to the east and south. Delaware is the second smallest state in the United States, with an area of only 1,982 square miles. It is divided into three counties: New Castle, Kent, and Sussex. The state is divided into three distinct geographic regions: the Atlantic Coastal Plain, the Piedmont Plateau, and the Appalachian Mountains.
The Atlantic Coastal Plain is located in the eastern part of the state and is characterized by flat, low-lying land. The Piedmont Plateau is located in the central part of the state and is characterized by rolling hills and valleys. The Appalachian Mountains are located in the western part of the state and are characterized by steep, rugged terrain.
Economy
Delaware has a diverse economy that is driven by agriculture, manufacturing, finance, and tourism. Agriculture is the state’s largest industry, with poultry, dairy, and soybeans being the main products. Manufacturing is also an important part of the economy, with chemical products, food processing, and paper products being the main products. The finance industry is also a major contributor to the economy, with banking, insurance, and investment services being the main industries. Tourism is also an important part of the economy, with beaches, parks, and historic sites being the main attractions.
Demographics
As of 2019, Delaware had a population of 945,934. The population is racially and ethnically diverse, with the largest racial group being White (62.3%), followed by Black or African American (22.2%), Hispanic or Latino (9.2%), and Asian (4.2%). The largest ethnic group is German (17.2%), followed by Irish (13.2%), English (10.2%), and Italian (5.2%). The median household income is $62,852, and the median age is 38.7 years. The state has a high rate of educational attainment, with 91.2% of adults having at least a high school diploma and 37.2% having a bachelor’s degree or higher.
Common Questions
What is Per Capita Income in Delaware?
Per Capita income in Delaware is $51,534.
What is the Median Family Income in Delaware?
Median Family Income in Delaware is $142,656.
What is the Median Household income in Delaware?
Median Household Income in Delaware is $56,875.
What is Inequality or Gini Index in Delaware?
Inequality or Gini Index in Delaware is 0.40.
What is the Total Population of Delaware?
Total Population of Delaware is 125.
What is the Total Male Population of Delaware?
Total Male Population of Delaware is 74.
What is the Total Female Population of Delaware?
Total Female Population of Delaware is 51.
What is the Ratio of Males per 100 Females in Delaware?
There are 145.10 Males per 100 Females in Delaware.
What is the Ratio of Females per 100 Males in Delaware?
There are 68.92 Females per 100 Males in Delaware.
What is the Median Population Age in Delaware?
Median Population Age in Delaware is 40.9 Years.
What is the Average Family Size in Delaware
Average Family Size in Delaware is 2.0 People.
What is the Average Household Size in Delaware
Average Household Size in Delaware is 1.8 People.
How Large is the Labor Force in Delaware?
There are 76 People in the Labor Forcein in Delaware.
What is the Percentage of People in the Labor Force in Delaware?
65.5% of People are in the Labor Force in Delaware.
What is the Unemployment Rate in Delaware?
Unemployment Rate in Delaware is 26.3%.