Cedar Glen Lakes, NJ Map & Demographics
Cedar Glen Lakes Map
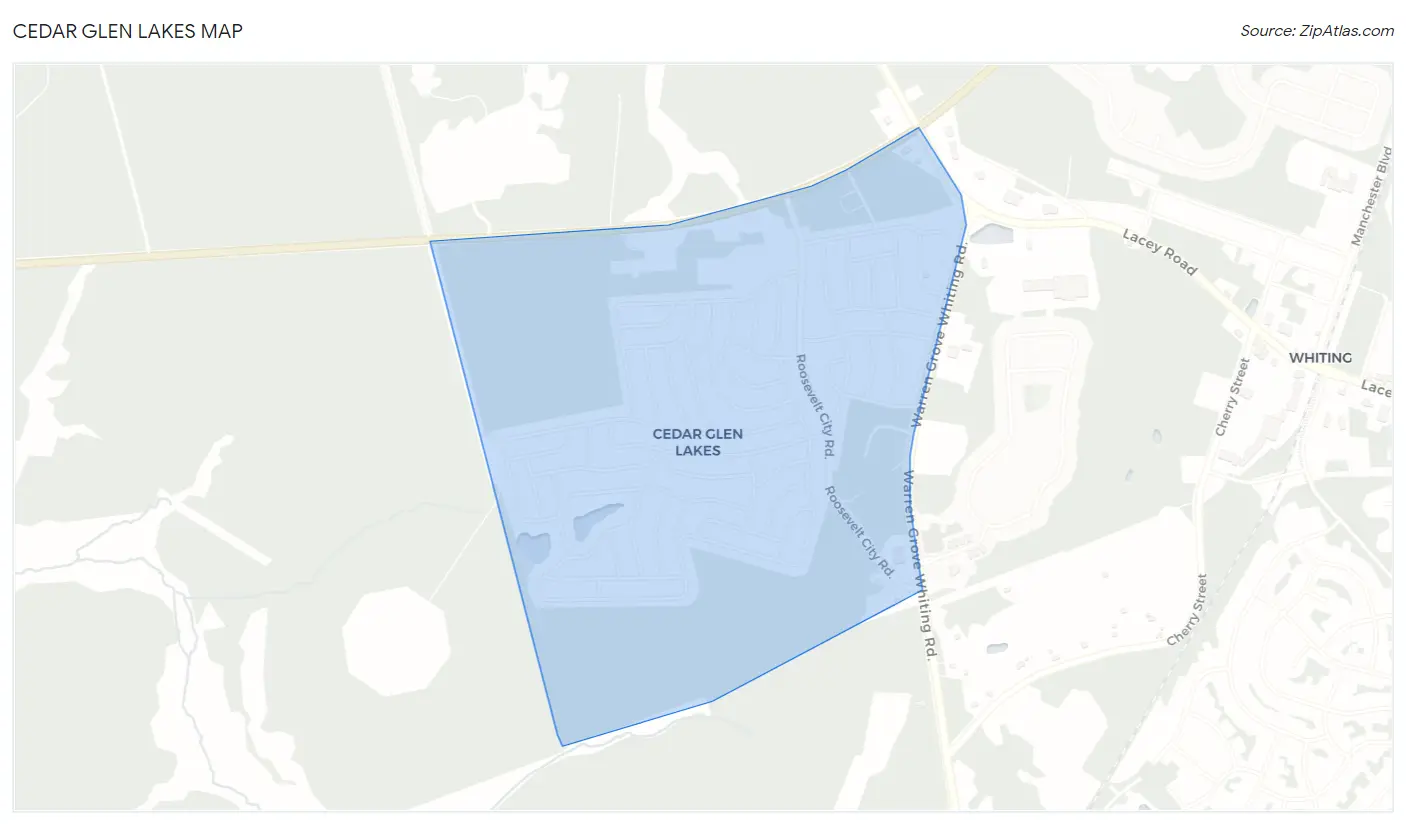
Cedar Glen Lakes Overview
$32,371
PER CAPITA INCOME
$51,250
AVG FAMILY INCOME
$38,171
AVG HOUSEHOLD INCOME
0.37
INEQUALITY / GINI INDEX
1,461
TOTAL POPULATION
561
MALE POPULATION
900
FEMALE POPULATION
62.33
MALES / 100 FEMALES
160.43
FEMALES / 100 MALES
73.1
MEDIAN AGE
2.3
AVG FAMILY SIZE
1.5
AVG HOUSEHOLD SIZE
289
LABOR FORCE [ PEOPLE ]
19.8%
PERCENT IN LABOR FORCE
7.6%
UNEMPLOYMENT RATE
Income in Cedar Glen Lakes
Income Overview in Cedar Glen Lakes
Per Capita Income in Cedar Glen Lakes is $32,371, while median incomes of families and households are $51,250 and $38,171 respectively.
| Characteristic | Number | Measure |
| Per Capita Income | 1,461 | $32,371 |
| Median Family Income | 286 | $51,250 |
| Mean Family Income | 286 | $59,444 |
| Median Household Income | 979 | $38,171 |
| Mean Household Income | 979 | $47,463 |
| Income Deficit | 286 | $0 |
| Wage / Income Gap (%) | 1,461 | 0.00% |
| Wage / Income Gap ($) | 1,461 | 100.00¢ per $1 |
| Gini / Inequality Index | 1,461 | 0.37 |
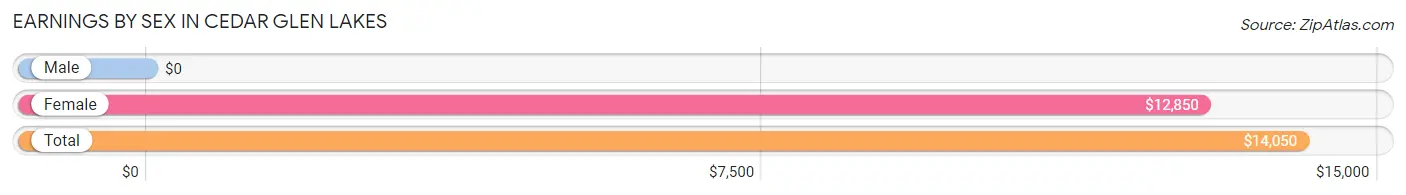
Earnings by Sex in Cedar Glen Lakes
| Sex | Number | Average Earnings |
| Male | 76 (22.3%) | $0 |
| Female | 265 (77.7%) | $12,850 |
| Total | 341 (100.0%) | $14,050 |
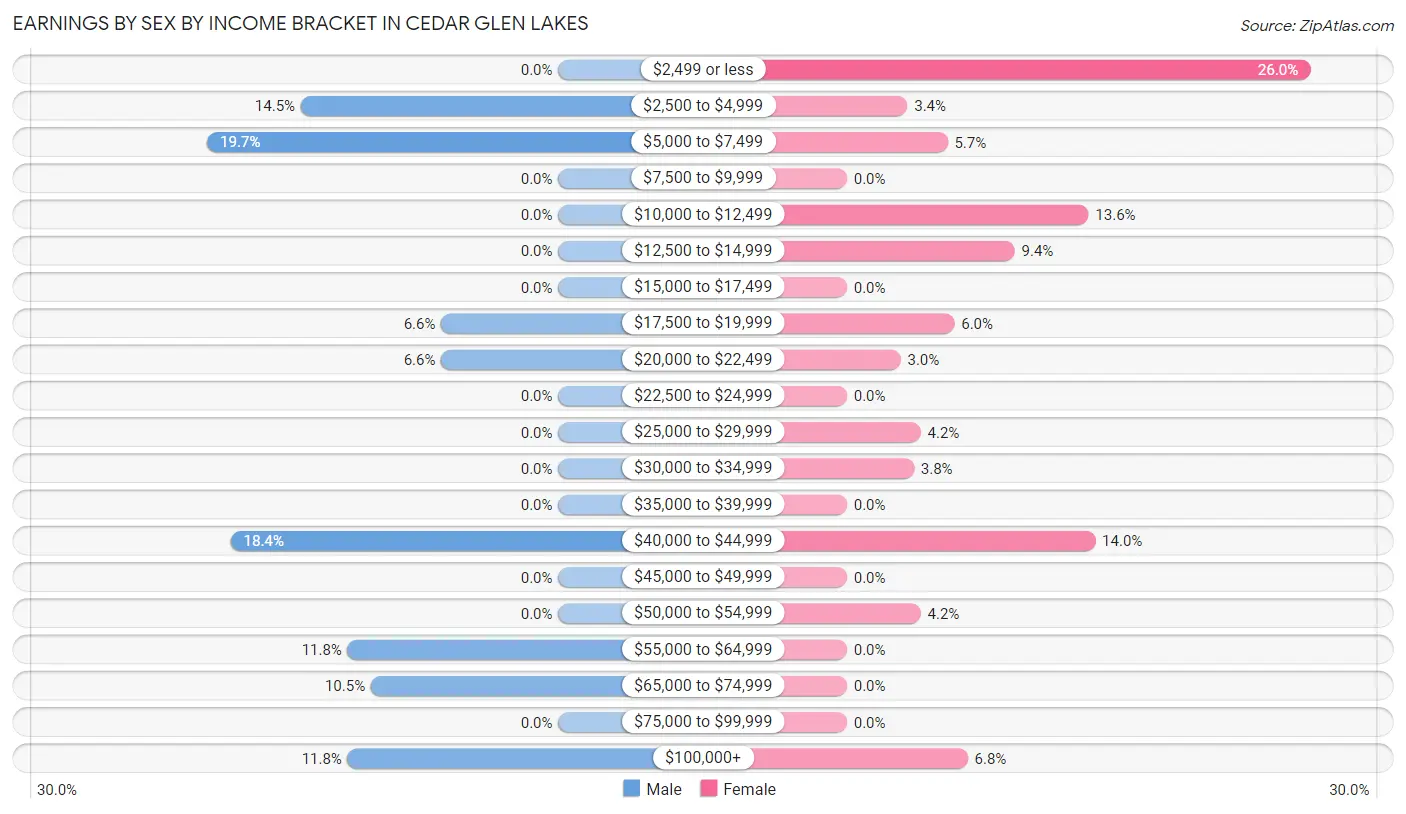
Earnings by Sex by Income Bracket in Cedar Glen Lakes
The most common earnings brackets in Cedar Glen Lakes are $5,000 to $7,499 for men (15 | 19.7%) and $2,499 or less for women (69 | 26.0%).
| Income | Male | Female |
| $2,499 or less | 0 (0.0%) | 69 (26.0%) |
| $2,500 to $4,999 | 11 (14.5%) | 9 (3.4%) |
| $5,000 to $7,499 | 15 (19.7%) | 15 (5.7%) |
| $7,500 to $9,999 | 0 (0.0%) | 0 (0.0%) |
| $10,000 to $12,499 | 0 (0.0%) | 36 (13.6%) |
| $12,500 to $14,999 | 0 (0.0%) | 25 (9.4%) |
| $15,000 to $17,499 | 0 (0.0%) | 0 (0.0%) |
| $17,500 to $19,999 | 5 (6.6%) | 16 (6.0%) |
| $20,000 to $22,499 | 5 (6.6%) | 8 (3.0%) |
| $22,500 to $24,999 | 0 (0.0%) | 0 (0.0%) |
| $25,000 to $29,999 | 0 (0.0%) | 11 (4.2%) |
| $30,000 to $34,999 | 0 (0.0%) | 10 (3.8%) |
| $35,000 to $39,999 | 0 (0.0%) | 0 (0.0%) |
| $40,000 to $44,999 | 14 (18.4%) | 37 (14.0%) |
| $45,000 to $49,999 | 0 (0.0%) | 0 (0.0%) |
| $50,000 to $54,999 | 0 (0.0%) | 11 (4.2%) |
| $55,000 to $64,999 | 9 (11.8%) | 0 (0.0%) |
| $65,000 to $74,999 | 8 (10.5%) | 0 (0.0%) |
| $75,000 to $99,999 | 0 (0.0%) | 0 (0.0%) |
| $100,000+ | 9 (11.8%) | 18 (6.8%) |
| Total | 76 (100.0%) | 265 (100.0%) |
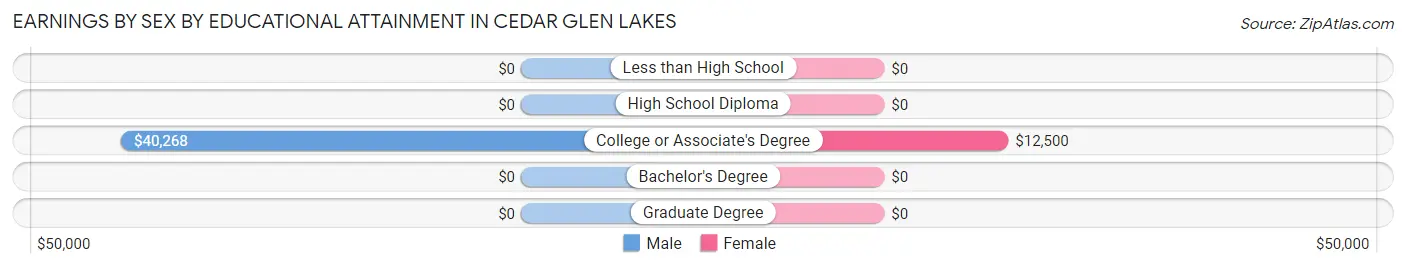
Earnings by Sex by Educational Attainment in Cedar Glen Lakes
Average earnings in Cedar Glen Lakes are $41,339 for men and $12,850 for women, a difference of 68.9%. Men with an educational attainment of college or associate's degree enjoy the highest average annual earnings of $40,268, while those with college or associate's degree education earn the least with $40,268. Women with an educational attainment of college or associate's degree earn the most with the average annual earnings of $12,500, while those with college or associate's degree education have the smallest earnings of $12,500.
| Educational Attainment | Male Income | Female Income |
| Less than High School | - | - |
| High School Diploma | - | - |
| College or Associate's Degree | $40,268 | $12,500 |
| Bachelor's Degree | - | - |
| Graduate Degree | - | - |
| Total | $41,339 | $12,850 |
Family Income in Cedar Glen Lakes
Family Income Brackets in Cedar Glen Lakes
According to the Cedar Glen Lakes family income data, there are 75 families falling into the $15,000 to $24,999 income range, which is the most common income bracket and makes up 26.2% of all families.
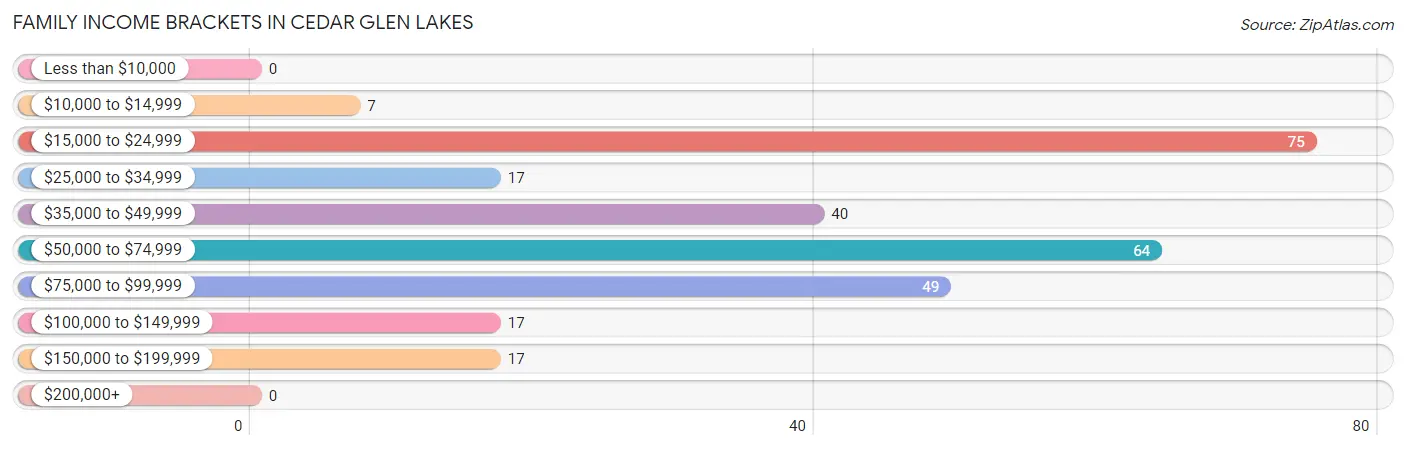
| Income Bracket | # Families | % Families |
| Less than $10,000 | 0 | 0.0% |
| $10,000 to $14,999 | 7 | 2.4% |
| $15,000 to $24,999 | 75 | 26.2% |
| $25,000 to $34,999 | 17 | 5.9% |
| $35,000 to $49,999 | 40 | 14.0% |
| $50,000 to $74,999 | 64 | 22.4% |
| $75,000 to $99,999 | 49 | 17.1% |
| $100,000 to $149,999 | 17 | 5.9% |
| $150,000 to $199,999 | 17 | 5.9% |
| $200,000+ | 0 | 0.0% |
Family Income by Famaliy Size in Cedar Glen Lakes
2-person families (263 | 92.0%) account for the highest median family income in Cedar Glen Lakes with $46,328 per family, while 2-person families (263 | 92.0%) have the highest median income of $23,164 per family member.
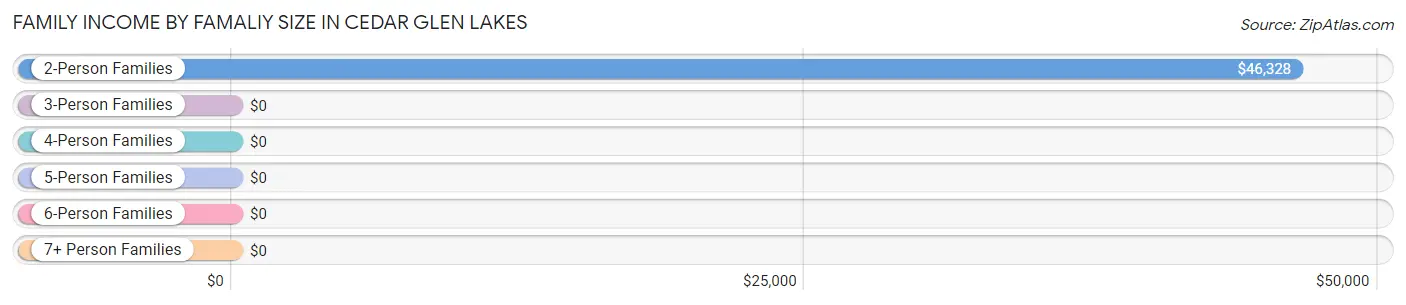
| Income Bracket | # Families | Median Income |
| 2-Person Families | 263 (92.0%) | $46,328 |
| 3-Person Families | 14 (4.9%) | $0 |
| 4-Person Families | 9 (3.2%) | $0 |
| 5-Person Families | 0 (0.0%) | $0 |
| 6-Person Families | 0 (0.0%) | $0 |
| 7+ Person Families | 0 (0.0%) | $0 |
| Total | 286 (100.0%) | $51,250 |
Family Income by Number of Earners in Cedar Glen Lakes
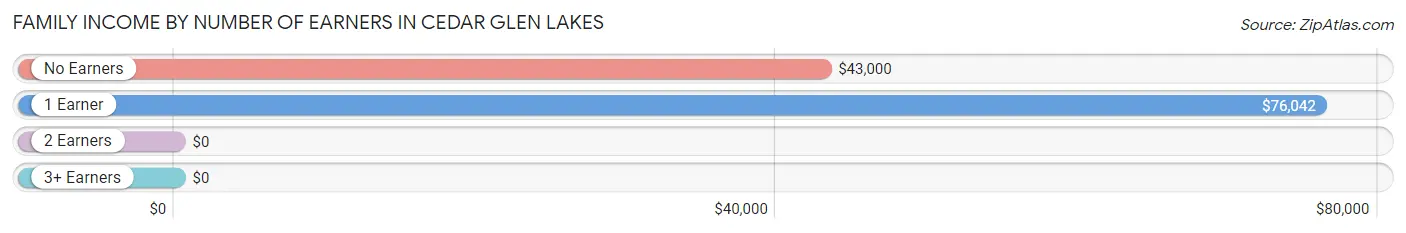
| Number of Earners | # Families | Median Income |
| No Earners | 218 (76.2%) | $43,000 |
| 1 Earner | 45 (15.7%) | $76,042 |
| 2 Earners | 17 (5.9%) | $0 |
| 3+ Earners | 6 (2.1%) | $0 |
| Total | 286 (100.0%) | $51,250 |
Household Income in Cedar Glen Lakes
Household Income Brackets in Cedar Glen Lakes
With 216 households falling in the category, the $15,000 to $24,999 income range is the most frequent in Cedar Glen Lakes, accounting for 22.1% of all households. In contrast, only 13 households (1.3%) fall into the $200,000+ income bracket, making it the least populous group.
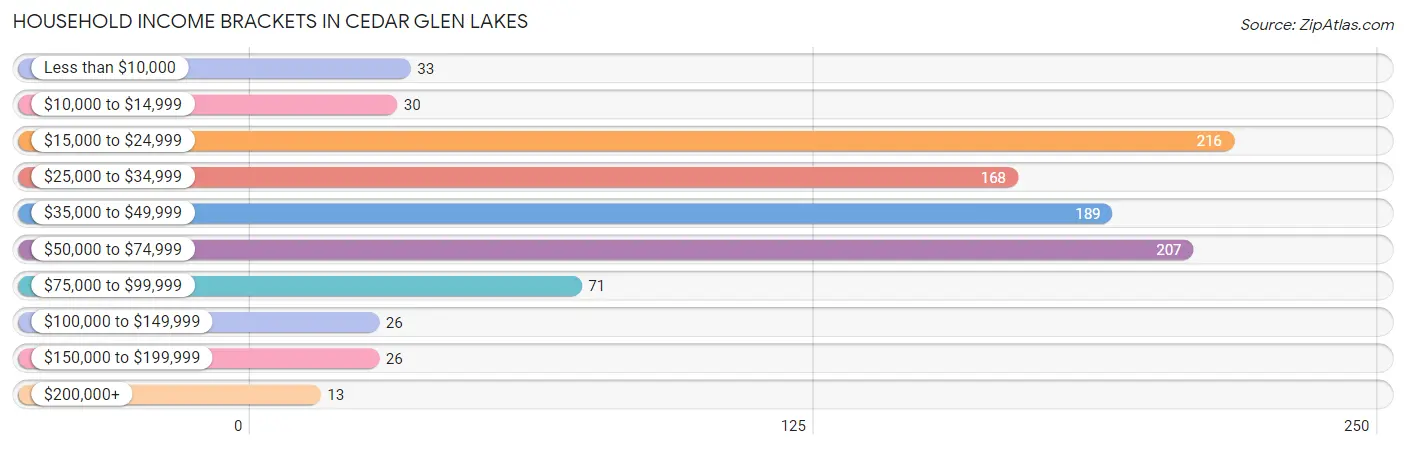
| Income Bracket | # Households | % Households |
| Less than $10,000 | 33 | 3.4% |
| $10,000 to $14,999 | 30 | 3.1% |
| $15,000 to $24,999 | 216 | 22.1% |
| $25,000 to $34,999 | 168 | 17.2% |
| $35,000 to $49,999 | 189 | 19.3% |
| $50,000 to $74,999 | 207 | 21.1% |
| $75,000 to $99,999 | 71 | 7.3% |
| $100,000 to $149,999 | 26 | 2.7% |
| $150,000 to $199,999 | 26 | 2.7% |
| $200,000+ | 13 | 1.3% |
Household Income by Householder Age in Cedar Glen Lakes
The median household income in Cedar Glen Lakes is $38,171, with the highest median household income of $50,481 found in the 45 to 64 years age bracket for the primary householder. A total of 135 households (13.8%) fall into this category.
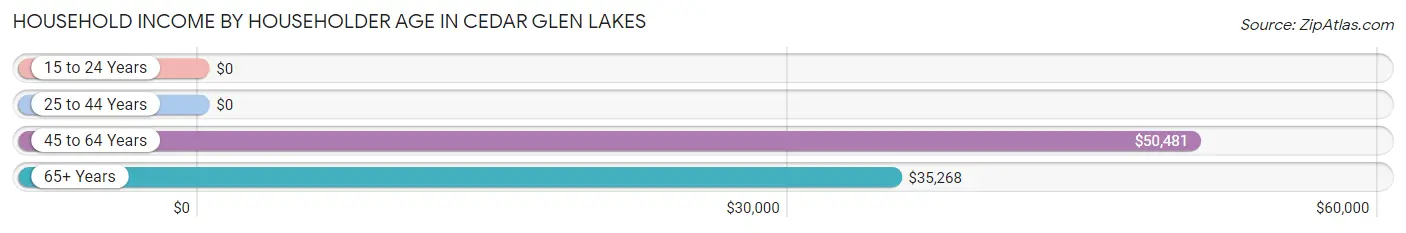
| Income Bracket | # Households | Median Income |
| 15 to 24 Years | 0 (0.0%) | $0 |
| 25 to 44 Years | 0 (0.0%) | $0 |
| 45 to 64 Years | 135 (13.8%) | $50,481 |
| 65+ Years | 844 (86.2%) | $35,268 |
| Total | 979 (100.0%) | $38,171 |
Poverty in Cedar Glen Lakes
Income Below Poverty by Sex and Age in Cedar Glen Lakes
With 6.2% poverty level for males and 9.1% for females among the residents of Cedar Glen Lakes, 65 to 74 year old males and 55 to 64 year old females are the most vulnerable to poverty, with 19 males (14.8%) and 20 females (13.6%) in their respective age groups living below the poverty level.
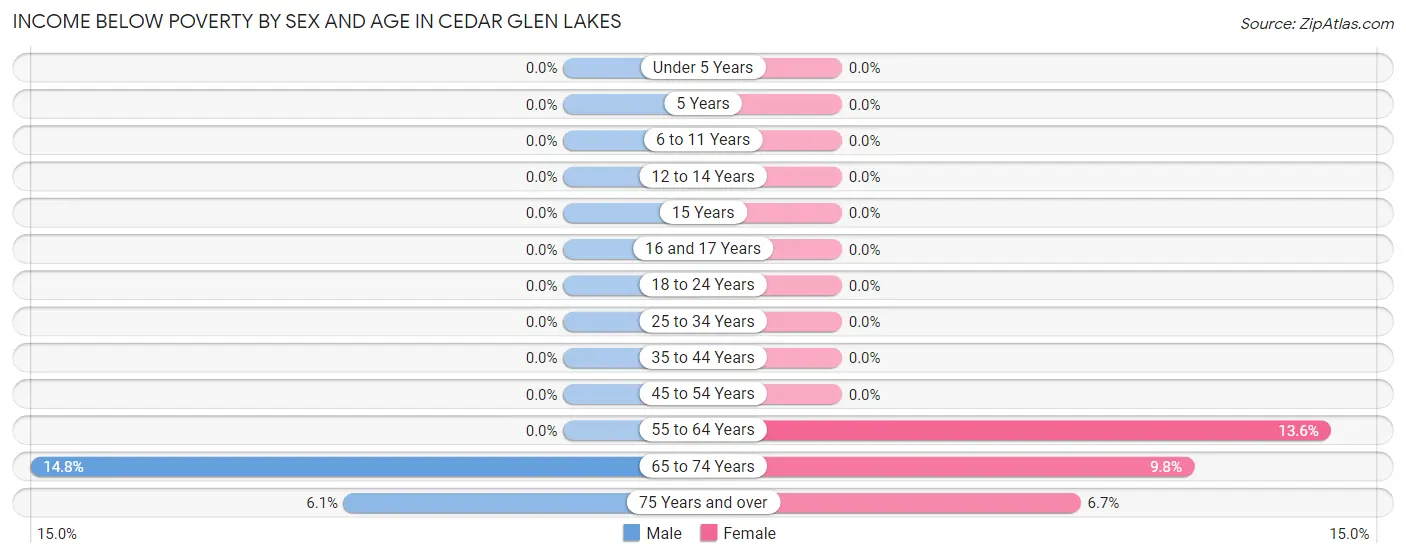
| Age Bracket | Male | Female |
| Under 5 Years | 0 (0.0%) | 0 (0.0%) |
| 5 Years | 0 (0.0%) | 0 (0.0%) |
| 6 to 11 Years | 0 (0.0%) | 0 (0.0%) |
| 12 to 14 Years | 0 (0.0%) | 0 (0.0%) |
| 15 Years | 0 (0.0%) | 0 (0.0%) |
| 16 and 17 Years | 0 (0.0%) | 0 (0.0%) |
| 18 to 24 Years | 0 (0.0%) | 0 (0.0%) |
| 25 to 34 Years | 0 (0.0%) | 0 (0.0%) |
| 35 to 44 Years | 0 (0.0%) | 0 (0.0%) |
| 45 to 54 Years | 0 (0.0%) | 0 (0.0%) |
| 55 to 64 Years | 0 (0.0%) | 20 (13.6%) |
| 65 to 74 Years | 19 (14.8%) | 39 (9.8%) |
| 75 Years and over | 16 (6.1%) | 23 (6.7%) |
| Total | 35 (6.2%) | 82 (9.1%) |
Income Above Poverty by Sex and Age in Cedar Glen Lakes
According to the poverty statistics in Cedar Glen Lakes, males aged 18 to 24 years and females aged 45 to 54 years are the age groups that are most secure financially, with 100.0% of males and 100.0% of females in these age groups living above the poverty line.
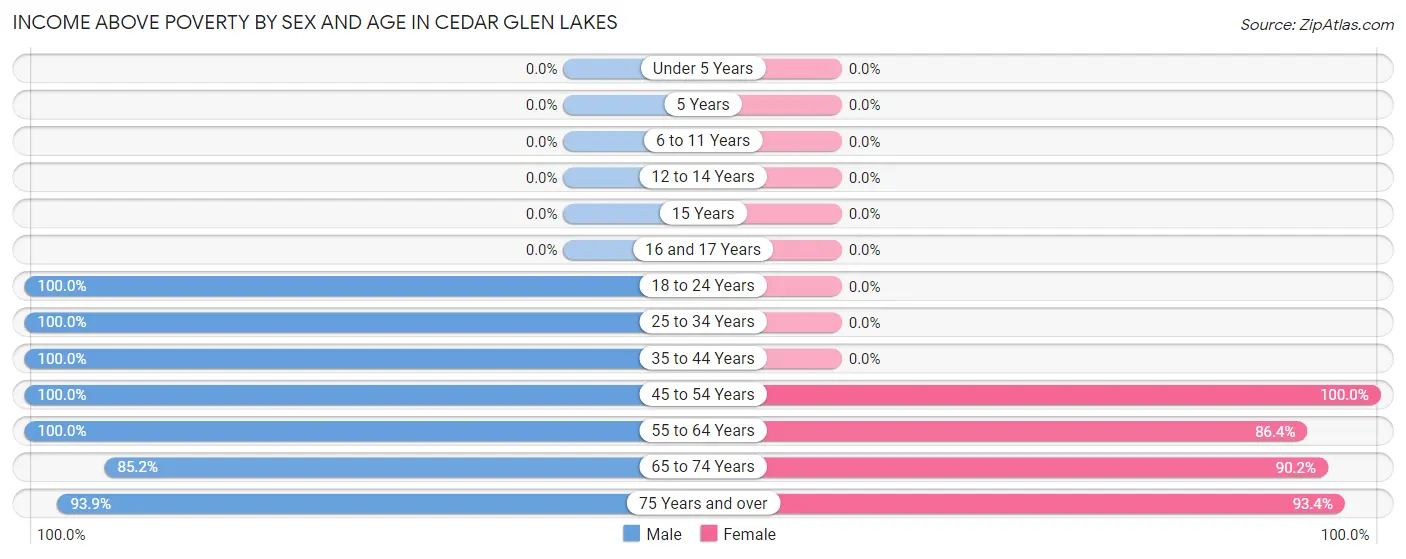
| Age Bracket | Male | Female |
| Under 5 Years | 0 (0.0%) | 0 (0.0%) |
| 5 Years | 0 (0.0%) | 0 (0.0%) |
| 6 to 11 Years | 0 (0.0%) | 0 (0.0%) |
| 12 to 14 Years | 0 (0.0%) | 0 (0.0%) |
| 15 Years | 0 (0.0%) | 0 (0.0%) |
| 16 and 17 Years | 0 (0.0%) | 0 (0.0%) |
| 18 to 24 Years | 22 (100.0%) | 0 (0.0%) |
| 25 to 34 Years | 14 (100.0%) | 0 (0.0%) |
| 35 to 44 Years | 14 (100.0%) | 0 (0.0%) |
| 45 to 54 Years | 73 (100.0%) | 9 (100.0%) |
| 55 to 64 Years | 48 (100.0%) | 127 (86.4%) |
| 65 to 74 Years | 109 (85.2%) | 359 (90.2%) |
| 75 Years and over | 246 (93.9%) | 323 (93.3%) |
| Total | 526 (93.8%) | 818 (90.9%) |
Income Below Poverty Among Married-Couple Families in Cedar Glen Lakes
The poverty statistics for married-couple families in Cedar Glen Lakes show that 3.3% or 7 of the total 214 families live below the poverty line. Families with no children have the highest poverty rate of 3.3%, comprising of 7 families. On the other hand, families with no children have the lowest poverty rate of 3.3%, which includes 7 families.
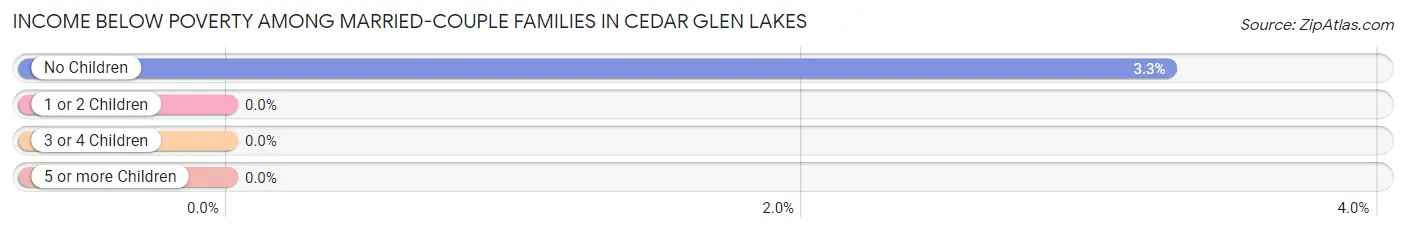
| Children | Above Poverty | Below Poverty |
| No Children | 207 (96.7%) | 7 (3.3%) |
| 1 or 2 Children | 0 (0.0%) | 0 (0.0%) |
| 3 or 4 Children | 0 (0.0%) | 0 (0.0%) |
| 5 or more Children | 0 (0.0%) | 0 (0.0%) |
| Total | 207 (96.7%) | 7 (3.3%) |
Income Below Poverty Among Single-Parent Households in Cedar Glen Lakes
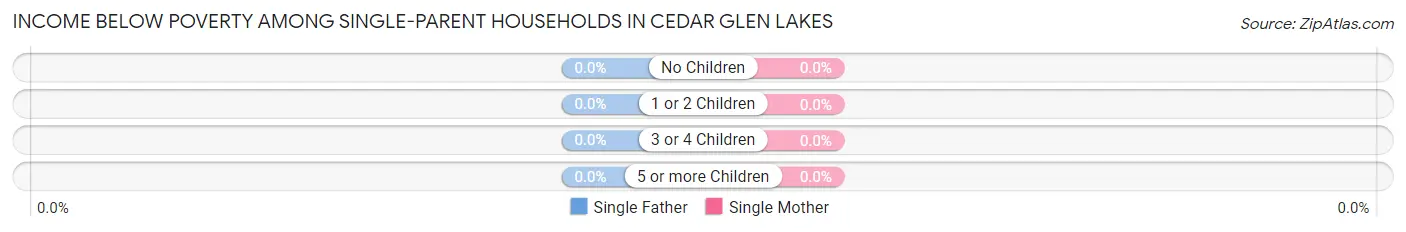
| Children | Single Father | Single Mother |
| No Children | 0 (0.0%) | 0 (0.0%) |
| 1 or 2 Children | 0 (0.0%) | 0 (0.0%) |
| 3 or 4 Children | 0 (0.0%) | 0 (0.0%) |
| 5 or more Children | 0 (0.0%) | 0 (0.0%) |
| Total | 0 (0.0%) | 0 (0.0%) |
Income Below Poverty Among Married-Couple vs Single-Parent Households in Cedar Glen Lakes
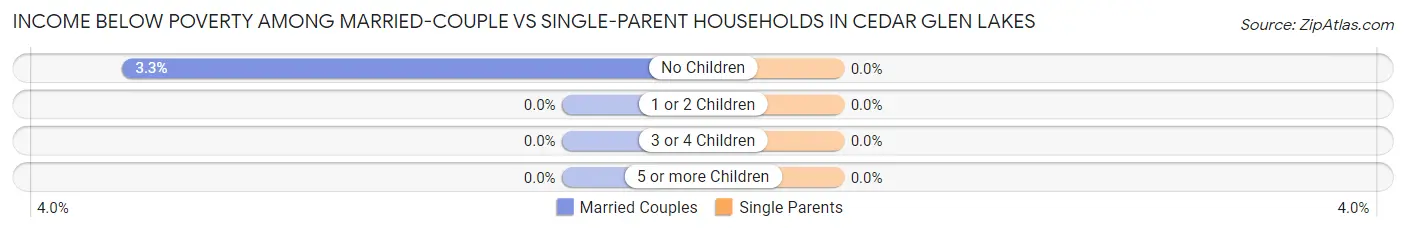
| Children | Married-Couple Families | Single-Parent Households |
| No Children | 7 (3.3%) | 0 (0.0%) |
| 1 or 2 Children | 0 (0.0%) | 0 (0.0%) |
| 3 or 4 Children | 0 (0.0%) | 0 (0.0%) |
| 5 or more Children | 0 (0.0%) | 0 (0.0%) |
| Total | 7 (3.3%) | 0 (0.0%) |
Race in Cedar Glen Lakes
The most populous races in Cedar Glen Lakes are White / Caucasian (1,351 | 92.5%), Hispanic or Latino (60 | 4.1%), and Some other Race (53 | 3.6%).
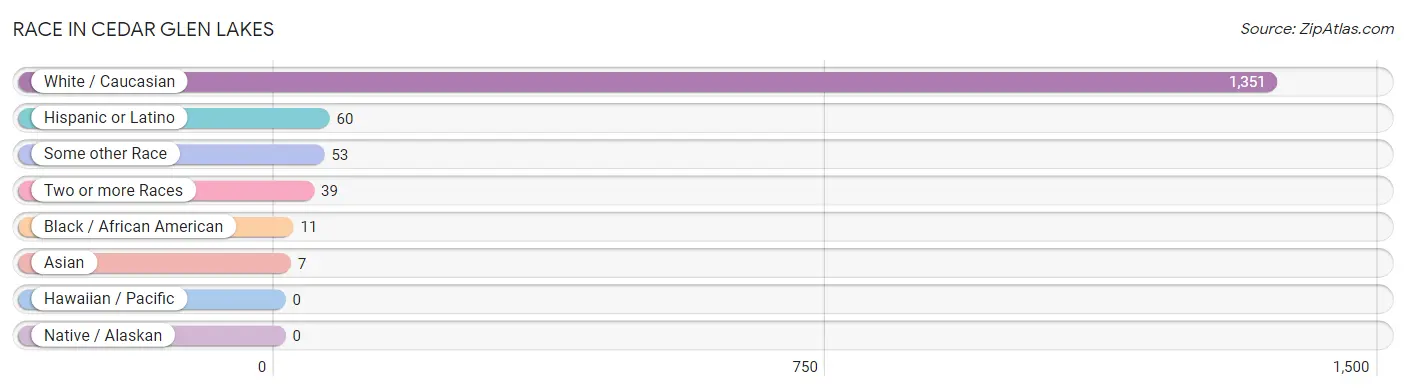
| Race | # Population | % Population |
| Asian | 7 | 0.5% |
| Black / African American | 11 | 0.7% |
| Hawaiian / Pacific | 0 | 0.0% |
| Hispanic or Latino | 60 | 4.1% |
| Native / Alaskan | 0 | 0.0% |
| White / Caucasian | 1,351 | 92.5% |
| Two or more Races | 39 | 2.7% |
| Some other Race | 53 | 3.6% |
| Total | 1,461 | 100.0% |
Ancestry in Cedar Glen Lakes
The most populous ancestries reported in Cedar Glen Lakes are Irish (361 | 24.7%), Italian (270 | 18.5%), German (218 | 14.9%), English (187 | 12.8%), and Polish (147 | 10.1%), together accounting for 81.0% of all Cedar Glen Lakes residents.
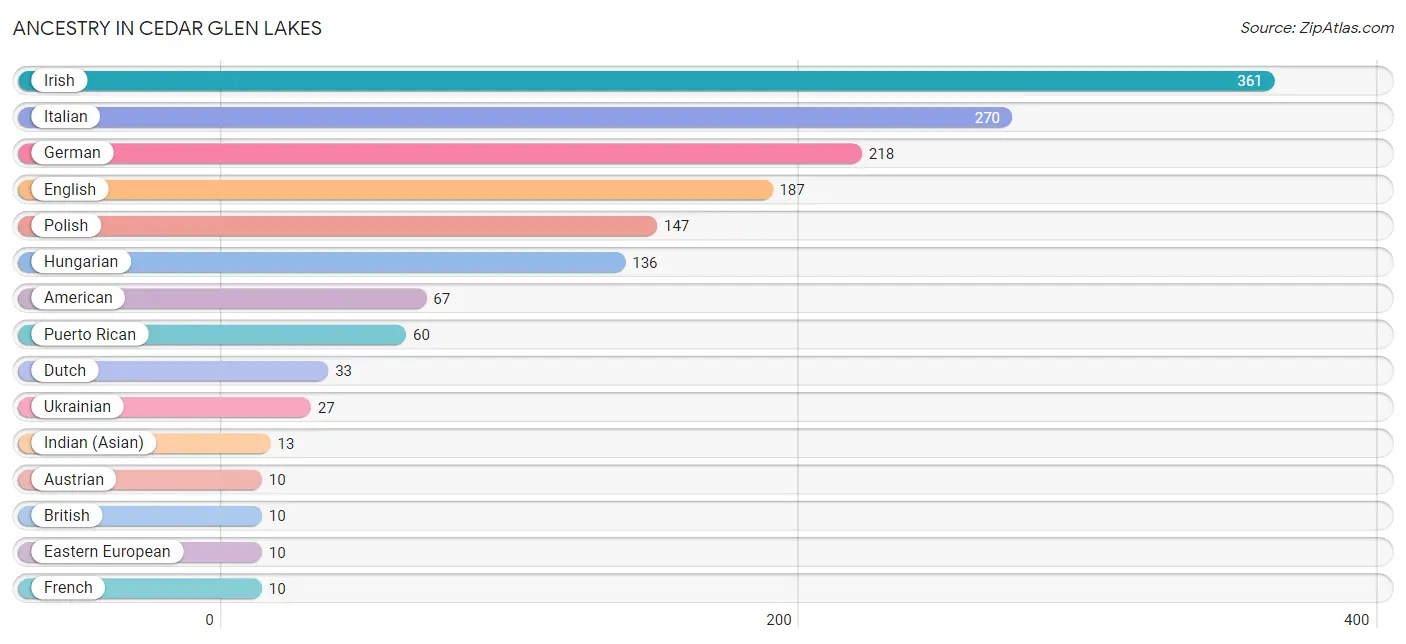
| Ancestry | # Population | % Population |
| American | 67 | 4.6% |
| Australian | 9 | 0.6% |
| Austrian | 10 | 0.7% |
| British | 10 | 0.7% |
| Czech | 8 | 0.5% |
| Dutch | 33 | 2.3% |
| Eastern European | 10 | 0.7% |
| English | 187 | 12.8% |
| Finnish | 8 | 0.5% |
| French | 10 | 0.7% |
| German | 218 | 14.9% |
| Hungarian | 136 | 9.3% |
| Indian (Asian) | 13 | 0.9% |
| Irish | 361 | 24.7% |
| Italian | 270 | 18.5% |
| Korean | 7 | 0.5% |
| Polish | 147 | 10.1% |
| Portuguese | 9 | 0.6% |
| Puerto Rican | 60 | 4.1% |
| Russian | 8 | 0.5% |
| Swedish | 9 | 0.6% |
| Ukrainian | 27 | 1.8% | View All 22 Rows |
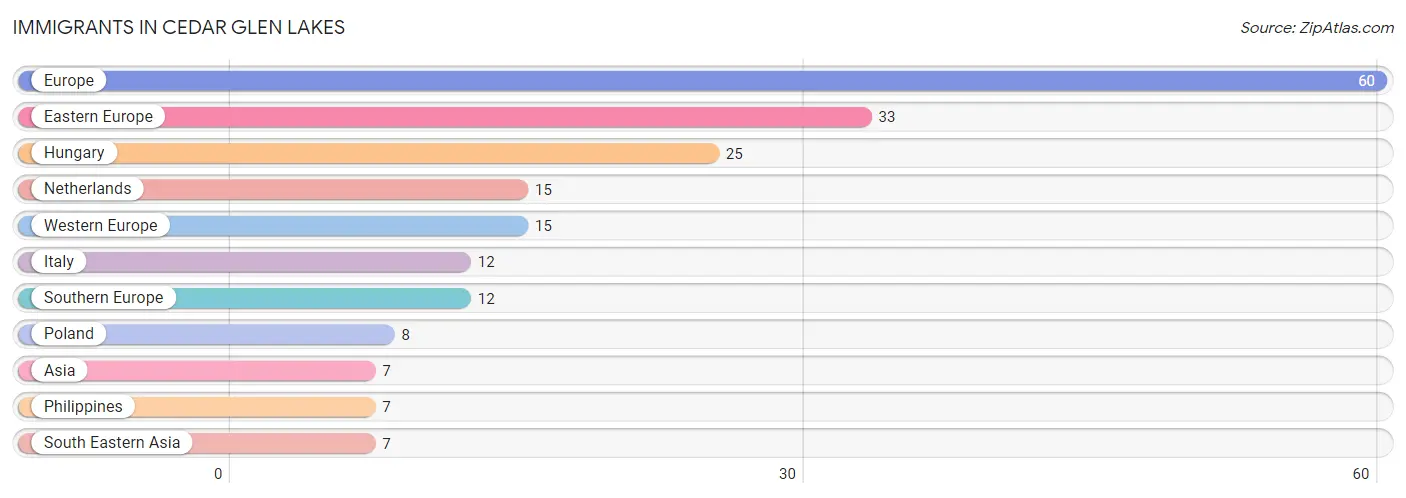
Immigrants in Cedar Glen Lakes
The most numerous immigrant groups reported in Cedar Glen Lakes came from Europe (60 | 4.1%), Eastern Europe (33 | 2.3%), Hungary (25 | 1.7%), Netherlands (15 | 1.0%), and Western Europe (15 | 1.0%), together accounting for 10.1% of all Cedar Glen Lakes residents.
| Immigration Origin | # Population | % Population |
| Asia | 7 | 0.5% |
| Eastern Europe | 33 | 2.3% |
| Europe | 60 | 4.1% |
| Hungary | 25 | 1.7% |
| Italy | 12 | 0.8% |
| Netherlands | 15 | 1.0% |
| Philippines | 7 | 0.5% |
| Poland | 8 | 0.5% |
| South Eastern Asia | 7 | 0.5% |
| Southern Europe | 12 | 0.8% |
| Western Europe | 15 | 1.0% | View All 11 Rows |
Sex and Age in Cedar Glen Lakes
Sex and Age in Cedar Glen Lakes
The most populous age groups in Cedar Glen Lakes are 85 Years and over (143 | 25.5%) for men and 65 to 69 Years (216 | 24.0%) for women.
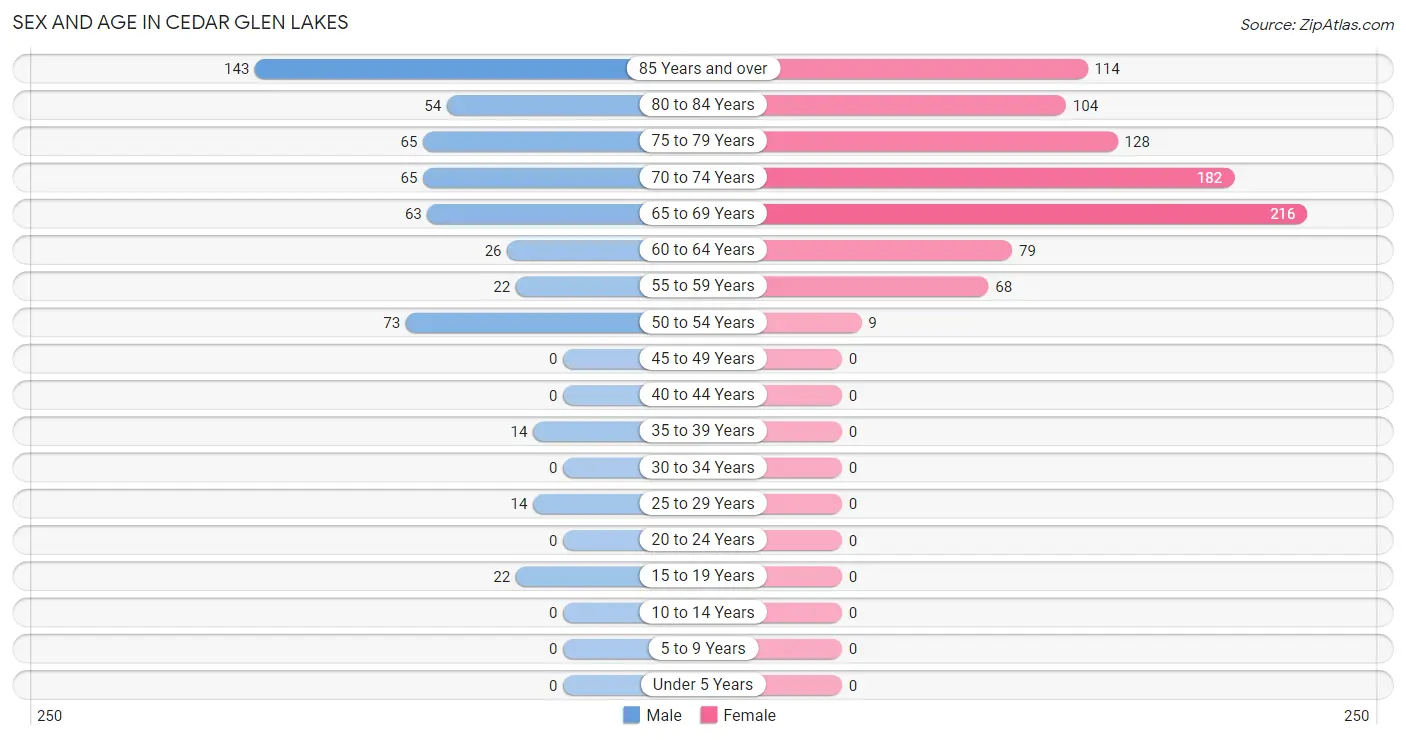
| Age Bracket | Male | Female |
| Under 5 Years | 0 (0.0%) | 0 (0.0%) |
| 5 to 9 Years | 0 (0.0%) | 0 (0.0%) |
| 10 to 14 Years | 0 (0.0%) | 0 (0.0%) |
| 15 to 19 Years | 22 (3.9%) | 0 (0.0%) |
| 20 to 24 Years | 0 (0.0%) | 0 (0.0%) |
| 25 to 29 Years | 14 (2.5%) | 0 (0.0%) |
| 30 to 34 Years | 0 (0.0%) | 0 (0.0%) |
| 35 to 39 Years | 14 (2.5%) | 0 (0.0%) |
| 40 to 44 Years | 0 (0.0%) | 0 (0.0%) |
| 45 to 49 Years | 0 (0.0%) | 0 (0.0%) |
| 50 to 54 Years | 73 (13.0%) | 9 (1.0%) |
| 55 to 59 Years | 22 (3.9%) | 68 (7.6%) |
| 60 to 64 Years | 26 (4.6%) | 79 (8.8%) |
| 65 to 69 Years | 63 (11.2%) | 216 (24.0%) |
| 70 to 74 Years | 65 (11.6%) | 182 (20.2%) |
| 75 to 79 Years | 65 (11.6%) | 128 (14.2%) |
| 80 to 84 Years | 54 (9.6%) | 104 (11.6%) |
| 85 Years and over | 143 (25.5%) | 114 (12.7%) |
| Total | 561 (100.0%) | 900 (100.0%) |
Families and Households in Cedar Glen Lakes
Median Family Size in Cedar Glen Lakes
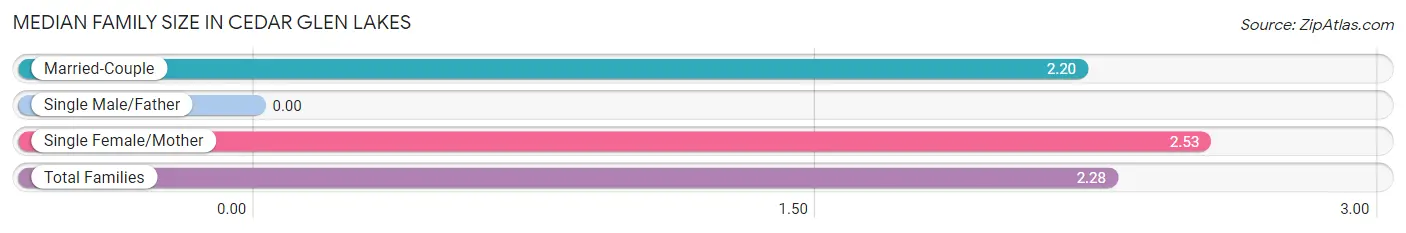
| Family Type | # Families | Family Size |
| Married-Couple | 214 (74.8%) | 2.20 |
| Single Male/Father | 0 (0.0%) | - |
| Single Female/Mother | 72 (25.2%) | 2.53 |
| Total Families | 286 (100.0%) | 2.28 |
Median Household Size in Cedar Glen Lakes
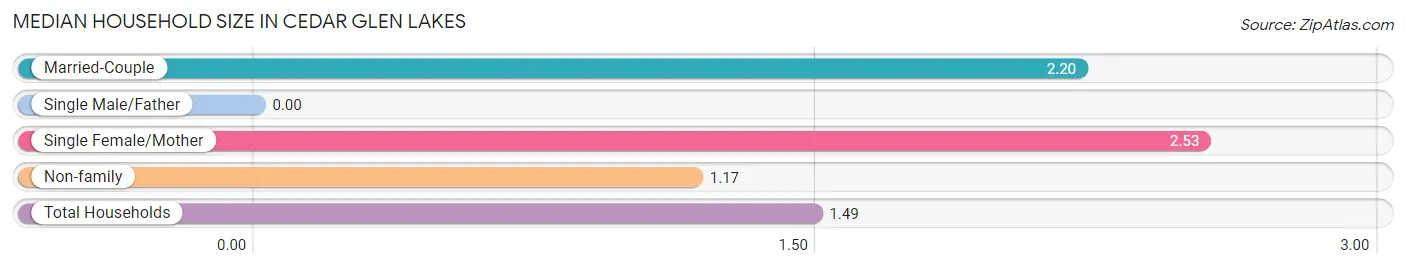
| Household Type | # Households | Household Size |
| Married-Couple | 214 (21.9%) | 2.20 |
| Single Male/Father | 0 (0.0%) | - |
| Single Female/Mother | 72 (7.3%) | 2.53 |
| Non-family | 693 (70.8%) | 1.17 |
| Total Households | 979 (100.0%) | 1.49 |
Household Size by Marriage Status in Cedar Glen Lakes
Out of a total of 979 households in Cedar Glen Lakes, 286 (29.2%) are family households, while 693 (70.8%) are nonfamily households. The most numerous type of family households are 2-person households, comprising 263, and the most common type of nonfamily households are 1-person households, comprising 594.
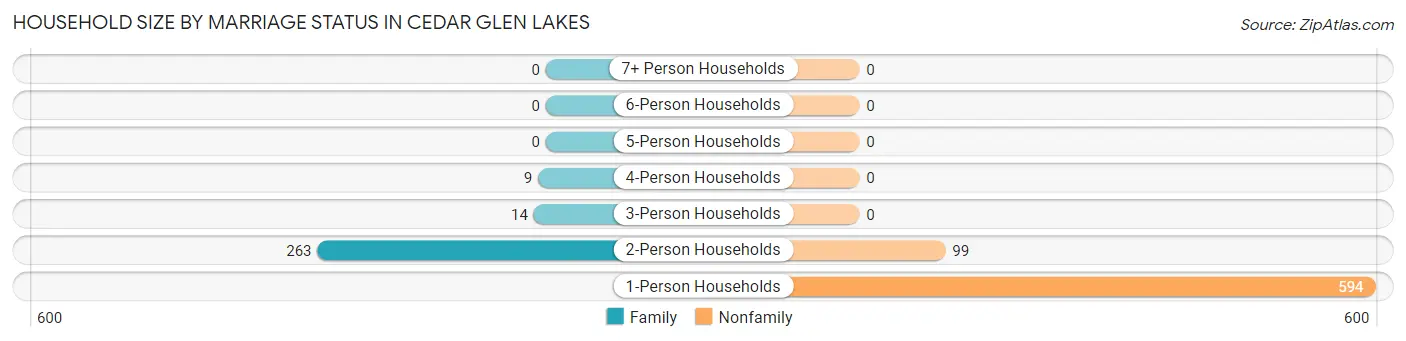
| Household Size | Family Households | Nonfamily Households |
| 1-Person Households | - | 594 (60.7%) |
| 2-Person Households | 263 (26.9%) | 99 (10.1%) |
| 3-Person Households | 14 (1.4%) | 0 (0.0%) |
| 4-Person Households | 9 (0.9%) | 0 (0.0%) |
| 5-Person Households | 0 (0.0%) | 0 (0.0%) |
| 6-Person Households | 0 (0.0%) | 0 (0.0%) |
| 7+ Person Households | 0 (0.0%) | 0 (0.0%) |
| Total | 286 (29.2%) | 693 (70.8%) |
Female Fertility in Cedar Glen Lakes
Fertility by Age in Cedar Glen Lakes
| Age Bracket | Women with Births | Births / 1,000 Women |
| 15 to 19 years | 0 (0.0%) | 0.0 |
| 20 to 34 years | 0 (0.0%) | 0.0 |
| 35 to 50 years | 0 (0.0%) | 0.0 |
| Total | 0 (0.0%) | 0.0 |
Fertility by Age by Marriage Status in Cedar Glen Lakes
| Age Bracket | Married | Unmarried |
| 15 to 19 years | 0 (0.0%) | 0 (0.0%) |
| 20 to 34 years | 0 (0.0%) | 0 (0.0%) |
| 35 to 50 years | 0 (0.0%) | 0 (0.0%) |
| Total | 0 (0.0%) | 0 (0.0%) |
Fertility by Education in Cedar Glen Lakes
| Educational Attainment | Women with Births | Births / 1,000 Women |
| Less than High School | 0 (0.0%) | 0.0 |
| High School Diploma | 0 (0.0%) | 0.0 |
| College or Associate's Degree | 0 (0.0%) | 0.0 |
| Bachelor's Degree | 0 (0.0%) | 0.0 |
| Graduate Degree | 0 (0.0%) | 0.0 |
| Total | 0 (0.0%) | 0.0 |
Fertility by Education by Marriage Status in Cedar Glen Lakes
| Educational Attainment | Married | Unmarried |
| Less than High School | 0 (0.0%) | 0 (0.0%) |
| High School Diploma | 0 (0.0%) | 0 (0.0%) |
| College or Associate's Degree | 0 (0.0%) | 0 (0.0%) |
| Bachelor's Degree | 0 (0.0%) | 0 (0.0%) |
| Graduate Degree | 0 (0.0%) | 0 (0.0%) |
| Total | 0 (0.0%) | 0 (0.0%) |
Employment Characteristics in Cedar Glen Lakes
Employment by Class of Employer in Cedar Glen Lakes
Among the 254 employed individuals in Cedar Glen Lakes, private company employees (181 | 71.3%), federal government employees (39 | 15.3%), and local government employees (28 | 11.0%) make up the most common classes of employment.
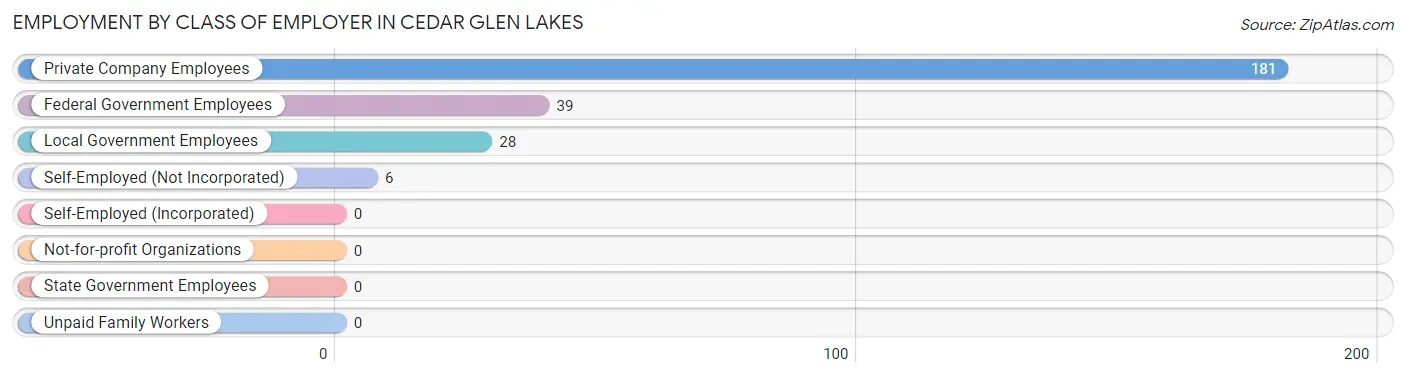
| Employer Class | # Employees | % Employees |
| Private Company Employees | 181 | 71.3% |
| Self-Employed (Incorporated) | 0 | 0.0% |
| Self-Employed (Not Incorporated) | 6 | 2.4% |
| Not-for-profit Organizations | 0 | 0.0% |
| Local Government Employees | 28 | 11.0% |
| State Government Employees | 0 | 0.0% |
| Federal Government Employees | 39 | 15.3% |
| Unpaid Family Workers | 0 | 0.0% |
| Total | 254 | 100.0% |
Employment Status by Age in Cedar Glen Lakes
According to the labor force statistics for Cedar Glen Lakes, out of the total population over 16 years of age (1,461), 19.8% or 289 individuals are in the labor force, with 7.6% or 22 of them unemployed. The age group with the highest labor force participation rate is 25 to 29 years, with 100.0% or 14 individuals in the labor force. Within the labor force, the 60 to 64 years age range has the highest percentage of unemployed individuals, with 37.0% or 10 of them being unemployed.
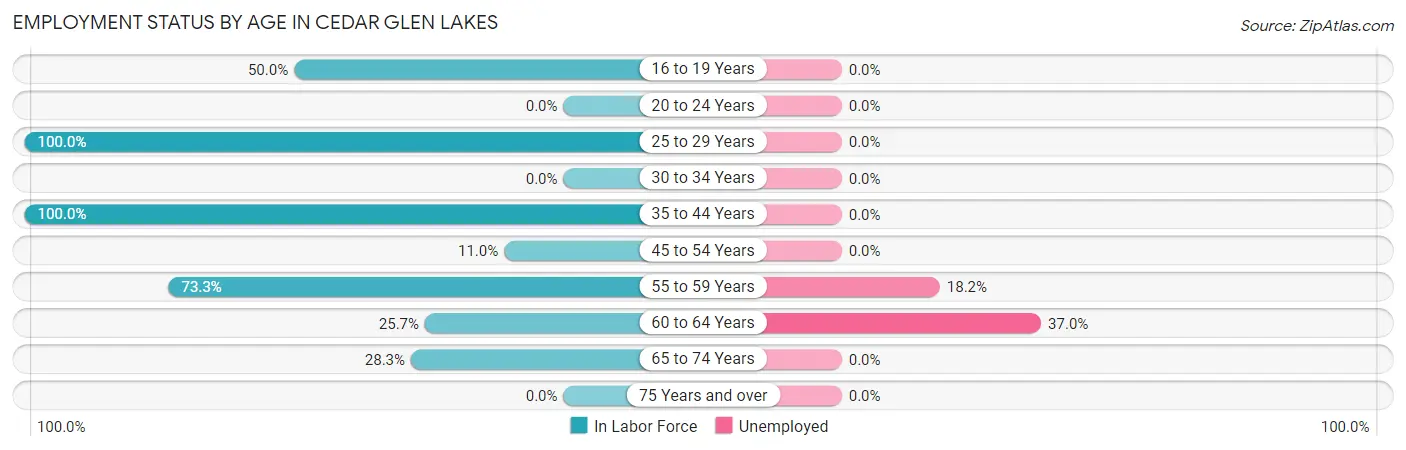
| Age Bracket | In Labor Force | Unemployed |
| 16 to 19 Years | 11 (50.0%) | 0 (0.0%) |
| 20 to 24 Years | 0 (0.0%) | 0 (0.0%) |
| 25 to 29 Years | 14 (100.0%) | 0 (0.0%) |
| 30 to 34 Years | 0 (0.0%) | 0 (0.0%) |
| 35 to 44 Years | 14 (100.0%) | 0 (0.0%) |
| 45 to 54 Years | 9 (11.0%) | 0 (0.0%) |
| 55 to 59 Years | 66 (73.3%) | 12 (18.2%) |
| 60 to 64 Years | 27 (25.7%) | 10 (37.0%) |
| 65 to 74 Years | 149 (28.3%) | 0 (0.0%) |
| 75 Years and over | 0 (0.0%) | 0 (0.0%) |
| Total | 289 (19.8%) | 22 (7.6%) |
Employment Status by Educational Attainment in Cedar Glen Lakes
According to labor force statistics for Cedar Glen Lakes, 42.6% of individuals (130) out of the total population between 25 and 64 years of age (305) are in the labor force, with 16.9% or 22 of them being unemployed. The group with the highest labor force participation rate are those with the educational attainment of less than high school, with 100.0% or 5 individuals in the labor force. Within the labor force, individuals with bachelor's degree or higher education have the highest percentage of unemployment, with 43.8% or 7 of them being unemployed.
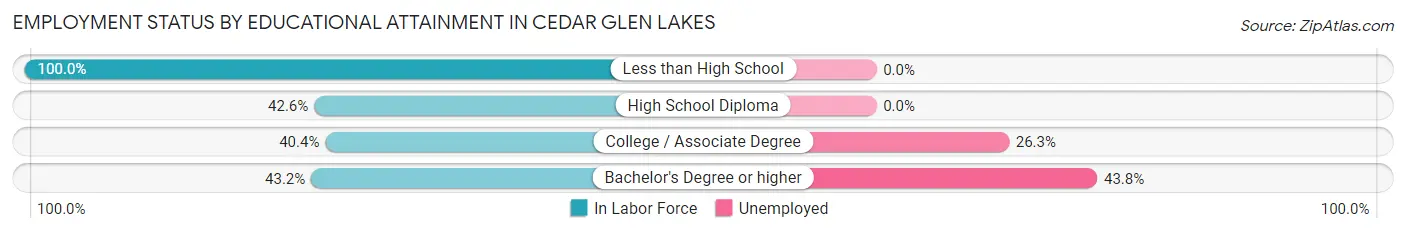
| Educational Attainment | In Labor Force | Unemployed |
| Less than High School | 5 (100.0%) | 0 (0.0%) |
| High School Diploma | 52 (42.6%) | 0 (0.0%) |
| College / Associate Degree | 57 (40.4%) | 37 (26.3%) |
| Bachelor's Degree or higher | 16 (43.2%) | 16 (43.8%) |
| Total | 130 (42.6%) | 52 (16.9%) |
Employment Occupations by Sex in Cedar Glen Lakes
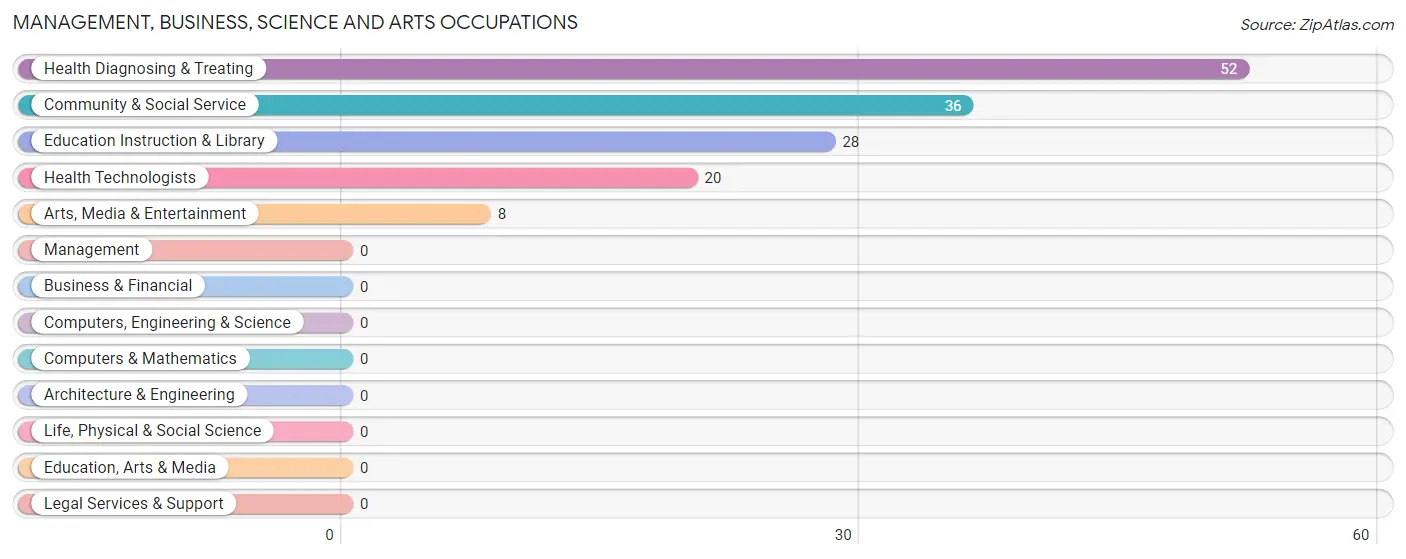
Management, Business, Science and Arts Occupations
The most common Management, Business, Science and Arts occupations in Cedar Glen Lakes are Health Diagnosing & Treating (52 | 19.4%), Community & Social Service (36 | 13.4%), Education Instruction & Library (28 | 10.4%), Health Technologists (20 | 7.5%), and Arts, Media & Entertainment (8 | 3.0%).
Management, Business, Science and Arts Occupations by Sex
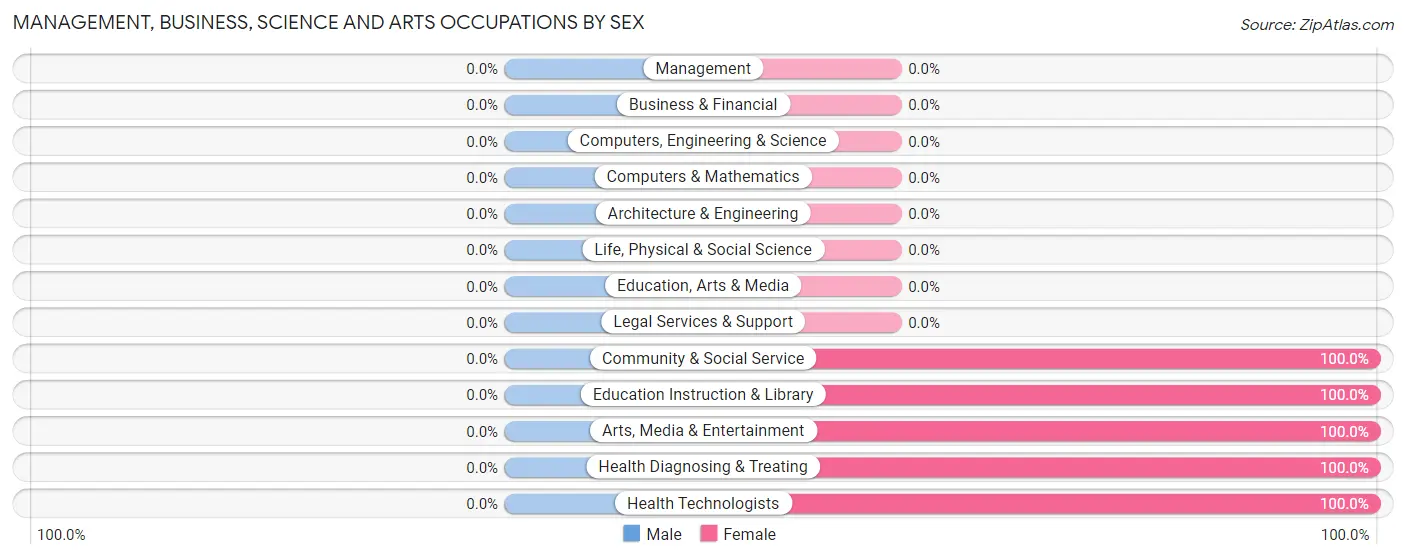
| Occupation | Male | Female |
| Management | 0 (0.0%) | 0 (0.0%) |
| Business & Financial | 0 (0.0%) | 0 (0.0%) |
| Computers, Engineering & Science | 0 (0.0%) | 0 (0.0%) |
| Computers & Mathematics | 0 (0.0%) | 0 (0.0%) |
| Architecture & Engineering | 0 (0.0%) | 0 (0.0%) |
| Life, Physical & Social Science | 0 (0.0%) | 0 (0.0%) |
| Community & Social Service | 0 (0.0%) | 36 (100.0%) |
| Education, Arts & Media | 0 (0.0%) | 0 (0.0%) |
| Legal Services & Support | 0 (0.0%) | 0 (0.0%) |
| Education Instruction & Library | 0 (0.0%) | 28 (100.0%) |
| Arts, Media & Entertainment | 0 (0.0%) | 8 (100.0%) |
| Health Diagnosing & Treating | 0 (0.0%) | 52 (100.0%) |
| Health Technologists | 0 (0.0%) | 20 (100.0%) |
| Total (Category) | 0 (0.0%) | 88 (100.0%) |
| Total (Overall) | 71 (26.5%) | 197 (73.5%) |
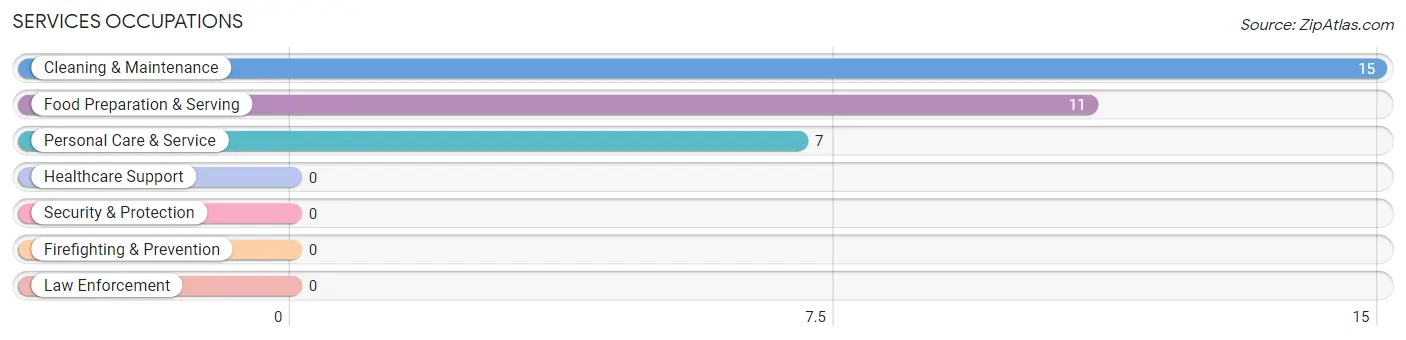
Services Occupations
The most common Services occupations in Cedar Glen Lakes are Cleaning & Maintenance (15 | 5.6%), Food Preparation & Serving (11 | 4.1%), and Personal Care & Service (7 | 2.6%).
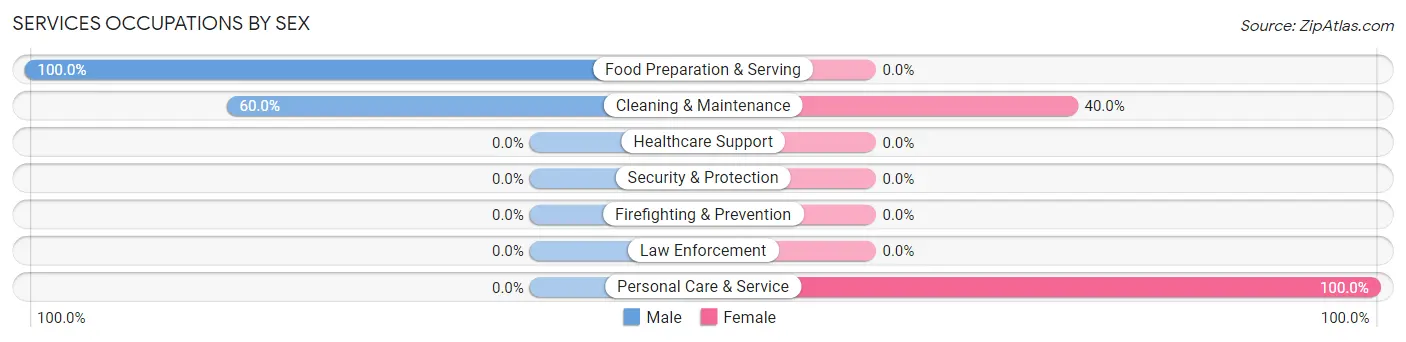
Services Occupations by Sex
Within the Services occupations in Cedar Glen Lakes, the most male-oriented occupations are Food Preparation & Serving (100.0%), and Cleaning & Maintenance (60.0%), while the most female-oriented occupations are Personal Care & Service (100.0%), and Cleaning & Maintenance (40.0%).
| Occupation | Male | Female |
| Healthcare Support | 0 (0.0%) | 0 (0.0%) |
| Security & Protection | 0 (0.0%) | 0 (0.0%) |
| Firefighting & Prevention | 0 (0.0%) | 0 (0.0%) |
| Law Enforcement | 0 (0.0%) | 0 (0.0%) |
| Food Preparation & Serving | 11 (100.0%) | 0 (0.0%) |
| Cleaning & Maintenance | 9 (60.0%) | 6 (40.0%) |
| Personal Care & Service | 0 (0.0%) | 7 (100.0%) |
| Total (Category) | 20 (60.6%) | 13 (39.4%) |
| Total (Overall) | 71 (26.5%) | 197 (73.5%) |
Sales and Office Occupations
The most common Sales and Office occupations in Cedar Glen Lakes are Sales & Related (44 | 16.4%), and Office & Administration (11 | 4.1%).
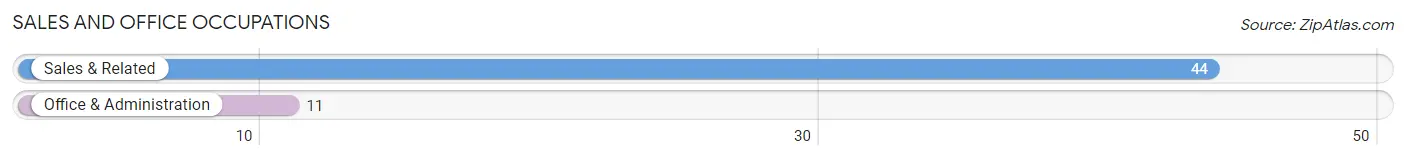
Sales and Office Occupations by Sex
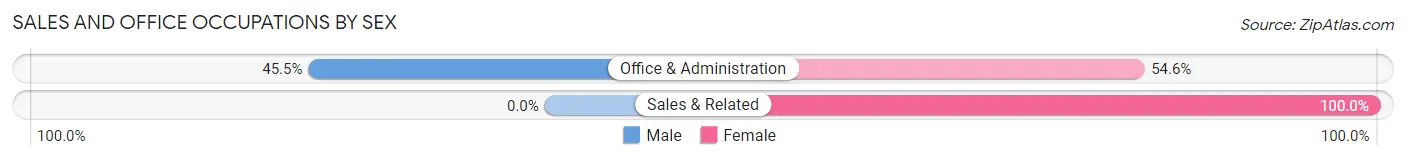
| Occupation | Male | Female |
| Sales & Related | 0 (0.0%) | 44 (100.0%) |
| Office & Administration | 5 (45.5%) | 6 (54.5%) |
| Total (Category) | 5 (9.1%) | 50 (90.9%) |
| Total (Overall) | 71 (26.5%) | 197 (73.5%) |
Natural Resources, Construction and Maintenance Occupations
The most common Natural Resources, Construction and Maintenance occupations in Cedar Glen Lakes are Installation, Maintenance & Repair (15 | 5.6%), and Construction & Extraction (9 | 3.4%).
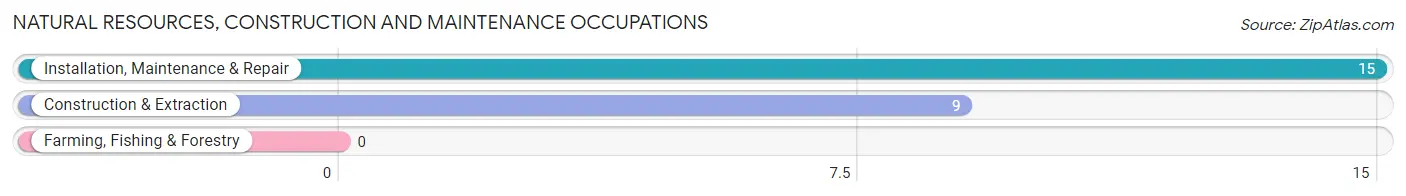
Natural Resources, Construction and Maintenance Occupations by Sex
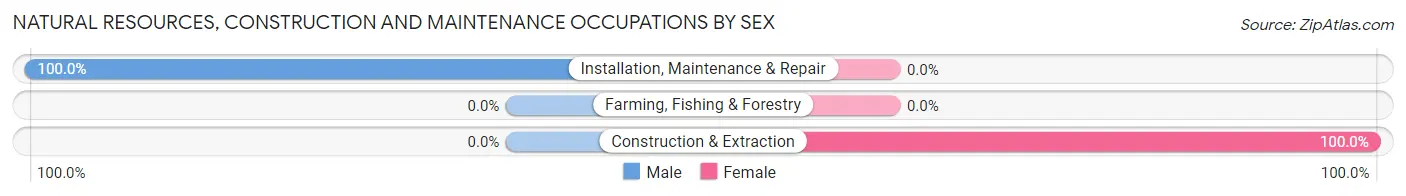
| Occupation | Male | Female |
| Farming, Fishing & Forestry | 0 (0.0%) | 0 (0.0%) |
| Construction & Extraction | 0 (0.0%) | 9 (100.0%) |
| Installation, Maintenance & Repair | 15 (100.0%) | 0 (0.0%) |
| Total (Category) | 15 (62.5%) | 9 (37.5%) |
| Total (Overall) | 71 (26.5%) | 197 (73.5%) |
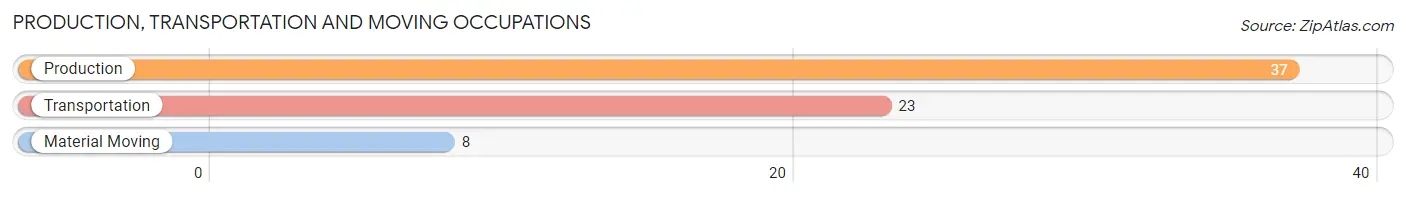
Production, Transportation and Moving Occupations
The most common Production, Transportation and Moving occupations in Cedar Glen Lakes are Production (37 | 13.8%), Transportation (23 | 8.6%), and Material Moving (8 | 3.0%).
Production, Transportation and Moving Occupations by Sex
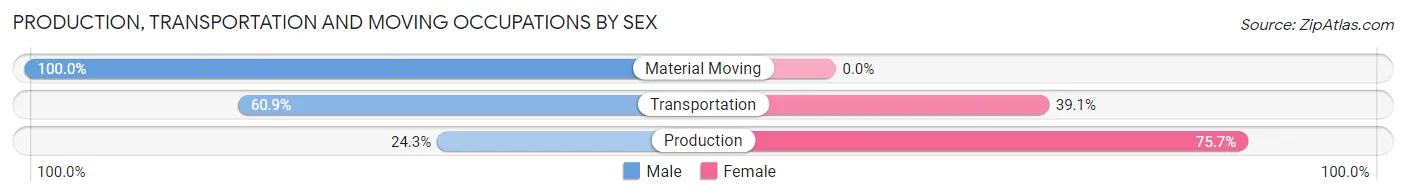
| Occupation | Male | Female |
| Production | 9 (24.3%) | 28 (75.7%) |
| Transportation | 14 (60.9%) | 9 (39.1%) |
| Material Moving | 8 (100.0%) | 0 (0.0%) |
| Total (Category) | 31 (45.6%) | 37 (54.4%) |
| Total (Overall) | 71 (26.5%) | 197 (73.5%) |
Employment Industries by Sex in Cedar Glen Lakes
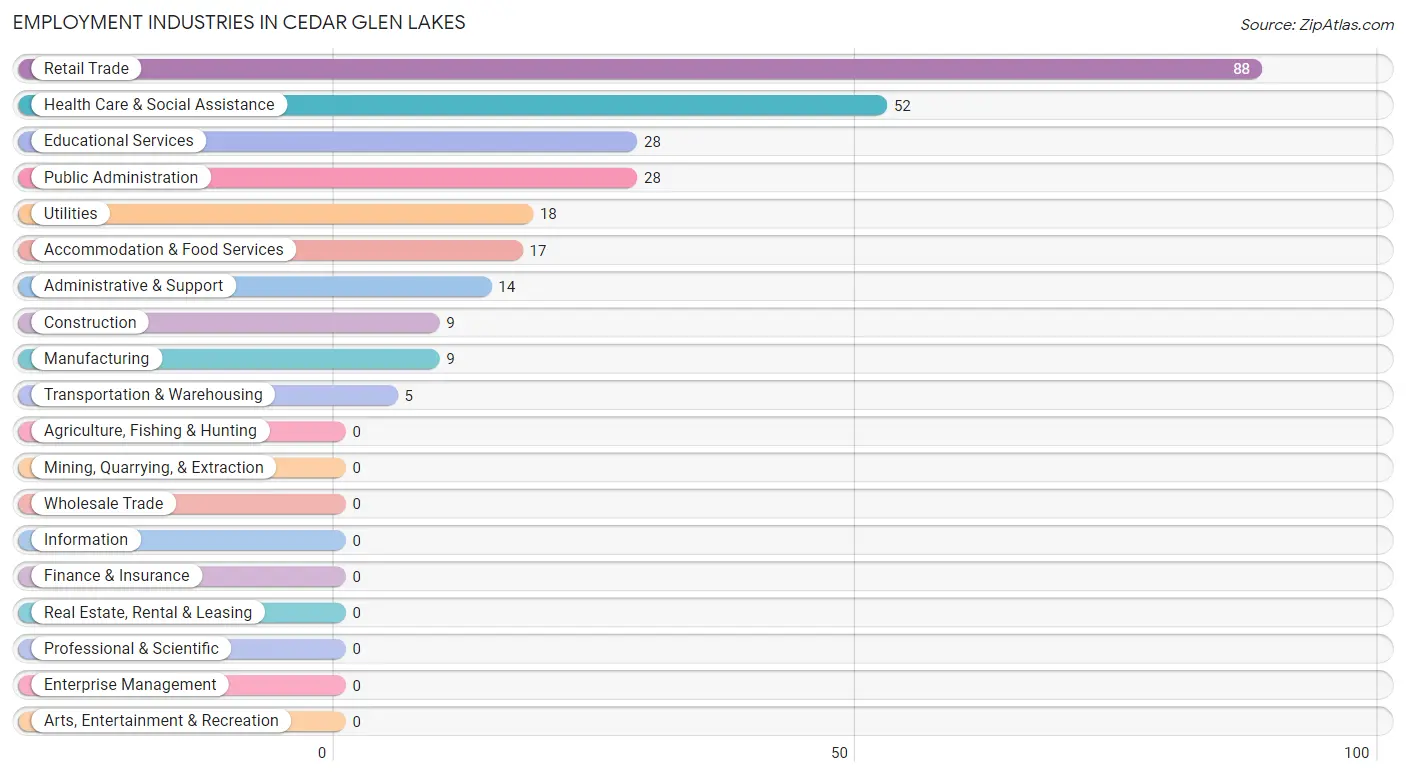
Employment Industries in Cedar Glen Lakes
The major employment industries in Cedar Glen Lakes include Retail Trade (88 | 32.8%), Health Care & Social Assistance (52 | 19.4%), Educational Services (28 | 10.4%), Public Administration (28 | 10.4%), and Utilities (18 | 6.7%).
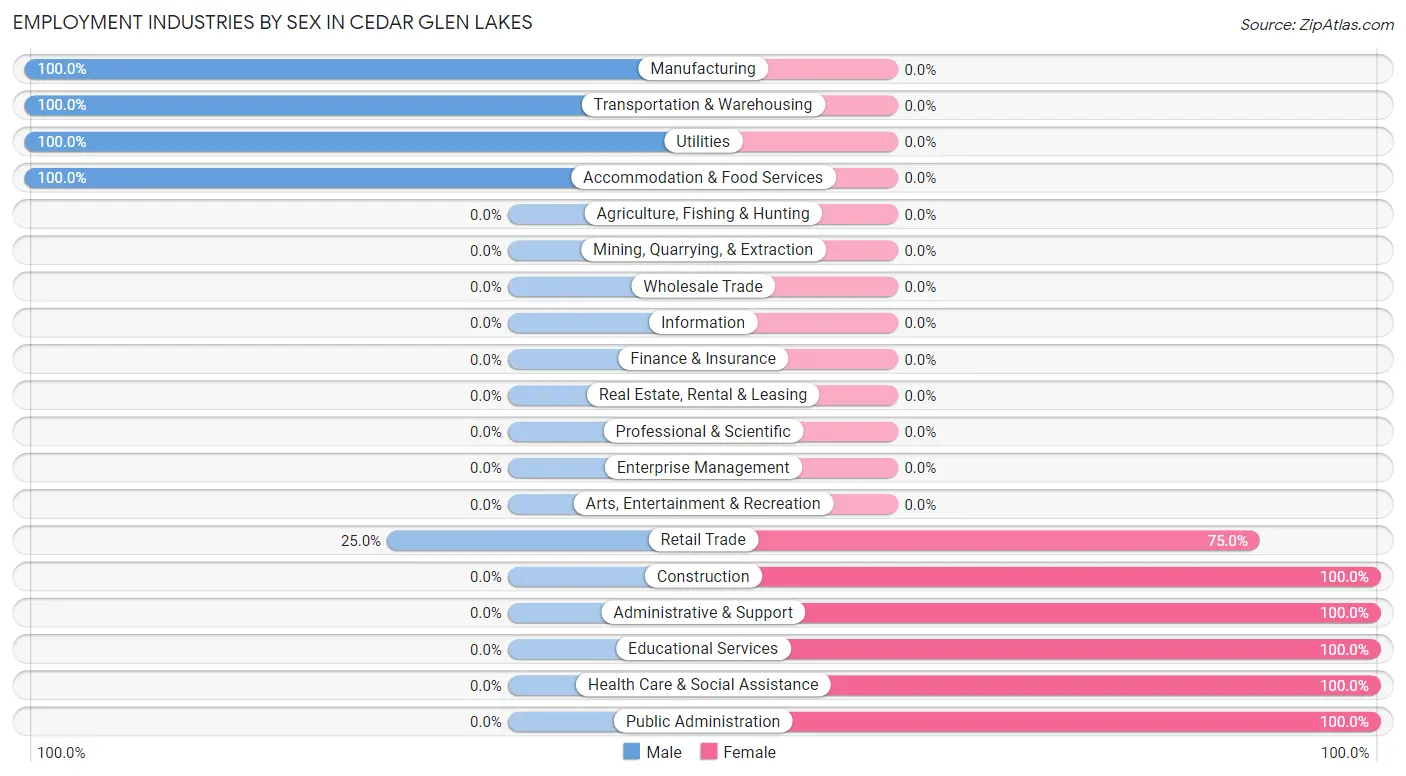
Employment Industries by Sex in Cedar Glen Lakes
The Cedar Glen Lakes industries that see more men than women are Manufacturing (100.0%), Transportation & Warehousing (100.0%), and Utilities (100.0%), whereas the industries that tend to have a higher number of women are Construction (100.0%), Administrative & Support (100.0%), and Educational Services (100.0%).
| Industry | Male | Female |
| Agriculture, Fishing & Hunting | 0 (0.0%) | 0 (0.0%) |
| Mining, Quarrying, & Extraction | 0 (0.0%) | 0 (0.0%) |
| Construction | 0 (0.0%) | 9 (100.0%) |
| Manufacturing | 9 (100.0%) | 0 (0.0%) |
| Wholesale Trade | 0 (0.0%) | 0 (0.0%) |
| Retail Trade | 22 (25.0%) | 66 (75.0%) |
| Transportation & Warehousing | 5 (100.0%) | 0 (0.0%) |
| Utilities | 18 (100.0%) | 0 (0.0%) |
| Information | 0 (0.0%) | 0 (0.0%) |
| Finance & Insurance | 0 (0.0%) | 0 (0.0%) |
| Real Estate, Rental & Leasing | 0 (0.0%) | 0 (0.0%) |
| Professional & Scientific | 0 (0.0%) | 0 (0.0%) |
| Enterprise Management | 0 (0.0%) | 0 (0.0%) |
| Administrative & Support | 0 (0.0%) | 14 (100.0%) |
| Educational Services | 0 (0.0%) | 28 (100.0%) |
| Health Care & Social Assistance | 0 (0.0%) | 52 (100.0%) |
| Arts, Entertainment & Recreation | 0 (0.0%) | 0 (0.0%) |
| Accommodation & Food Services | 17 (100.0%) | 0 (0.0%) |
| Public Administration | 0 (0.0%) | 28 (100.0%) |
| Total | 71 (26.5%) | 197 (73.5%) |
Education in Cedar Glen Lakes
School Enrollment in Cedar Glen Lakes
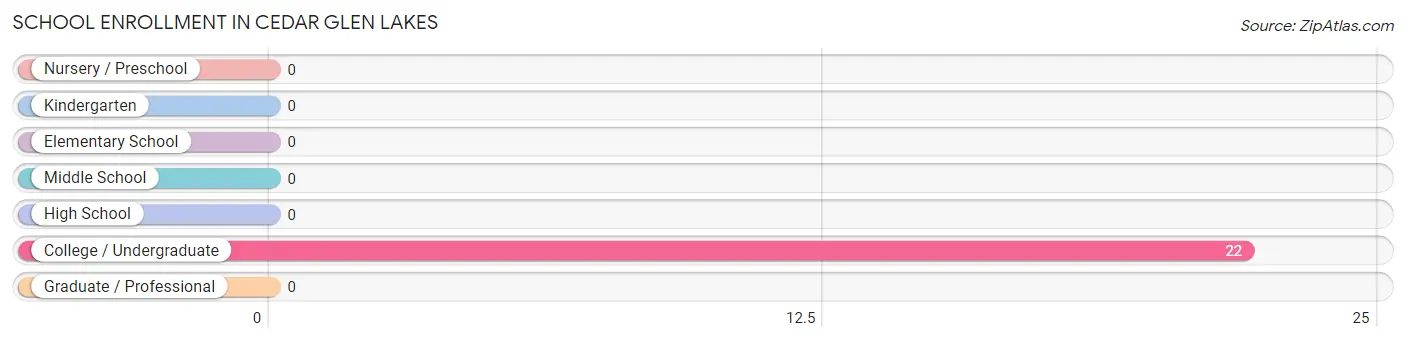
| School Level | # Students | % Students |
| Nursery / Preschool | 0 | 0.0% |
| Kindergarten | 0 | 0.0% |
| Elementary School | 0 | 0.0% |
| Middle School | 0 | 0.0% |
| High School | 0 | 0.0% |
| College / Undergraduate | 22 | 100.0% |
| Graduate / Professional | 0 | 0.0% |
| Total | 22 | 100.0% |
School Enrollment by Age by Funding Source in Cedar Glen Lakes
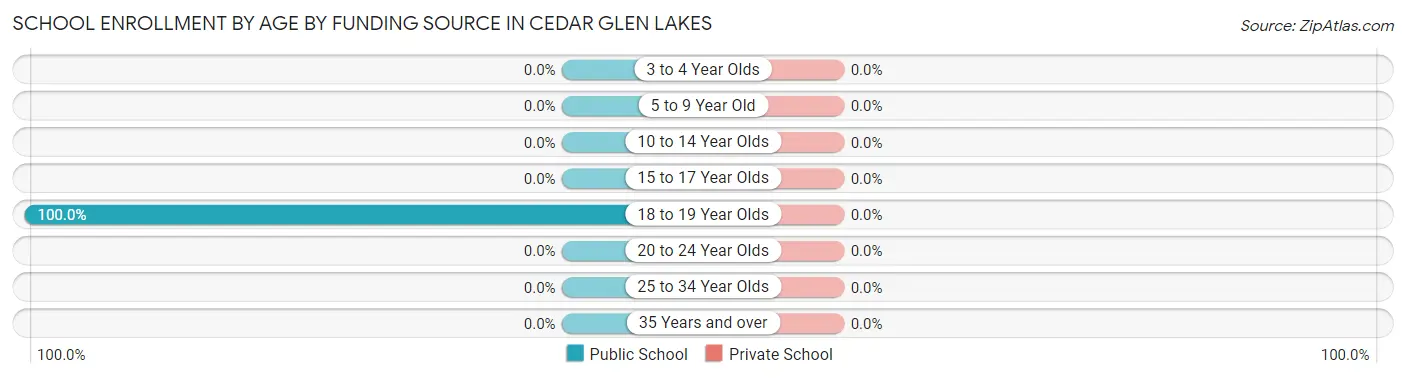
| Age Bracket | Public School | Private School |
| 3 to 4 Year Olds | 0 (0.0%) | 0 (0.0%) |
| 5 to 9 Year Old | 0 (0.0%) | 0 (0.0%) |
| 10 to 14 Year Olds | 0 (0.0%) | 0 (0.0%) |
| 15 to 17 Year Olds | 0 (0.0%) | 0 (0.0%) |
| 18 to 19 Year Olds | 22 (100.0%) | 0 (0.0%) |
| 20 to 24 Year Olds | 0 (0.0%) | 0 (0.0%) |
| 25 to 34 Year Olds | 0 (0.0%) | 0 (0.0%) |
| 35 Years and over | 0 (0.0%) | 0 (0.0%) |
| Total | 22 (100.0%) | 0 (0.0%) |
Educational Attainment by Field of Study in Cedar Glen Lakes
Literature & languages (59 | 25.3%), education (54 | 23.2%), business (41 | 17.6%), psychology (20 | 8.6%), and arts & humanities (20 | 8.6%) are the most common fields of study among 233 individuals in Cedar Glen Lakes who have obtained a bachelor's degree or higher.
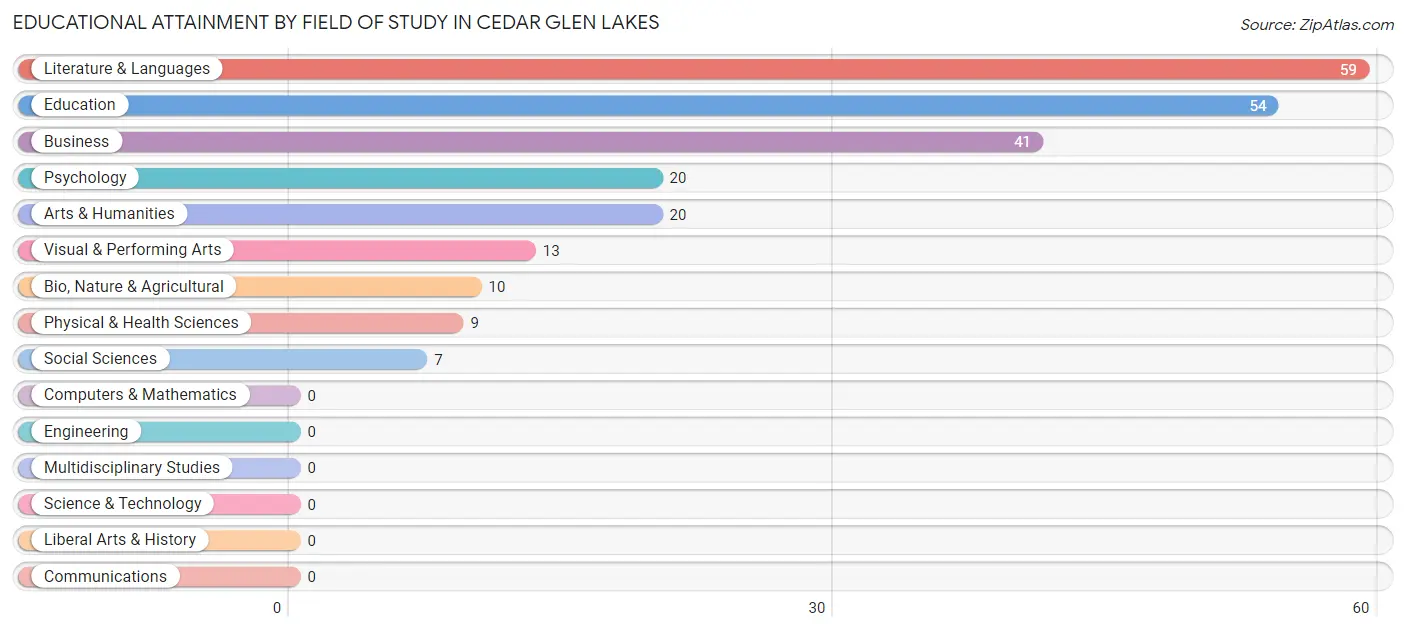
| Field of Study | # Graduates | % Graduates |
| Computers & Mathematics | 0 | 0.0% |
| Bio, Nature & Agricultural | 10 | 4.3% |
| Physical & Health Sciences | 9 | 3.9% |
| Psychology | 20 | 8.6% |
| Social Sciences | 7 | 3.0% |
| Engineering | 0 | 0.0% |
| Multidisciplinary Studies | 0 | 0.0% |
| Science & Technology | 0 | 0.0% |
| Business | 41 | 17.6% |
| Education | 54 | 23.2% |
| Literature & Languages | 59 | 25.3% |
| Liberal Arts & History | 0 | 0.0% |
| Visual & Performing Arts | 13 | 5.6% |
| Communications | 0 | 0.0% |
| Arts & Humanities | 20 | 8.6% |
| Total | 233 | 100.0% |
Transportation & Commute in Cedar Glen Lakes
Vehicle Availability by Sex in Cedar Glen Lakes
The most prevalent vehicle ownership categories in Cedar Glen Lakes are males with 2 vehicles (31, accounting for 47.7%) and females with 2 vehicles (58, making up 16.4%).
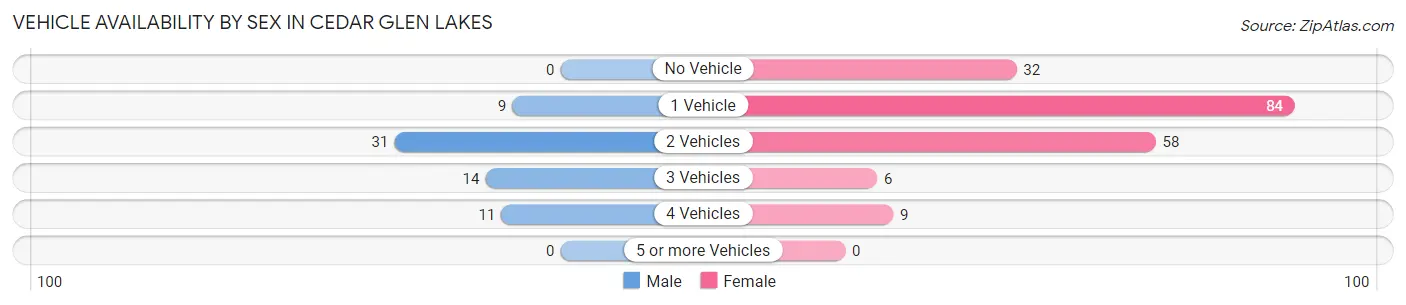
| Vehicles Available | Male | Female |
| No Vehicle | 0 (0.0%) | 32 (16.9%) |
| 1 Vehicle | 9 (13.9%) | 84 (44.4%) |
| 2 Vehicles | 31 (47.7%) | 58 (30.7%) |
| 3 Vehicles | 14 (21.5%) | 6 (3.2%) |
| 4 Vehicles | 11 (16.9%) | 9 (4.8%) |
| 5 or more Vehicles | 0 (0.0%) | 0 (0.0%) |
| Total | 65 (100.0%) | 189 (100.0%) |
Commute Time in Cedar Glen Lakes
The most frequently occuring commute durations in Cedar Glen Lakes are 30 to 34 minutes (87 commuters, 34.3%), 20 to 24 minutes (73 commuters, 28.7%), and 40 to 44 minutes (43 commuters, 16.9%).
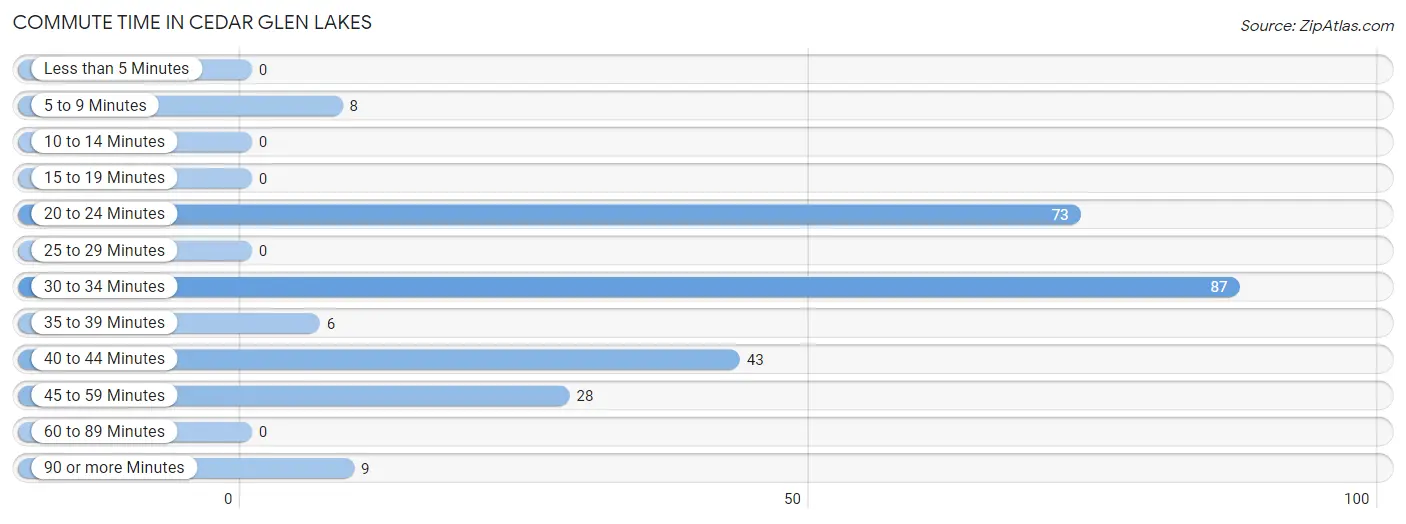
| Commute Time | # Commuters | % Commuters |
| Less than 5 Minutes | 0 | 0.0% |
| 5 to 9 Minutes | 8 | 3.2% |
| 10 to 14 Minutes | 0 | 0.0% |
| 15 to 19 Minutes | 0 | 0.0% |
| 20 to 24 Minutes | 73 | 28.7% |
| 25 to 29 Minutes | 0 | 0.0% |
| 30 to 34 Minutes | 87 | 34.3% |
| 35 to 39 Minutes | 6 | 2.4% |
| 40 to 44 Minutes | 43 | 16.9% |
| 45 to 59 Minutes | 28 | 11.0% |
| 60 to 89 Minutes | 0 | 0.0% |
| 90 or more Minutes | 9 | 3.5% |
Commute Time by Sex in Cedar Glen Lakes
The most common commute times in Cedar Glen Lakes are 30 to 34 minutes (43 commuters, 66.1%) for males and 20 to 24 minutes (73 commuters, 38.6%) for females.
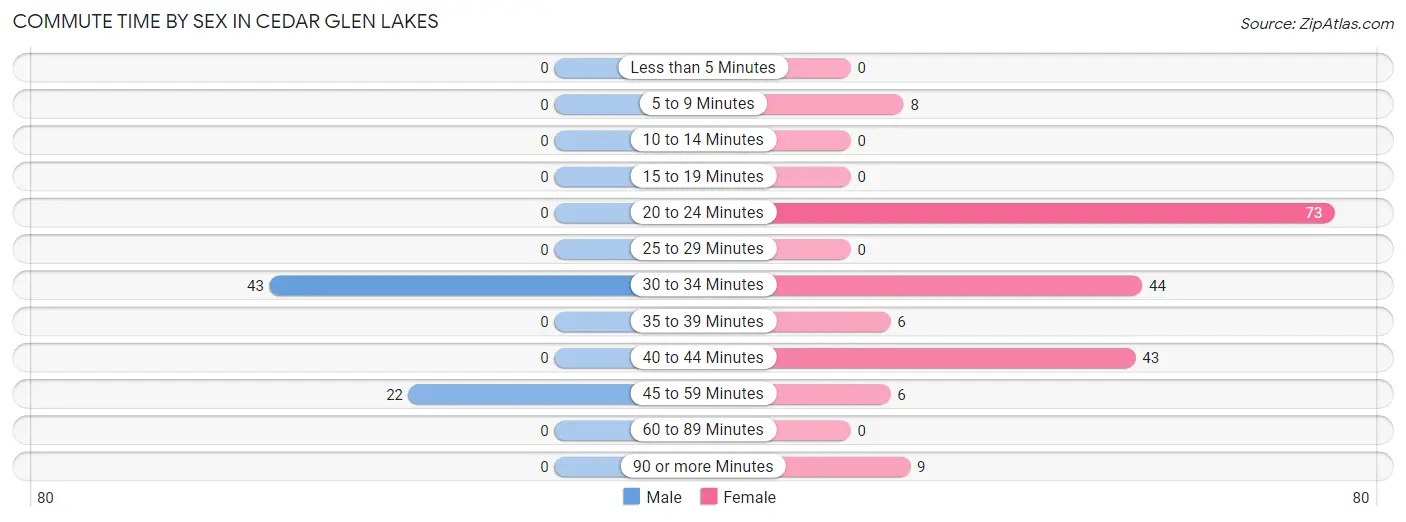
| Commute Time | Male | Female |
| Less than 5 Minutes | 0 (0.0%) | 0 (0.0%) |
| 5 to 9 Minutes | 0 (0.0%) | 8 (4.2%) |
| 10 to 14 Minutes | 0 (0.0%) | 0 (0.0%) |
| 15 to 19 Minutes | 0 (0.0%) | 0 (0.0%) |
| 20 to 24 Minutes | 0 (0.0%) | 73 (38.6%) |
| 25 to 29 Minutes | 0 (0.0%) | 0 (0.0%) |
| 30 to 34 Minutes | 43 (66.1%) | 44 (23.3%) |
| 35 to 39 Minutes | 0 (0.0%) | 6 (3.2%) |
| 40 to 44 Minutes | 0 (0.0%) | 43 (22.8%) |
| 45 to 59 Minutes | 22 (33.9%) | 6 (3.2%) |
| 60 to 89 Minutes | 0 (0.0%) | 0 (0.0%) |
| 90 or more Minutes | 0 (0.0%) | 9 (4.8%) |
Time of Departure to Work by Sex in Cedar Glen Lakes
The most frequent times of departure to work in Cedar Glen Lakes are 4:00 PM to 11:59 PM (20, 30.8%) for males and 6:00 AM to 6:29 AM (80, 42.3%) for females.
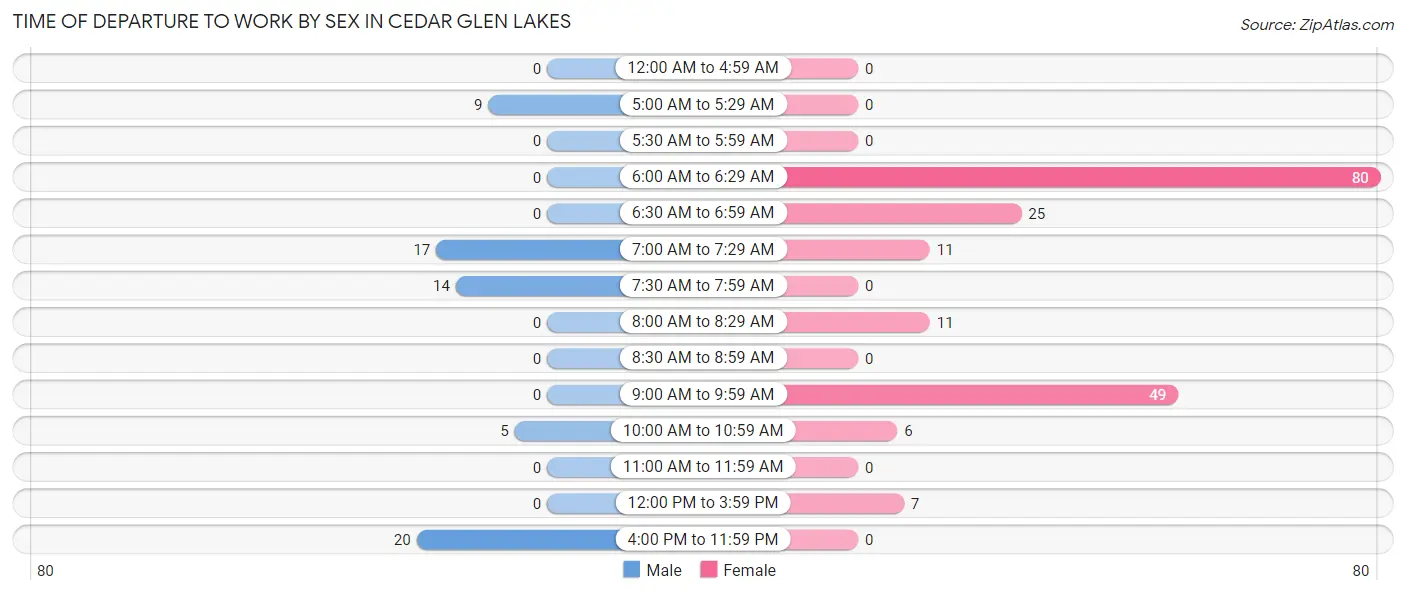
| Time of Departure | Male | Female |
| 12:00 AM to 4:59 AM | 0 (0.0%) | 0 (0.0%) |
| 5:00 AM to 5:29 AM | 9 (13.9%) | 0 (0.0%) |
| 5:30 AM to 5:59 AM | 0 (0.0%) | 0 (0.0%) |
| 6:00 AM to 6:29 AM | 0 (0.0%) | 80 (42.3%) |
| 6:30 AM to 6:59 AM | 0 (0.0%) | 25 (13.2%) |
| 7:00 AM to 7:29 AM | 17 (26.2%) | 11 (5.8%) |
| 7:30 AM to 7:59 AM | 14 (21.5%) | 0 (0.0%) |
| 8:00 AM to 8:29 AM | 0 (0.0%) | 11 (5.8%) |
| 8:30 AM to 8:59 AM | 0 (0.0%) | 0 (0.0%) |
| 9:00 AM to 9:59 AM | 0 (0.0%) | 49 (25.9%) |
| 10:00 AM to 10:59 AM | 5 (7.7%) | 6 (3.2%) |
| 11:00 AM to 11:59 AM | 0 (0.0%) | 0 (0.0%) |
| 12:00 PM to 3:59 PM | 0 (0.0%) | 7 (3.7%) |
| 4:00 PM to 11:59 PM | 20 (30.8%) | 0 (0.0%) |
| Total | 65 (100.0%) | 189 (100.0%) |
Housing Occupancy in Cedar Glen Lakes
Occupancy by Ownership in Cedar Glen Lakes
Of the total 979 dwellings in Cedar Glen Lakes, owner-occupied units account for 951 (97.1%), while renter-occupied units make up 28 (2.9%).
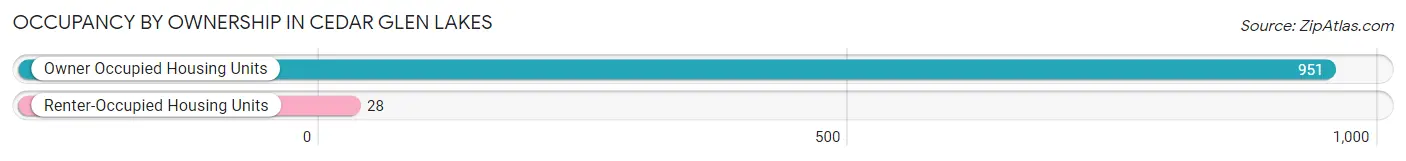
| Occupancy | # Housing Units | % Housing Units |
| Owner Occupied Housing Units | 951 | 97.1% |
| Renter-Occupied Housing Units | 28 | 2.9% |
| Total Occupied Housing Units | 979 | 100.0% |
Occupancy by Household Size in Cedar Glen Lakes
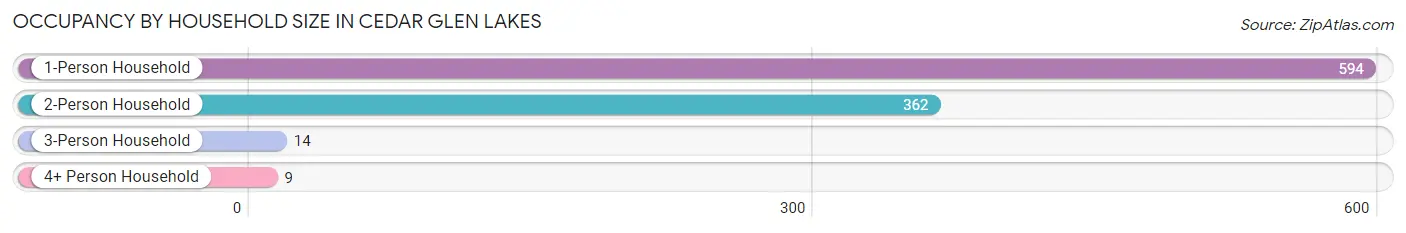
| Household Size | # Housing Units | % Housing Units |
| 1-Person Household | 594 | 60.7% |
| 2-Person Household | 362 | 37.0% |
| 3-Person Household | 14 | 1.4% |
| 4+ Person Household | 9 | 0.9% |
| Total Housing Units | 979 | 100.0% |
Occupancy by Ownership by Household Size in Cedar Glen Lakes
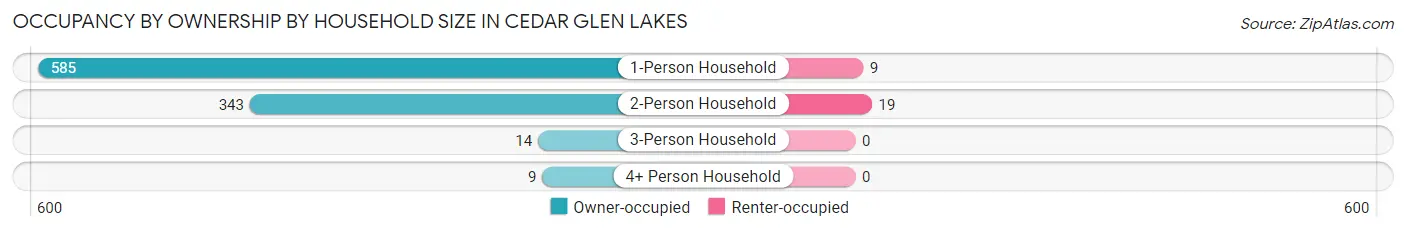
| Household Size | Owner-occupied | Renter-occupied |
| 1-Person Household | 585 (98.5%) | 9 (1.5%) |
| 2-Person Household | 343 (94.8%) | 19 (5.2%) |
| 3-Person Household | 14 (100.0%) | 0 (0.0%) |
| 4+ Person Household | 9 (100.0%) | 0 (0.0%) |
| Total Housing Units | 951 (97.1%) | 28 (2.9%) |
Occupancy by Educational Attainment in Cedar Glen Lakes
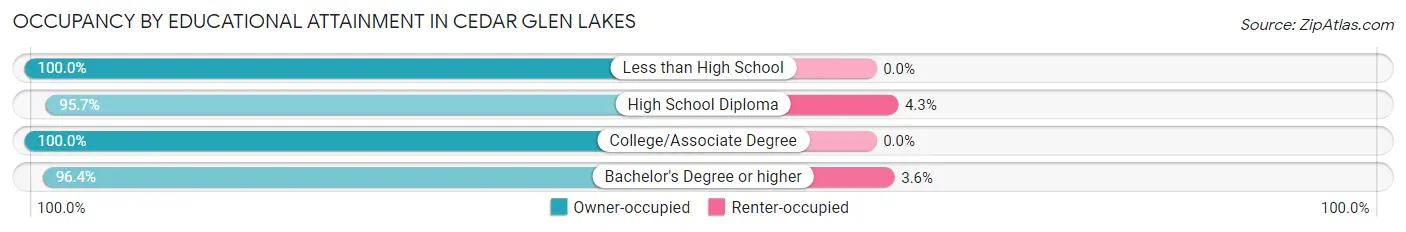
| Household Size | Owner-occupied | Renter-occupied |
| Less than High School | 54 (100.0%) | 0 (0.0%) |
| High School Diploma | 465 (95.7%) | 21 (4.3%) |
| College/Associate Degree | 244 (100.0%) | 0 (0.0%) |
| Bachelor's Degree or higher | 188 (96.4%) | 7 (3.6%) |
Occupancy by Age of Householder in Cedar Glen Lakes
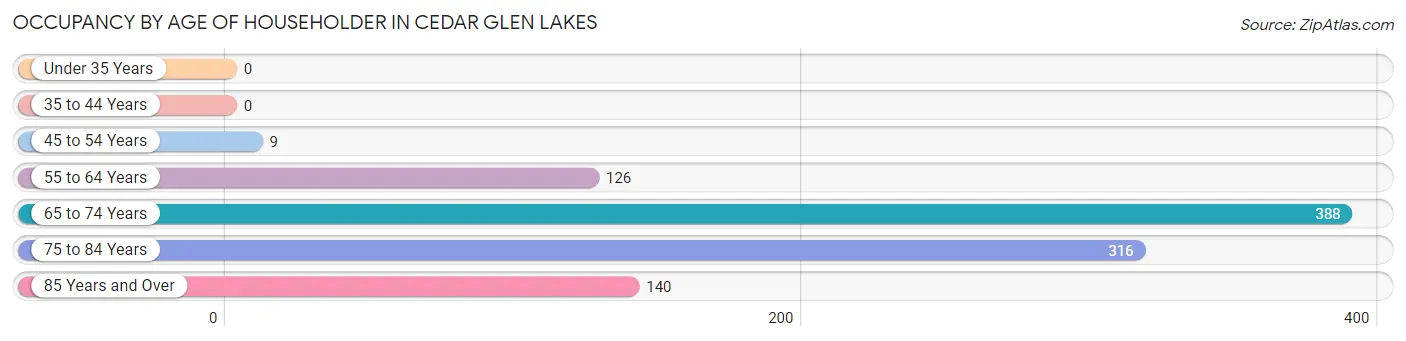
| Age Bracket | # Households | % Households |
| Under 35 Years | 0 | 0.0% |
| 35 to 44 Years | 0 | 0.0% |
| 45 to 54 Years | 9 | 0.9% |
| 55 to 64 Years | 126 | 12.9% |
| 65 to 74 Years | 388 | 39.6% |
| 75 to 84 Years | 316 | 32.3% |
| 85 Years and Over | 140 | 14.3% |
| Total | 979 | 100.0% |
Housing Finances in Cedar Glen Lakes
Median Income by Occupancy in Cedar Glen Lakes
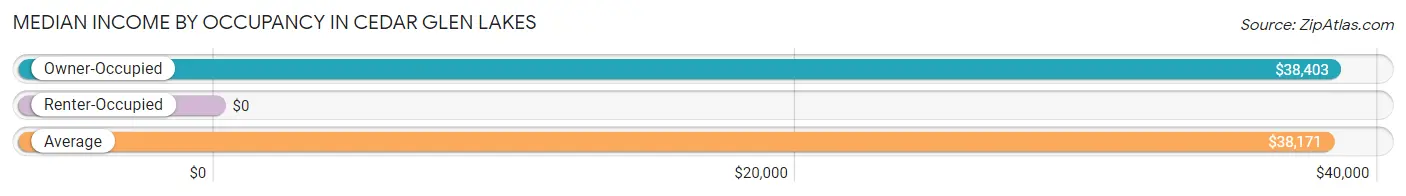
| Occupancy Type | # Households | Median Income |
| Owner-Occupied | 951 (97.1%) | $38,403 |
| Renter-Occupied | 28 (2.9%) | $0 |
| Average | 979 (100.0%) | $38,171 |
Occupancy by Householder Income Bracket in Cedar Glen Lakes
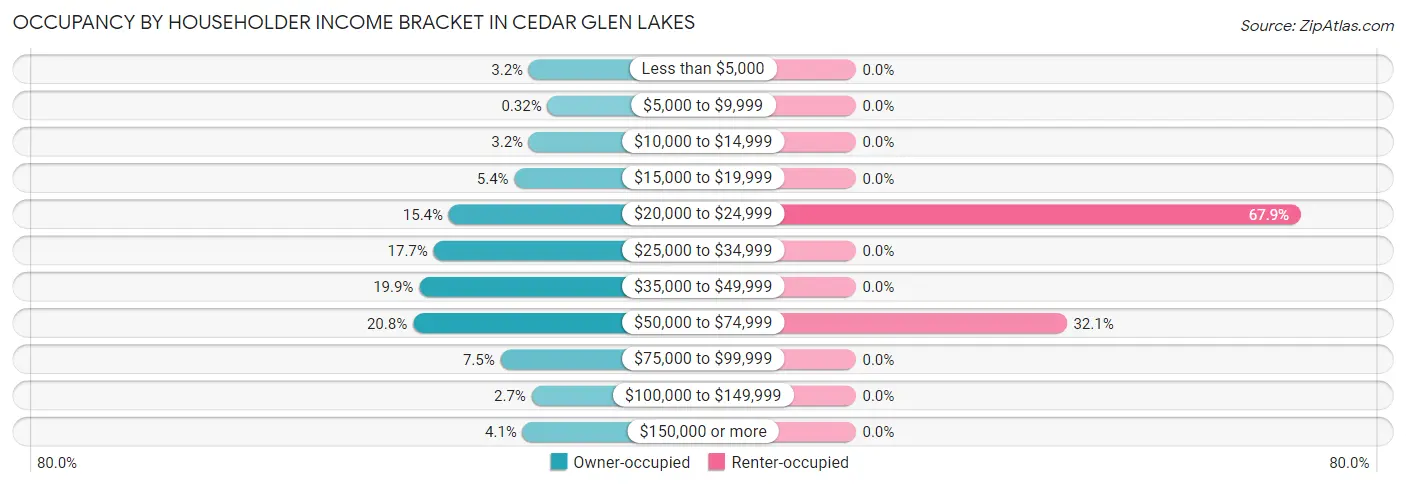
| Income Bracket | Owner-occupied | Renter-occupied |
| Less than $5,000 | 30 (3.2%) | 0 (0.0%) |
| $5,000 to $9,999 | 3 (0.3%) | 0 (0.0%) |
| $10,000 to $14,999 | 30 (3.2%) | 0 (0.0%) |
| $15,000 to $19,999 | 51 (5.4%) | 0 (0.0%) |
| $20,000 to $24,999 | 146 (15.3%) | 19 (67.9%) |
| $25,000 to $34,999 | 168 (17.7%) | 0 (0.0%) |
| $35,000 to $49,999 | 189 (19.9%) | 0 (0.0%) |
| $50,000 to $74,999 | 198 (20.8%) | 9 (32.1%) |
| $75,000 to $99,999 | 71 (7.5%) | 0 (0.0%) |
| $100,000 to $149,999 | 26 (2.7%) | 0 (0.0%) |
| $150,000 or more | 39 (4.1%) | 0 (0.0%) |
| Total | 951 (100.0%) | 28 (100.0%) |
Monthly Housing Cost Tiers in Cedar Glen Lakes
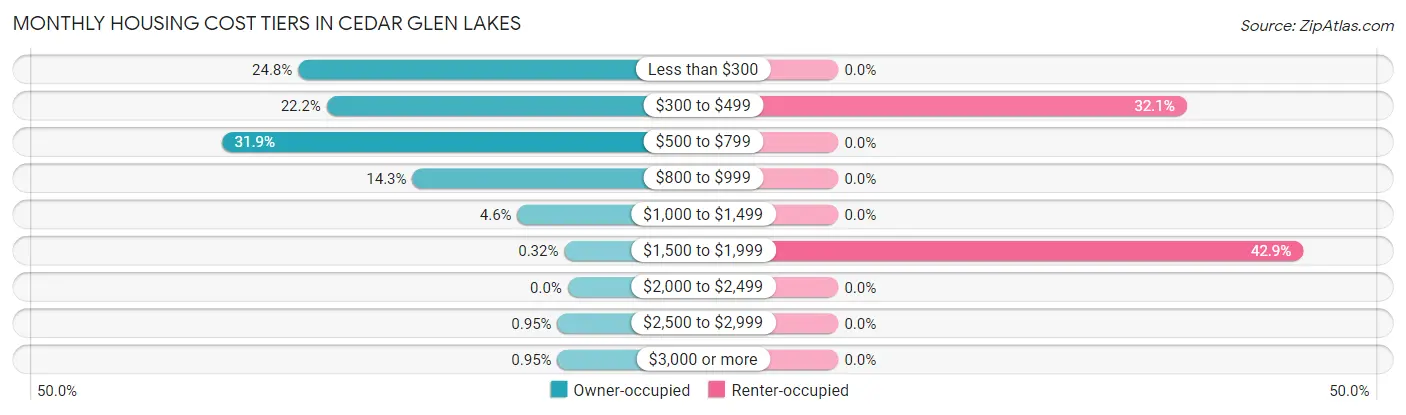
| Monthly Cost | Owner-occupied | Renter-occupied |
| Less than $300 | 236 (24.8%) | 0 (0.0%) |
| $300 to $499 | 211 (22.2%) | 9 (32.1%) |
| $500 to $799 | 303 (31.9%) | 0 (0.0%) |
| $800 to $999 | 136 (14.3%) | 0 (0.0%) |
| $1,000 to $1,499 | 44 (4.6%) | 0 (0.0%) |
| $1,500 to $1,999 | 3 (0.3%) | 12 (42.9%) |
| $2,000 to $2,499 | 0 (0.0%) | 0 (0.0%) |
| $2,500 to $2,999 | 9 (0.9%) | 0 (0.0%) |
| $3,000 or more | 9 (0.9%) | 0 (0.0%) |
| Total | 951 (100.0%) | 28 (100.0%) |
Physical Housing Characteristics in Cedar Glen Lakes
Housing Structures in Cedar Glen Lakes
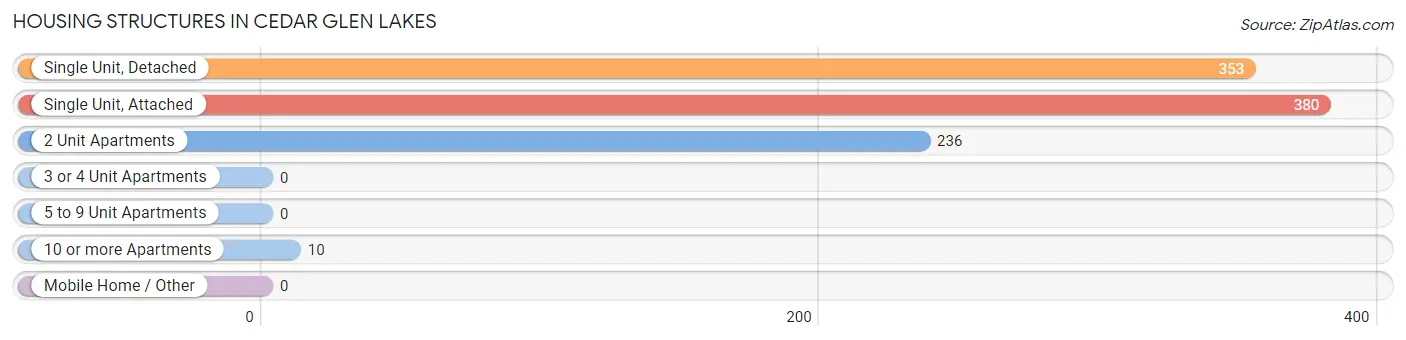
| Structure Type | # Housing Units | % Housing Units |
| Single Unit, Detached | 353 | 36.1% |
| Single Unit, Attached | 380 | 38.8% |
| 2 Unit Apartments | 236 | 24.1% |
| 3 or 4 Unit Apartments | 0 | 0.0% |
| 5 to 9 Unit Apartments | 0 | 0.0% |
| 10 or more Apartments | 10 | 1.0% |
| Mobile Home / Other | 0 | 0.0% |
| Total | 979 | 100.0% |
Housing Structures by Occupancy in Cedar Glen Lakes
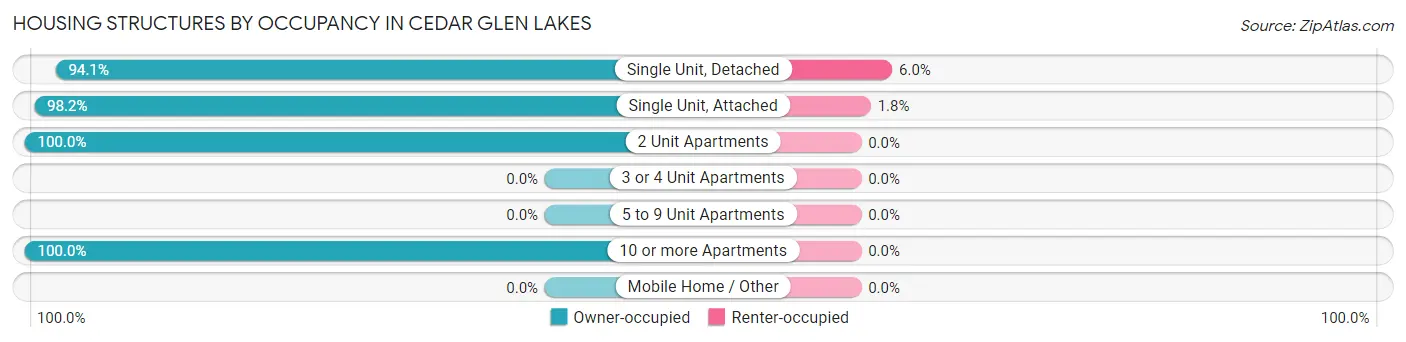
| Structure Type | Owner-occupied | Renter-occupied |
| Single Unit, Detached | 332 (94.1%) | 21 (5.9%) |
| Single Unit, Attached | 373 (98.2%) | 7 (1.8%) |
| 2 Unit Apartments | 236 (100.0%) | 0 (0.0%) |
| 3 or 4 Unit Apartments | 0 (0.0%) | 0 (0.0%) |
| 5 to 9 Unit Apartments | 0 (0.0%) | 0 (0.0%) |
| 10 or more Apartments | 10 (100.0%) | 0 (0.0%) |
| Mobile Home / Other | 0 (0.0%) | 0 (0.0%) |
| Total | 951 (97.1%) | 28 (2.9%) |
Housing Structures by Number of Rooms in Cedar Glen Lakes
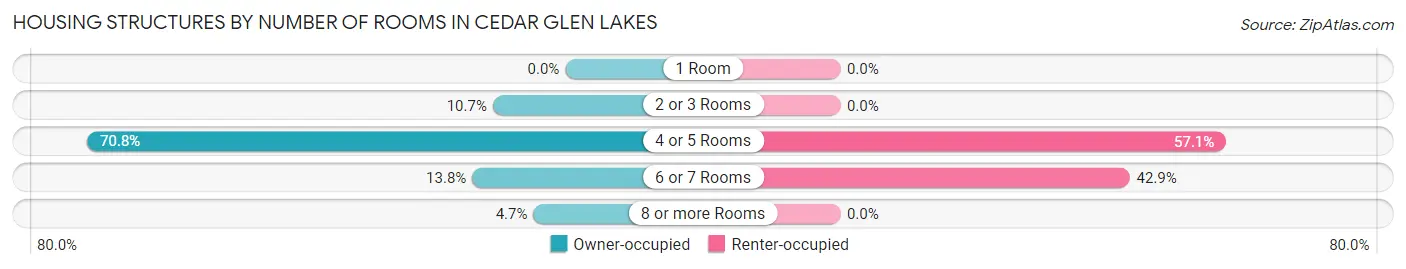
| Number of Rooms | Owner-occupied | Renter-occupied |
| 1 Room | 0 (0.0%) | 0 (0.0%) |
| 2 or 3 Rooms | 102 (10.7%) | 0 (0.0%) |
| 4 or 5 Rooms | 673 (70.8%) | 16 (57.1%) |
| 6 or 7 Rooms | 131 (13.8%) | 12 (42.9%) |
| 8 or more Rooms | 45 (4.7%) | 0 (0.0%) |
| Total | 951 (100.0%) | 28 (100.0%) |
Housing Structure by Heating Type in Cedar Glen Lakes
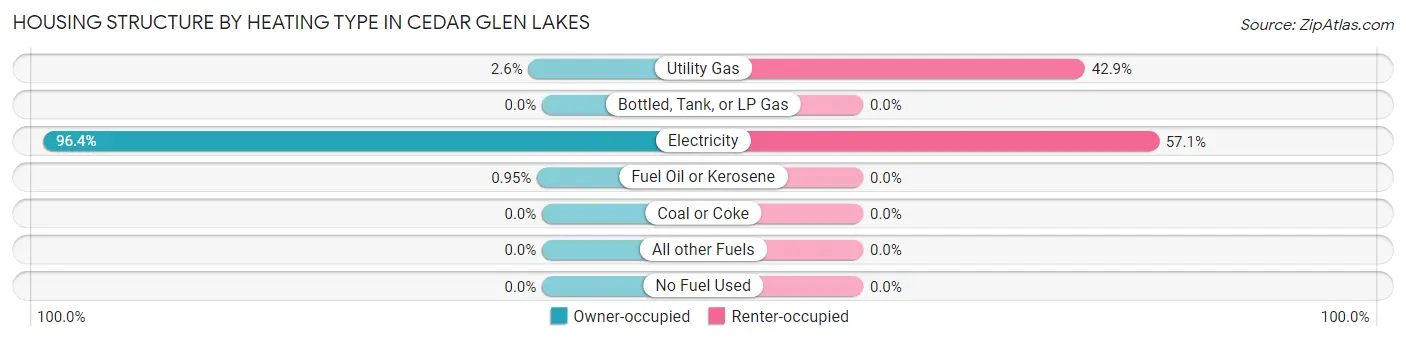
| Heating Type | Owner-occupied | Renter-occupied |
| Utility Gas | 25 (2.6%) | 12 (42.9%) |
| Bottled, Tank, or LP Gas | 0 (0.0%) | 0 (0.0%) |
| Electricity | 917 (96.4%) | 16 (57.1%) |
| Fuel Oil or Kerosene | 9 (0.9%) | 0 (0.0%) |
| Coal or Coke | 0 (0.0%) | 0 (0.0%) |
| All other Fuels | 0 (0.0%) | 0 (0.0%) |
| No Fuel Used | 0 (0.0%) | 0 (0.0%) |
| Total | 951 (100.0%) | 28 (100.0%) |
Household Vehicle Usage in Cedar Glen Lakes
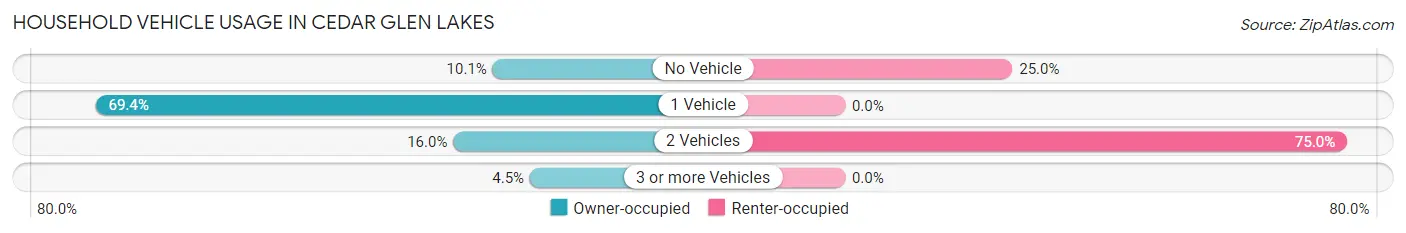
| Vehicles per Household | Owner-occupied | Renter-occupied |
| No Vehicle | 96 (10.1%) | 7 (25.0%) |
| 1 Vehicle | 660 (69.4%) | 0 (0.0%) |
| 2 Vehicles | 152 (16.0%) | 21 (75.0%) |
| 3 or more Vehicles | 43 (4.5%) | 0 (0.0%) |
| Total | 951 (100.0%) | 28 (100.0%) |
Real Estate & Mortgages in Cedar Glen Lakes
Real Estate and Mortgage Overview in Cedar Glen Lakes
| Characteristic | Without Mortgage | With Mortgage |
| Housing Units | 902 | 49 |
| Median Property Value | $85,800 | $0 |
| Median Household Income | $38,333 | $9 |
| Monthly Housing Costs | $502 | $9 |
| Real Estate Taxes | $1,424 | $0 |
Property Value by Mortgage Status in Cedar Glen Lakes
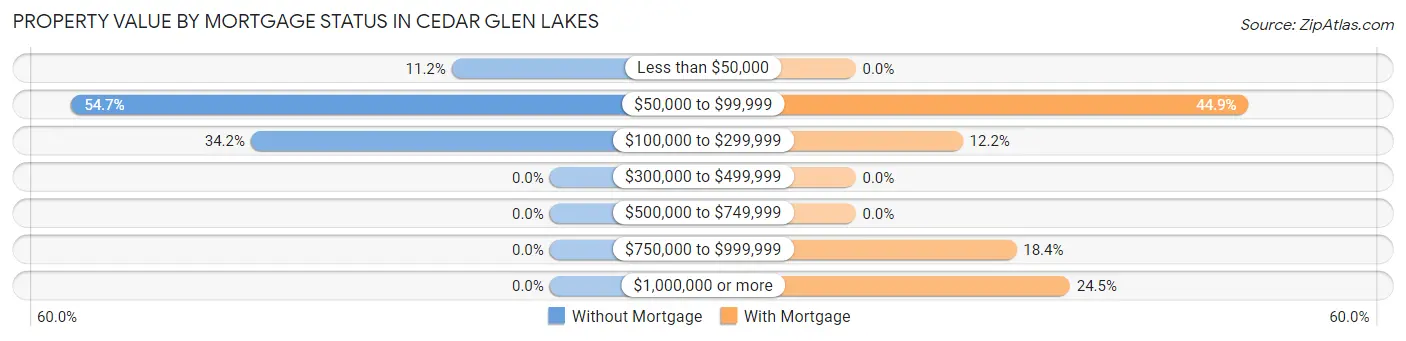
| Property Value | Without Mortgage | With Mortgage |
| Less than $50,000 | 101 (11.2%) | 0 (0.0%) |
| $50,000 to $99,999 | 493 (54.7%) | 22 (44.9%) |
| $100,000 to $299,999 | 308 (34.2%) | 6 (12.2%) |
| $300,000 to $499,999 | 0 (0.0%) | 0 (0.0%) |
| $500,000 to $749,999 | 0 (0.0%) | 0 (0.0%) |
| $750,000 to $999,999 | 0 (0.0%) | 9 (18.4%) |
| $1,000,000 or more | 0 (0.0%) | 12 (24.5%) |
| Total | 902 (100.0%) | 49 (100.0%) |
Household Income by Mortgage Status in Cedar Glen Lakes
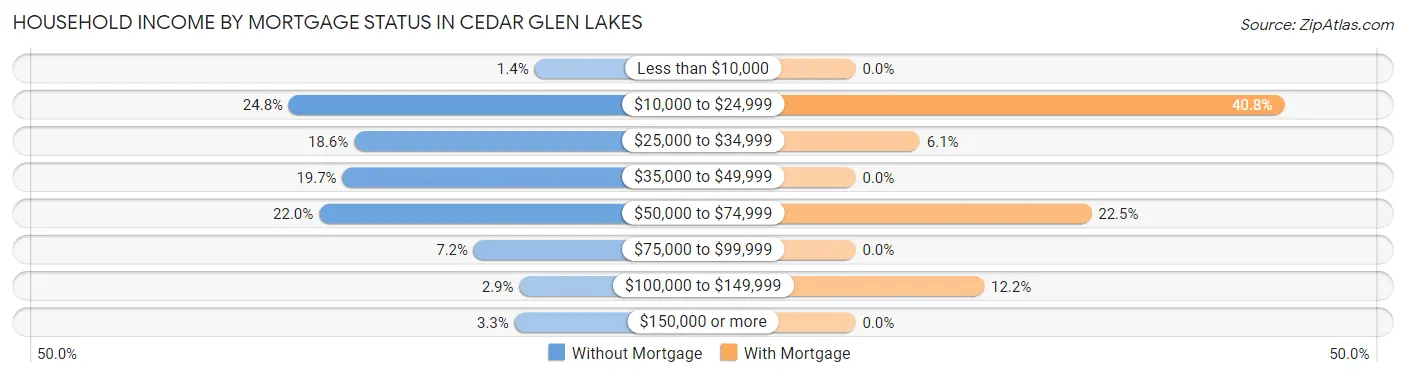
| Household Income | Without Mortgage | With Mortgage |
| Less than $10,000 | 13 (1.4%) | 0 (0.0%) |
| $10,000 to $24,999 | 224 (24.8%) | 20 (40.8%) |
| $25,000 to $34,999 | 168 (18.6%) | 3 (6.1%) |
| $35,000 to $49,999 | 178 (19.7%) | 0 (0.0%) |
| $50,000 to $74,999 | 198 (22.0%) | 11 (22.5%) |
| $75,000 to $99,999 | 65 (7.2%) | 0 (0.0%) |
| $100,000 to $149,999 | 26 (2.9%) | 6 (12.2%) |
| $150,000 or more | 30 (3.3%) | 0 (0.0%) |
| Total | 902 (100.0%) | 49 (100.0%) |
Property Value to Household Income Ratio in Cedar Glen Lakes
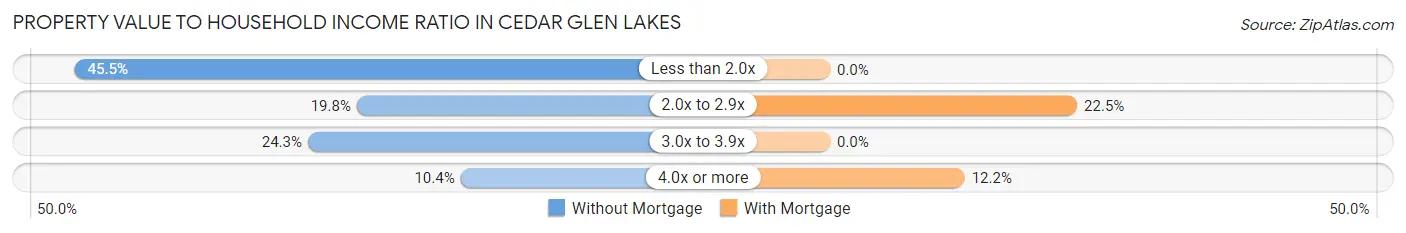
| Value-to-Income Ratio | Without Mortgage | With Mortgage |
| Less than 2.0x | 410 (45.5%) | 0 (0.0%) |
| 2.0x to 2.9x | 179 (19.8%) | 11 (22.5%) |
| 3.0x to 3.9x | 219 (24.3%) | 0 (0.0%) |
| 4.0x or more | 94 (10.4%) | 6 (12.2%) |
| Total | 902 (100.0%) | 49 (100.0%) |
Real Estate Taxes by Mortgage Status in Cedar Glen Lakes
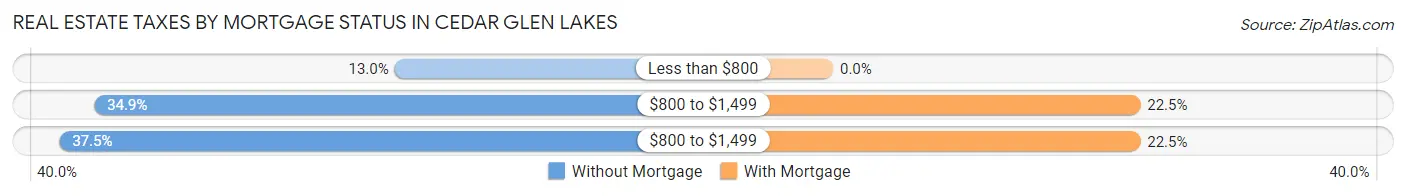
| Property Taxes | Without Mortgage | With Mortgage |
| Less than $800 | 117 (13.0%) | 0 (0.0%) |
| $800 to $1,499 | 315 (34.9%) | 11 (22.5%) |
| $800 to $1,499 | 338 (37.5%) | 11 (22.5%) |
| Total | 902 (100.0%) | 49 (100.0%) |
Health & Disability in Cedar Glen Lakes
Health Insurance Coverage by Age in Cedar Glen Lakes
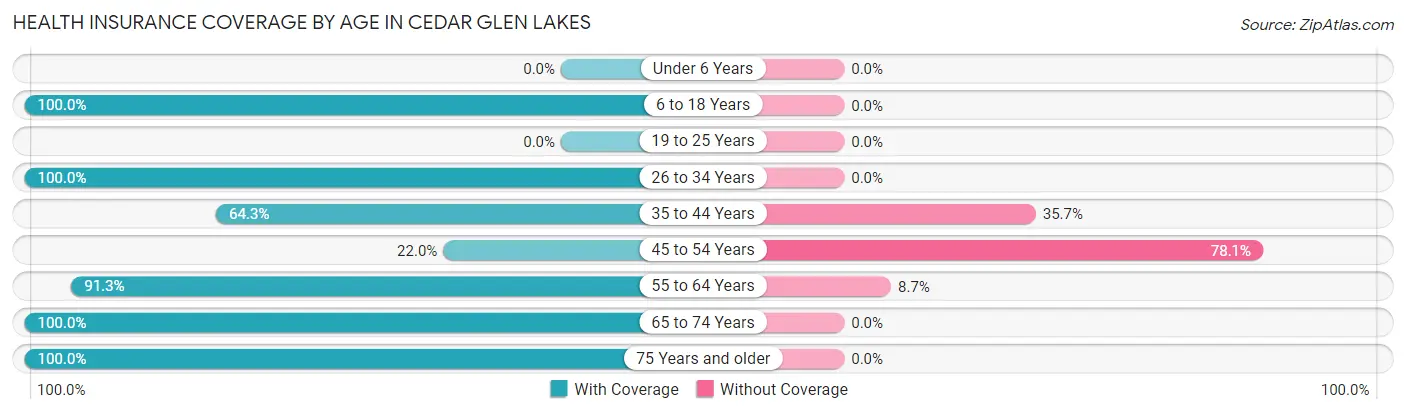
| Age Bracket | With Coverage | Without Coverage |
| Under 6 Years | 0 (0.0%) | 0 (0.0%) |
| 6 to 18 Years | 22 (100.0%) | 0 (0.0%) |
| 19 to 25 Years | 0 (0.0%) | 0 (0.0%) |
| 26 to 34 Years | 14 (100.0%) | 0 (0.0%) |
| 35 to 44 Years | 9 (64.3%) | 5 (35.7%) |
| 45 to 54 Years | 18 (22.0%) | 64 (78.0%) |
| 55 to 64 Years | 178 (91.3%) | 17 (8.7%) |
| 65 to 74 Years | 526 (100.0%) | 0 (0.0%) |
| 75 Years and older | 608 (100.0%) | 0 (0.0%) |
| Total | 1,375 (94.1%) | 86 (5.9%) |
Health Insurance Coverage by Citizenship Status in Cedar Glen Lakes
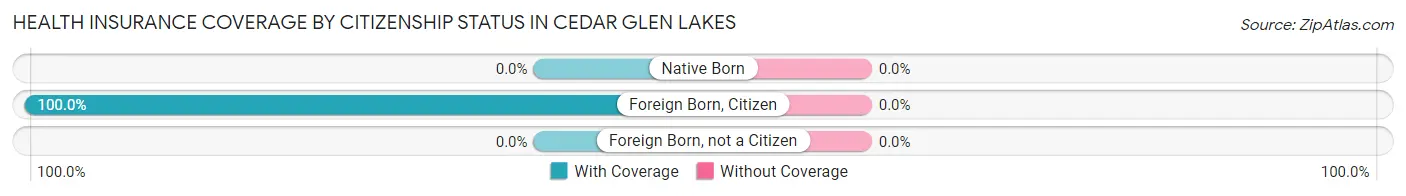
| Citizenship Status | With Coverage | Without Coverage |
| Native Born | 0 (0.0%) | 0 (0.0%) |
| Foreign Born, Citizen | 22 (100.0%) | 0 (0.0%) |
| Foreign Born, not a Citizen | 0 (0.0%) | 0 (0.0%) |
Health Insurance Coverage by Household Income in Cedar Glen Lakes
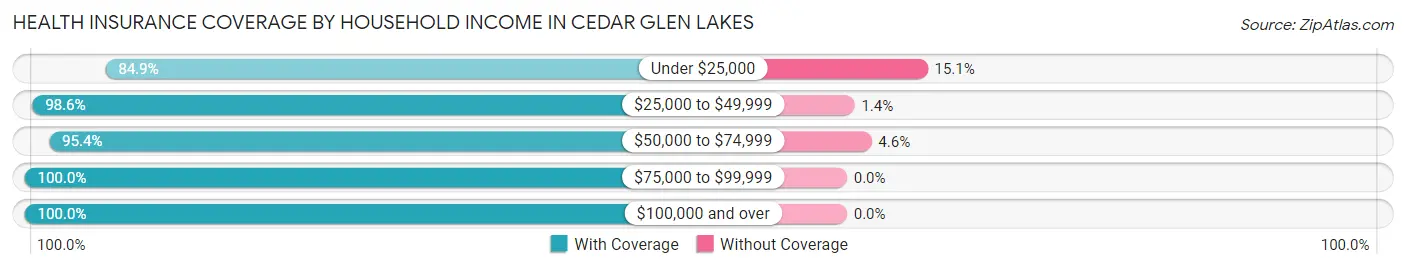
| Household Income | With Coverage | Without Coverage |
| Under $25,000 | 359 (84.9%) | 64 (15.1%) |
| $25,000 to $49,999 | 410 (98.6%) | 6 (1.4%) |
| $50,000 to $74,999 | 331 (95.4%) | 16 (4.6%) |
| $75,000 to $99,999 | 136 (100.0%) | 0 (0.0%) |
| $100,000 and over | 139 (100.0%) | 0 (0.0%) |
Public vs Private Health Insurance Coverage by Age in Cedar Glen Lakes
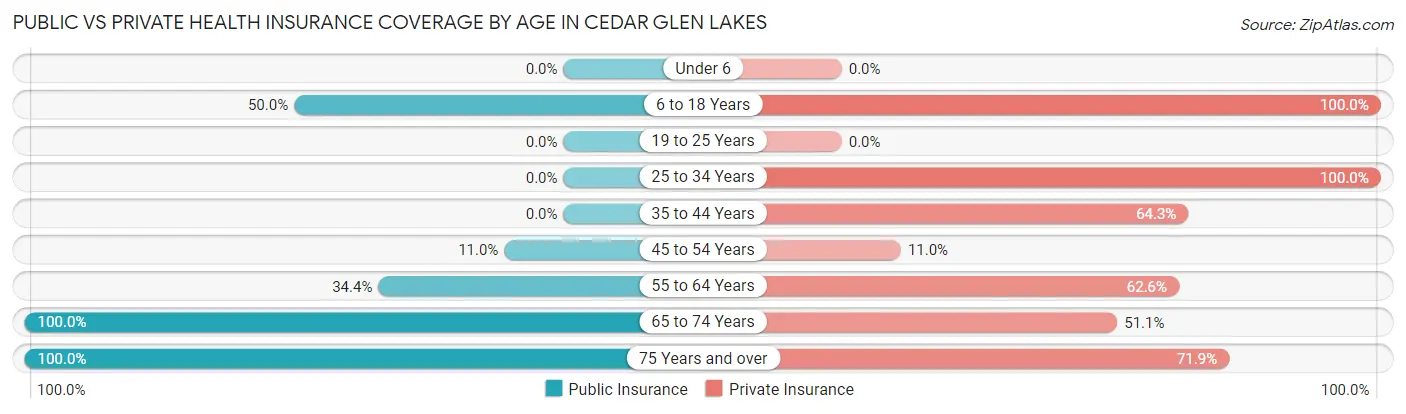
| Age Bracket | Public Insurance | Private Insurance |
| Under 6 | 0 (0.0%) | 0 (0.0%) |
| 6 to 18 Years | 11 (50.0%) | 22 (100.0%) |
| 19 to 25 Years | 0 (0.0%) | 0 (0.0%) |
| 25 to 34 Years | 0 (0.0%) | 14 (100.0%) |
| 35 to 44 Years | 0 (0.0%) | 9 (64.3%) |
| 45 to 54 Years | 9 (11.0%) | 9 (11.0%) |
| 55 to 64 Years | 67 (34.4%) | 122 (62.6%) |
| 65 to 74 Years | 526 (100.0%) | 269 (51.1%) |
| 75 Years and over | 608 (100.0%) | 437 (71.9%) |
| Total | 1,221 (83.6%) | 882 (60.4%) |
Disability Status by Sex by Age in Cedar Glen Lakes
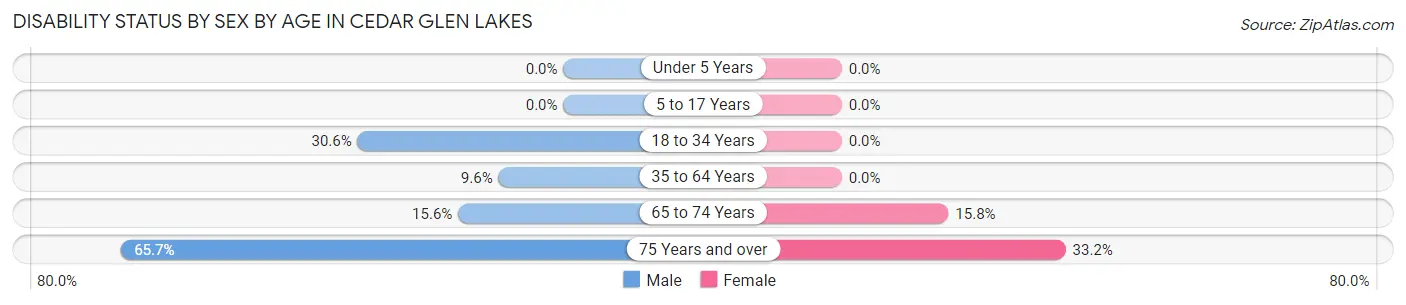
| Age Bracket | Male | Female |
| Under 5 Years | 0 (0.0%) | 0 (0.0%) |
| 5 to 17 Years | 0 (0.0%) | 0 (0.0%) |
| 18 to 34 Years | 11 (30.6%) | 0 (0.0%) |
| 35 to 64 Years | 13 (9.6%) | 0 (0.0%) |
| 65 to 74 Years | 20 (15.6%) | 63 (15.8%) |
| 75 Years and over | 172 (65.6%) | 115 (33.2%) |
Disability Class by Sex by Age in Cedar Glen Lakes
Disability Class: Hearing Difficulty
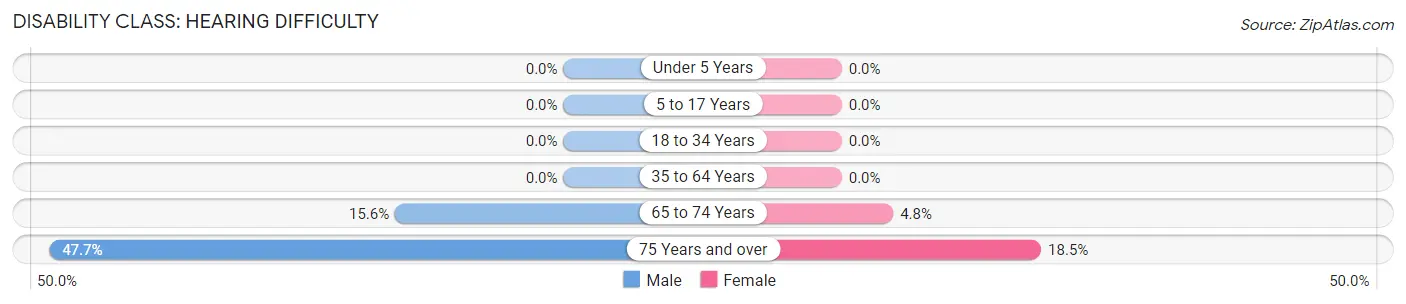
| Age Bracket | Male | Female |
| Under 5 Years | 0 (0.0%) | 0 (0.0%) |
| 5 to 17 Years | 0 (0.0%) | 0 (0.0%) |
| 18 to 34 Years | 0 (0.0%) | 0 (0.0%) |
| 35 to 64 Years | 0 (0.0%) | 0 (0.0%) |
| 65 to 74 Years | 20 (15.6%) | 19 (4.8%) |
| 75 Years and over | 125 (47.7%) | 64 (18.5%) |
Disability Class: Vision Difficulty
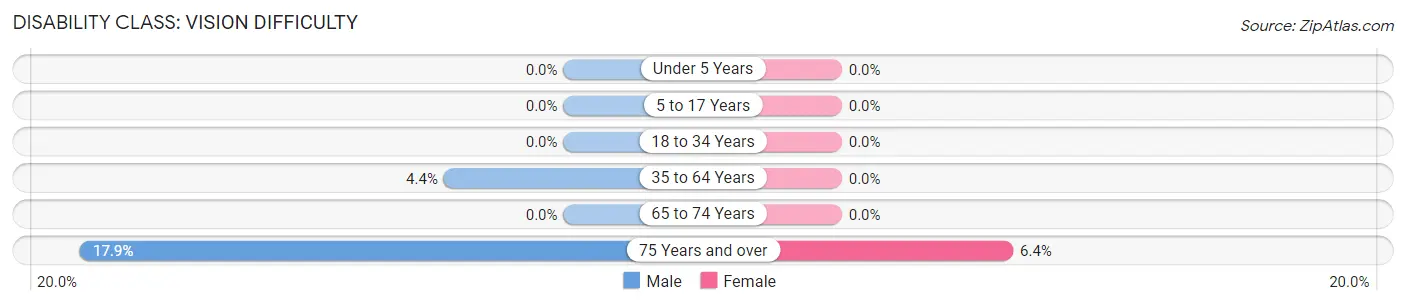
| Age Bracket | Male | Female |
| Under 5 Years | 0 (0.0%) | 0 (0.0%) |
| 5 to 17 Years | 0 (0.0%) | 0 (0.0%) |
| 18 to 34 Years | 0 (0.0%) | 0 (0.0%) |
| 35 to 64 Years | 6 (4.4%) | 0 (0.0%) |
| 65 to 74 Years | 0 (0.0%) | 0 (0.0%) |
| 75 Years and over | 47 (17.9%) | 22 (6.4%) |
Disability Class: Cognitive Difficulty
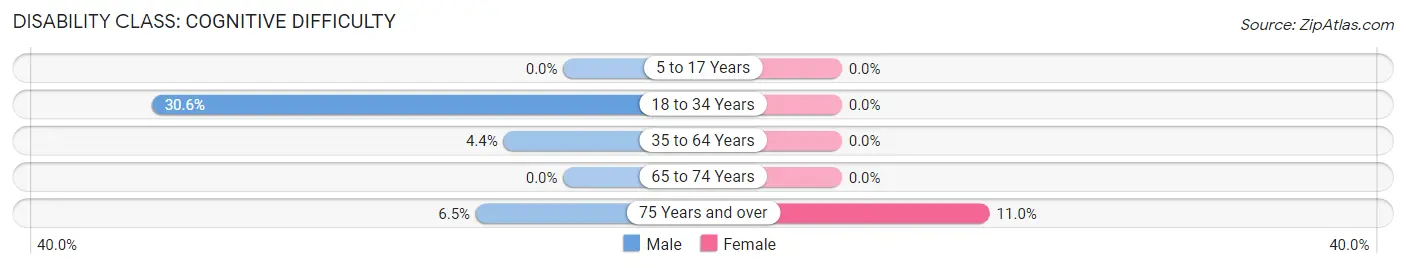
| Age Bracket | Male | Female |
| 5 to 17 Years | 0 (0.0%) | 0 (0.0%) |
| 18 to 34 Years | 11 (30.6%) | 0 (0.0%) |
| 35 to 64 Years | 6 (4.4%) | 0 (0.0%) |
| 65 to 74 Years | 0 (0.0%) | 0 (0.0%) |
| 75 Years and over | 17 (6.5%) | 38 (11.0%) |
Disability Class: Ambulatory Difficulty
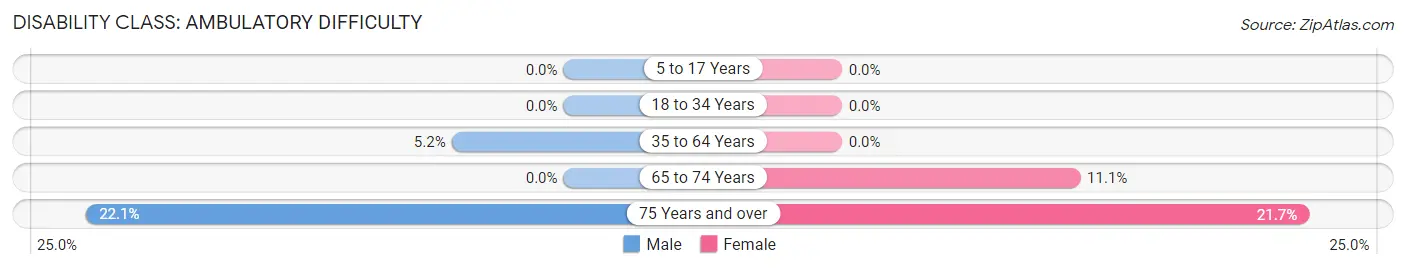
| Age Bracket | Male | Female |
| 5 to 17 Years | 0 (0.0%) | 0 (0.0%) |
| 18 to 34 Years | 0 (0.0%) | 0 (0.0%) |
| 35 to 64 Years | 7 (5.2%) | 0 (0.0%) |
| 65 to 74 Years | 0 (0.0%) | 44 (11.1%) |
| 75 Years and over | 58 (22.1%) | 75 (21.7%) |
Disability Class: Self-Care Difficulty
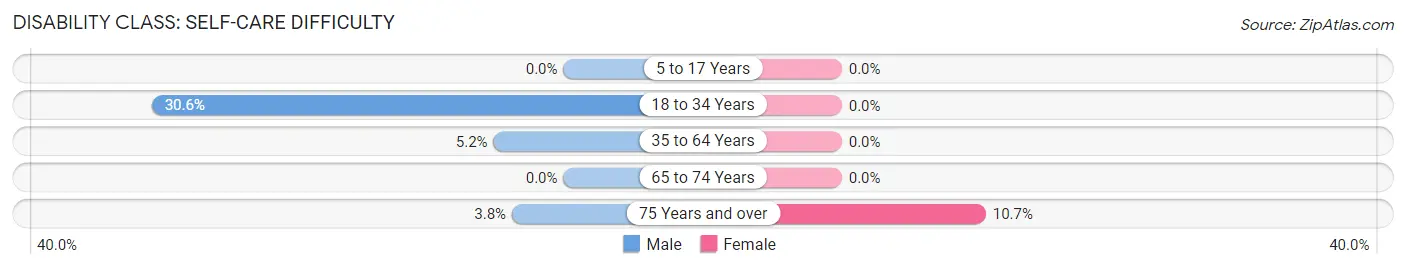
| Age Bracket | Male | Female |
| 5 to 17 Years | 0 (0.0%) | 0 (0.0%) |
| 18 to 34 Years | 11 (30.6%) | 0 (0.0%) |
| 35 to 64 Years | 7 (5.2%) | 0 (0.0%) |
| 65 to 74 Years | 0 (0.0%) | 0 (0.0%) |
| 75 Years and over | 10 (3.8%) | 37 (10.7%) |
Technology Access in Cedar Glen Lakes
Computing Device Access in Cedar Glen Lakes
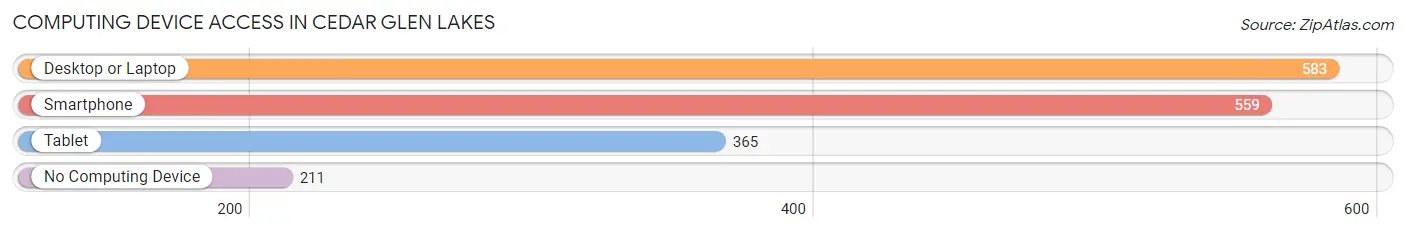
| Device Type | # Households | % Households |
| Desktop or Laptop | 583 | 59.6% |
| Smartphone | 559 | 57.1% |
| Tablet | 365 | 37.3% |
| No Computing Device | 211 | 21.5% |
| Total | 979 | 100.0% |
Internet Access in Cedar Glen Lakes
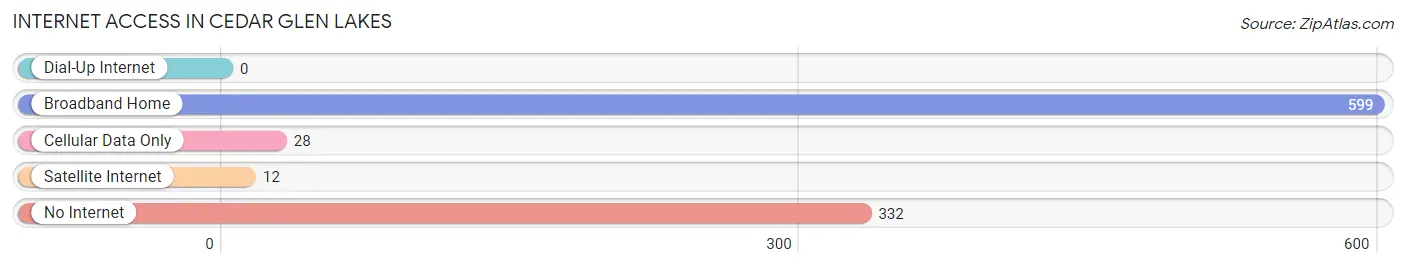
| Internet Type | # Households | % Households |
| Dial-Up Internet | 0 | 0.0% |
| Broadband Home | 599 | 61.2% |
| Cellular Data Only | 28 | 2.9% |
| Satellite Internet | 12 | 1.2% |
| No Internet | 332 | 33.9% |
| Total | 979 | 100.0% |
Cedar Glen Lakes Summary
Cedar Glen Lakes is a census-designated place located in Ocean County, New Jersey. It is situated within the township of Barnegat, and is part of the larger Barnegat-Manahawkin Metropolitan Statistical Area. The population of Cedar Glen Lakes was 2,845 at the 2010 United States Census.
Geography
Cedar Glen Lakes is located at 39°45'25" North, 74°17'17" West (39.7569, -74.2881). It is situated in the northern part of Ocean County, New Jersey, and is bordered by the townships of Barnegat and Stafford. The total area of Cedar Glen Lakes is 2.3 square miles, all of which is land.
The climate in Cedar Glen Lakes is typical of the mid-Atlantic region, with hot, humid summers and cold, wet winters. The average temperature in the summer is around 75°F, while the average winter temperature is around 35°F.
Economy
The economy of Cedar Glen Lakes is largely based on tourism and retail. The area is home to several small businesses, including restaurants, convenience stores, and other retail outlets. The area also has a number of recreational activities, such as fishing, boating, and swimming.
Demographics
As of the 2010 United States Census, there were 2,845 people, 1,093 households, and 817 families residing in Cedar Glen Lakes. The population density was 1,233.3 people per square mile. The racial makeup of the CDP was 94.2% White, 1.7% African American, 0.2% Native American, 1.2% Asian, 0.1% Pacific Islander, 1.2% from other races, and 1.6% from two or more races. Hispanic or Latino of any race were 4.2% of the population.
There were 1,093 households, out of which 28.2% had children under the age of 18 living with them, 58.2% were married couples living together, 9.7% had a female householder with no husband present, and 27.2% were non-families. 22.2% of all households were made up of individuals, and 10.2% had someone living alone who was 65 years of age or older. The average household size was 2.62 and the average family size was 3.06.
In Cedar Glen Lakes, the population was spread out, with 22.2% under the age of 18, 6.7% from 18 to 24, 24.2% from 25 to 44, 29.2% from 45 to 64, and 17.7% who were 65 years of age or older. The median age was 42 years. For every 100 females, there were 97.2 males. For every 100 females age 18 and over, there were 94.2 males.
The median income for a household in Cedar Glen Lakes was $60,938, and the median income for a family was $68,750. Males had a median income of $50,000 versus $35,000 for females. The per capita income for the CDP was $27,945. About 4.2% of families and 5.2% of the population were below the poverty line, including 6.2% of those under age 18 and 4.2% of those age 65 or over.
Conclusion
Cedar Glen Lakes is a census-designated place located in Ocean County, New Jersey. It is situated within the township of Barnegat, and is part of the larger Barnegat-Manahawkin Metropolitan Statistical Area. The population of Cedar Glen Lakes was 2,845 at the 2010 United States Census. The economy of Cedar Glen Lakes is largely based on tourism and retail, and the area is home to several small businesses. The racial makeup of the CDP was 94.2% White, 1.7% African American, 0.2% Native American, 1.2% Asian, 0.1% Pacific Islander, 1.2% from other races, and 1.6% from two or more races. The median income for a household in Cedar Glen Lakes was $60,938, and the median income for a family was $68,750.
Common Questions
What is Per Capita Income in Cedar Glen Lakes?
Per Capita income in Cedar Glen Lakes is $32,371.
What is the Median Family Income in Cedar Glen Lakes?
Median Family Income in Cedar Glen Lakes is $51,250.
What is the Median Household income in Cedar Glen Lakes?
Median Household Income in Cedar Glen Lakes is $38,171.
What is Inequality or Gini Index in Cedar Glen Lakes?
Inequality or Gini Index in Cedar Glen Lakes is 0.37.
What is the Total Population of Cedar Glen Lakes?
Total Population of Cedar Glen Lakes is 1,461.
What is the Total Male Population of Cedar Glen Lakes?
Total Male Population of Cedar Glen Lakes is 561.
What is the Total Female Population of Cedar Glen Lakes?
Total Female Population of Cedar Glen Lakes is 900.
What is the Ratio of Males per 100 Females in Cedar Glen Lakes?
There are 62.33 Males per 100 Females in Cedar Glen Lakes.
What is the Ratio of Females per 100 Males in Cedar Glen Lakes?
There are 160.43 Females per 100 Males in Cedar Glen Lakes.
What is the Median Population Age in Cedar Glen Lakes?
Median Population Age in Cedar Glen Lakes is 73.1 Years.
What is the Average Family Size in Cedar Glen Lakes
Average Family Size in Cedar Glen Lakes is 2.3 People.
What is the Average Household Size in Cedar Glen Lakes
Average Household Size in Cedar Glen Lakes is 1.5 People.
How Large is the Labor Force in Cedar Glen Lakes?
There are 289 People in the Labor Forcein in Cedar Glen Lakes.
What is the Percentage of People in the Labor Force in Cedar Glen Lakes?
19.8% of People are in the Labor Force in Cedar Glen Lakes.
What is the Unemployment Rate in Cedar Glen Lakes?
Unemployment Rate in Cedar Glen Lakes is 7.6%.