Brigantine, NJ Map & Demographics
Brigantine Map
Brigantine Overview
$63,648
PER CAPITA INCOME
$120,335
AVG FAMILY INCOME
$91,307
AVG HOUSEHOLD INCOME
34.8%
WAGE / INCOME GAP [ % ]
65.2¢/ $1
WAGE / INCOME GAP [ $ ]
$14,206
FAMILY INCOME DEFICIT
0.53
INEQUALITY / GINI INDEX
7,784
TOTAL POPULATION
3,455
MALE POPULATION
4,329
FEMALE POPULATION
79.81
MALES / 100 FEMALES
125.30
FEMALES / 100 MALES
57.6
MEDIAN AGE
2.6
AVG FAMILY SIZE
2.1
AVG HOUSEHOLD SIZE
4,250
LABOR FORCE [ PEOPLE ]
60.0%
PERCENT IN LABOR FORCE
4.9%
UNEMPLOYMENT RATE
Brigantine Zip Codes
Brigantine Area Codes
Income in Brigantine
Income Overview in Brigantine
Per Capita Income in Brigantine is $63,648, while median incomes of families and households are $120,335 and $91,307 respectively.
| Characteristic | Number | Measure |
| Per Capita Income | 7,784 | $63,648 |
| Median Family Income | 2,177 | $120,335 |
| Mean Family Income | 2,177 | $174,919 |
| Median Household Income | 3,748 | $91,307 |
| Mean Household Income | 3,748 | $136,294 |
| Income Deficit | 2,177 | $14,206 |
| Wage / Income Gap (%) | 7,784 | 34.85% |
| Wage / Income Gap ($) | 7,784 | 65.15¢ per $1 |
| Gini / Inequality Index | 7,784 | 0.53 |
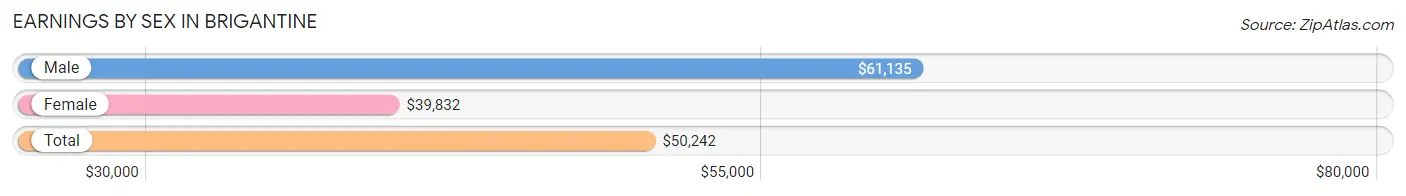
Earnings by Sex in Brigantine
Average Earnings in Brigantine are $50,242, $61,135 for men and $39,832 for women, a difference of 34.8%.
| Sex | Number | Average Earnings |
| Male | 2,197 (49.3%) | $61,135 |
| Female | 2,263 (50.7%) | $39,832 |
| Total | 4,460 (100.0%) | $50,242 |
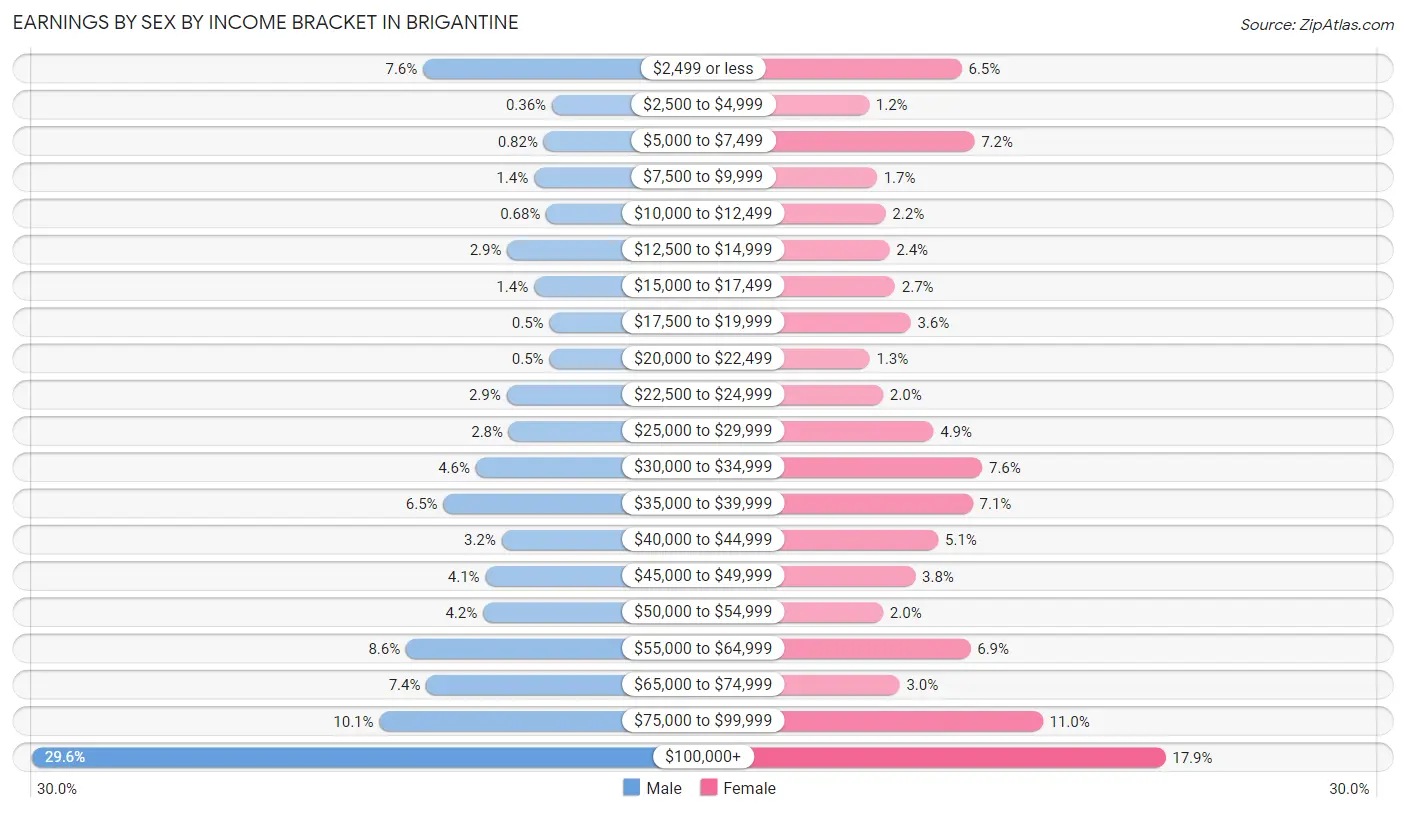
Earnings by Sex by Income Bracket in Brigantine
The most common earnings brackets in Brigantine are $100,000+ for men (650 | 29.6%) and $100,000+ for women (405 | 17.9%).
| Income | Male | Female |
| $2,499 or less | 167 (7.6%) | 146 (6.5%) |
| $2,500 to $4,999 | 8 (0.4%) | 28 (1.2%) |
| $5,000 to $7,499 | 18 (0.8%) | 162 (7.2%) |
| $7,500 to $9,999 | 30 (1.4%) | 38 (1.7%) |
| $10,000 to $12,499 | 15 (0.7%) | 49 (2.2%) |
| $12,500 to $14,999 | 63 (2.9%) | 54 (2.4%) |
| $15,000 to $17,499 | 30 (1.4%) | 61 (2.7%) |
| $17,500 to $19,999 | 11 (0.5%) | 81 (3.6%) |
| $20,000 to $22,499 | 11 (0.5%) | 29 (1.3%) |
| $22,500 to $24,999 | 64 (2.9%) | 46 (2.0%) |
| $25,000 to $29,999 | 61 (2.8%) | 110 (4.9%) |
| $30,000 to $34,999 | 102 (4.6%) | 172 (7.6%) |
| $35,000 to $39,999 | 142 (6.5%) | 160 (7.1%) |
| $40,000 to $44,999 | 70 (3.2%) | 116 (5.1%) |
| $45,000 to $49,999 | 90 (4.1%) | 87 (3.8%) |
| $50,000 to $54,999 | 93 (4.2%) | 46 (2.0%) |
| $55,000 to $64,999 | 188 (8.6%) | 157 (6.9%) |
| $65,000 to $74,999 | 163 (7.4%) | 67 (3.0%) |
| $75,000 to $99,999 | 221 (10.1%) | 249 (11.0%) |
| $100,000+ | 650 (29.6%) | 405 (17.9%) |
| Total | 2,197 (100.0%) | 2,263 (100.0%) |
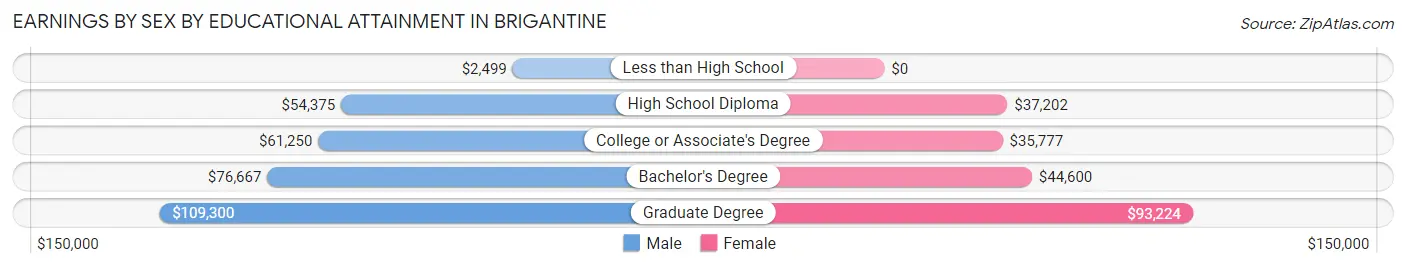
Earnings by Sex by Educational Attainment in Brigantine
Average earnings in Brigantine are $65,972 for men and $44,139 for women, a difference of 33.1%. Men with an educational attainment of graduate degree enjoy the highest average annual earnings of $109,300, while those with less than high school education earn the least with $2,499. Women with an educational attainment of graduate degree earn the most with the average annual earnings of $93,224, while those with college or associate's degree education have the smallest earnings of $35,777.
| Educational Attainment | Male Income | Female Income |
| Less than High School | $2,499 | $0 |
| High School Diploma | $54,375 | $37,202 |
| College or Associate's Degree | $61,250 | $35,777 |
| Bachelor's Degree | $76,667 | $44,600 |
| Graduate Degree | $109,300 | $93,224 |
| Total | $65,972 | $44,139 |
Family Income in Brigantine
Family Income Brackets in Brigantine
According to the Brigantine family income data, there are 527 families falling into the $200,000+ income range, which is the most common income bracket and makes up 24.2% of all families. Conversely, the $25,000 to $34,999 income bracket is the least frequent group with only 15 families (0.7%) belonging to this category.
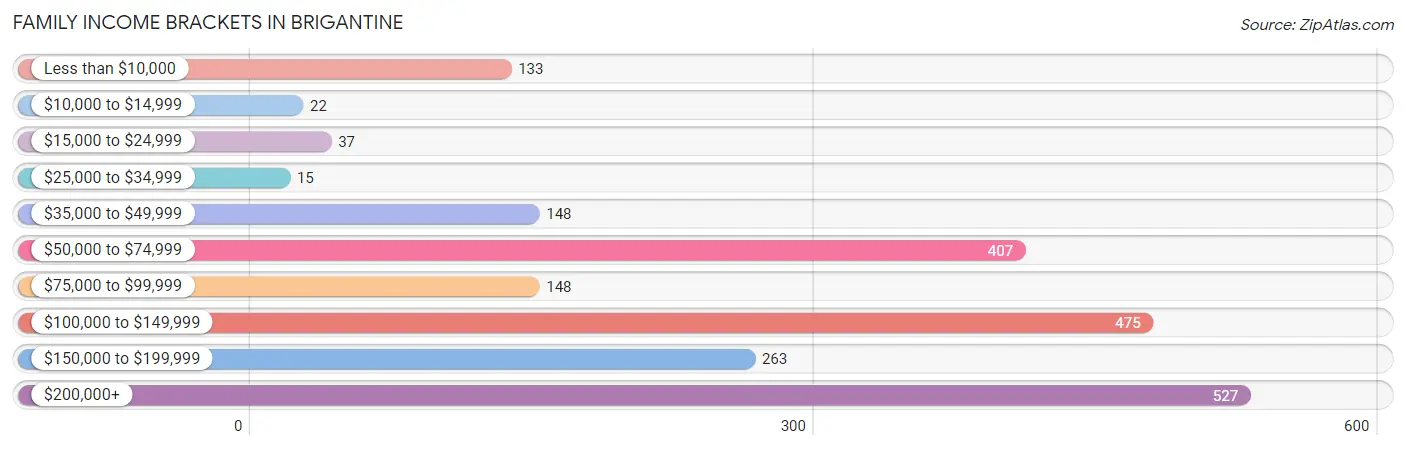
| Income Bracket | # Families | % Families |
| Less than $10,000 | 133 | 6.1% |
| $10,000 to $14,999 | 22 | 1.0% |
| $15,000 to $24,999 | 37 | 1.7% |
| $25,000 to $34,999 | 15 | 0.7% |
| $35,000 to $49,999 | 148 | 6.8% |
| $50,000 to $74,999 | 407 | 18.7% |
| $75,000 to $99,999 | 148 | 6.8% |
| $100,000 to $149,999 | 475 | 21.8% |
| $150,000 to $199,999 | 263 | 12.1% |
| $200,000+ | 527 | 24.2% |
Family Income by Famaliy Size in Brigantine
4-person families (282 | 13.0%) account for the highest median family income in Brigantine with $146,042 per family, while 2-person families (1,420 | 65.2%) have the highest median income of $49,850 per family member.

| Income Bracket | # Families | Median Income |
| 2-Person Families | 1,420 (65.2%) | $99,700 |
| 3-Person Families | 396 (18.2%) | $130,833 |
| 4-Person Families | 282 (13.0%) | $146,042 |
| 5-Person Families | 29 (1.3%) | $0 |
| 6-Person Families | 33 (1.5%) | $0 |
| 7+ Person Families | 17 (0.8%) | $0 |
| Total | 2,177 (100.0%) | $120,335 |
Family Income by Number of Earners in Brigantine
The median family income in Brigantine is $120,335, with families comprising 2 earners (740) having the highest median family income of $169,000, while families with 1 earner (732) have the lowest median family income of $71,800, accounting for 34.0% and 33.6% of families, respectively.
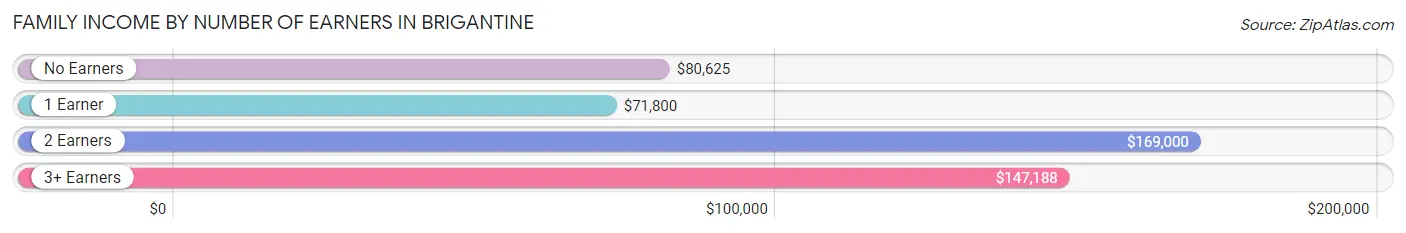
| Number of Earners | # Families | Median Income |
| No Earners | 442 (20.3%) | $80,625 |
| 1 Earner | 732 (33.6%) | $71,800 |
| 2 Earners | 740 (34.0%) | $169,000 |
| 3+ Earners | 263 (12.1%) | $147,188 |
| Total | 2,177 (100.0%) | $120,335 |
Household Income in Brigantine
Household Income Brackets in Brigantine
With 693 households falling in the category, the $100,000 to $149,999 income range is the most frequent in Brigantine, accounting for 18.5% of all households. In contrast, only 60 households (1.6%) fall into the $10,000 to $14,999 income bracket, making it the least populous group.
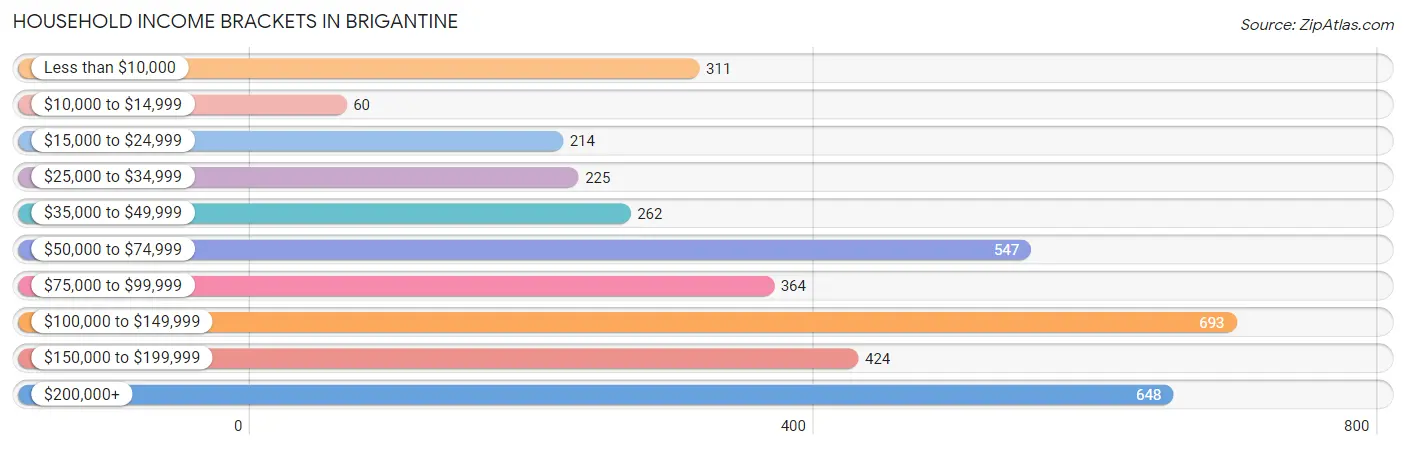
| Income Bracket | # Households | % Households |
| Less than $10,000 | 311 | 8.3% |
| $10,000 to $14,999 | 60 | 1.6% |
| $15,000 to $24,999 | 214 | 5.7% |
| $25,000 to $34,999 | 225 | 6.0% |
| $35,000 to $49,999 | 262 | 7.0% |
| $50,000 to $74,999 | 547 | 14.6% |
| $75,000 to $99,999 | 364 | 9.7% |
| $100,000 to $149,999 | 693 | 18.5% |
| $150,000 to $199,999 | 424 | 11.3% |
| $200,000+ | 648 | 17.3% |
Household Income by Householder Age in Brigantine
The median household income in Brigantine is $91,307, with the highest median household income of $125,323 found in the 45 to 64 years age bracket for the primary householder. A total of 1,593 households (42.5%) fall into this category. Meanwhile, the 15 to 24 years age bracket for the primary householder has the lowest median household income of $0, with 64 households (1.7%) in this group.
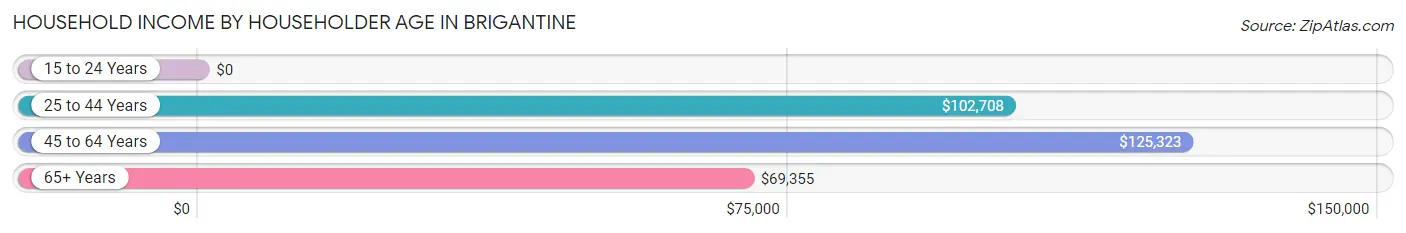
| Income Bracket | # Households | Median Income |
| 15 to 24 Years | 64 (1.7%) | $0 |
| 25 to 44 Years | 571 (15.2%) | $102,708 |
| 45 to 64 Years | 1,593 (42.5%) | $125,323 |
| 65+ Years | 1,520 (40.6%) | $69,355 |
| Total | 3,748 (100.0%) | $91,307 |
Poverty in Brigantine
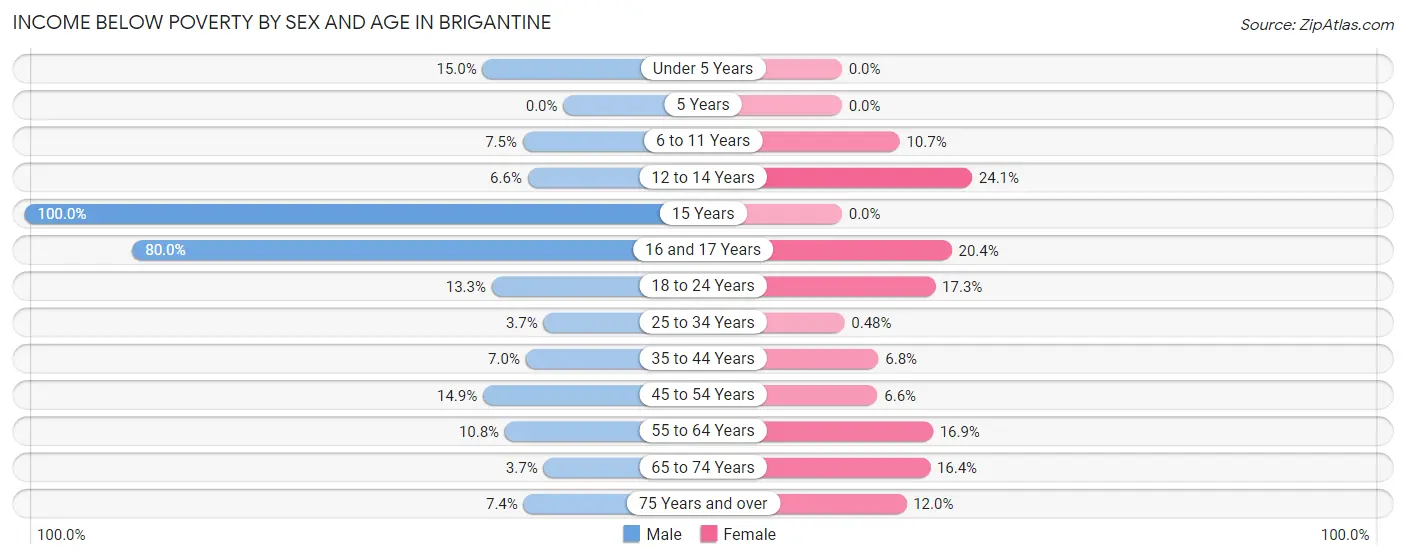
Income Below Poverty by Sex and Age in Brigantine
With 8.6% poverty level for males and 11.6% for females among the residents of Brigantine, 15 year old males and 12 to 14 year old females are the most vulnerable to poverty, with 5 males (100.0%) and 7 females (24.1%) in their respective age groups living below the poverty level.
| Age Bracket | Male | Female |
| Under 5 Years | 3 (15.0%) | 0 (0.0%) |
| 5 Years | 0 (0.0%) | 0 (0.0%) |
| 6 to 11 Years | 7 (7.5%) | 21 (10.7%) |
| 12 to 14 Years | 8 (6.6%) | 7 (24.1%) |
| 15 Years | 5 (100.0%) | 0 (0.0%) |
| 16 and 17 Years | 8 (80.0%) | 11 (20.4%) |
| 18 to 24 Years | 34 (13.3%) | 39 (17.3%) |
| 25 to 34 Years | 17 (3.7%) | 2 (0.5%) |
| 35 to 44 Years | 18 (7.0%) | 23 (6.8%) |
| 45 to 54 Years | 51 (14.9%) | 32 (6.6%) |
| 55 to 64 Years | 96 (10.8%) | 153 (16.9%) |
| 65 to 74 Years | 22 (3.7%) | 144 (16.4%) |
| 75 Years and over | 27 (7.4%) | 72 (12.0%) |
| Total | 296 (8.6%) | 504 (11.6%) |
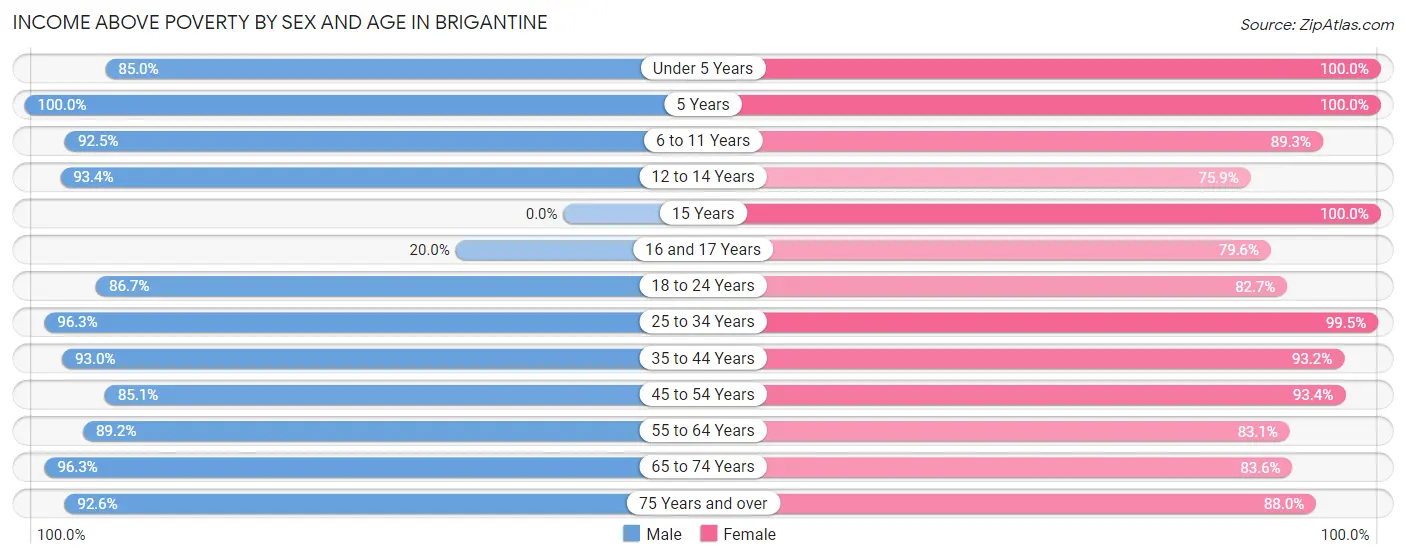
Income Above Poverty by Sex and Age in Brigantine
According to the poverty statistics in Brigantine, males aged 5 years and females aged under 5 years are the age groups that are most secure financially, with 100.0% of males and 100.0% of females in these age groups living above the poverty line.
| Age Bracket | Male | Female |
| Under 5 Years | 17 (85.0%) | 173 (100.0%) |
| 5 Years | 39 (100.0%) | 4 (100.0%) |
| 6 to 11 Years | 86 (92.5%) | 175 (89.3%) |
| 12 to 14 Years | 113 (93.4%) | 22 (75.9%) |
| 15 Years | 0 (0.0%) | 21 (100.0%) |
| 16 and 17 Years | 2 (20.0%) | 43 (79.6%) |
| 18 to 24 Years | 222 (86.7%) | 186 (82.7%) |
| 25 to 34 Years | 446 (96.3%) | 412 (99.5%) |
| 35 to 44 Years | 240 (93.0%) | 316 (93.2%) |
| 45 to 54 Years | 291 (85.1%) | 453 (93.4%) |
| 55 to 64 Years | 790 (89.2%) | 754 (83.1%) |
| 65 to 74 Years | 574 (96.3%) | 736 (83.6%) |
| 75 Years and over | 339 (92.6%) | 530 (88.0%) |
| Total | 3,159 (91.4%) | 3,825 (88.4%) |
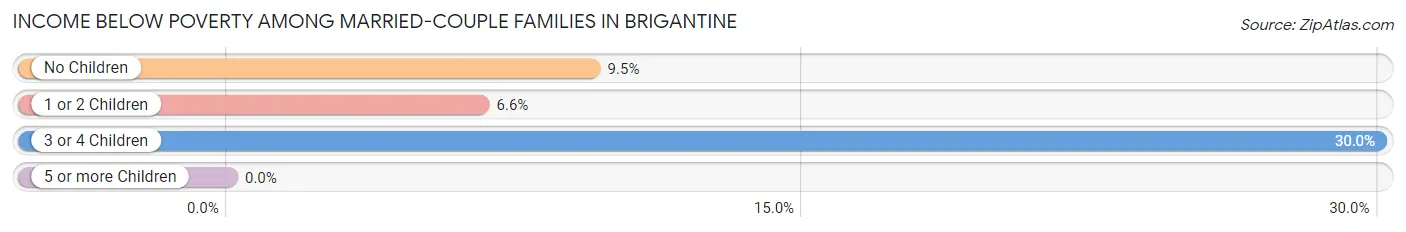
Income Below Poverty Among Married-Couple Families in Brigantine
The poverty statistics for married-couple families in Brigantine show that 9.3% or 156 of the total 1,685 families live below the poverty line. Families with 3 or 4 children have the highest poverty rate of 30.0%, comprising of 9 families. On the other hand, families with 1 or 2 children have the lowest poverty rate of 6.6%, which includes 22 families.
| Children | Above Poverty | Below Poverty |
| No Children | 1,195 (90.5%) | 125 (9.5%) |
| 1 or 2 Children | 313 (93.4%) | 22 (6.6%) |
| 3 or 4 Children | 21 (70.0%) | 9 (30.0%) |
| 5 or more Children | 0 (0.0%) | 0 (0.0%) |
| Total | 1,529 (90.7%) | 156 (9.3%) |
Income Below Poverty Among Single-Parent Households in Brigantine
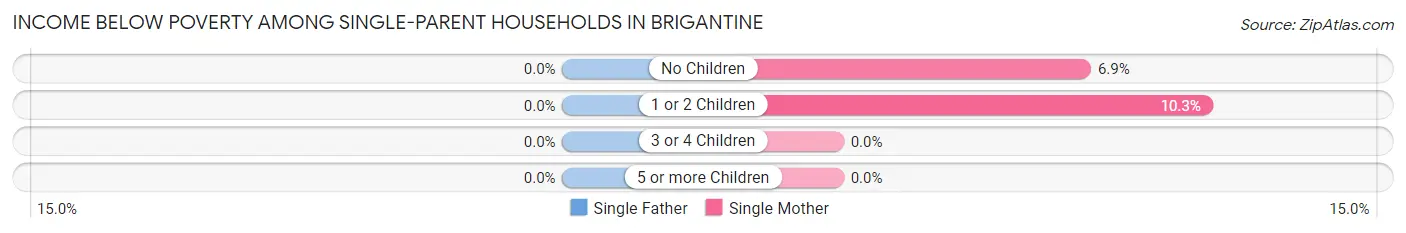
| Children | Single Father | Single Mother |
| No Children | 0 (0.0%) | 15 (6.9%) |
| 1 or 2 Children | 0 (0.0%) | 10 (10.3%) |
| 3 or 4 Children | 0 (0.0%) | 0 (0.0%) |
| 5 or more Children | 0 (0.0%) | 0 (0.0%) |
| Total | 0 (0.0%) | 25 (8.0%) |
Income Below Poverty Among Married-Couple vs Single-Parent Households in Brigantine
The poverty data for Brigantine shows that 156 of the married-couple family households (9.3%) and 25 of the single-parent households (5.1%) are living below the poverty level. Within the married-couple family households, those with 3 or 4 children have the highest poverty rate, with 9 households (30.0%) falling below the poverty line. Among the single-parent households, those with 1 or 2 children have the highest poverty rate, with 10 household (6.7%) living below poverty.
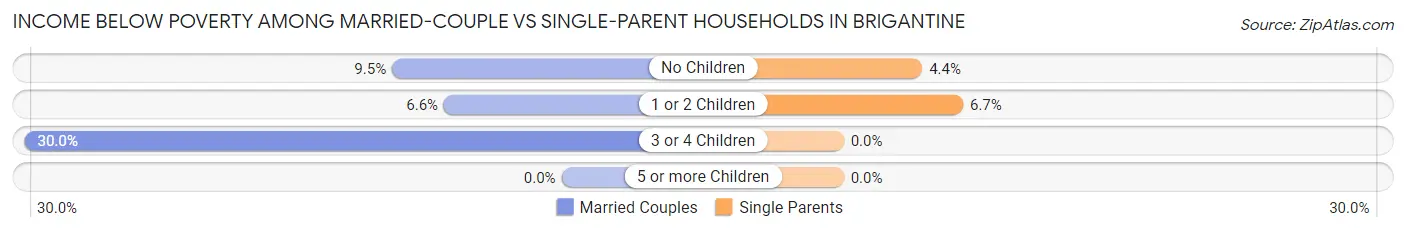
| Children | Married-Couple Families | Single-Parent Households |
| No Children | 125 (9.5%) | 15 (4.4%) |
| 1 or 2 Children | 22 (6.6%) | 10 (6.7%) |
| 3 or 4 Children | 9 (30.0%) | 0 (0.0%) |
| 5 or more Children | 0 (0.0%) | 0 (0.0%) |
| Total | 156 (9.3%) | 25 (5.1%) |
Race in Brigantine
The most populous races in Brigantine are White / Caucasian (6,527 | 83.9%), Hispanic or Latino (604 | 7.8%), and Asian (546 | 7.0%).
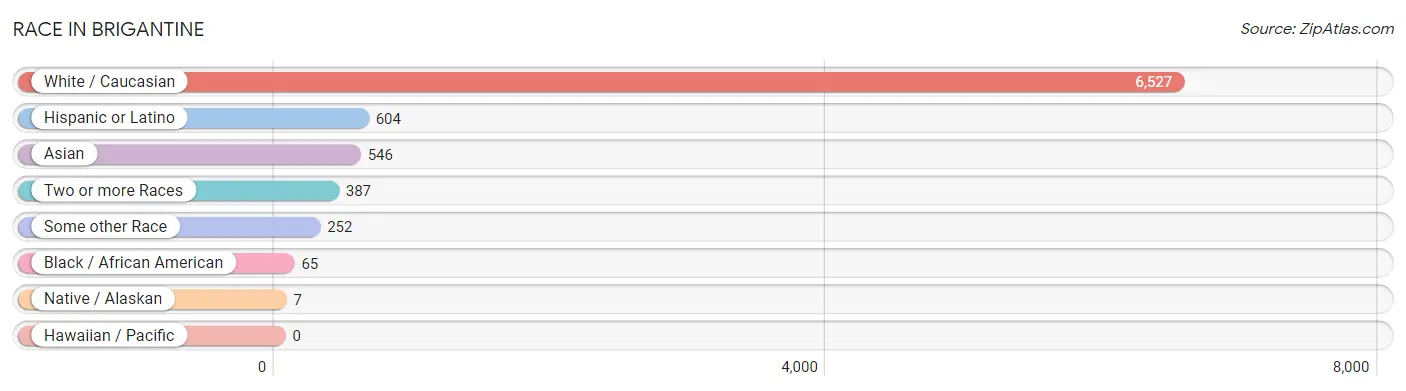
| Race | # Population | % Population |
| Asian | 546 | 7.0% |
| Black / African American | 65 | 0.8% |
| Hawaiian / Pacific | 0 | 0.0% |
| Hispanic or Latino | 604 | 7.8% |
| Native / Alaskan | 7 | 0.1% |
| White / Caucasian | 6,527 | 83.9% |
| Two or more Races | 387 | 5.0% |
| Some other Race | 252 | 3.2% |
| Total | 7,784 | 100.0% |
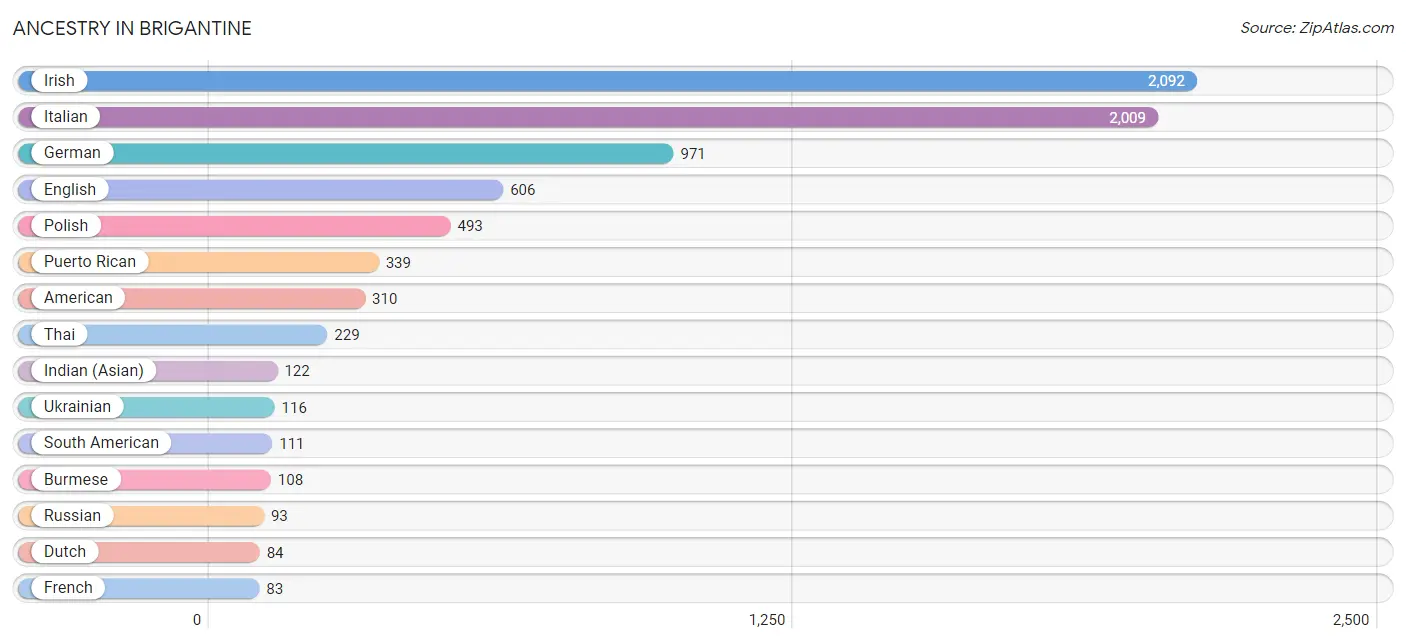
Ancestry in Brigantine
The most populous ancestries reported in Brigantine are Irish (2,092 | 26.9%), Italian (2,009 | 25.8%), German (971 | 12.5%), English (606 | 7.8%), and Polish (493 | 6.3%), together accounting for 79.3% of all Brigantine residents.
| Ancestry | # Population | % Population |
| Albanian | 10 | 0.1% |
| American | 310 | 4.0% |
| Arab | 61 | 0.8% |
| Armenian | 67 | 0.9% |
| Austrian | 31 | 0.4% |
| Belgian | 7 | 0.1% |
| Bhutanese | 11 | 0.1% |
| British | 51 | 0.7% |
| Bulgarian | 31 | 0.4% |
| Burmese | 108 | 1.4% |
| Canadian | 6 | 0.1% |
| Central American | 40 | 0.5% |
| Chilean | 7 | 0.1% |
| Colombian | 76 | 1.0% |
| Cuban | 34 | 0.4% |
| Czech | 3 | 0.0% |
| Danish | 27 | 0.4% |
| Dominican | 48 | 0.6% |
| Dutch | 84 | 1.1% |
| Eastern European | 19 | 0.2% |
| Ecuadorian | 28 | 0.4% |
| Egyptian | 9 | 0.1% |
| English | 606 | 7.8% |
| European | 47 | 0.6% |
| Finnish | 1 | 0.0% |
| French | 83 | 1.1% |
| French Canadian | 5 | 0.1% |
| German | 971 | 12.5% |
| Greek | 58 | 0.7% |
| Hungarian | 44 | 0.6% |
| Indian (Asian) | 122 | 1.6% |
| Inupiat | 2 | 0.0% |
| Irish | 2,092 | 26.9% |
| Italian | 2,009 | 25.8% |
| Korean | 28 | 0.4% |
| Lebanese | 5 | 0.1% |
| Lithuanian | 48 | 0.6% |
| Mexican | 32 | 0.4% |
| Moroccan | 41 | 0.5% |
| Nicaraguan | 9 | 0.1% |
| Northern European | 5 | 0.1% |
| Norwegian | 22 | 0.3% |
| Polish | 493 | 6.3% |
| Portuguese | 17 | 0.2% |
| Puerto Rican | 339 | 4.4% |
| Romanian | 12 | 0.2% |
| Russian | 93 | 1.2% |
| Salvadoran | 31 | 0.4% |
| Scotch-Irish | 31 | 0.4% |
| Scottish | 76 | 1.0% |
| Serbian | 5 | 0.1% |
| Slavic | 13 | 0.2% |
| Slovak | 38 | 0.5% |
| South African | 3 | 0.0% |
| South American | 111 | 1.4% |
| Subsaharan African | 3 | 0.0% |
| Swiss | 12 | 0.2% |
| Thai | 229 | 2.9% |
| Ukrainian | 116 | 1.5% |
| Welsh | 60 | 0.8% |
| Yugoslavian | 7 | 0.1% | View All 61 Rows |
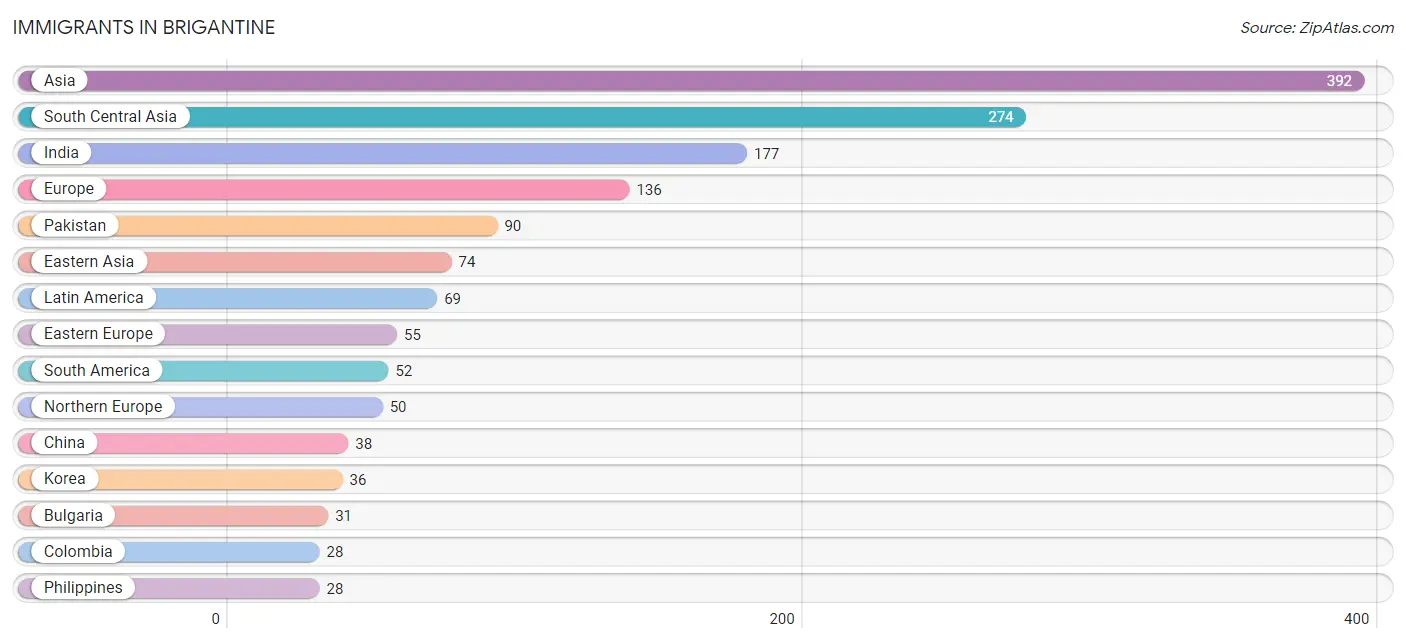
Immigrants in Brigantine
The most numerous immigrant groups reported in Brigantine came from Asia (392 | 5.0%), South Central Asia (274 | 3.5%), India (177 | 2.3%), Europe (136 | 1.8%), and Pakistan (90 | 1.2%), together accounting for 13.7% of all Brigantine residents.
| Immigration Origin | # Population | % Population |
| Africa | 6 | 0.1% |
| Asia | 392 | 5.0% |
| Bangladesh | 7 | 0.1% |
| Bulgaria | 31 | 0.4% |
| Caribbean | 10 | 0.1% |
| Central America | 7 | 0.1% |
| Chile | 7 | 0.1% |
| China | 38 | 0.5% |
| Colombia | 28 | 0.4% |
| Denmark | 6 | 0.1% |
| Dominican Republic | 10 | 0.1% |
| Eastern Asia | 74 | 0.9% |
| Eastern Europe | 55 | 0.7% |
| Ecuador | 17 | 0.2% |
| Europe | 136 | 1.8% |
| Germany | 8 | 0.1% |
| Hungary | 19 | 0.2% |
| India | 177 | 2.3% |
| Ireland | 8 | 0.1% |
| Israel | 5 | 0.1% |
| Italy | 23 | 0.3% |
| Korea | 36 | 0.5% |
| Latin America | 69 | 0.9% |
| Lebanon | 11 | 0.1% |
| Mexico | 7 | 0.1% |
| Moldova | 4 | 0.1% |
| Morocco | 6 | 0.1% |
| Northern Africa | 6 | 0.1% |
| Northern Europe | 50 | 0.6% |
| Pakistan | 90 | 1.2% |
| Philippines | 28 | 0.4% |
| Scotland | 10 | 0.1% |
| South America | 52 | 0.7% |
| South Central Asia | 274 | 3.5% |
| South Eastern Asia | 28 | 0.4% |
| Southern Europe | 23 | 0.3% |
| Ukraine | 1 | 0.0% |
| Western Asia | 16 | 0.2% |
| Western Europe | 8 | 0.1% | View All 39 Rows |
Sex and Age in Brigantine
Sex and Age in Brigantine
The most populous age groups in Brigantine are 60 to 64 Years (474 | 13.7%) for men and 65 to 69 Years (511 | 11.8%) for women.
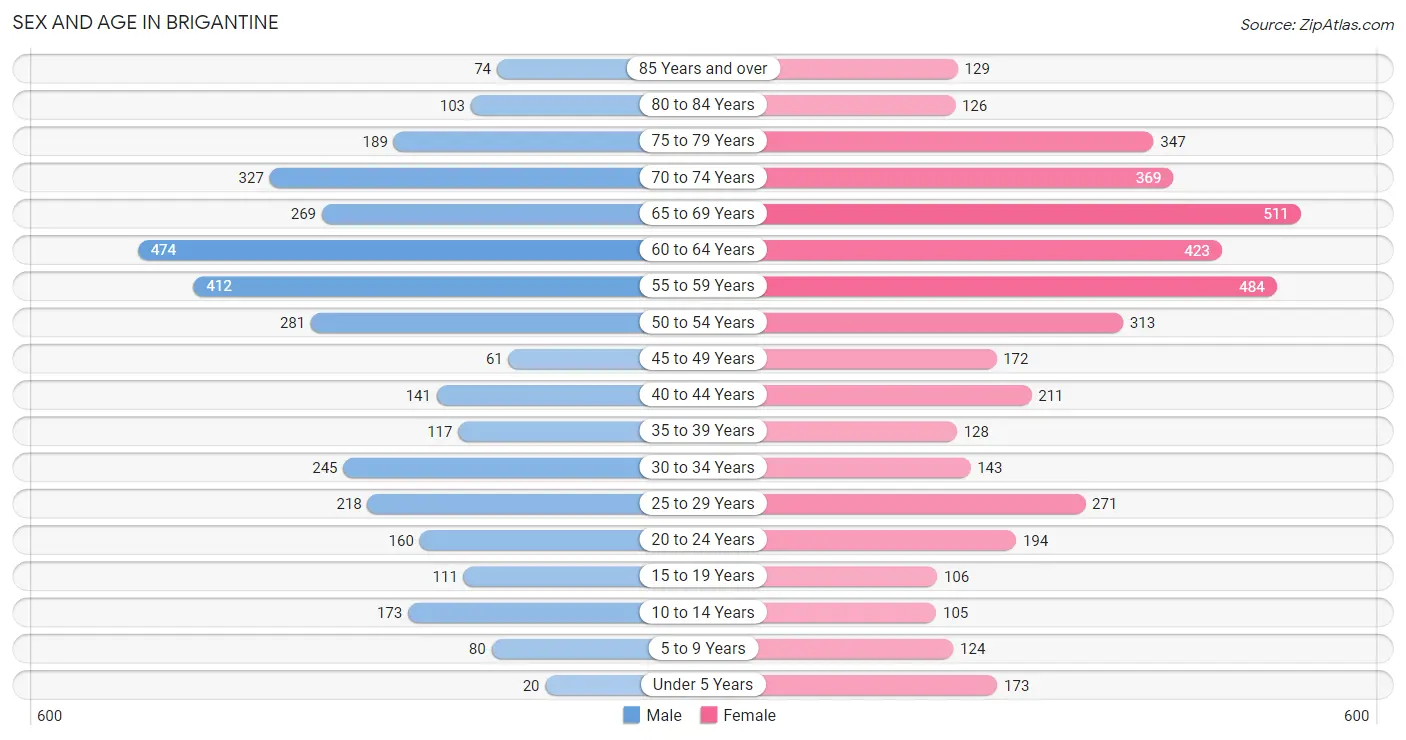
| Age Bracket | Male | Female |
| Under 5 Years | 20 (0.6%) | 173 (4.0%) |
| 5 to 9 Years | 80 (2.3%) | 124 (2.9%) |
| 10 to 14 Years | 173 (5.0%) | 105 (2.4%) |
| 15 to 19 Years | 111 (3.2%) | 106 (2.5%) |
| 20 to 24 Years | 160 (4.6%) | 194 (4.5%) |
| 25 to 29 Years | 218 (6.3%) | 271 (6.3%) |
| 30 to 34 Years | 245 (7.1%) | 143 (3.3%) |
| 35 to 39 Years | 117 (3.4%) | 128 (3.0%) |
| 40 to 44 Years | 141 (4.1%) | 211 (4.9%) |
| 45 to 49 Years | 61 (1.8%) | 172 (4.0%) |
| 50 to 54 Years | 281 (8.1%) | 313 (7.2%) |
| 55 to 59 Years | 412 (11.9%) | 484 (11.2%) |
| 60 to 64 Years | 474 (13.7%) | 423 (9.8%) |
| 65 to 69 Years | 269 (7.8%) | 511 (11.8%) |
| 70 to 74 Years | 327 (9.5%) | 369 (8.5%) |
| 75 to 79 Years | 189 (5.5%) | 347 (8.0%) |
| 80 to 84 Years | 103 (3.0%) | 126 (2.9%) |
| 85 Years and over | 74 (2.1%) | 129 (3.0%) |
| Total | 3,455 (100.0%) | 4,329 (100.0%) |
Families and Households in Brigantine
Median Family Size in Brigantine
The median family size in Brigantine is 2.61 persons per family, with married-couple families (1,685 | 77.4%) accounting for the largest median family size of 2.72 persons per family. On the other hand, single female/mother families (314 | 14.4%) represent the smallest median family size with 2.23 persons per family.
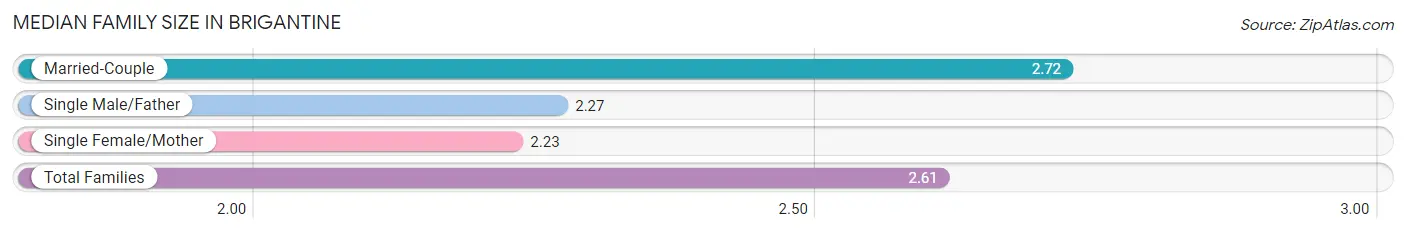
| Family Type | # Families | Family Size |
| Married-Couple | 1,685 (77.4%) | 2.72 |
| Single Male/Father | 178 (8.2%) | 2.27 |
| Single Female/Mother | 314 (14.4%) | 2.23 |
| Total Families | 2,177 (100.0%) | 2.61 |
Median Household Size in Brigantine
The median household size in Brigantine is 2.08 persons per household, with married-couple households (1,685 | 45.0%) accounting for the largest median household size of 2.73 persons per household. non-family households (1,571 | 41.9%) represent the smallest median household size with 1.24 persons per household.
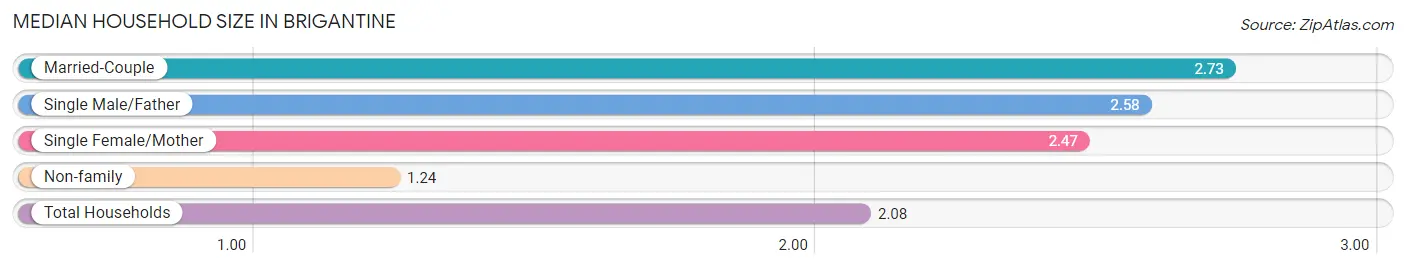
| Household Type | # Households | Household Size |
| Married-Couple | 1,685 (45.0%) | 2.73 |
| Single Male/Father | 178 (4.8%) | 2.58 |
| Single Female/Mother | 314 (8.4%) | 2.47 |
| Non-family | 1,571 (41.9%) | 1.24 |
| Total Households | 3,748 (100.0%) | 2.08 |
Household Size by Marriage Status in Brigantine
Out of a total of 3,748 households in Brigantine, 2,177 (58.1%) are family households, while 1,571 (41.9%) are nonfamily households. The most numerous type of family households are 2-person households, comprising 1,287, and the most common type of nonfamily households are 1-person households, comprising 1,240.
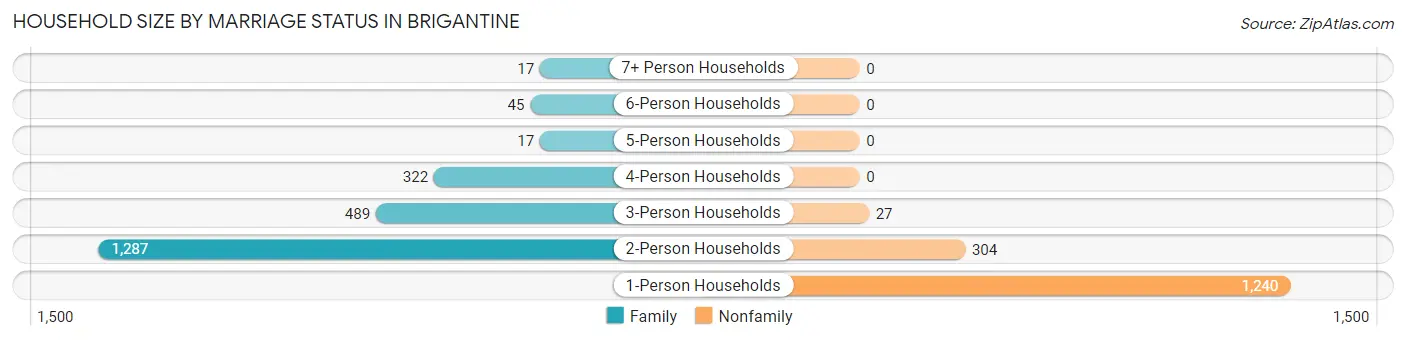
| Household Size | Family Households | Nonfamily Households |
| 1-Person Households | - | 1,240 (33.1%) |
| 2-Person Households | 1,287 (34.3%) | 304 (8.1%) |
| 3-Person Households | 489 (13.1%) | 27 (0.7%) |
| 4-Person Households | 322 (8.6%) | 0 (0.0%) |
| 5-Person Households | 17 (0.4%) | 0 (0.0%) |
| 6-Person Households | 45 (1.2%) | 0 (0.0%) |
| 7+ Person Households | 17 (0.4%) | 0 (0.0%) |
| Total | 2,177 (58.1%) | 1,571 (41.9%) |
Female Fertility in Brigantine
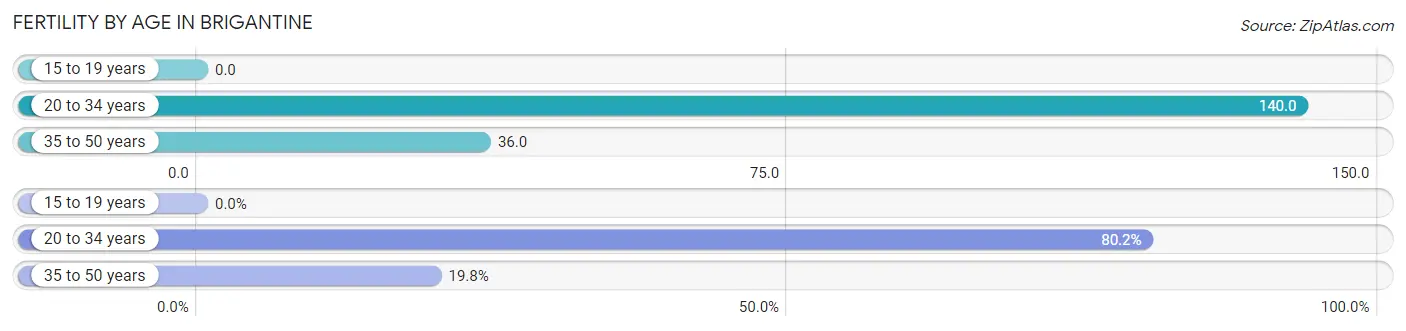
Fertility by Age in Brigantine
Average fertility rate in Brigantine is 81.0 births per 1,000 women. Women in the age bracket of 20 to 34 years have the highest fertility rate with 140.0 births per 1,000 women. Women in the age bracket of 20 to 34 years acount for 80.2% of all women with births.
| Age Bracket | Women with Births | Births / 1,000 Women |
| 15 to 19 years | 0 (0.0%) | 0.0 |
| 20 to 34 years | 85 (80.2%) | 140.0 |
| 35 to 50 years | 21 (19.8%) | 36.0 |
| Total | 106 (100.0%) | 81.0 |
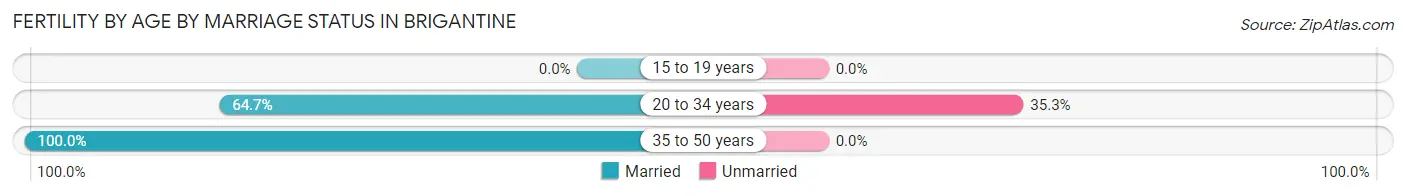
Fertility by Age by Marriage Status in Brigantine
71.7% of women with births (106) in Brigantine are married. The highest percentage of unmarried women with births falls into 20 to 34 years age bracket with 35.3% of them unmarried at the time of birth, while the lowest percentage of unmarried women with births belong to 35 to 50 years age bracket with 0.0% of them unmarried.
| Age Bracket | Married | Unmarried |
| 15 to 19 years | 0 (0.0%) | 0 (0.0%) |
| 20 to 34 years | 55 (64.7%) | 30 (35.3%) |
| 35 to 50 years | 21 (100.0%) | 0 (0.0%) |
| Total | 76 (71.7%) | 30 (28.3%) |
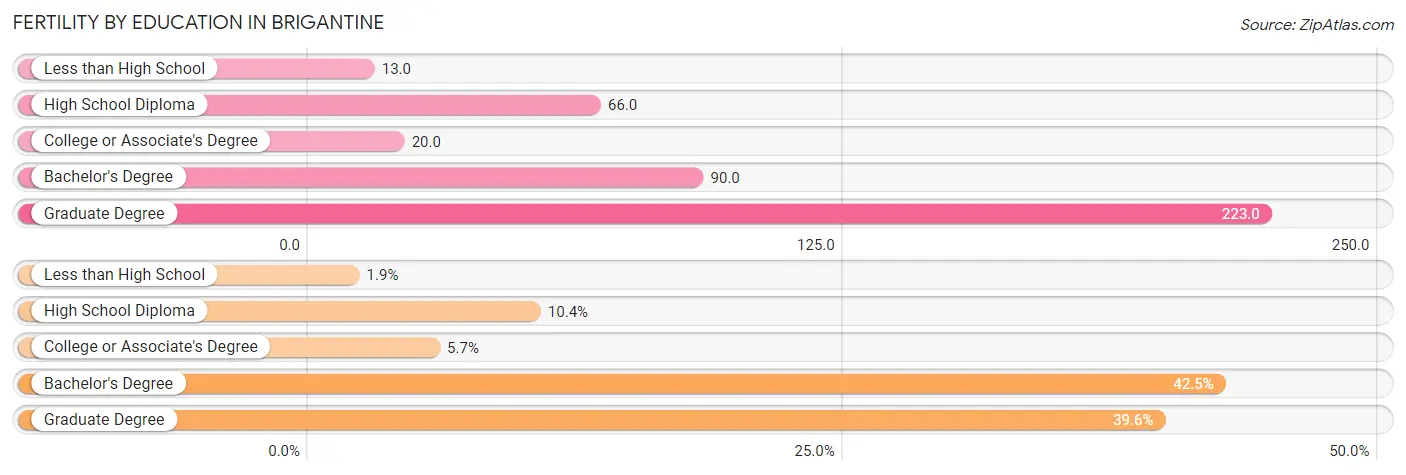
Fertility by Education in Brigantine
Average fertility rate in Brigantine is 81.0 births per 1,000 women. Women with the education attainment of graduate degree have the highest fertility rate of 223.0 births per 1,000 women, while women with the education attainment of less than high school have the lowest fertility at 13.0 births per 1,000 women. Women with the education attainment of bachelor's degree represent 42.4% of all women with births.
| Educational Attainment | Women with Births | Births / 1,000 Women |
| Less than High School | 2 (1.9%) | 13.0 |
| High School Diploma | 11 (10.4%) | 66.0 |
| College or Associate's Degree | 6 (5.7%) | 20.0 |
| Bachelor's Degree | 45 (42.4%) | 90.0 |
| Graduate Degree | 42 (39.6%) | 223.0 |
| Total | 106 (100.0%) | 81.0 |
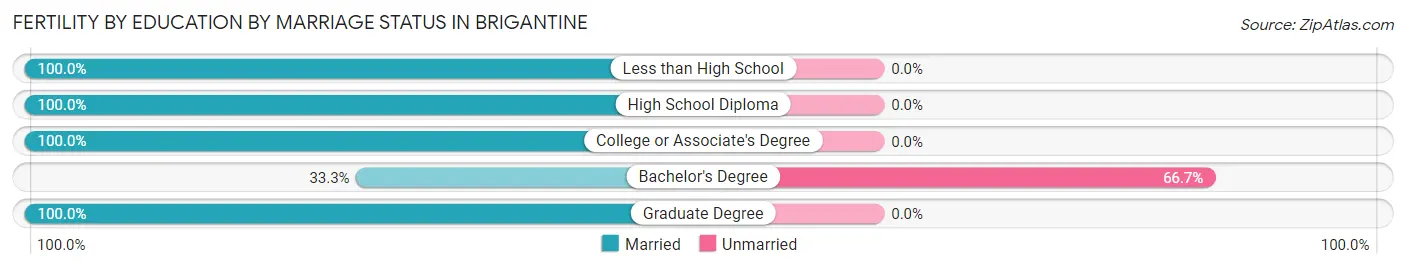
Fertility by Education by Marriage Status in Brigantine
28.3% of women with births in Brigantine are unmarried. Women with the educational attainment of less than high school are most likely to be married with 100.0% of them married at childbirth, while women with the educational attainment of bachelor's degree are least likely to be married with 66.7% of them unmarried at childbirth.
| Educational Attainment | Married | Unmarried |
| Less than High School | 2 (100.0%) | 0 (0.0%) |
| High School Diploma | 11 (100.0%) | 0 (0.0%) |
| College or Associate's Degree | 6 (100.0%) | 0 (0.0%) |
| Bachelor's Degree | 15 (33.3%) | 30 (66.7%) |
| Graduate Degree | 42 (100.0%) | 0 (0.0%) |
| Total | 76 (71.7%) | 30 (28.3%) |
Employment Characteristics in Brigantine
Employment by Class of Employer in Brigantine
Among the 3,902 employed individuals in Brigantine, private company employees (2,597 | 66.6%), local government employees (419 | 10.7%), and not-for-profit organizations (336 | 8.6%) make up the most common classes of employment.
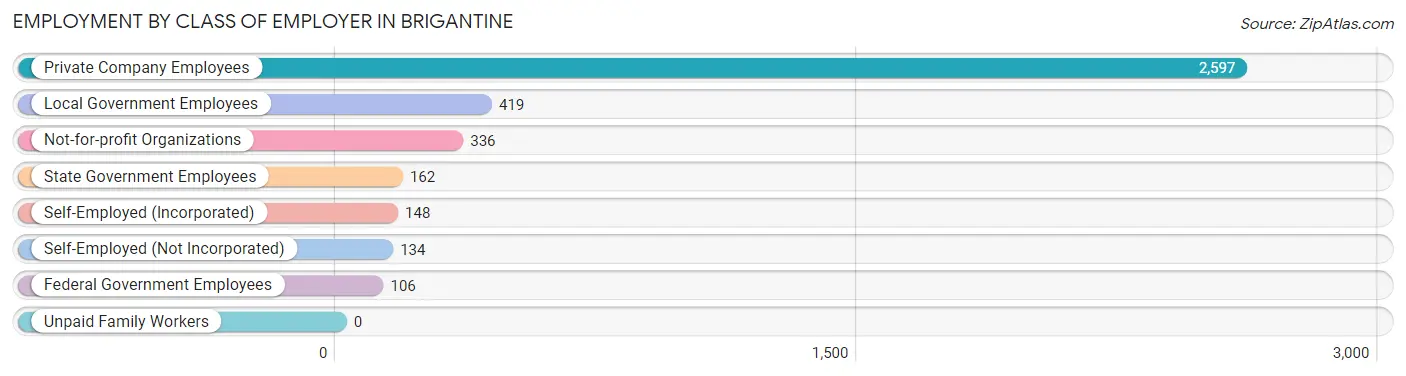
| Employer Class | # Employees | % Employees |
| Private Company Employees | 2,597 | 66.6% |
| Self-Employed (Incorporated) | 148 | 3.8% |
| Self-Employed (Not Incorporated) | 134 | 3.4% |
| Not-for-profit Organizations | 336 | 8.6% |
| Local Government Employees | 419 | 10.7% |
| State Government Employees | 162 | 4.2% |
| Federal Government Employees | 106 | 2.7% |
| Unpaid Family Workers | 0 | 0.0% |
| Total | 3,902 | 100.0% |
Employment Status by Age in Brigantine
According to the labor force statistics for Brigantine, out of the total population over 16 years of age (7,083), 60.0% or 4,250 individuals are in the labor force, with 4.9% or 208 of them unemployed. The age group with the highest labor force participation rate is 20 to 24 years, with 89.8% or 318 individuals in the labor force. Within the labor force, the 16 to 19 years age range has the highest percentage of unemployed individuals, with 16.0% or 15 of them being unemployed.
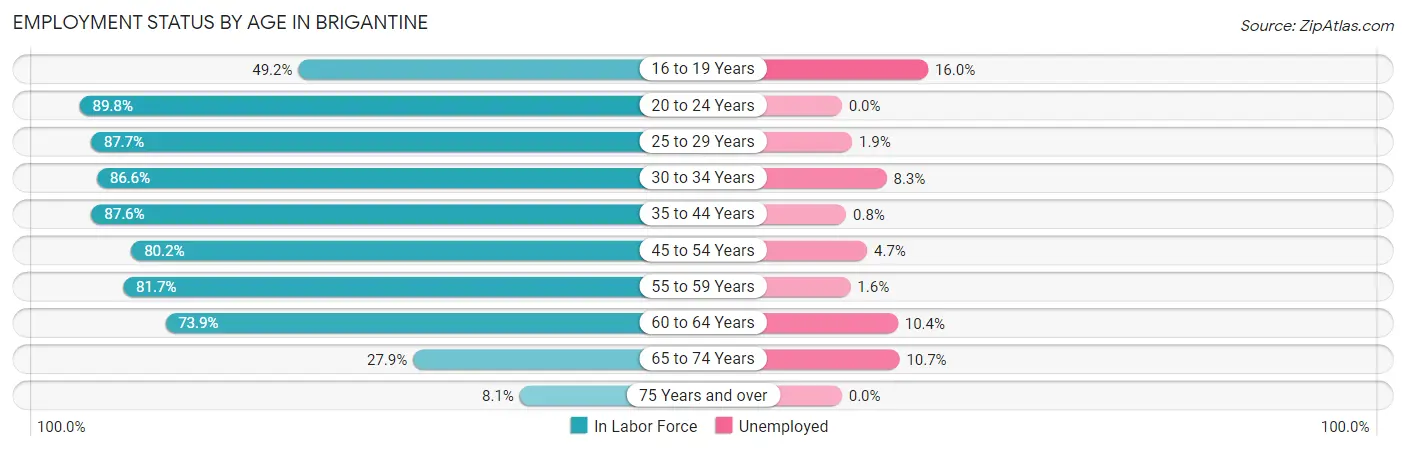
| Age Bracket | In Labor Force | Unemployed |
| 16 to 19 Years | 94 (49.2%) | 15 (16.0%) |
| 20 to 24 Years | 318 (89.8%) | 0 (0.0%) |
| 25 to 29 Years | 429 (87.7%) | 8 (1.9%) |
| 30 to 34 Years | 336 (86.6%) | 28 (8.3%) |
| 35 to 44 Years | 523 (87.6%) | 4 (0.8%) |
| 45 to 54 Years | 663 (80.2%) | 31 (4.7%) |
| 55 to 59 Years | 732 (81.7%) | 12 (1.6%) |
| 60 to 64 Years | 663 (73.9%) | 69 (10.4%) |
| 65 to 74 Years | 412 (27.9%) | 44 (10.7%) |
| 75 Years and over | 78 (8.1%) | 0 (0.0%) |
| Total | 4,250 (60.0%) | 208 (4.9%) |
Employment Status by Educational Attainment in Brigantine
According to labor force statistics for Brigantine, 81.7% of individuals (3,345) out of the total population between 25 and 64 years of age (4,094) are in the labor force, with 4.5% or 151 of them being unemployed. The group with the highest labor force participation rate are those with the educational attainment of bachelor's degree or higher, with 86.3% or 1,678 individuals in the labor force. Within the labor force, individuals with high school diploma education have the highest percentage of unemployment, with 6.5% or 39 of them being unemployed.
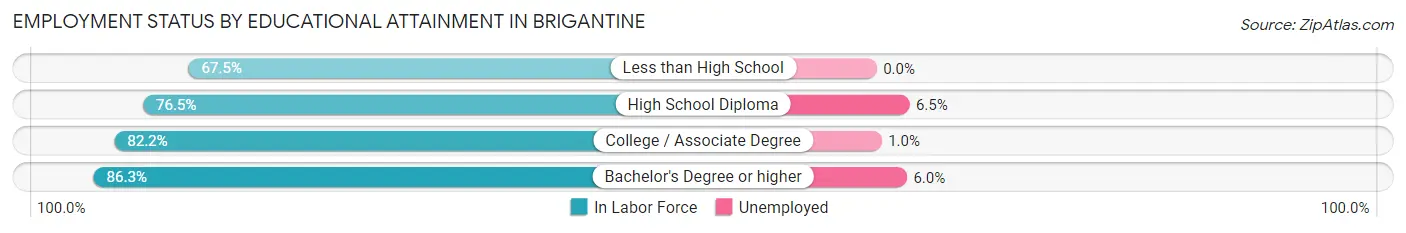
| Educational Attainment | In Labor Force | Unemployed |
| Less than High School | 245 (67.5%) | 0 (0.0%) |
| High School Diploma | 600 (76.5%) | 51 (6.5%) |
| College / Associate Degree | 824 (82.2%) | 10 (1.0%) |
| Bachelor's Degree or higher | 1,678 (86.3%) | 117 (6.0%) |
| Total | 3,345 (81.7%) | 184 (4.5%) |
Employment Occupations by Sex in Brigantine
Management, Business, Science and Arts Occupations
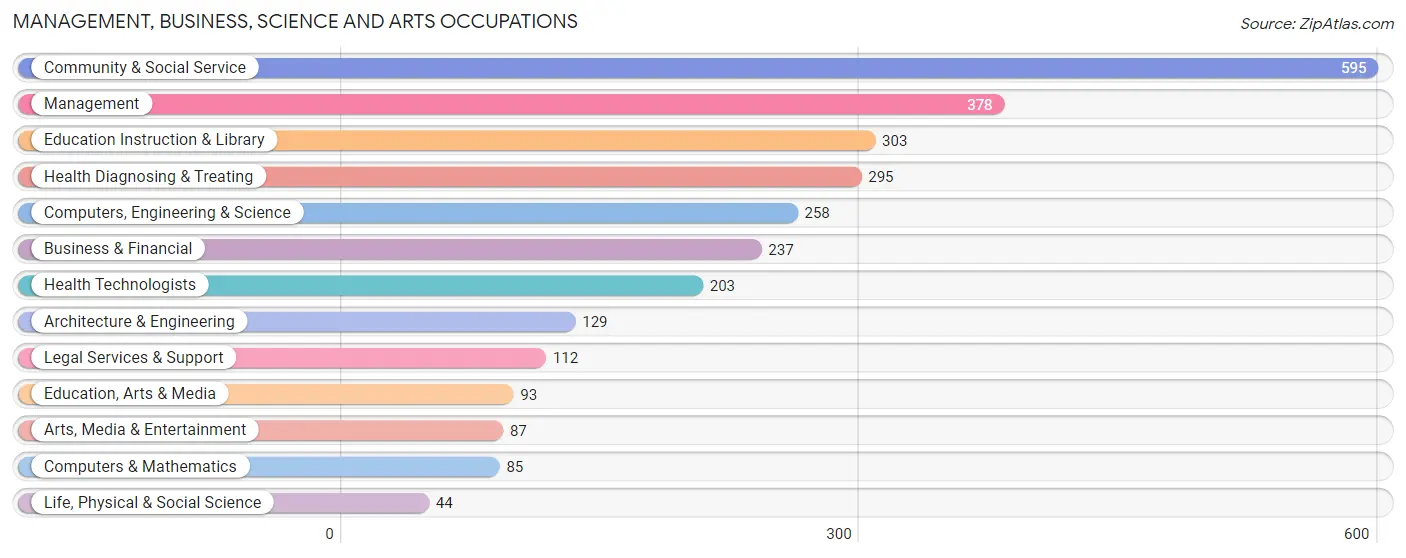
The most common Management, Business, Science and Arts occupations in Brigantine are Community & Social Service (595 | 14.9%), Management (378 | 9.5%), Education Instruction & Library (303 | 7.6%), Health Diagnosing & Treating (295 | 7.4%), and Computers, Engineering & Science (258 | 6.5%).
Management, Business, Science and Arts Occupations by Sex
Within the Management, Business, Science and Arts occupations in Brigantine, the most male-oriented occupations are Architecture & Engineering (96.1%), Computers, Engineering & Science (77.5%), and Business & Financial (71.3%), while the most female-oriented occupations are Education Instruction & Library (80.2%), Education, Arts & Media (75.3%), and Health Technologists (71.9%).
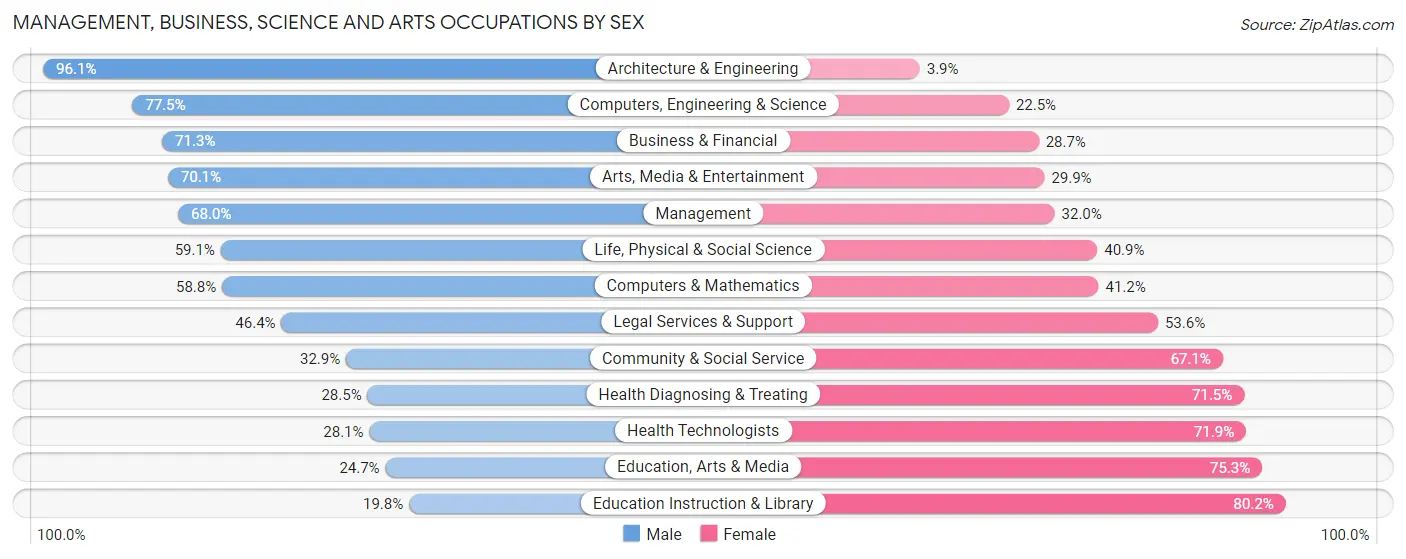
| Occupation | Male | Female |
| Management | 257 (68.0%) | 121 (32.0%) |
| Business & Financial | 169 (71.3%) | 68 (28.7%) |
| Computers, Engineering & Science | 200 (77.5%) | 58 (22.5%) |
| Computers & Mathematics | 50 (58.8%) | 35 (41.2%) |
| Architecture & Engineering | 124 (96.1%) | 5 (3.9%) |
| Life, Physical & Social Science | 26 (59.1%) | 18 (40.9%) |
| Community & Social Service | 196 (32.9%) | 399 (67.1%) |
| Education, Arts & Media | 23 (24.7%) | 70 (75.3%) |
| Legal Services & Support | 52 (46.4%) | 60 (53.6%) |
| Education Instruction & Library | 60 (19.8%) | 243 (80.2%) |
| Arts, Media & Entertainment | 61 (70.1%) | 26 (29.9%) |
| Health Diagnosing & Treating | 84 (28.5%) | 211 (71.5%) |
| Health Technologists | 57 (28.1%) | 146 (71.9%) |
| Total (Category) | 906 (51.4%) | 857 (48.6%) |
| Total (Overall) | 1,993 (50.1%) | 1,986 (49.9%) |
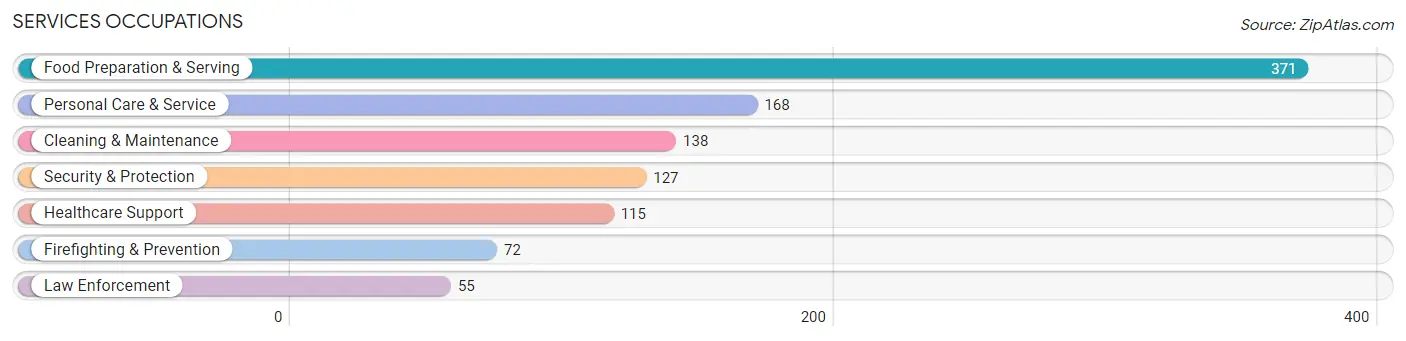
Services Occupations
The most common Services occupations in Brigantine are Food Preparation & Serving (371 | 9.3%), Personal Care & Service (168 | 4.2%), Cleaning & Maintenance (138 | 3.5%), Security & Protection (127 | 3.2%), and Healthcare Support (115 | 2.9%).
Services Occupations by Sex
Within the Services occupations in Brigantine, the most male-oriented occupations are Law Enforcement (100.0%), Security & Protection (96.9%), and Firefighting & Prevention (94.4%), while the most female-oriented occupations are Healthcare Support (100.0%), Food Preparation & Serving (64.1%), and Personal Care & Service (53.0%).
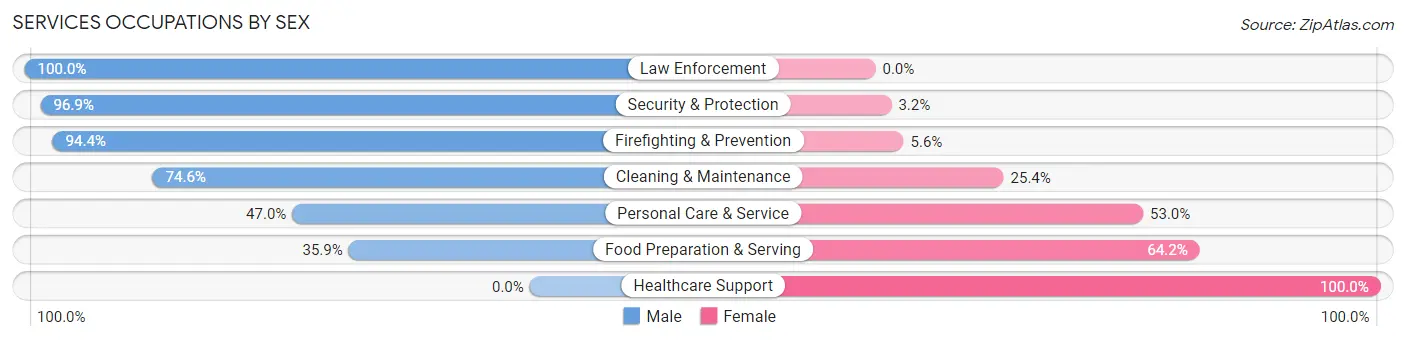
| Occupation | Male | Female |
| Healthcare Support | 0 (0.0%) | 115 (100.0%) |
| Security & Protection | 123 (96.9%) | 4 (3.2%) |
| Firefighting & Prevention | 68 (94.4%) | 4 (5.6%) |
| Law Enforcement | 55 (100.0%) | 0 (0.0%) |
| Food Preparation & Serving | 133 (35.8%) | 238 (64.1%) |
| Cleaning & Maintenance | 103 (74.6%) | 35 (25.4%) |
| Personal Care & Service | 79 (47.0%) | 89 (53.0%) |
| Total (Category) | 438 (47.7%) | 481 (52.3%) |
| Total (Overall) | 1,993 (50.1%) | 1,986 (49.9%) |
Sales and Office Occupations
The most common Sales and Office occupations in Brigantine are Office & Administration (457 | 11.5%), and Sales & Related (322 | 8.1%).

Sales and Office Occupations by Sex
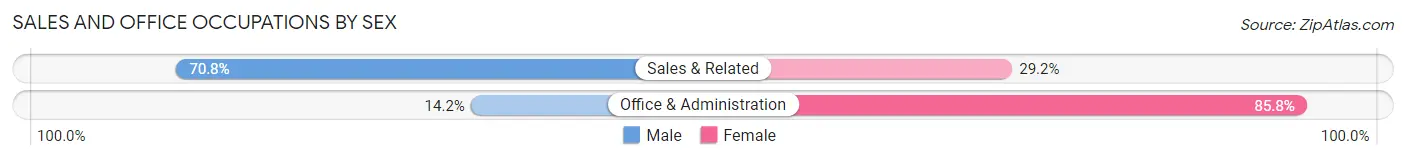
| Occupation | Male | Female |
| Sales & Related | 228 (70.8%) | 94 (29.2%) |
| Office & Administration | 65 (14.2%) | 392 (85.8%) |
| Total (Category) | 293 (37.6%) | 486 (62.4%) |
| Total (Overall) | 1,993 (50.1%) | 1,986 (49.9%) |
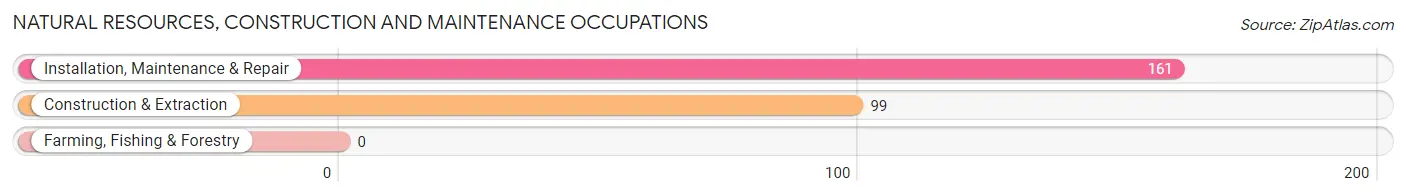
Natural Resources, Construction and Maintenance Occupations
The most common Natural Resources, Construction and Maintenance occupations in Brigantine are Installation, Maintenance & Repair (161 | 4.1%), and Construction & Extraction (99 | 2.5%).
Natural Resources, Construction and Maintenance Occupations by Sex
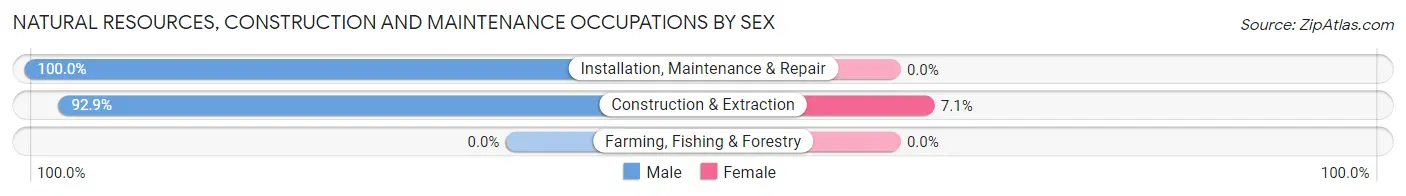
| Occupation | Male | Female |
| Farming, Fishing & Forestry | 0 (0.0%) | 0 (0.0%) |
| Construction & Extraction | 92 (92.9%) | 7 (7.1%) |
| Installation, Maintenance & Repair | 161 (100.0%) | 0 (0.0%) |
| Total (Category) | 253 (97.3%) | 7 (2.7%) |
| Total (Overall) | 1,993 (50.1%) | 1,986 (49.9%) |
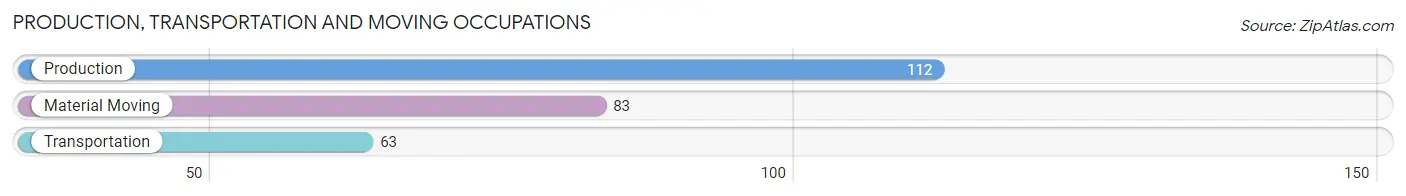
Production, Transportation and Moving Occupations
The most common Production, Transportation and Moving occupations in Brigantine are Production (112 | 2.8%), Material Moving (83 | 2.1%), and Transportation (63 | 1.6%).
Production, Transportation and Moving Occupations by Sex
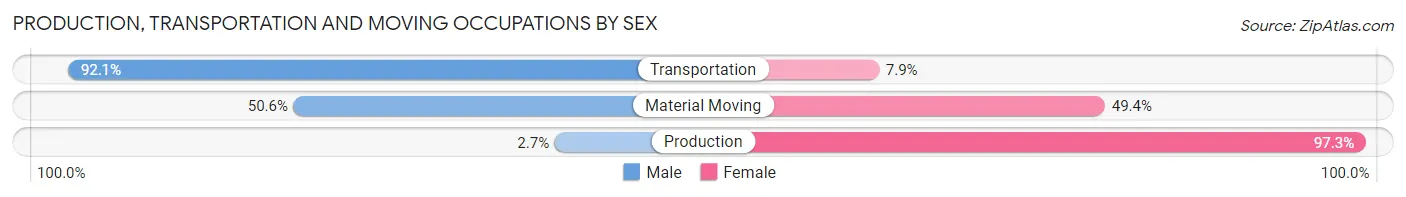
| Occupation | Male | Female |
| Production | 3 (2.7%) | 109 (97.3%) |
| Transportation | 58 (92.1%) | 5 (7.9%) |
| Material Moving | 42 (50.6%) | 41 (49.4%) |
| Total (Category) | 103 (39.9%) | 155 (60.1%) |
| Total (Overall) | 1,993 (50.1%) | 1,986 (49.9%) |
Employment Industries by Sex in Brigantine
Employment Industries in Brigantine
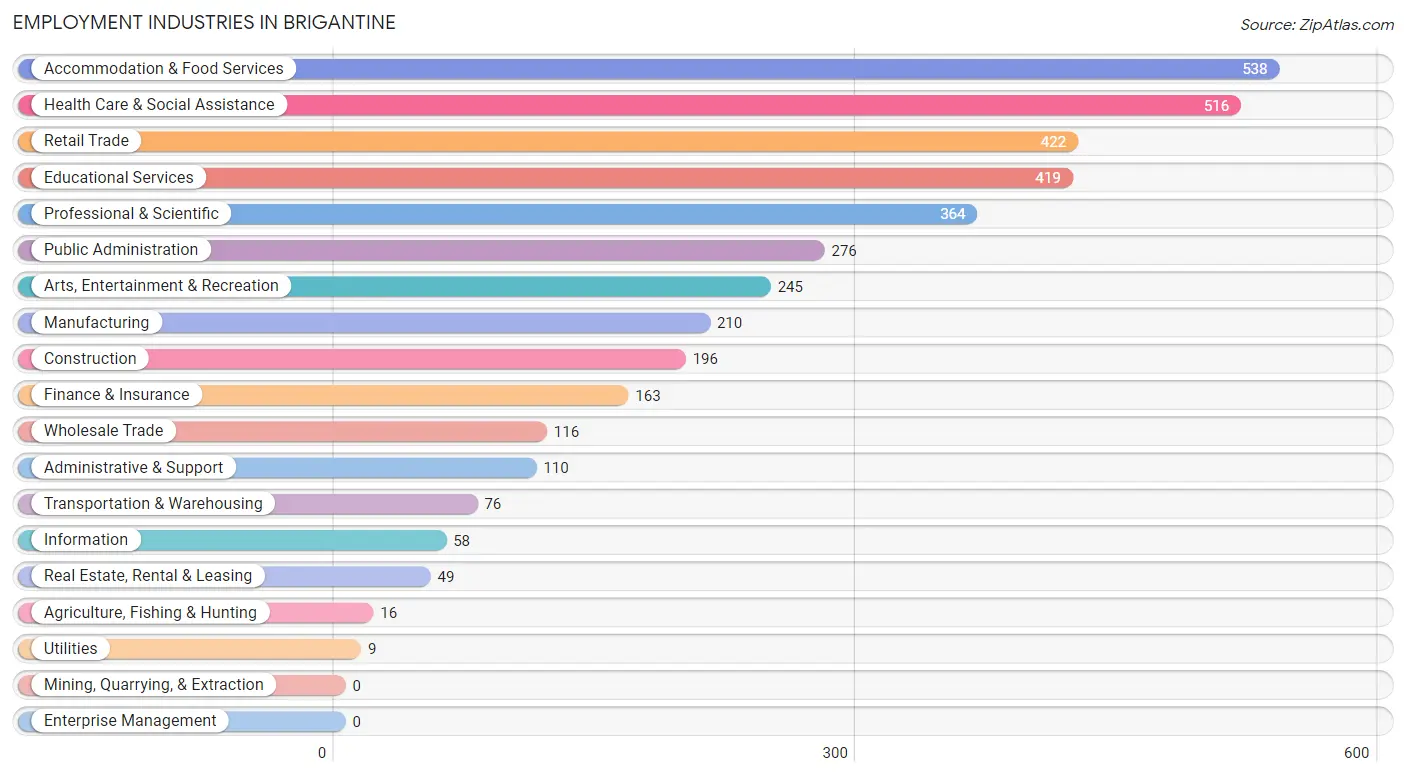
The major employment industries in Brigantine include Accommodation & Food Services (538 | 13.5%), Health Care & Social Assistance (516 | 13.0%), Retail Trade (422 | 10.6%), Educational Services (419 | 10.5%), and Professional & Scientific (364 | 9.1%).
Employment Industries by Sex in Brigantine
The Brigantine industries that see more men than women are Agriculture, Fishing & Hunting (100.0%), Wholesale Trade (95.7%), and Construction (94.4%), whereas the industries that tend to have a higher number of women are Health Care & Social Assistance (81.0%), Educational Services (80.2%), and Accommodation & Food Services (59.5%).
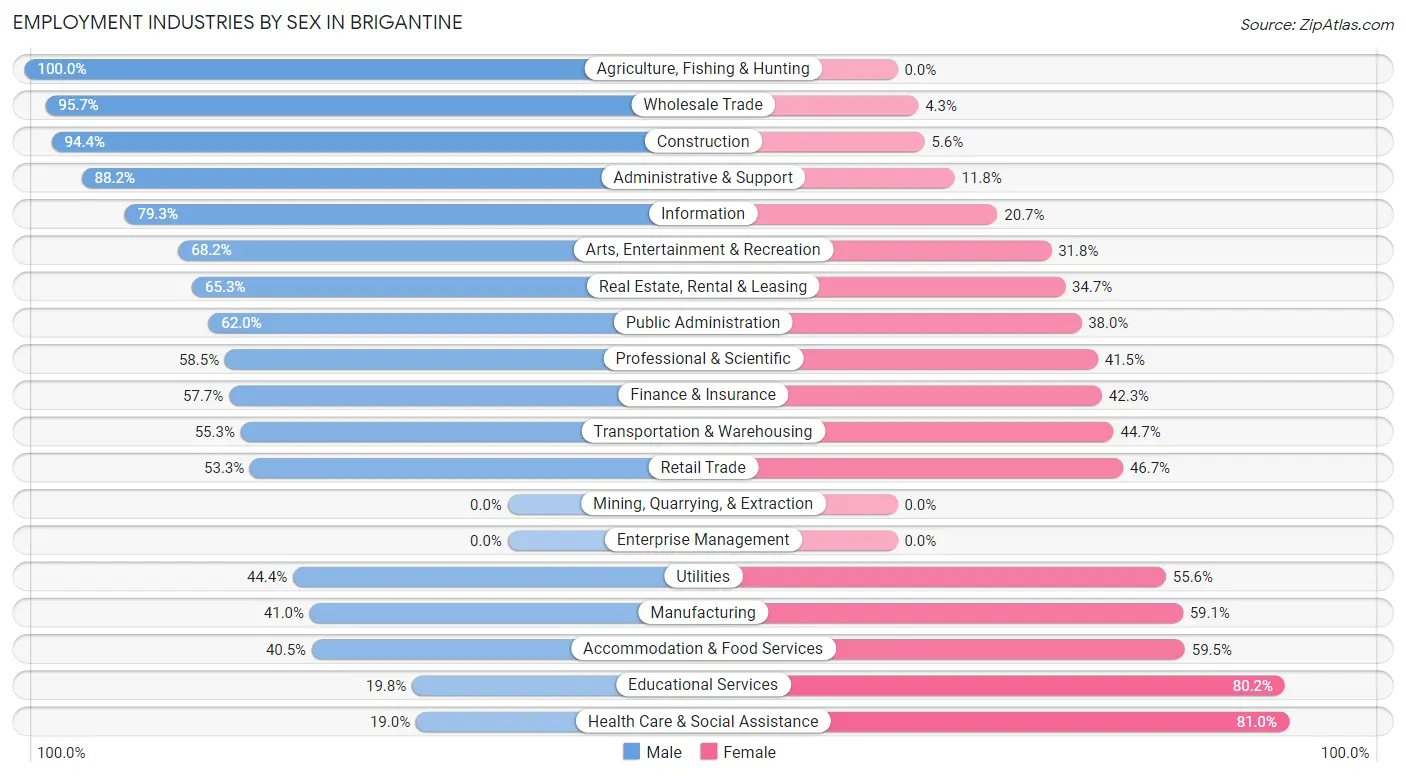
| Industry | Male | Female |
| Agriculture, Fishing & Hunting | 16 (100.0%) | 0 (0.0%) |
| Mining, Quarrying, & Extraction | 0 (0.0%) | 0 (0.0%) |
| Construction | 185 (94.4%) | 11 (5.6%) |
| Manufacturing | 86 (40.9%) | 124 (59.1%) |
| Wholesale Trade | 111 (95.7%) | 5 (4.3%) |
| Retail Trade | 225 (53.3%) | 197 (46.7%) |
| Transportation & Warehousing | 42 (55.3%) | 34 (44.7%) |
| Utilities | 4 (44.4%) | 5 (55.6%) |
| Information | 46 (79.3%) | 12 (20.7%) |
| Finance & Insurance | 94 (57.7%) | 69 (42.3%) |
| Real Estate, Rental & Leasing | 32 (65.3%) | 17 (34.7%) |
| Professional & Scientific | 213 (58.5%) | 151 (41.5%) |
| Enterprise Management | 0 (0.0%) | 0 (0.0%) |
| Administrative & Support | 97 (88.2%) | 13 (11.8%) |
| Educational Services | 83 (19.8%) | 336 (80.2%) |
| Health Care & Social Assistance | 98 (19.0%) | 418 (81.0%) |
| Arts, Entertainment & Recreation | 167 (68.2%) | 78 (31.8%) |
| Accommodation & Food Services | 218 (40.5%) | 320 (59.5%) |
| Public Administration | 171 (62.0%) | 105 (38.0%) |
| Total | 1,993 (50.1%) | 1,986 (49.9%) |
Education in Brigantine
School Enrollment in Brigantine
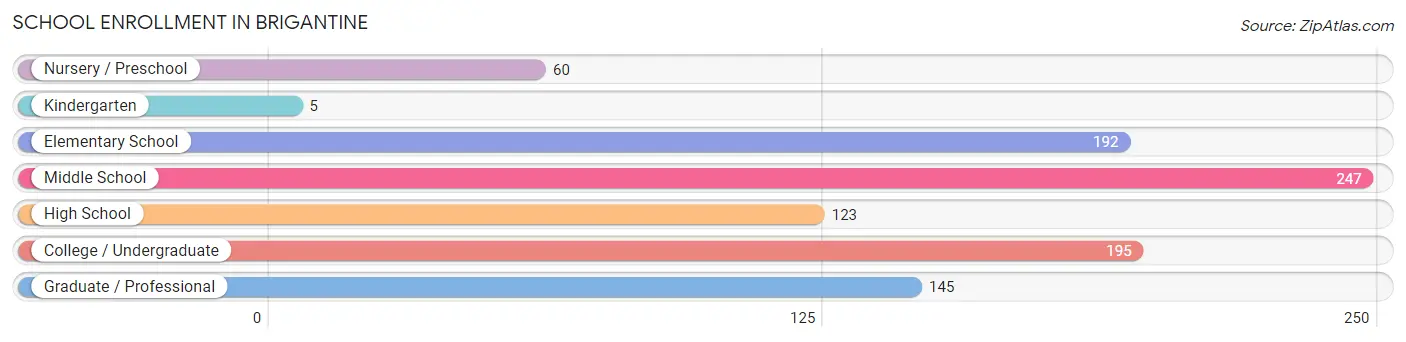
The most common levels of schooling among the 967 students in Brigantine are middle school (247 | 25.5%), college / undergraduate (195 | 20.2%), and elementary school (192 | 19.9%).
| School Level | # Students | % Students |
| Nursery / Preschool | 60 | 6.2% |
| Kindergarten | 5 | 0.5% |
| Elementary School | 192 | 19.9% |
| Middle School | 247 | 25.5% |
| High School | 123 | 12.7% |
| College / Undergraduate | 195 | 20.2% |
| Graduate / Professional | 145 | 15.0% |
| Total | 967 | 100.0% |
School Enrollment by Age by Funding Source in Brigantine
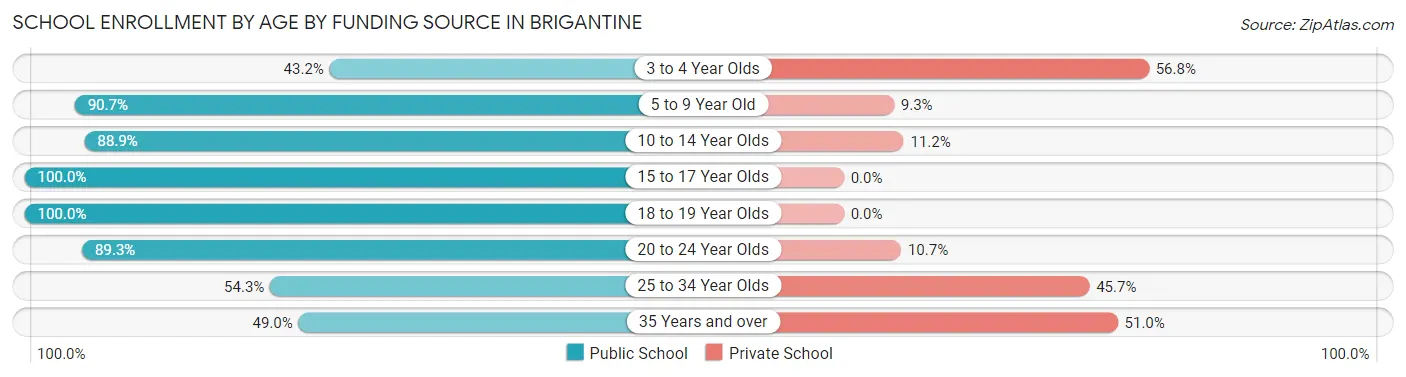
Out of a total of 967 students who are enrolled in schools in Brigantine, 168 (17.4%) attend a private institution, while the remaining 799 (82.6%) are enrolled in public schools. The age group of 3 to 4 year olds has the highest likelihood of being enrolled in private schools, with 25 (56.8% in the age bracket) enrolled. Conversely, the age group of 15 to 17 year olds has the lowest likelihood of being enrolled in a private school, with 90 (100.0% in the age bracket) attending a public institution.
| Age Bracket | Public School | Private School |
| 3 to 4 Year Olds | 19 (43.2%) | 25 (56.8%) |
| 5 to 9 Year Old | 165 (90.7%) | 17 (9.3%) |
| 10 to 14 Year Olds | 247 (88.8%) | 31 (11.2%) |
| 15 to 17 Year Olds | 90 (100.0%) | 0 (0.0%) |
| 18 to 19 Year Olds | 92 (100.0%) | 0 (0.0%) |
| 20 to 24 Year Olds | 92 (89.3%) | 11 (10.7%) |
| 25 to 34 Year Olds | 70 (54.3%) | 59 (45.7%) |
| 35 Years and over | 24 (49.0%) | 25 (51.0%) |
| Total | 799 (82.6%) | 168 (17.4%) |
Educational Attainment by Field of Study in Brigantine
Business (597 | 19.8%), science & technology (435 | 14.4%), education (397 | 13.2%), psychology (238 | 7.9%), and engineering (191 | 6.3%) are the most common fields of study among 3,019 individuals in Brigantine who have obtained a bachelor's degree or higher.
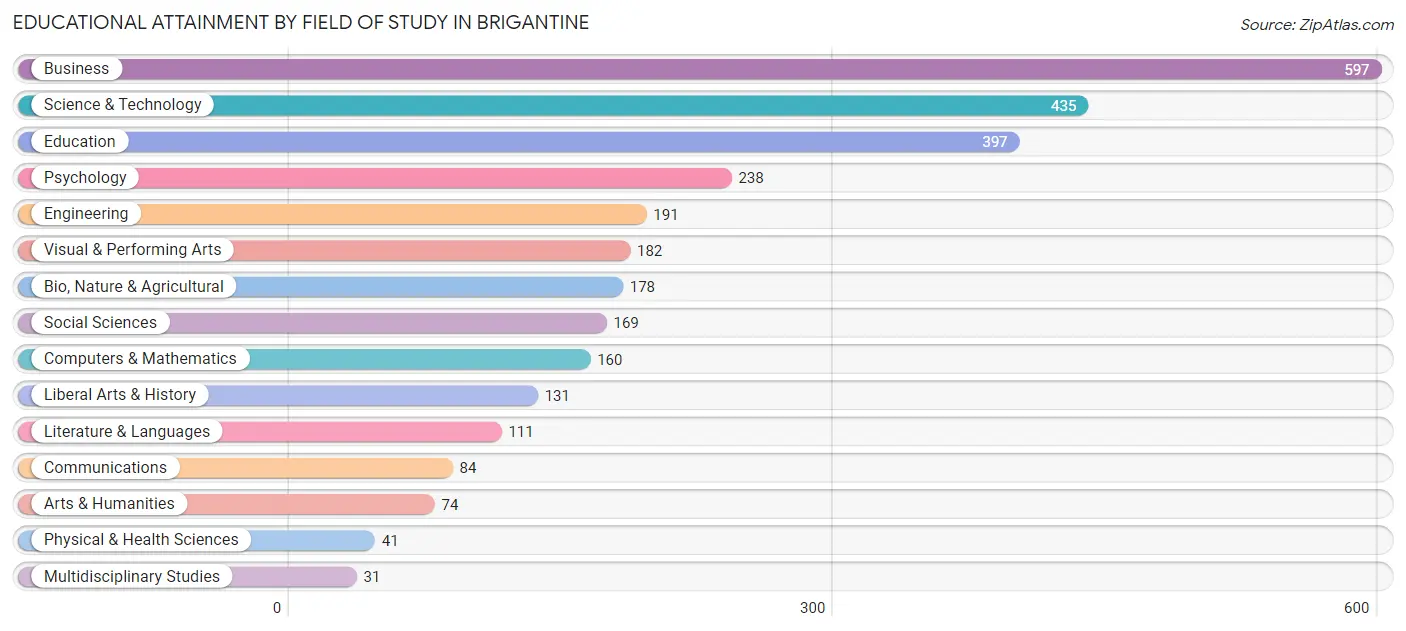
| Field of Study | # Graduates | % Graduates |
| Computers & Mathematics | 160 | 5.3% |
| Bio, Nature & Agricultural | 178 | 5.9% |
| Physical & Health Sciences | 41 | 1.4% |
| Psychology | 238 | 7.9% |
| Social Sciences | 169 | 5.6% |
| Engineering | 191 | 6.3% |
| Multidisciplinary Studies | 31 | 1.0% |
| Science & Technology | 435 | 14.4% |
| Business | 597 | 19.8% |
| Education | 397 | 13.2% |
| Literature & Languages | 111 | 3.7% |
| Liberal Arts & History | 131 | 4.3% |
| Visual & Performing Arts | 182 | 6.0% |
| Communications | 84 | 2.8% |
| Arts & Humanities | 74 | 2.5% |
| Total | 3,019 | 100.0% |
Transportation & Commute in Brigantine
Vehicle Availability by Sex in Brigantine
The most prevalent vehicle ownership categories in Brigantine are males with 2 vehicles (1,033, accounting for 51.4%) and females with 2 vehicles (912, making up 54.7%).
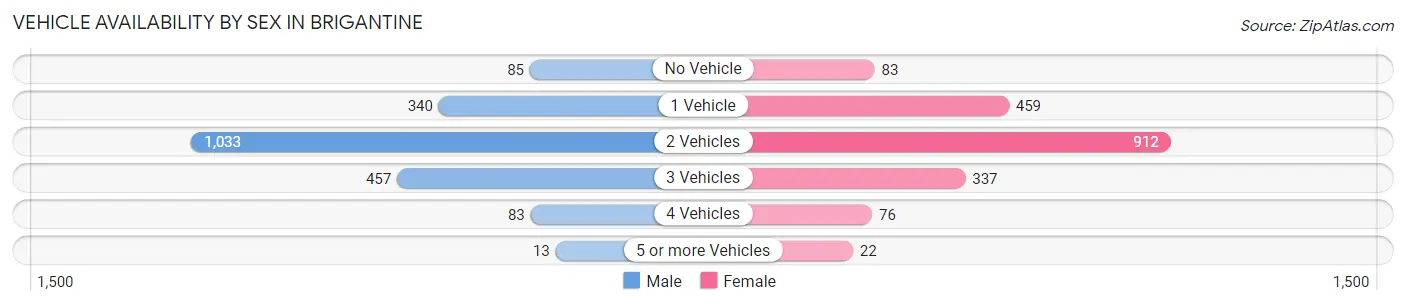
| Vehicles Available | Male | Female |
| No Vehicle | 85 (4.2%) | 83 (4.4%) |
| 1 Vehicle | 340 (16.9%) | 459 (24.3%) |
| 2 Vehicles | 1,033 (51.4%) | 912 (48.3%) |
| 3 Vehicles | 457 (22.7%) | 337 (17.8%) |
| 4 Vehicles | 83 (4.1%) | 76 (4.0%) |
| 5 or more Vehicles | 13 (0.6%) | 22 (1.2%) |
| Total | 2,011 (100.0%) | 1,889 (100.0%) |
Commute Time in Brigantine
The most frequently occuring commute durations in Brigantine are 10 to 14 minutes (580 commuters, 17.6%), 15 to 19 minutes (486 commuters, 14.7%), and 20 to 24 minutes (391 commuters, 11.8%).
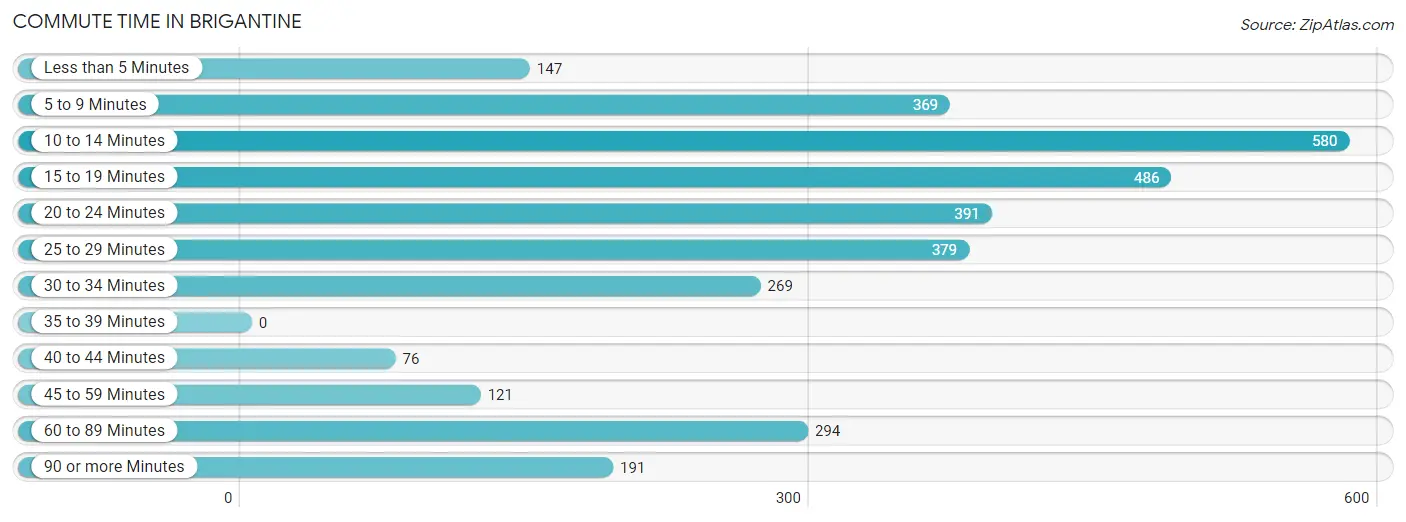
| Commute Time | # Commuters | % Commuters |
| Less than 5 Minutes | 147 | 4.4% |
| 5 to 9 Minutes | 369 | 11.2% |
| 10 to 14 Minutes | 580 | 17.6% |
| 15 to 19 Minutes | 486 | 14.7% |
| 20 to 24 Minutes | 391 | 11.8% |
| 25 to 29 Minutes | 379 | 11.5% |
| 30 to 34 Minutes | 269 | 8.1% |
| 35 to 39 Minutes | 0 | 0.0% |
| 40 to 44 Minutes | 76 | 2.3% |
| 45 to 59 Minutes | 121 | 3.7% |
| 60 to 89 Minutes | 294 | 8.9% |
| 90 or more Minutes | 191 | 5.8% |
Commute Time by Sex in Brigantine
The most common commute times in Brigantine are 10 to 14 minutes (319 commuters, 18.8%) for males and 15 to 19 minutes (324 commuters, 20.2%) for females.
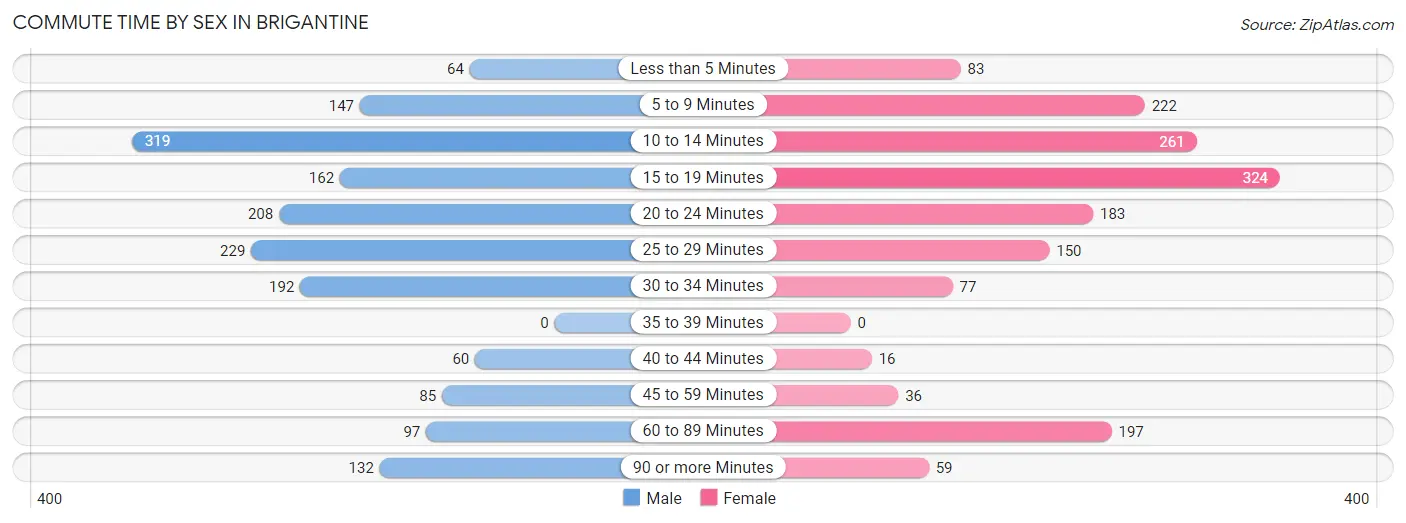
| Commute Time | Male | Female |
| Less than 5 Minutes | 64 (3.8%) | 83 (5.2%) |
| 5 to 9 Minutes | 147 (8.7%) | 222 (13.8%) |
| 10 to 14 Minutes | 319 (18.8%) | 261 (16.2%) |
| 15 to 19 Minutes | 162 (9.6%) | 324 (20.2%) |
| 20 to 24 Minutes | 208 (12.3%) | 183 (11.4%) |
| 25 to 29 Minutes | 229 (13.5%) | 150 (9.3%) |
| 30 to 34 Minutes | 192 (11.3%) | 77 (4.8%) |
| 35 to 39 Minutes | 0 (0.0%) | 0 (0.0%) |
| 40 to 44 Minutes | 60 (3.5%) | 16 (1.0%) |
| 45 to 59 Minutes | 85 (5.0%) | 36 (2.2%) |
| 60 to 89 Minutes | 97 (5.7%) | 197 (12.2%) |
| 90 or more Minutes | 132 (7.8%) | 59 (3.7%) |
Time of Departure to Work by Sex in Brigantine
The most frequent times of departure to work in Brigantine are 7:30 AM to 7:59 AM (248, 14.6%) for males and 8:00 AM to 8:29 AM (358, 22.3%) for females.
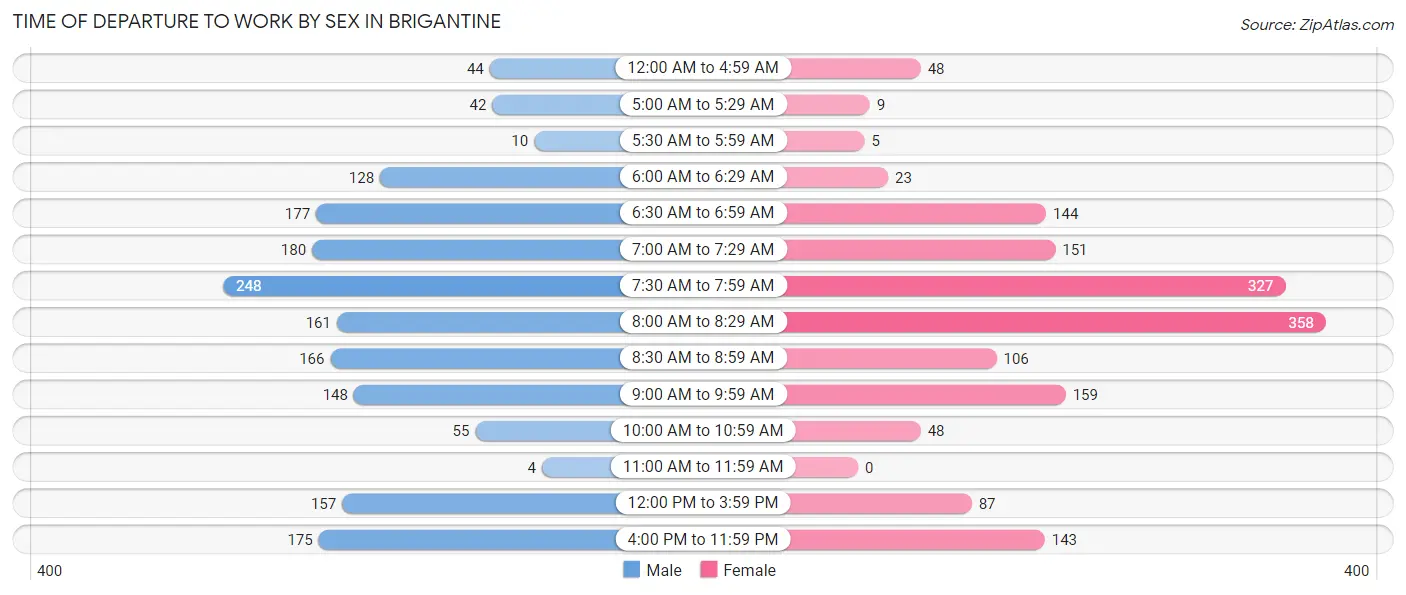
| Time of Departure | Male | Female |
| 12:00 AM to 4:59 AM | 44 (2.6%) | 48 (3.0%) |
| 5:00 AM to 5:29 AM | 42 (2.5%) | 9 (0.6%) |
| 5:30 AM to 5:59 AM | 10 (0.6%) | 5 (0.3%) |
| 6:00 AM to 6:29 AM | 128 (7.5%) | 23 (1.4%) |
| 6:30 AM to 6:59 AM | 177 (10.4%) | 144 (9.0%) |
| 7:00 AM to 7:29 AM | 180 (10.6%) | 151 (9.4%) |
| 7:30 AM to 7:59 AM | 248 (14.6%) | 327 (20.3%) |
| 8:00 AM to 8:29 AM | 161 (9.5%) | 358 (22.3%) |
| 8:30 AM to 8:59 AM | 166 (9.8%) | 106 (6.6%) |
| 9:00 AM to 9:59 AM | 148 (8.7%) | 159 (9.9%) |
| 10:00 AM to 10:59 AM | 55 (3.2%) | 48 (3.0%) |
| 11:00 AM to 11:59 AM | 4 (0.2%) | 0 (0.0%) |
| 12:00 PM to 3:59 PM | 157 (9.3%) | 87 (5.4%) |
| 4:00 PM to 11:59 PM | 175 (10.3%) | 143 (8.9%) |
| Total | 1,695 (100.0%) | 1,608 (100.0%) |
Housing Occupancy in Brigantine
Occupancy by Ownership in Brigantine
Of the total 3,748 dwellings in Brigantine, owner-occupied units account for 2,696 (71.9%), while renter-occupied units make up 1,052 (28.1%).
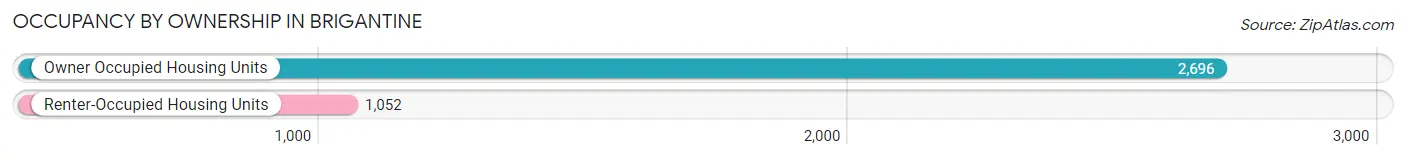
| Occupancy | # Housing Units | % Housing Units |
| Owner Occupied Housing Units | 2,696 | 71.9% |
| Renter-Occupied Housing Units | 1,052 | 28.1% |
| Total Occupied Housing Units | 3,748 | 100.0% |
Occupancy by Household Size in Brigantine
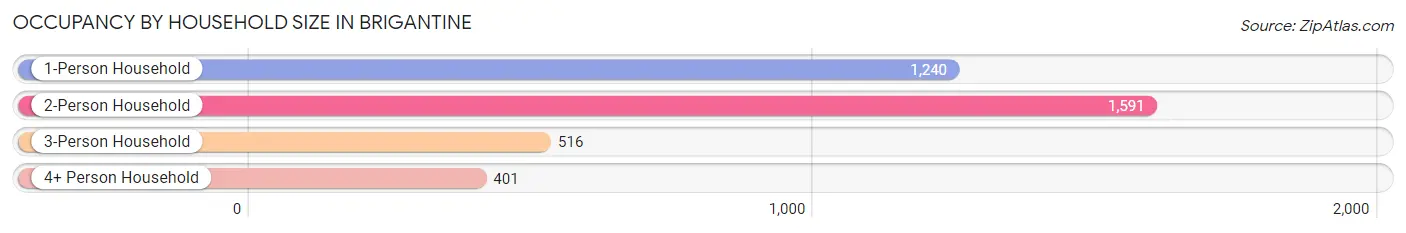
| Household Size | # Housing Units | % Housing Units |
| 1-Person Household | 1,240 | 33.1% |
| 2-Person Household | 1,591 | 42.4% |
| 3-Person Household | 516 | 13.8% |
| 4+ Person Household | 401 | 10.7% |
| Total Housing Units | 3,748 | 100.0% |
Occupancy by Ownership by Household Size in Brigantine
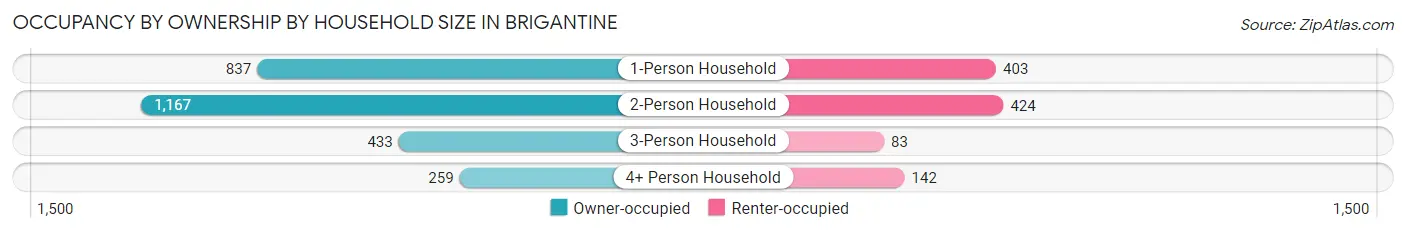
| Household Size | Owner-occupied | Renter-occupied |
| 1-Person Household | 837 (67.5%) | 403 (32.5%) |
| 2-Person Household | 1,167 (73.4%) | 424 (26.7%) |
| 3-Person Household | 433 (83.9%) | 83 (16.1%) |
| 4+ Person Household | 259 (64.6%) | 142 (35.4%) |
| Total Housing Units | 2,696 (71.9%) | 1,052 (28.1%) |
Occupancy by Educational Attainment in Brigantine
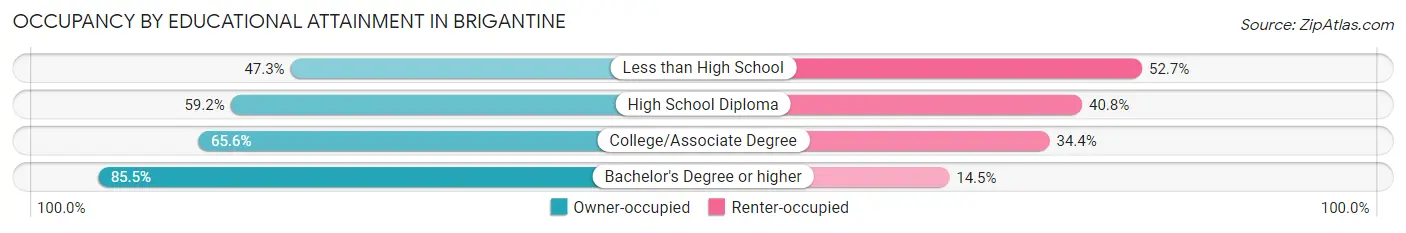
| Household Size | Owner-occupied | Renter-occupied |
| Less than High School | 122 (47.3%) | 136 (52.7%) |
| High School Diploma | 493 (59.2%) | 340 (40.8%) |
| College/Associate Degree | 630 (65.6%) | 330 (34.4%) |
| Bachelor's Degree or higher | 1,451 (85.5%) | 246 (14.5%) |
Occupancy by Age of Householder in Brigantine
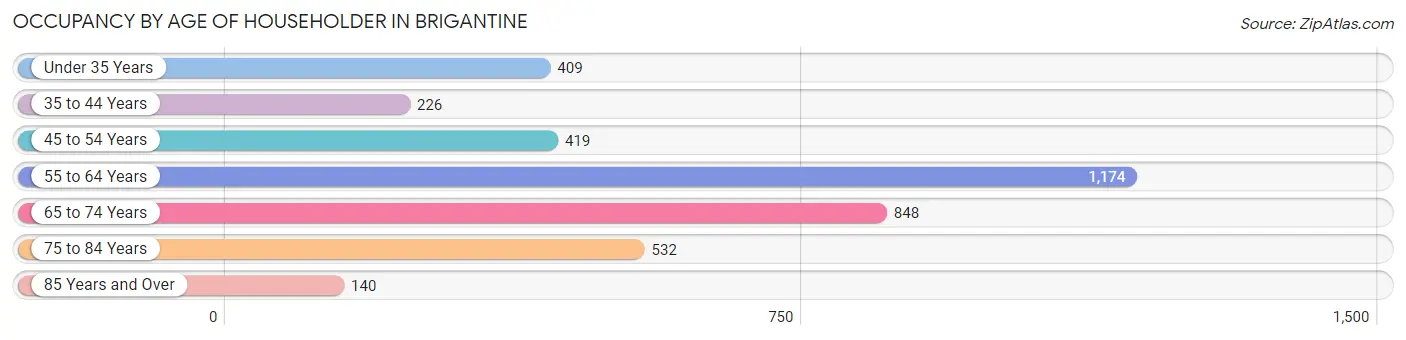
| Age Bracket | # Households | % Households |
| Under 35 Years | 409 | 10.9% |
| 35 to 44 Years | 226 | 6.0% |
| 45 to 54 Years | 419 | 11.2% |
| 55 to 64 Years | 1,174 | 31.3% |
| 65 to 74 Years | 848 | 22.6% |
| 75 to 84 Years | 532 | 14.2% |
| 85 Years and Over | 140 | 3.7% |
| Total | 3,748 | 100.0% |
Housing Finances in Brigantine
Median Income by Occupancy in Brigantine
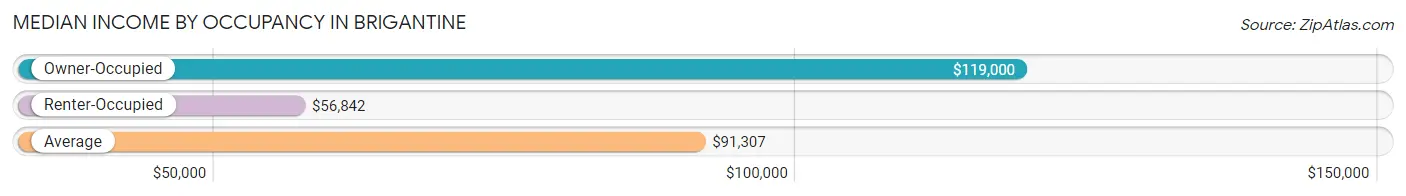
| Occupancy Type | # Households | Median Income |
| Owner-Occupied | 2,696 (71.9%) | $119,000 |
| Renter-Occupied | 1,052 (28.1%) | $56,842 |
| Average | 3,748 (100.0%) | $91,307 |
Occupancy by Householder Income Bracket in Brigantine
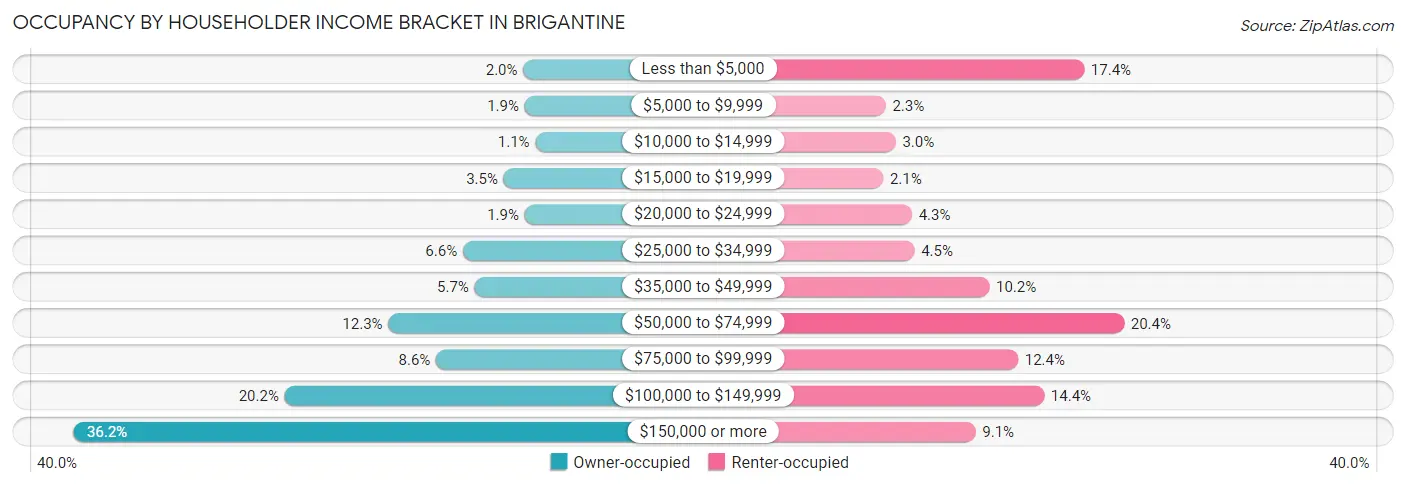
| Income Bracket | Owner-occupied | Renter-occupied |
| Less than $5,000 | 54 (2.0%) | 183 (17.4%) |
| $5,000 to $9,999 | 51 (1.9%) | 24 (2.3%) |
| $10,000 to $14,999 | 29 (1.1%) | 32 (3.0%) |
| $15,000 to $19,999 | 94 (3.5%) | 22 (2.1%) |
| $20,000 to $24,999 | 51 (1.9%) | 45 (4.3%) |
| $25,000 to $34,999 | 178 (6.6%) | 47 (4.5%) |
| $35,000 to $49,999 | 154 (5.7%) | 107 (10.2%) |
| $50,000 to $74,999 | 331 (12.3%) | 215 (20.4%) |
| $75,000 to $99,999 | 233 (8.6%) | 130 (12.4%) |
| $100,000 to $149,999 | 544 (20.2%) | 151 (14.3%) |
| $150,000 or more | 977 (36.2%) | 96 (9.1%) |
| Total | 2,696 (100.0%) | 1,052 (100.0%) |
Monthly Housing Cost Tiers in Brigantine
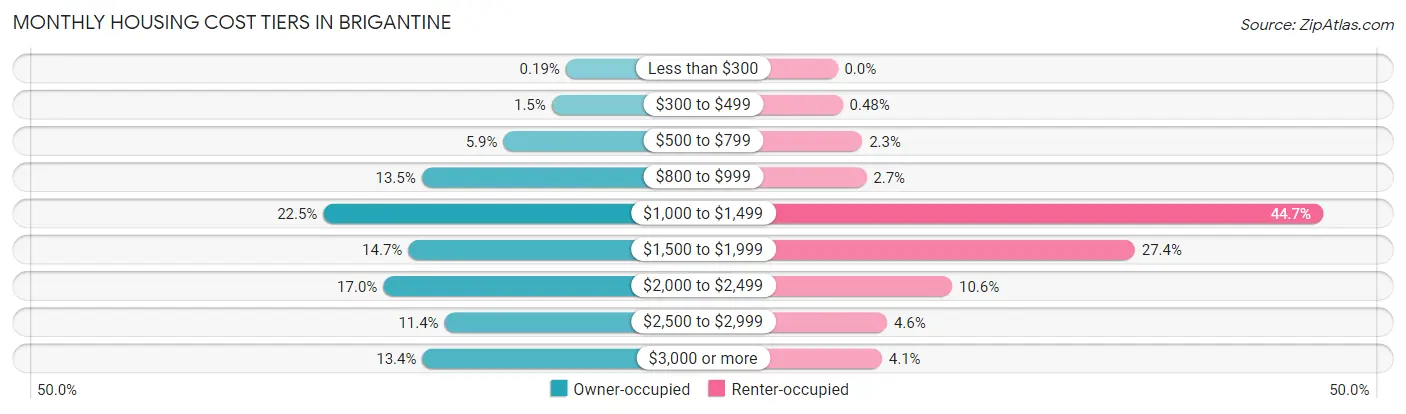
| Monthly Cost | Owner-occupied | Renter-occupied |
| Less than $300 | 5 (0.2%) | 0 (0.0%) |
| $300 to $499 | 40 (1.5%) | 5 (0.5%) |
| $500 to $799 | 160 (5.9%) | 24 (2.3%) |
| $800 to $999 | 363 (13.5%) | 28 (2.7%) |
| $1,000 to $1,499 | 607 (22.5%) | 470 (44.7%) |
| $1,500 to $1,999 | 396 (14.7%) | 288 (27.4%) |
| $2,000 to $2,499 | 458 (17.0%) | 111 (10.5%) |
| $2,500 to $2,999 | 306 (11.4%) | 48 (4.6%) |
| $3,000 or more | 361 (13.4%) | 43 (4.1%) |
| Total | 2,696 (100.0%) | 1,052 (100.0%) |
Physical Housing Characteristics in Brigantine
Housing Structures in Brigantine
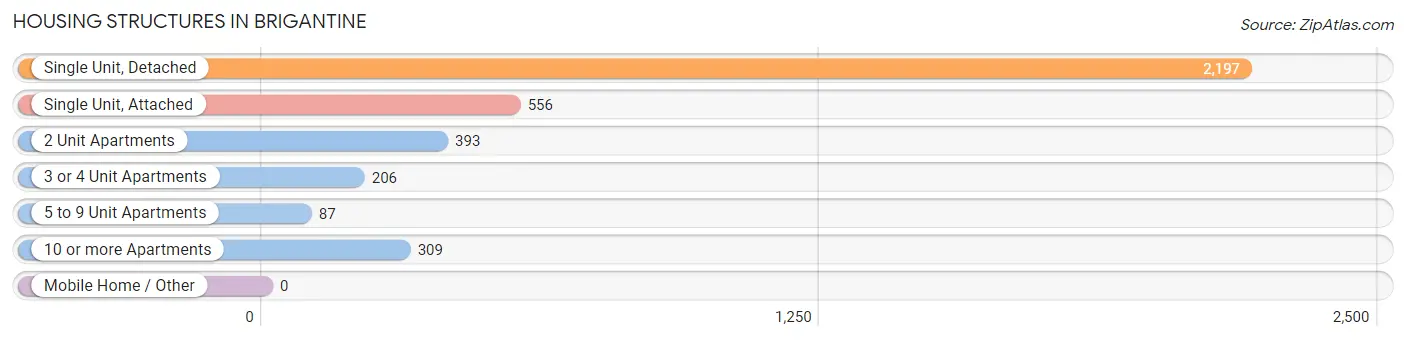
| Structure Type | # Housing Units | % Housing Units |
| Single Unit, Detached | 2,197 | 58.6% |
| Single Unit, Attached | 556 | 14.8% |
| 2 Unit Apartments | 393 | 10.5% |
| 3 or 4 Unit Apartments | 206 | 5.5% |
| 5 to 9 Unit Apartments | 87 | 2.3% |
| 10 or more Apartments | 309 | 8.2% |
| Mobile Home / Other | 0 | 0.0% |
| Total | 3,748 | 100.0% |
Housing Structures by Occupancy in Brigantine
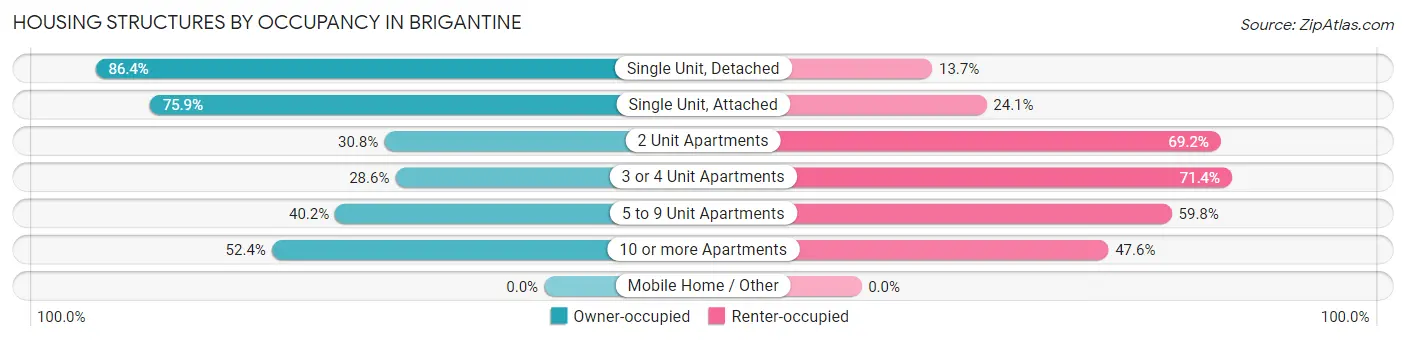
| Structure Type | Owner-occupied | Renter-occupied |
| Single Unit, Detached | 1,897 (86.4%) | 300 (13.7%) |
| Single Unit, Attached | 422 (75.9%) | 134 (24.1%) |
| 2 Unit Apartments | 121 (30.8%) | 272 (69.2%) |
| 3 or 4 Unit Apartments | 59 (28.6%) | 147 (71.4%) |
| 5 to 9 Unit Apartments | 35 (40.2%) | 52 (59.8%) |
| 10 or more Apartments | 162 (52.4%) | 147 (47.6%) |
| Mobile Home / Other | 0 (0.0%) | 0 (0.0%) |
| Total | 2,696 (71.9%) | 1,052 (28.1%) |
Housing Structures by Number of Rooms in Brigantine
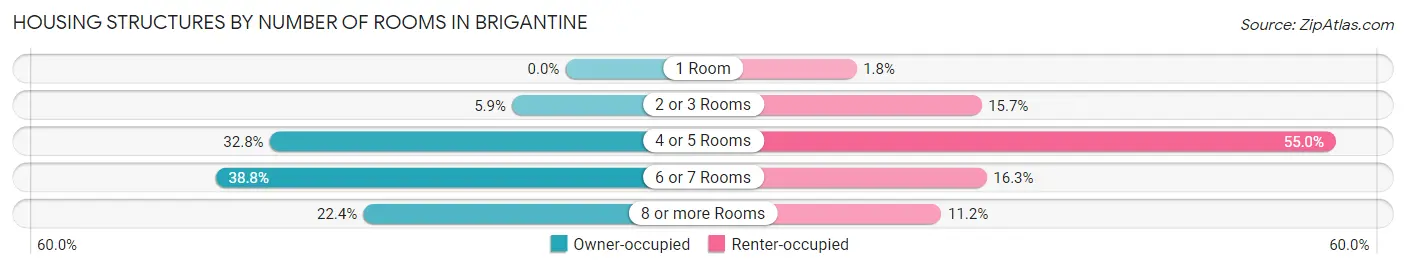
| Number of Rooms | Owner-occupied | Renter-occupied |
| 1 Room | 0 (0.0%) | 19 (1.8%) |
| 2 or 3 Rooms | 160 (5.9%) | 165 (15.7%) |
| 4 or 5 Rooms | 885 (32.8%) | 579 (55.0%) |
| 6 or 7 Rooms | 1,046 (38.8%) | 171 (16.3%) |
| 8 or more Rooms | 605 (22.4%) | 118 (11.2%) |
| Total | 2,696 (100.0%) | 1,052 (100.0%) |
Housing Structure by Heating Type in Brigantine
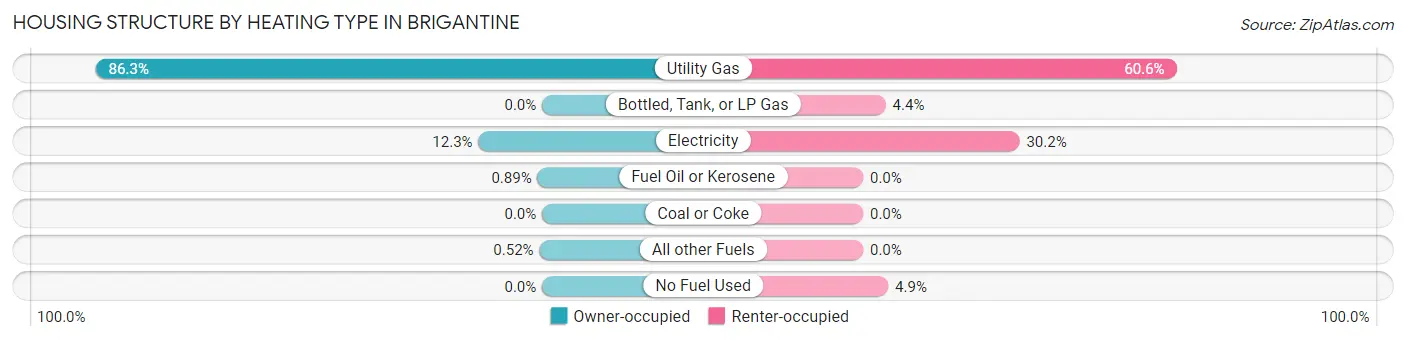
| Heating Type | Owner-occupied | Renter-occupied |
| Utility Gas | 2,326 (86.3%) | 637 (60.6%) |
| Bottled, Tank, or LP Gas | 0 (0.0%) | 46 (4.4%) |
| Electricity | 332 (12.3%) | 318 (30.2%) |
| Fuel Oil or Kerosene | 24 (0.9%) | 0 (0.0%) |
| Coal or Coke | 0 (0.0%) | 0 (0.0%) |
| All other Fuels | 14 (0.5%) | 0 (0.0%) |
| No Fuel Used | 0 (0.0%) | 51 (4.9%) |
| Total | 2,696 (100.0%) | 1,052 (100.0%) |
Household Vehicle Usage in Brigantine
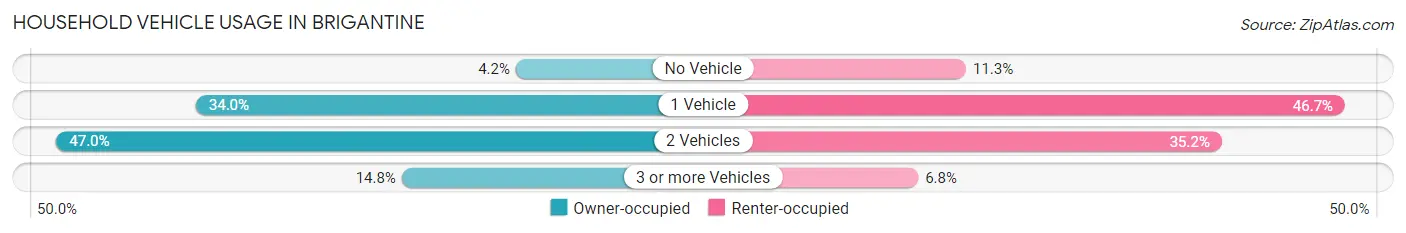
| Vehicles per Household | Owner-occupied | Renter-occupied |
| No Vehicle | 112 (4.2%) | 119 (11.3%) |
| 1 Vehicle | 917 (34.0%) | 491 (46.7%) |
| 2 Vehicles | 1,268 (47.0%) | 370 (35.2%) |
| 3 or more Vehicles | 399 (14.8%) | 72 (6.8%) |
| Total | 2,696 (100.0%) | 1,052 (100.0%) |
Real Estate & Mortgages in Brigantine
Real Estate and Mortgage Overview in Brigantine
| Characteristic | Without Mortgage | With Mortgage |
| Housing Units | 1,214 | 1,482 |
| Median Property Value | $432,500 | $412,100 |
| Median Household Income | $75,000 | $602 |
| Monthly Housing Costs | $1,030 | $355 |
| Real Estate Taxes | $6,598 | $4 |
Property Value by Mortgage Status in Brigantine
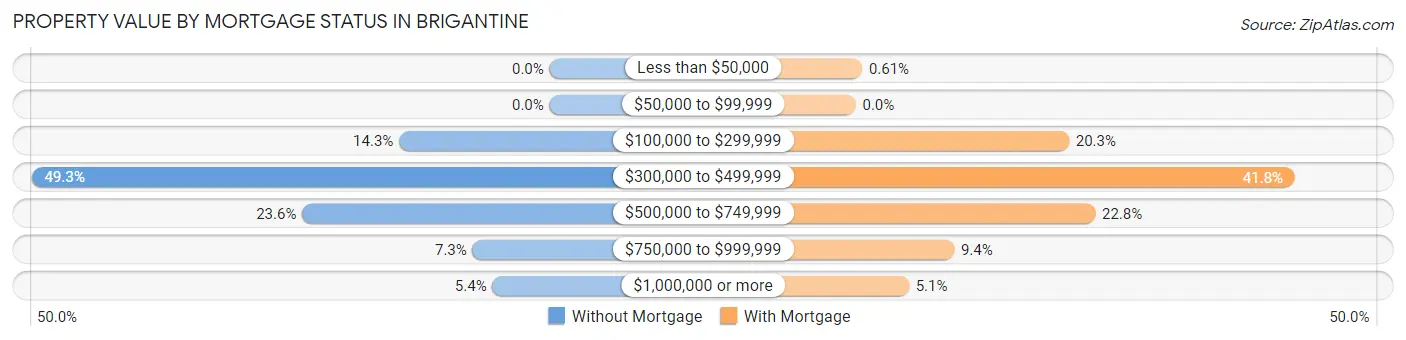
| Property Value | Without Mortgage | With Mortgage |
| Less than $50,000 | 0 (0.0%) | 9 (0.6%) |
| $50,000 to $99,999 | 0 (0.0%) | 0 (0.0%) |
| $100,000 to $299,999 | 174 (14.3%) | 301 (20.3%) |
| $300,000 to $499,999 | 599 (49.3%) | 620 (41.8%) |
| $500,000 to $749,999 | 286 (23.6%) | 338 (22.8%) |
| $750,000 to $999,999 | 89 (7.3%) | 139 (9.4%) |
| $1,000,000 or more | 66 (5.4%) | 75 (5.1%) |
| Total | 1,214 (100.0%) | 1,482 (100.0%) |
Household Income by Mortgage Status in Brigantine
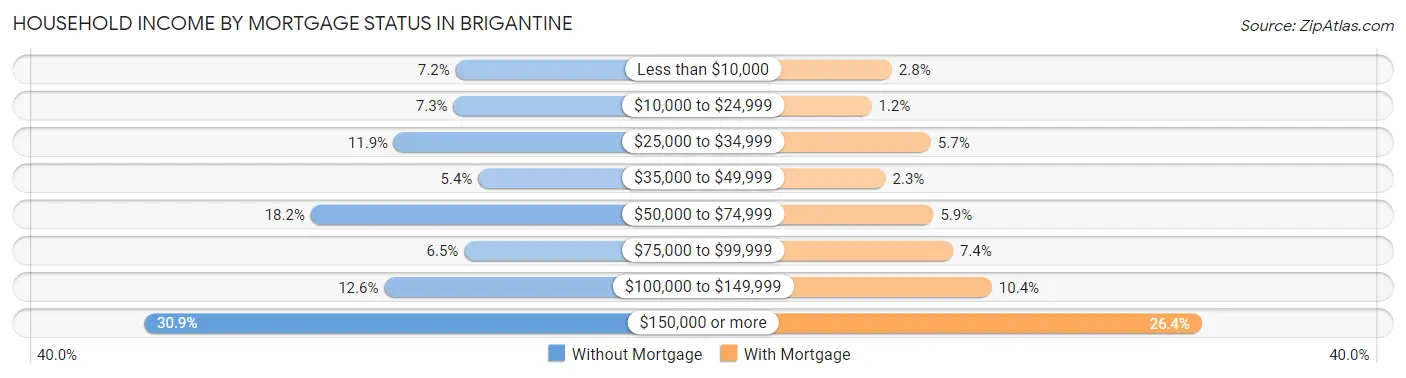
| Household Income | Without Mortgage | With Mortgage |
| Less than $10,000 | 87 (7.2%) | 41 (2.8%) |
| $10,000 to $24,999 | 89 (7.3%) | 18 (1.2%) |
| $25,000 to $34,999 | 144 (11.9%) | 85 (5.7%) |
| $35,000 to $49,999 | 66 (5.4%) | 34 (2.3%) |
| $50,000 to $74,999 | 221 (18.2%) | 88 (5.9%) |
| $75,000 to $99,999 | 79 (6.5%) | 110 (7.4%) |
| $100,000 to $149,999 | 153 (12.6%) | 154 (10.4%) |
| $150,000 or more | 375 (30.9%) | 391 (26.4%) |
| Total | 1,214 (100.0%) | 1,482 (100.0%) |
Property Value to Household Income Ratio in Brigantine
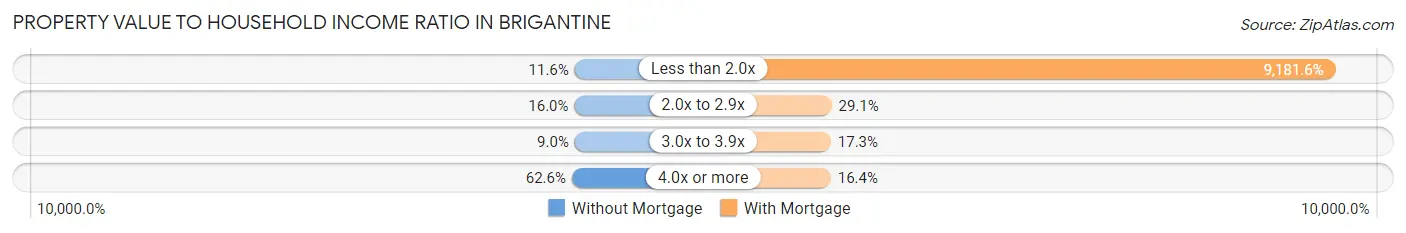
| Value-to-Income Ratio | Without Mortgage | With Mortgage |
| Less than 2.0x | 141 (11.6%) | 136,071 (9,181.6%) |
| 2.0x to 2.9x | 194 (16.0%) | 431 (29.1%) |
| 3.0x to 3.9x | 109 (9.0%) | 257 (17.3%) |
| 4.0x or more | 760 (62.6%) | 243 (16.4%) |
| Total | 1,214 (100.0%) | 1,482 (100.0%) |
Real Estate Taxes by Mortgage Status in Brigantine
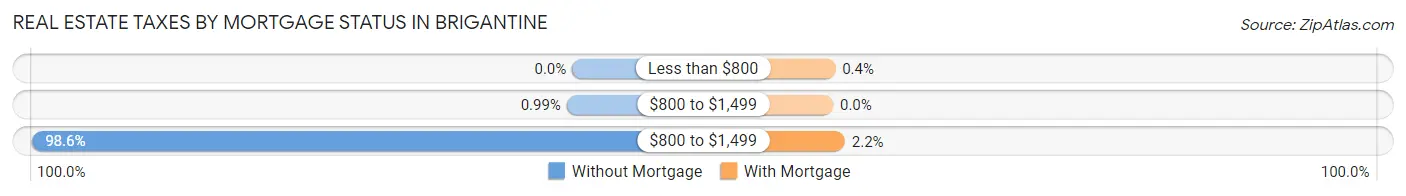
| Property Taxes | Without Mortgage | With Mortgage |
| Less than $800 | 0 (0.0%) | 6 (0.4%) |
| $800 to $1,499 | 12 (1.0%) | 0 (0.0%) |
| $800 to $1,499 | 1,197 (98.6%) | 32 (2.2%) |
| Total | 1,214 (100.0%) | 1,482 (100.0%) |
Health & Disability in Brigantine
Health Insurance Coverage by Age in Brigantine
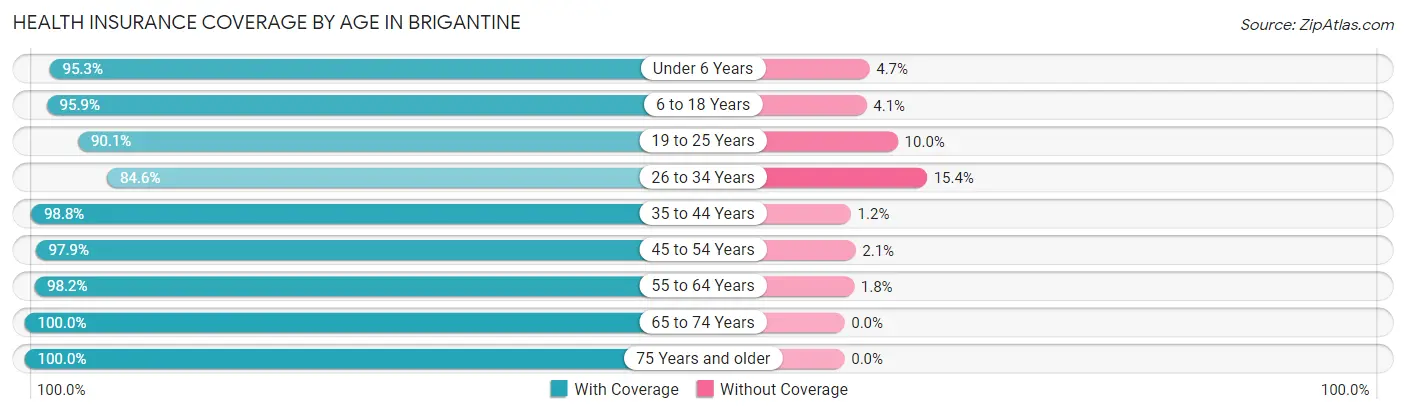
| Age Bracket | With Coverage | Without Coverage |
| Under 6 Years | 225 (95.3%) | 11 (4.7%) |
| 6 to 18 Years | 560 (95.9%) | 24 (4.1%) |
| 19 to 25 Years | 498 (90.0%) | 55 (10.0%) |
| 26 to 34 Years | 589 (84.6%) | 107 (15.4%) |
| 35 to 44 Years | 582 (98.8%) | 7 (1.2%) |
| 45 to 54 Years | 810 (97.9%) | 17 (2.1%) |
| 55 to 64 Years | 1,761 (98.2%) | 32 (1.8%) |
| 65 to 74 Years | 1,476 (100.0%) | 0 (0.0%) |
| 75 Years and older | 968 (100.0%) | 0 (0.0%) |
| Total | 7,469 (96.7%) | 253 (3.3%) |
Health Insurance Coverage by Citizenship Status in Brigantine
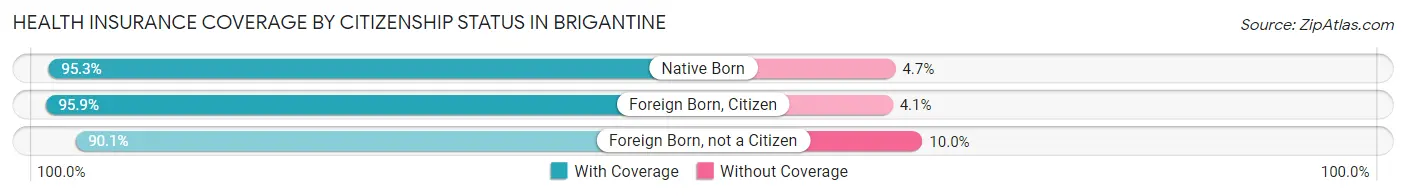
| Citizenship Status | With Coverage | Without Coverage |
| Native Born | 225 (95.3%) | 11 (4.7%) |
| Foreign Born, Citizen | 560 (95.9%) | 24 (4.1%) |
| Foreign Born, not a Citizen | 498 (90.0%) | 55 (10.0%) |
Health Insurance Coverage by Household Income in Brigantine
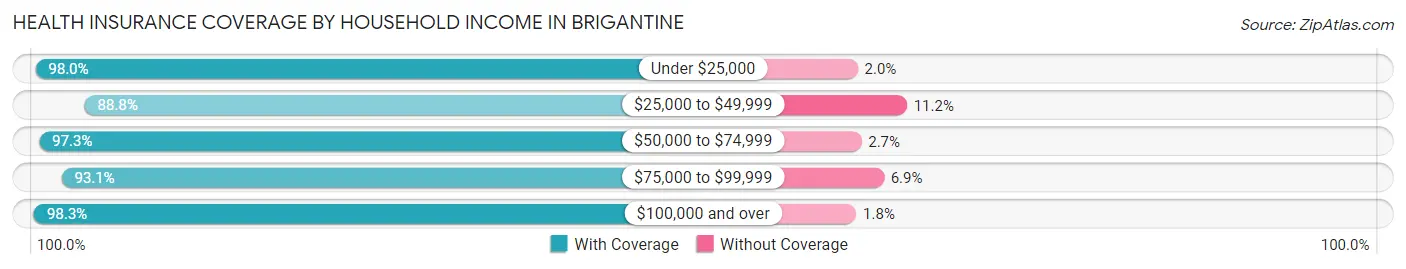
| Household Income | With Coverage | Without Coverage |
| Under $25,000 | 922 (98.0%) | 19 (2.0%) |
| $25,000 to $49,999 | 672 (88.8%) | 85 (11.2%) |
| $50,000 to $74,999 | 896 (97.3%) | 25 (2.7%) |
| $75,000 to $99,999 | 606 (93.1%) | 45 (6.9%) |
| $100,000 and over | 4,369 (98.3%) | 78 (1.8%) |
Public vs Private Health Insurance Coverage by Age in Brigantine
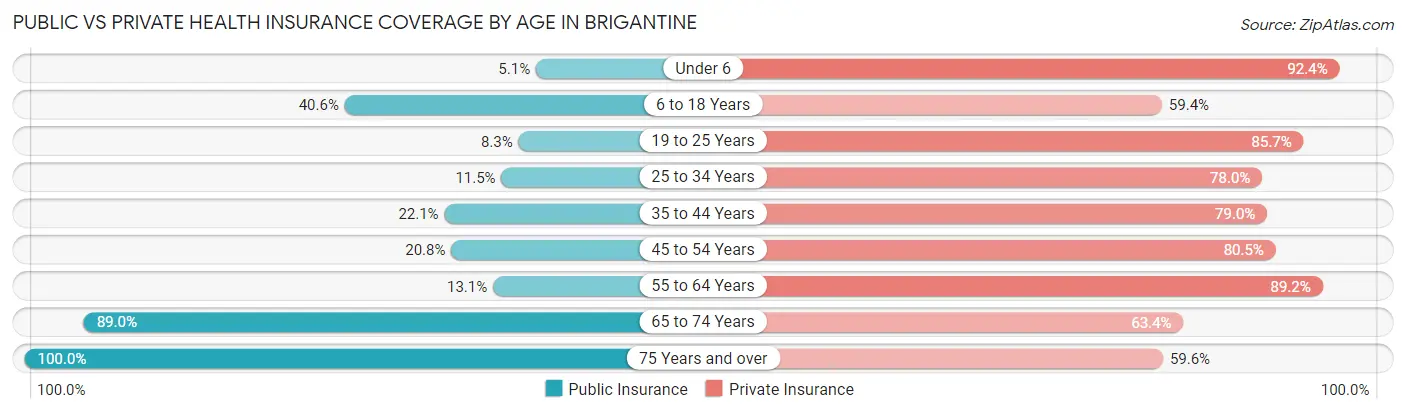
| Age Bracket | Public Insurance | Private Insurance |
| Under 6 | 12 (5.1%) | 218 (92.4%) |
| 6 to 18 Years | 237 (40.6%) | 347 (59.4%) |
| 19 to 25 Years | 46 (8.3%) | 474 (85.7%) |
| 25 to 34 Years | 80 (11.5%) | 543 (78.0%) |
| 35 to 44 Years | 130 (22.1%) | 465 (78.9%) |
| 45 to 54 Years | 172 (20.8%) | 666 (80.5%) |
| 55 to 64 Years | 234 (13.1%) | 1,600 (89.2%) |
| 65 to 74 Years | 1,314 (89.0%) | 936 (63.4%) |
| 75 Years and over | 968 (100.0%) | 577 (59.6%) |
| Total | 3,193 (41.3%) | 5,826 (75.4%) |
Disability Status by Sex by Age in Brigantine
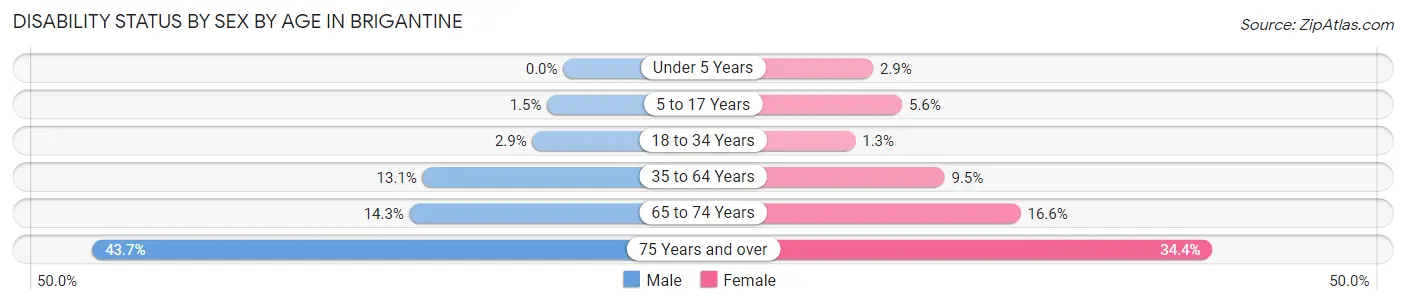
| Age Bracket | Male | Female |
| Under 5 Years | 0 (0.0%) | 5 (2.9%) |
| 5 to 17 Years | 4 (1.5%) | 17 (5.6%) |
| 18 to 34 Years | 19 (2.9%) | 8 (1.3%) |
| 35 to 64 Years | 193 (13.1%) | 165 (9.5%) |
| 65 to 74 Years | 85 (14.3%) | 146 (16.6%) |
| 75 Years and over | 160 (43.7%) | 207 (34.4%) |
Disability Class by Sex by Age in Brigantine
Disability Class: Hearing Difficulty
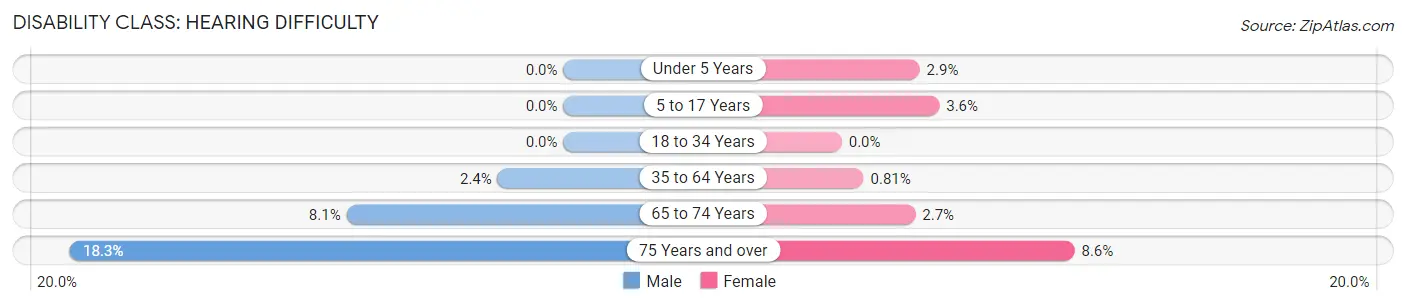
| Age Bracket | Male | Female |
| Under 5 Years | 0 (0.0%) | 5 (2.9%) |
| 5 to 17 Years | 0 (0.0%) | 11 (3.6%) |
| 18 to 34 Years | 0 (0.0%) | 0 (0.0%) |
| 35 to 64 Years | 36 (2.4%) | 14 (0.8%) |
| 65 to 74 Years | 48 (8.1%) | 24 (2.7%) |
| 75 Years and over | 67 (18.3%) | 52 (8.6%) |
Disability Class: Vision Difficulty
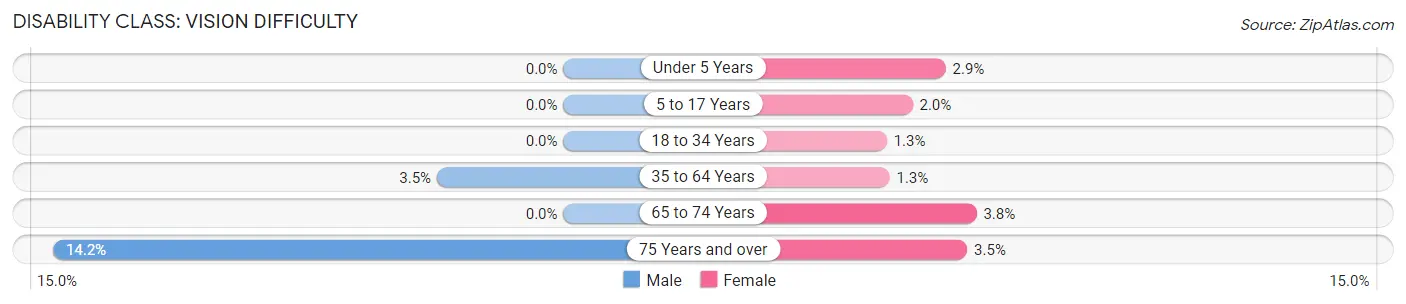
| Age Bracket | Male | Female |
| Under 5 Years | 0 (0.0%) | 5 (2.9%) |
| 5 to 17 Years | 0 (0.0%) | 6 (2.0%) |
| 18 to 34 Years | 0 (0.0%) | 8 (1.3%) |
| 35 to 64 Years | 52 (3.5%) | 23 (1.3%) |
| 65 to 74 Years | 0 (0.0%) | 33 (3.7%) |
| 75 Years and over | 52 (14.2%) | 21 (3.5%) |
Disability Class: Cognitive Difficulty
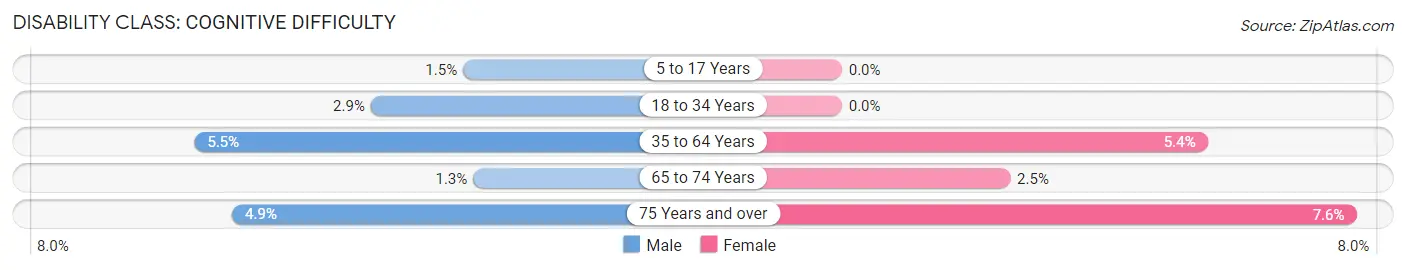
| Age Bracket | Male | Female |
| 5 to 17 Years | 4 (1.5%) | 0 (0.0%) |
| 18 to 34 Years | 19 (2.9%) | 0 (0.0%) |
| 35 to 64 Years | 81 (5.5%) | 94 (5.4%) |
| 65 to 74 Years | 8 (1.3%) | 22 (2.5%) |
| 75 Years and over | 18 (4.9%) | 46 (7.6%) |
Disability Class: Ambulatory Difficulty
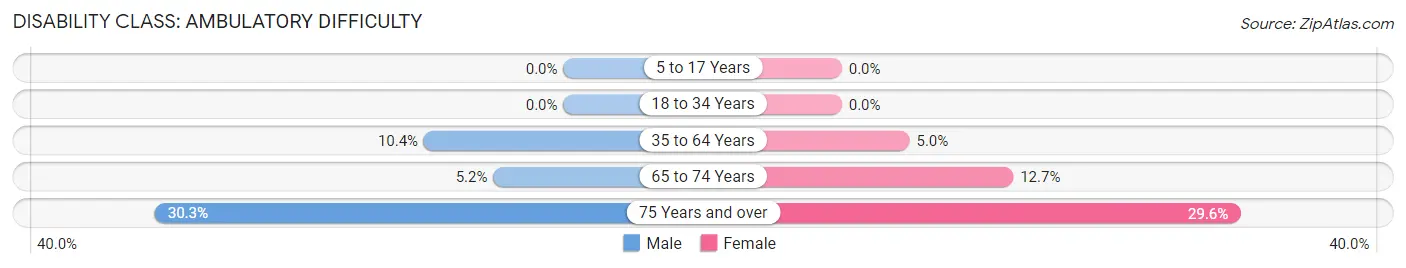
| Age Bracket | Male | Female |
| 5 to 17 Years | 0 (0.0%) | 0 (0.0%) |
| 18 to 34 Years | 0 (0.0%) | 0 (0.0%) |
| 35 to 64 Years | 153 (10.3%) | 87 (5.0%) |
| 65 to 74 Years | 31 (5.2%) | 112 (12.7%) |
| 75 Years and over | 111 (30.3%) | 178 (29.6%) |
Disability Class: Self-Care Difficulty
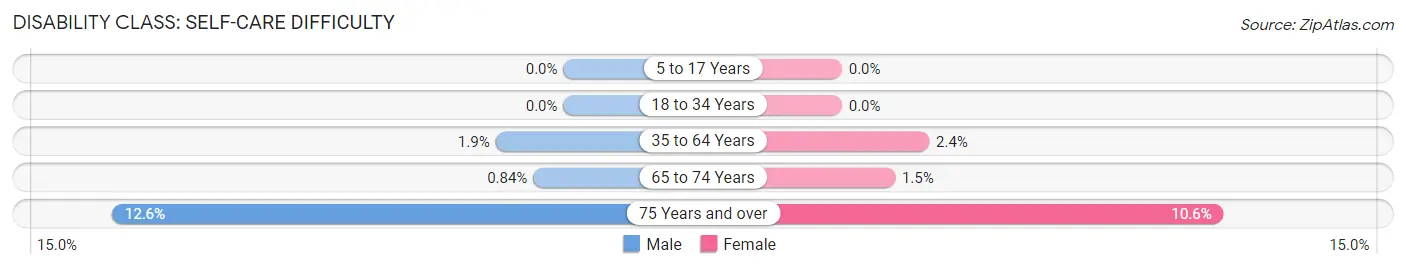
| Age Bracket | Male | Female |
| 5 to 17 Years | 0 (0.0%) | 0 (0.0%) |
| 18 to 34 Years | 0 (0.0%) | 0 (0.0%) |
| 35 to 64 Years | 28 (1.9%) | 42 (2.4%) |
| 65 to 74 Years | 5 (0.8%) | 13 (1.5%) |
| 75 Years and over | 46 (12.6%) | 64 (10.6%) |
Technology Access in Brigantine
Computing Device Access in Brigantine
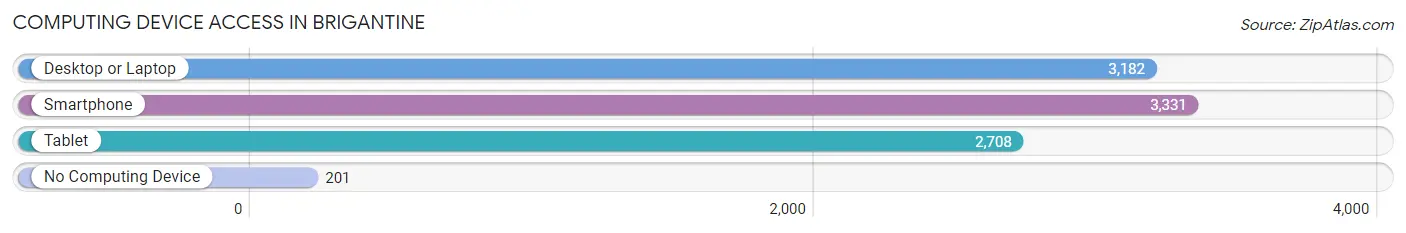
| Device Type | # Households | % Households |
| Desktop or Laptop | 3,182 | 84.9% |
| Smartphone | 3,331 | 88.9% |
| Tablet | 2,708 | 72.3% |
| No Computing Device | 201 | 5.4% |
| Total | 3,748 | 100.0% |
Internet Access in Brigantine
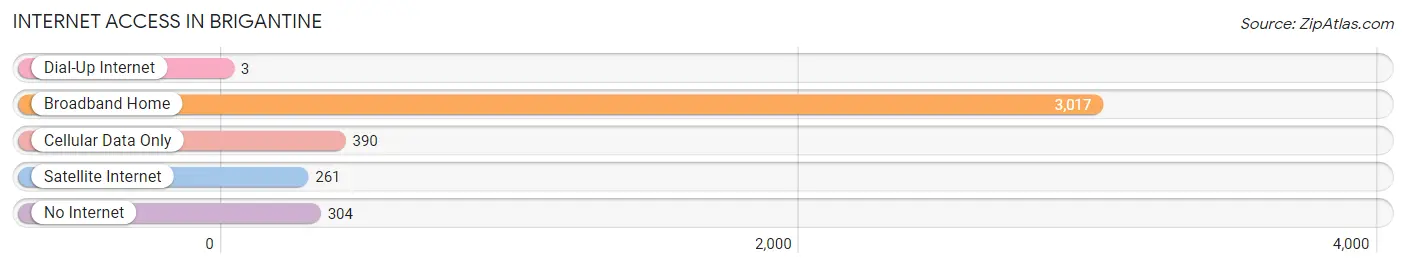
| Internet Type | # Households | % Households |
| Dial-Up Internet | 3 | 0.1% |
| Broadband Home | 3,017 | 80.5% |
| Cellular Data Only | 390 | 10.4% |
| Satellite Internet | 261 | 7.0% |
| No Internet | 304 | 8.1% |
| Total | 3,748 | 100.0% |
Brigantine Summary
Brigantine is a small city located in Atlantic County, New Jersey. It is situated on a barrier island off the coast of Atlantic City and is part of the Atlantic City Metropolitan Statistical Area. The city has a population of approximately 9,450 people as of the 2010 census.
History
Brigantine was first settled in 1695 by a group of Swedish settlers. The city was named after a type of sailing vessel called a brigantine. The city was incorporated in 1890 and was a popular summer resort destination for many years. In the early 1900s, the city was home to a number of large hotels and resorts.
Geography
Brigantine is located on a barrier island off the coast of Atlantic City. The city is bordered by the Atlantic Ocean to the east and the Intracoastal Waterway to the west. The city is approximately 7.5 miles long and 1.5 miles wide. The city is divided into two sections, the north end and the south end. The north end is primarily residential while the south end is more commercial and tourist-oriented.
Economy
Brigantine’s economy is largely based on tourism. The city is home to a number of hotels, restaurants, and other tourist attractions. The city also has a number of marinas and is a popular destination for fishing and boating. The city is also home to a number of retail stores and other businesses.
Demographics
As of the 2010 census, Brigantine had a population of 9,450 people. The racial makeup of the city was 87.3% White, 5.2% African American, 0.7% Native American, 1.3% Asian, 0.1% Pacific Islander, and 4.4% from other races. The median household income was $50,945 and the median family income was $60,945.
Conclusion
Brigantine is a small city located in Atlantic County, New Jersey. It is situated on a barrier island off the coast of Atlantic City and is part of the Atlantic City Metropolitan Statistical Area. The city has a population of approximately 9,450 people as of the 2010 census. Brigantine’s economy is largely based on tourism and the city is home to a number of hotels, restaurants, and other tourist attractions. The racial makeup of the city was 87.3% White, 5.2% African American, 0.7% Native American, 1.3% Asian, 0.1% Pacific Islander, and 4.4% from other races. The median household income was $50,945 and the median family income was $60,945.
Common Questions
What is Per Capita Income in Brigantine?
Per Capita income in Brigantine is $63,648.
What is the Median Family Income in Brigantine?
Median Family Income in Brigantine is $120,335.
What is the Median Household income in Brigantine?
Median Household Income in Brigantine is $91,307.
What is Income or Wage Gap in Brigantine?
Income or Wage Gap in Brigantine is 34.8%.
Women in Brigantine earn 65.2 cents for every dollar earned by a man.
What is Family Income Deficit in Brigantine?
Family Income Deficit in Brigantine is $14,206.
Families that are below poverty line in Brigantine earn $14,206 less on average than the poverty threshold level.
What is Inequality or Gini Index in Brigantine?
Inequality or Gini Index in Brigantine is 0.53.
What is the Total Population of Brigantine?
Total Population of Brigantine is 7,784.
What is the Total Male Population of Brigantine?
Total Male Population of Brigantine is 3,455.
What is the Total Female Population of Brigantine?
Total Female Population of Brigantine is 4,329.
What is the Ratio of Males per 100 Females in Brigantine?
There are 79.81 Males per 100 Females in Brigantine.
What is the Ratio of Females per 100 Males in Brigantine?
There are 125.30 Females per 100 Males in Brigantine.
What is the Median Population Age in Brigantine?
Median Population Age in Brigantine is 57.6 Years.
What is the Average Family Size in Brigantine
Average Family Size in Brigantine is 2.6 People.
What is the Average Household Size in Brigantine
Average Household Size in Brigantine is 2.1 People.
How Large is the Labor Force in Brigantine?
There are 4,250 People in the Labor Forcein in Brigantine.
What is the Percentage of People in the Labor Force in Brigantine?
60.0% of People are in the Labor Force in Brigantine.
What is the Unemployment Rate in Brigantine?
Unemployment Rate in Brigantine is 4.9%.