Boonton, NJ Map & Demographics
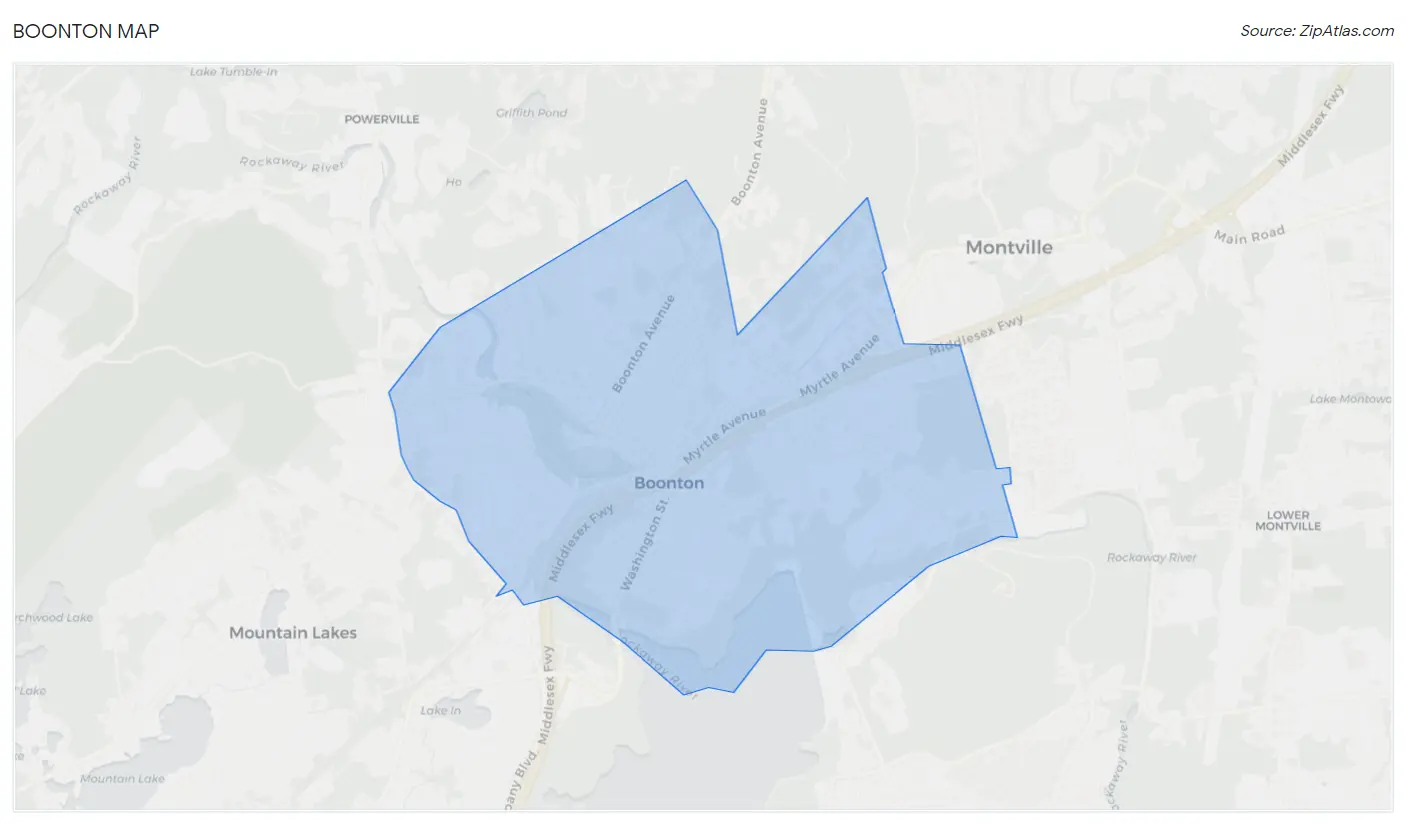
Boonton Map
Boonton Overview
$47,574
PER CAPITA INCOME
$126,394
AVG FAMILY INCOME
$96,500
AVG HOUSEHOLD INCOME
33.7%
WAGE / INCOME GAP [ % ]
66.3¢/ $1
WAGE / INCOME GAP [ $ ]
0.44
INEQUALITY / GINI INDEX
8,781
TOTAL POPULATION
4,676
MALE POPULATION
4,105
FEMALE POPULATION
113.91
MALES / 100 FEMALES
87.79
FEMALES / 100 MALES
40.3
MEDIAN AGE
3.3
AVG FAMILY SIZE
2.5
AVG HOUSEHOLD SIZE
5,042
LABOR FORCE [ PEOPLE ]
71.2%
PERCENT IN LABOR FORCE
3.9%
UNEMPLOYMENT RATE
Boonton Zip Codes
Income in Boonton
Income Overview in Boonton
Per Capita Income in Boonton is $47,574, while median incomes of families and households are $126,394 and $96,500 respectively.
| Characteristic | Number | Measure |
| Per Capita Income | 8,781 | $47,574 |
| Median Family Income | 2,181 | $126,394 |
| Mean Family Income | 2,181 | $144,773 |
| Median Household Income | 3,414 | $96,500 |
| Mean Household Income | 3,414 | $118,463 |
| Income Deficit | 2,181 | $0 |
| Wage / Income Gap (%) | 8,781 | 33.66% |
| Wage / Income Gap ($) | 8,781 | 66.34¢ per $1 |
| Gini / Inequality Index | 8,781 | 0.44 |
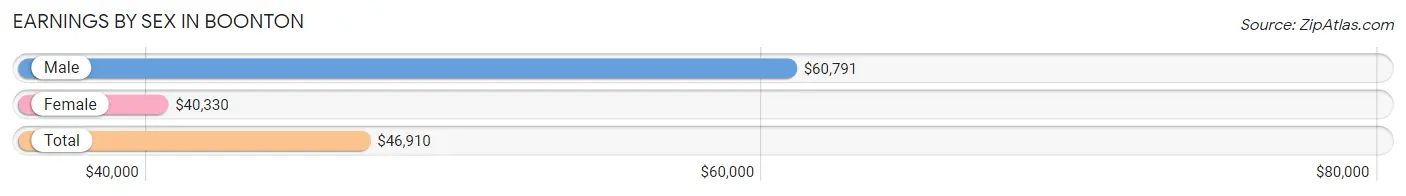
Earnings by Sex in Boonton
Average Earnings in Boonton are $46,910, $60,791 for men and $40,330 for women, a difference of 33.7%.
| Sex | Number | Average Earnings |
| Male | 2,691 (50.7%) | $60,791 |
| Female | 2,613 (49.3%) | $40,330 |
| Total | 5,304 (100.0%) | $46,910 |
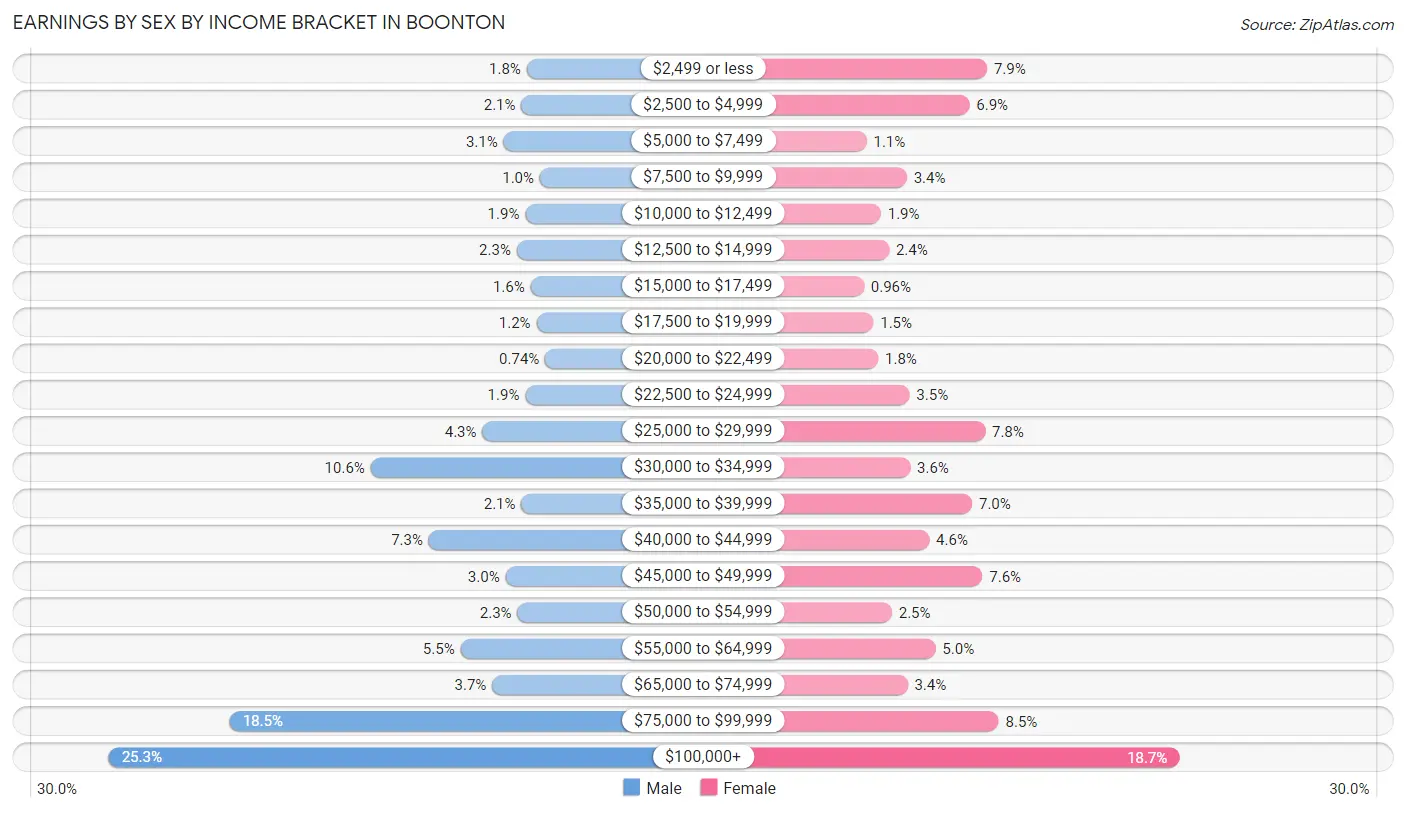
Earnings by Sex by Income Bracket in Boonton
The most common earnings brackets in Boonton are $100,000+ for men (680 | 25.3%) and $100,000+ for women (488 | 18.7%).
| Income | Male | Female |
| $2,499 or less | 48 (1.8%) | 206 (7.9%) |
| $2,500 to $4,999 | 56 (2.1%) | 180 (6.9%) |
| $5,000 to $7,499 | 83 (3.1%) | 29 (1.1%) |
| $7,500 to $9,999 | 28 (1.0%) | 88 (3.4%) |
| $10,000 to $12,499 | 50 (1.9%) | 50 (1.9%) |
| $12,500 to $14,999 | 63 (2.3%) | 62 (2.4%) |
| $15,000 to $17,499 | 42 (1.6%) | 25 (1.0%) |
| $17,500 to $19,999 | 33 (1.2%) | 39 (1.5%) |
| $20,000 to $22,499 | 20 (0.7%) | 46 (1.8%) |
| $22,500 to $24,999 | 50 (1.9%) | 92 (3.5%) |
| $25,000 to $29,999 | 115 (4.3%) | 203 (7.8%) |
| $30,000 to $34,999 | 284 (10.5%) | 93 (3.6%) |
| $35,000 to $39,999 | 56 (2.1%) | 184 (7.0%) |
| $40,000 to $44,999 | 196 (7.3%) | 121 (4.6%) |
| $45,000 to $49,999 | 80 (3.0%) | 199 (7.6%) |
| $50,000 to $54,999 | 62 (2.3%) | 66 (2.5%) |
| $55,000 to $64,999 | 148 (5.5%) | 130 (5.0%) |
| $65,000 to $74,999 | 100 (3.7%) | 89 (3.4%) |
| $75,000 to $99,999 | 497 (18.5%) | 223 (8.5%) |
| $100,000+ | 680 (25.3%) | 488 (18.7%) |
| Total | 2,691 (100.0%) | 2,613 (100.0%) |
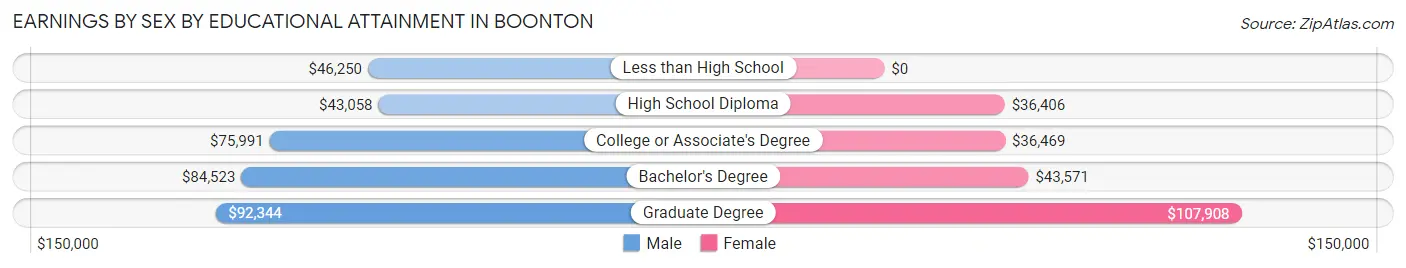
Earnings by Sex by Educational Attainment in Boonton
Average earnings in Boonton are $75,322 for men and $45,234 for women, a difference of 40.0%. Men with an educational attainment of graduate degree enjoy the highest average annual earnings of $92,344, while those with high school diploma education earn the least with $43,058. Women with an educational attainment of graduate degree earn the most with the average annual earnings of $107,908, while those with high school diploma education have the smallest earnings of $36,406.
| Educational Attainment | Male Income | Female Income |
| Less than High School | $46,250 | $0 |
| High School Diploma | $43,058 | $36,406 |
| College or Associate's Degree | $75,991 | $36,469 |
| Bachelor's Degree | $84,523 | $43,571 |
| Graduate Degree | $92,344 | $107,908 |
| Total | $75,322 | $45,234 |
Family Income in Boonton
Family Income Brackets in Boonton
According to the Boonton family income data, there are 471 families falling into the $200,000+ income range, which is the most common income bracket and makes up 21.6% of all families. Conversely, the less than $10,000 income bracket is the least frequent group with only 15 families (0.7%) belonging to this category.
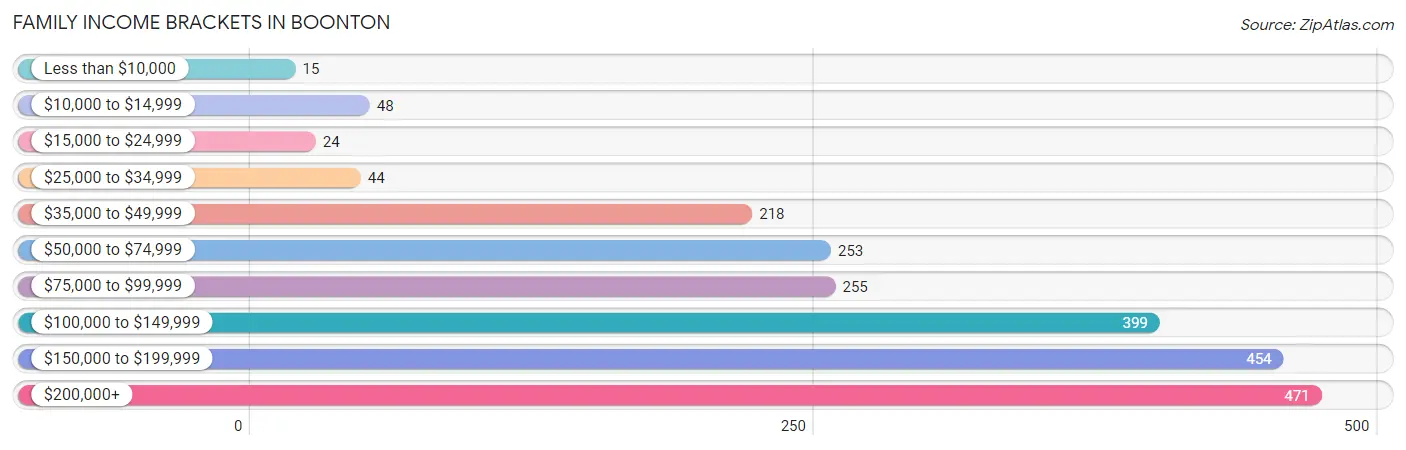
| Income Bracket | # Families | % Families |
| Less than $10,000 | 15 | 0.7% |
| $10,000 to $14,999 | 48 | 2.2% |
| $15,000 to $24,999 | 24 | 1.1% |
| $25,000 to $34,999 | 44 | 2.0% |
| $35,000 to $49,999 | 218 | 10.0% |
| $50,000 to $74,999 | 253 | 11.6% |
| $75,000 to $99,999 | 255 | 11.7% |
| $100,000 to $149,999 | 399 | 18.3% |
| $150,000 to $199,999 | 454 | 20.8% |
| $200,000+ | 471 | 21.6% |
Family Income by Famaliy Size in Boonton
5-person families (134 | 6.1%) account for the highest median family income in Boonton with $193,095 per family, while 2-person families (744 | 34.1%) have the highest median income of $57,500 per family member.
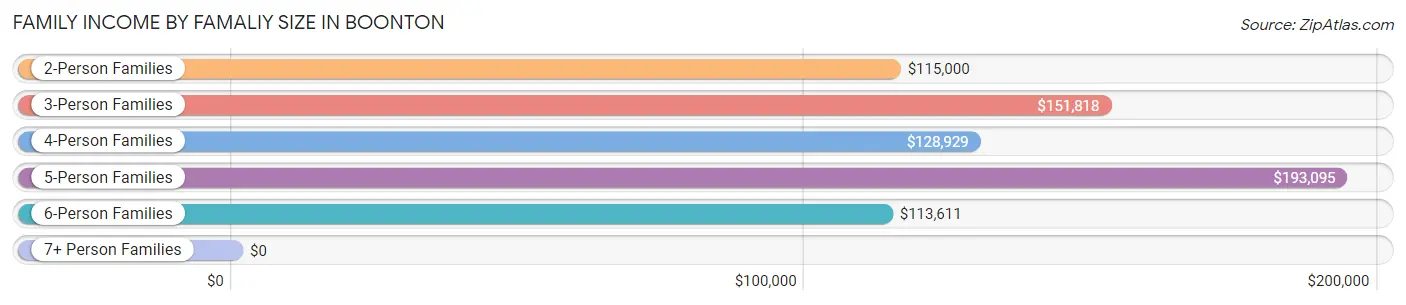
| Income Bracket | # Families | Median Income |
| 2-Person Families | 744 (34.1%) | $115,000 |
| 3-Person Families | 786 (36.0%) | $151,818 |
| 4-Person Families | 430 (19.7%) | $128,929 |
| 5-Person Families | 134 (6.1%) | $193,095 |
| 6-Person Families | 58 (2.7%) | $113,611 |
| 7+ Person Families | 29 (1.3%) | $0 |
| Total | 2,181 (100.0%) | $126,394 |
Family Income by Number of Earners in Boonton
The median family income in Boonton is $126,394, with families comprising 3+ earners (353) having the highest median family income of $172,276, while families with 1 earner (527) have the lowest median family income of $82,039, accounting for 16.2% and 24.2% of families, respectively.
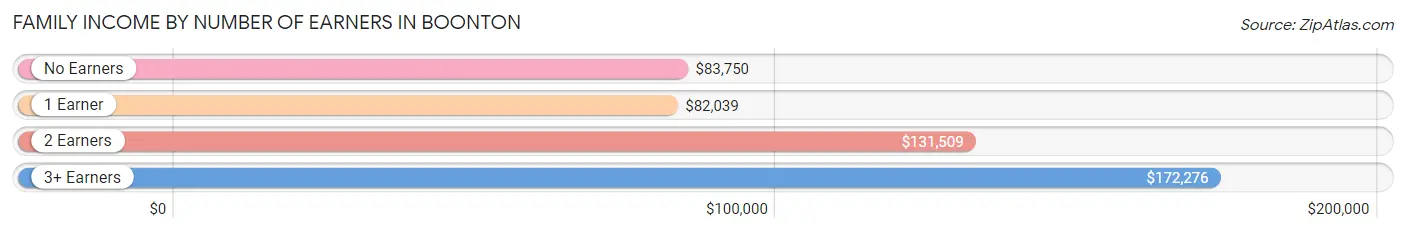
| Number of Earners | # Families | Median Income |
| No Earners | 82 (3.8%) | $83,750 |
| 1 Earner | 527 (24.2%) | $82,039 |
| 2 Earners | 1,219 (55.9%) | $131,509 |
| 3+ Earners | 353 (16.2%) | $172,276 |
| Total | 2,181 (100.0%) | $126,394 |
Household Income in Boonton
Household Income Brackets in Boonton
With 550 households falling in the category, the $200,000+ income range is the most frequent in Boonton, accounting for 16.1% of all households. In contrast, only 102 households (3.0%) fall into the $10,000 to $14,999 income bracket, making it the least populous group.
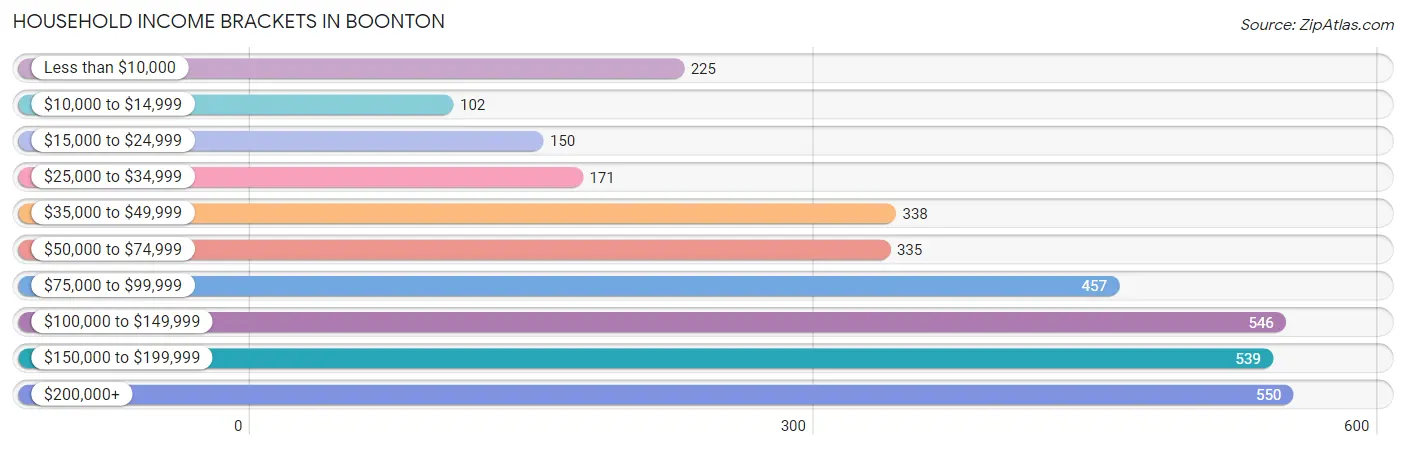
| Income Bracket | # Households | % Households |
| Less than $10,000 | 225 | 6.6% |
| $10,000 to $14,999 | 102 | 3.0% |
| $15,000 to $24,999 | 150 | 4.4% |
| $25,000 to $34,999 | 171 | 5.0% |
| $35,000 to $49,999 | 338 | 9.9% |
| $50,000 to $74,999 | 335 | 9.8% |
| $75,000 to $99,999 | 457 | 13.4% |
| $100,000 to $149,999 | 546 | 16.0% |
| $150,000 to $199,999 | 539 | 15.8% |
| $200,000+ | 550 | 16.1% |
Household Income by Householder Age in Boonton
The median household income in Boonton is $96,500, with the highest median household income of $122,607 found in the 25 to 44 years age bracket for the primary householder. A total of 1,089 households (31.9%) fall into this category. Meanwhile, the 15 to 24 years age bracket for the primary householder has the lowest median household income of $0, with 88 households (2.6%) in this group.
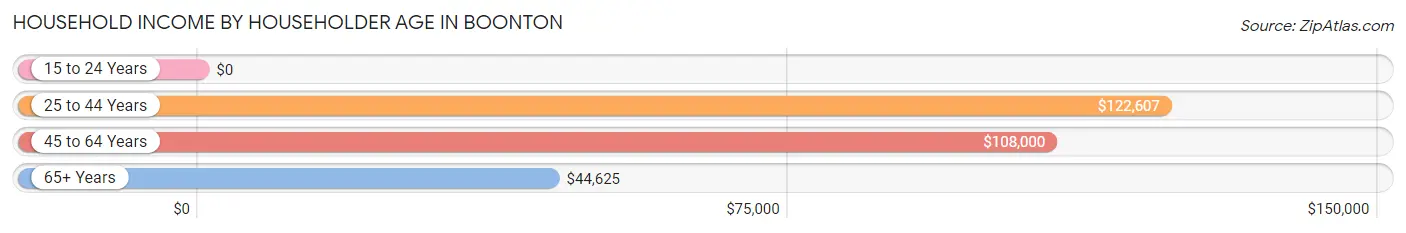
| Income Bracket | # Households | Median Income |
| 15 to 24 Years | 88 (2.6%) | $0 |
| 25 to 44 Years | 1,089 (31.9%) | $122,607 |
| 45 to 64 Years | 1,458 (42.7%) | $108,000 |
| 65+ Years | 779 (22.8%) | $44,625 |
| Total | 3,414 (100.0%) | $96,500 |
Poverty in Boonton
Income Below Poverty by Sex and Age in Boonton
With 6.7% poverty level for males and 5.2% for females among the residents of Boonton, 65 to 74 year old males and 6 to 11 year old females are the most vulnerable to poverty, with 142 males (26.6%) and 26 females (9.6%) in their respective age groups living below the poverty level.
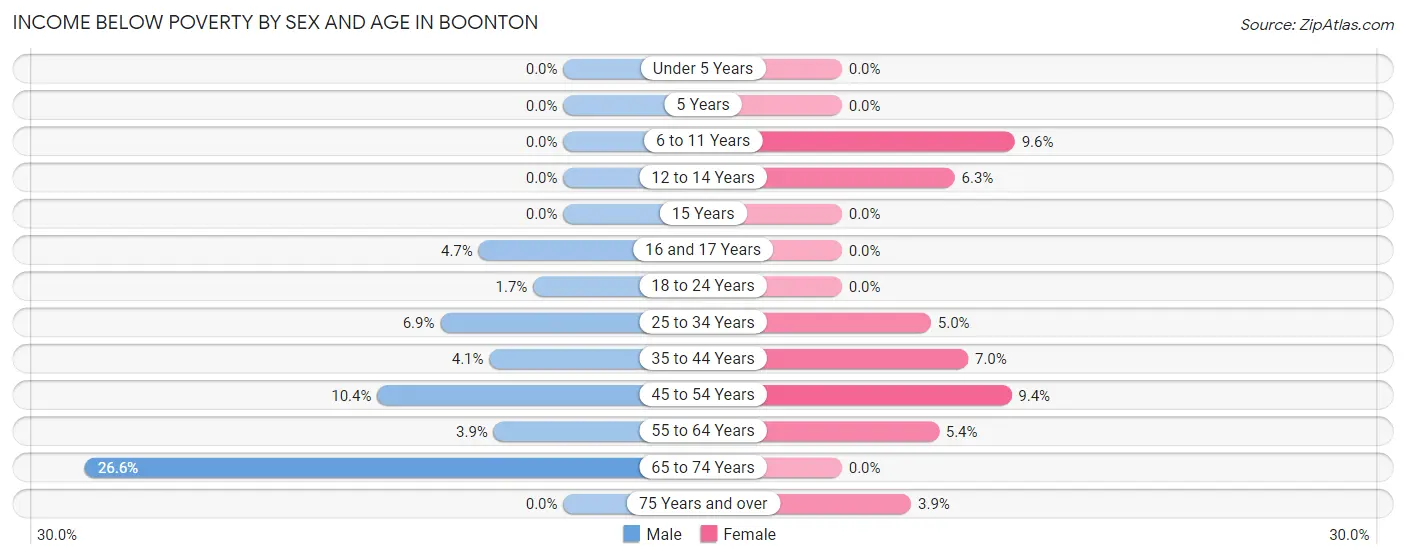
| Age Bracket | Male | Female |
| Under 5 Years | 0 (0.0%) | 0 (0.0%) |
| 5 Years | 0 (0.0%) | 0 (0.0%) |
| 6 to 11 Years | 0 (0.0%) | 26 (9.6%) |
| 12 to 14 Years | 0 (0.0%) | 13 (6.3%) |
| 15 Years | 0 (0.0%) | 0 (0.0%) |
| 16 and 17 Years | 6 (4.7%) | 0 (0.0%) |
| 18 to 24 Years | 8 (1.7%) | 0 (0.0%) |
| 25 to 34 Years | 35 (6.9%) | 23 (5.0%) |
| 35 to 44 Years | 31 (4.1%) | 41 (7.0%) |
| 45 to 54 Years | 63 (10.4%) | 69 (9.4%) |
| 55 to 64 Years | 22 (3.9%) | 31 (5.4%) |
| 65 to 74 Years | 142 (26.6%) | 0 (0.0%) |
| 75 Years and over | 0 (0.0%) | 10 (3.9%) |
| Total | 307 (6.7%) | 213 (5.2%) |
Income Above Poverty by Sex and Age in Boonton
According to the poverty statistics in Boonton, males aged under 5 years and females aged under 5 years are the age groups that are most secure financially, with 100.0% of males and 100.0% of females in these age groups living above the poverty line.
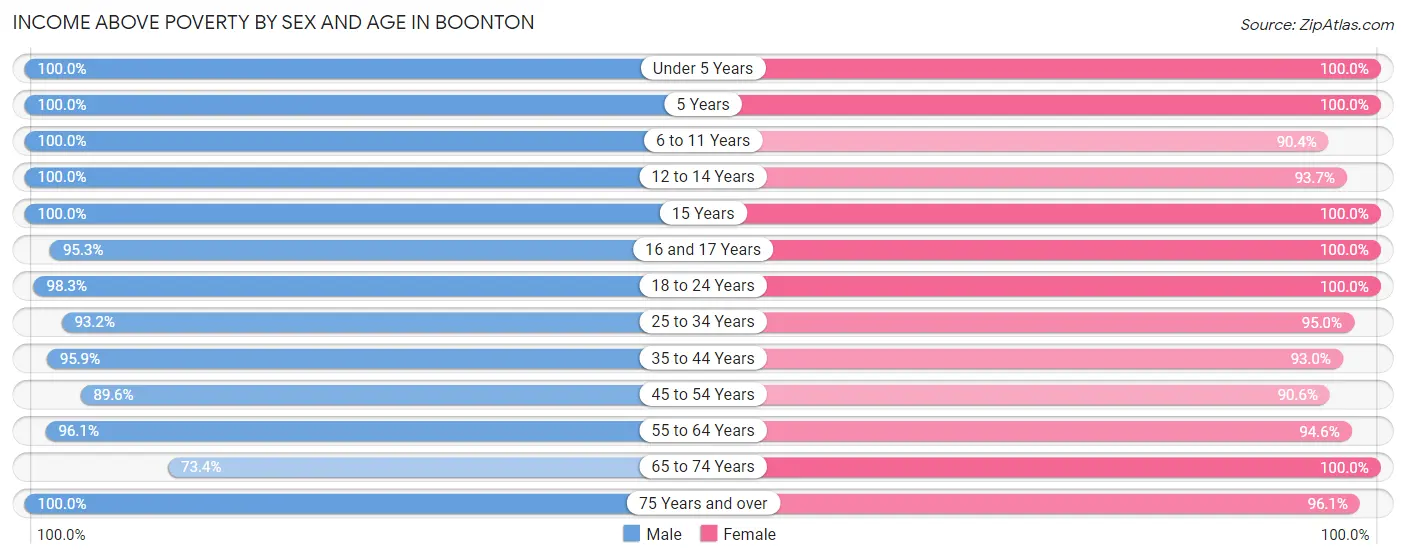
| Age Bracket | Male | Female |
| Under 5 Years | 217 (100.0%) | 192 (100.0%) |
| 5 Years | 51 (100.0%) | 48 (100.0%) |
| 6 to 11 Years | 427 (100.0%) | 244 (90.4%) |
| 12 to 14 Years | 133 (100.0%) | 194 (93.7%) |
| 15 Years | 79 (100.0%) | 54 (100.0%) |
| 16 and 17 Years | 121 (95.3%) | 93 (100.0%) |
| 18 to 24 Years | 467 (98.3%) | 332 (100.0%) |
| 25 to 34 Years | 476 (93.1%) | 441 (95.0%) |
| 35 to 44 Years | 721 (95.9%) | 542 (93.0%) |
| 45 to 54 Years | 545 (89.6%) | 662 (90.6%) |
| 55 to 64 Years | 545 (96.1%) | 543 (94.6%) |
| 65 to 74 Years | 391 (73.4%) | 293 (100.0%) |
| 75 Years and over | 98 (100.0%) | 249 (96.1%) |
| Total | 4,271 (93.3%) | 3,887 (94.8%) |
Income Below Poverty Among Married-Couple Families in Boonton
The poverty statistics for married-couple families in Boonton show that 2.8% or 49 of the total 1,740 families live below the poverty line. Families with no children have the highest poverty rate of 5.6%, comprising of 49 families. On the other hand, families with 1 or 2 children have the lowest poverty rate of 0.0%, which includes 0 families.
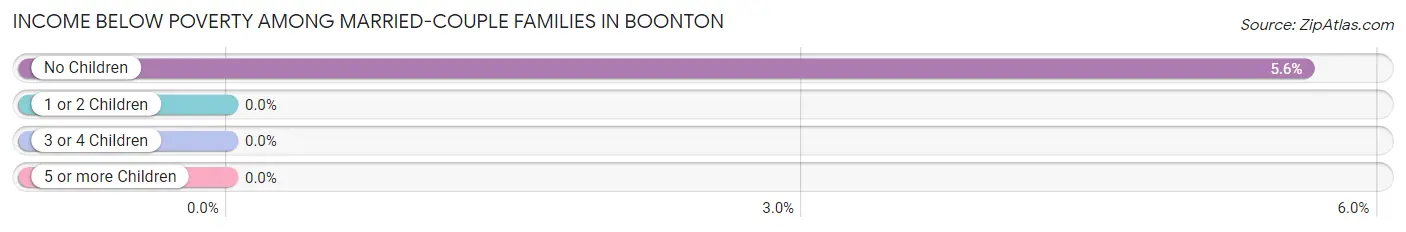
| Children | Above Poverty | Below Poverty |
| No Children | 823 (94.4%) | 49 (5.6%) |
| 1 or 2 Children | 684 (100.0%) | 0 (0.0%) |
| 3 or 4 Children | 175 (100.0%) | 0 (0.0%) |
| 5 or more Children | 9 (100.0%) | 0 (0.0%) |
| Total | 1,691 (97.2%) | 49 (2.8%) |
Income Below Poverty Among Single-Parent Households in Boonton
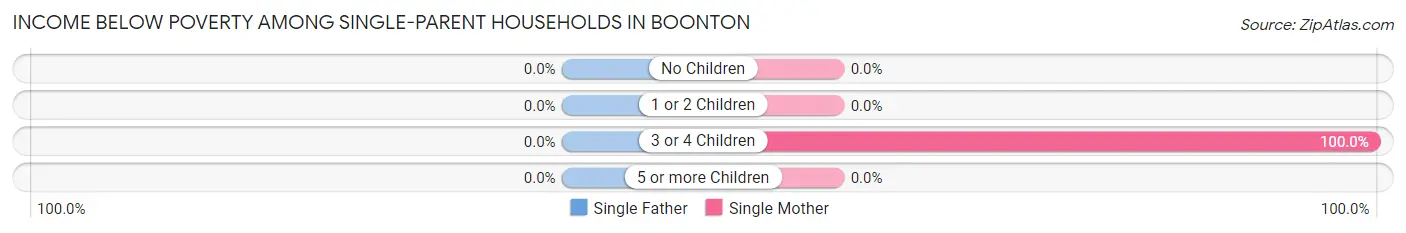
| Children | Single Father | Single Mother |
| No Children | 0 (0.0%) | 0 (0.0%) |
| 1 or 2 Children | 0 (0.0%) | 0 (0.0%) |
| 3 or 4 Children | 0 (0.0%) | 14 (100.0%) |
| 5 or more Children | 0 (0.0%) | 0 (0.0%) |
| Total | 0 (0.0%) | 14 (4.4%) |
Income Below Poverty Among Married-Couple vs Single-Parent Households in Boonton
The poverty data for Boonton shows that 49 of the married-couple family households (2.8%) and 14 of the single-parent households (3.2%) are living below the poverty level. Within the married-couple family households, those with no children have the highest poverty rate, with 49 households (5.6%) falling below the poverty line. Among the single-parent households, those with 3 or 4 children have the highest poverty rate, with 14 household (100.0%) living below poverty.
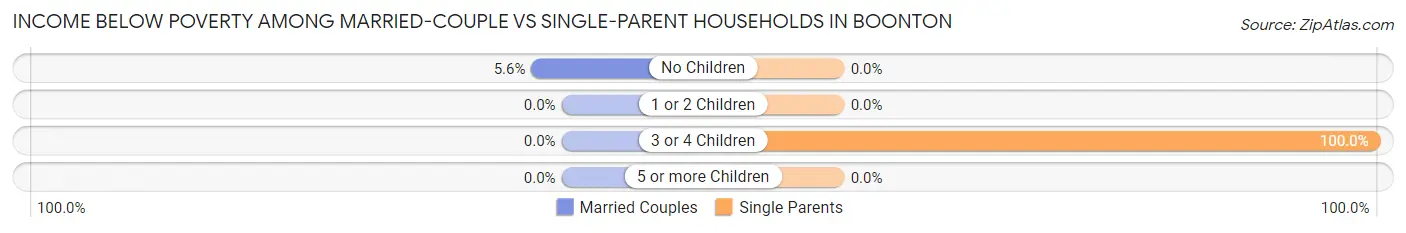
| Children | Married-Couple Families | Single-Parent Households |
| No Children | 49 (5.6%) | 0 (0.0%) |
| 1 or 2 Children | 0 (0.0%) | 0 (0.0%) |
| 3 or 4 Children | 0 (0.0%) | 14 (100.0%) |
| 5 or more Children | 0 (0.0%) | 0 (0.0%) |
| Total | 49 (2.8%) | 14 (3.2%) |
Race in Boonton
The most populous races in Boonton are White / Caucasian (6,059 | 69.0%), Hispanic or Latino (1,306 | 14.9%), and Two or more Races (976 | 11.1%).
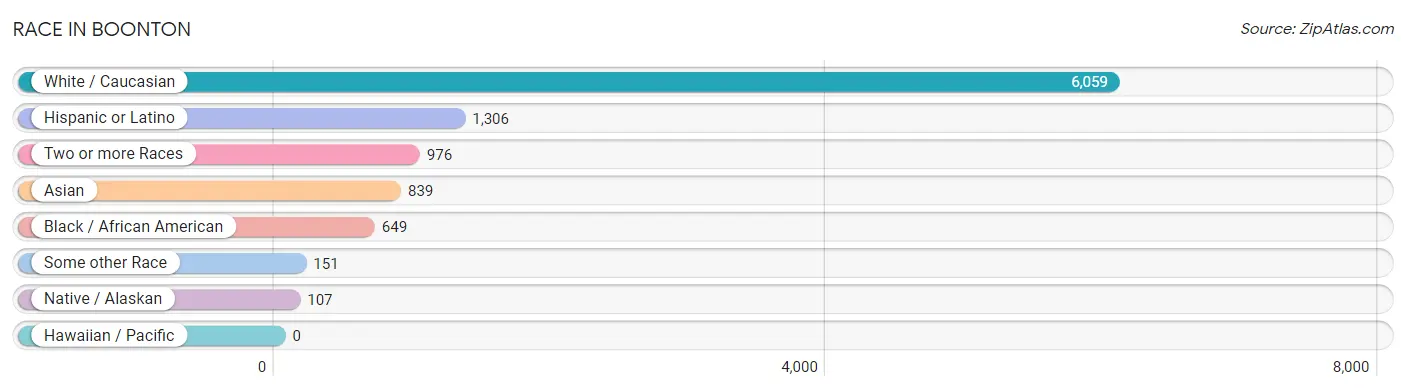
| Race | # Population | % Population |
| Asian | 839 | 9.6% |
| Black / African American | 649 | 7.4% |
| Hawaiian / Pacific | 0 | 0.0% |
| Hispanic or Latino | 1,306 | 14.9% |
| Native / Alaskan | 107 | 1.2% |
| White / Caucasian | 6,059 | 69.0% |
| Two or more Races | 976 | 11.1% |
| Some other Race | 151 | 1.7% |
| Total | 8,781 | 100.0% |
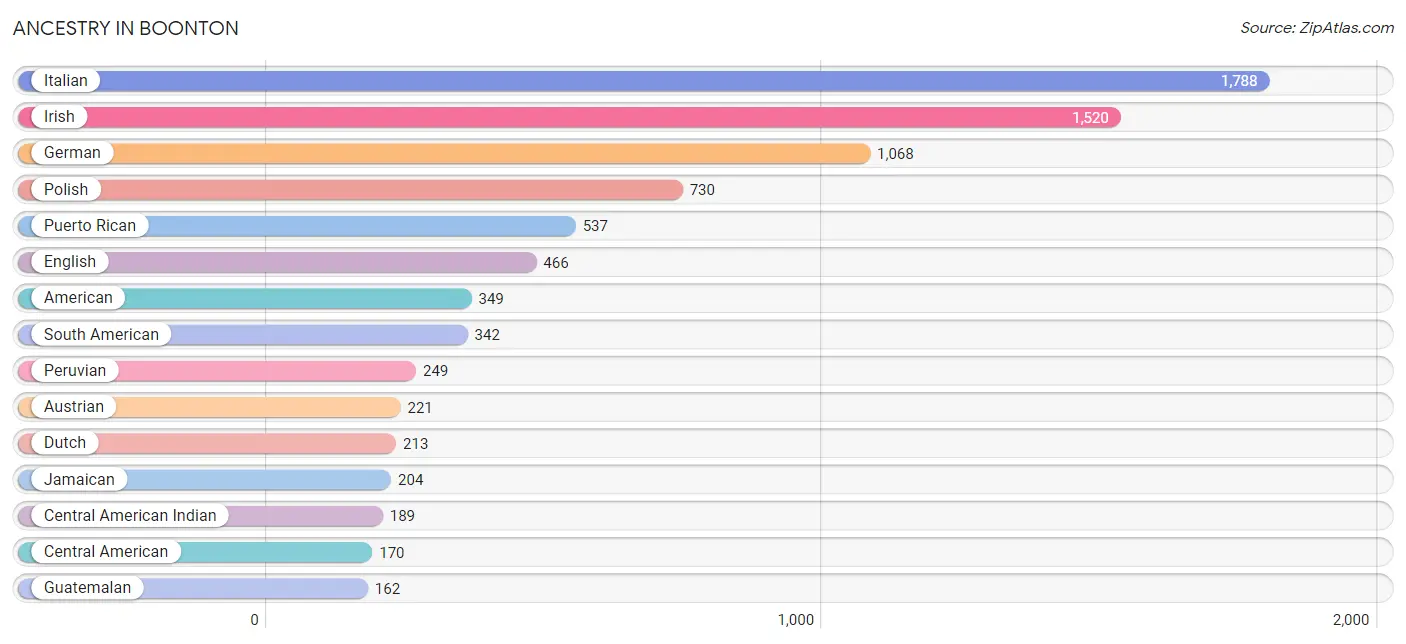
Ancestry in Boonton
The most populous ancestries reported in Boonton are Italian (1,788 | 20.4%), Irish (1,520 | 17.3%), German (1,068 | 12.2%), Polish (730 | 8.3%), and Puerto Rican (537 | 6.1%), together accounting for 64.3% of all Boonton residents.
| Ancestry | # Population | % Population |
| African | 39 | 0.4% |
| American | 349 | 4.0% |
| Arab | 28 | 0.3% |
| Argentinean | 16 | 0.2% |
| Austrian | 221 | 2.5% |
| Belgian | 13 | 0.2% |
| Bhutanese | 146 | 1.7% |
| Brazilian | 44 | 0.5% |
| Burmese | 26 | 0.3% |
| Celtic | 11 | 0.1% |
| Central American | 170 | 1.9% |
| Central American Indian | 189 | 2.1% |
| Chilean | 13 | 0.2% |
| Colombian | 47 | 0.5% |
| Croatian | 8 | 0.1% |
| Czech | 59 | 0.7% |
| Danish | 16 | 0.2% |
| Delaware | 5 | 0.1% |
| Dominican | 148 | 1.7% |
| Dutch | 213 | 2.4% |
| Eastern European | 74 | 0.8% |
| Ecuadorian | 17 | 0.2% |
| Egyptian | 15 | 0.2% |
| English | 466 | 5.3% |
| European | 88 | 1.0% |
| Filipino | 41 | 0.5% |
| Finnish | 22 | 0.3% |
| French | 124 | 1.4% |
| French Canadian | 15 | 0.2% |
| German | 1,068 | 12.2% |
| Greek | 69 | 0.8% |
| Guatemalan | 162 | 1.8% |
| Guyanese | 29 | 0.3% |
| Haitian | 33 | 0.4% |
| Honduran | 8 | 0.1% |
| Hungarian | 115 | 1.3% |
| Indian (Asian) | 146 | 1.7% |
| Irish | 1,520 | 17.3% |
| Israeli | 30 | 0.3% |
| Italian | 1,788 | 20.4% |
| Jamaican | 204 | 2.3% |
| Korean | 119 | 1.4% |
| Lithuanian | 29 | 0.3% |
| Mexican | 60 | 0.7% |
| Norwegian | 24 | 0.3% |
| Peruvian | 249 | 2.8% |
| Polish | 730 | 8.3% |
| Portuguese | 38 | 0.4% |
| Puerto Rican | 537 | 6.1% |
| Romanian | 122 | 1.4% |
| Russian | 93 | 1.1% |
| Scotch-Irish | 49 | 0.6% |
| Scottish | 140 | 1.6% |
| Slovak | 32 | 0.4% |
| South American | 342 | 3.9% |
| South American Indian | 35 | 0.4% |
| Spanish | 49 | 0.6% |
| Subsaharan African | 55 | 0.6% |
| Swedish | 119 | 1.4% |
| Syrian | 13 | 0.2% |
| Thai | 67 | 0.8% |
| Turkish | 18 | 0.2% |
| Ukrainian | 40 | 0.5% |
| Welsh | 32 | 0.4% |
| West Indian | 39 | 0.4% |
| Yugoslavian | 31 | 0.4% | View All 66 Rows |
Immigrants in Boonton
The most numerous immigrant groups reported in Boonton came from Asia (592 | 6.7%), Latin America (583 | 6.6%), South Central Asia (352 | 4.0%), Pakistan (322 | 3.7%), and Caribbean (321 | 3.7%), together accounting for 24.7% of all Boonton residents.
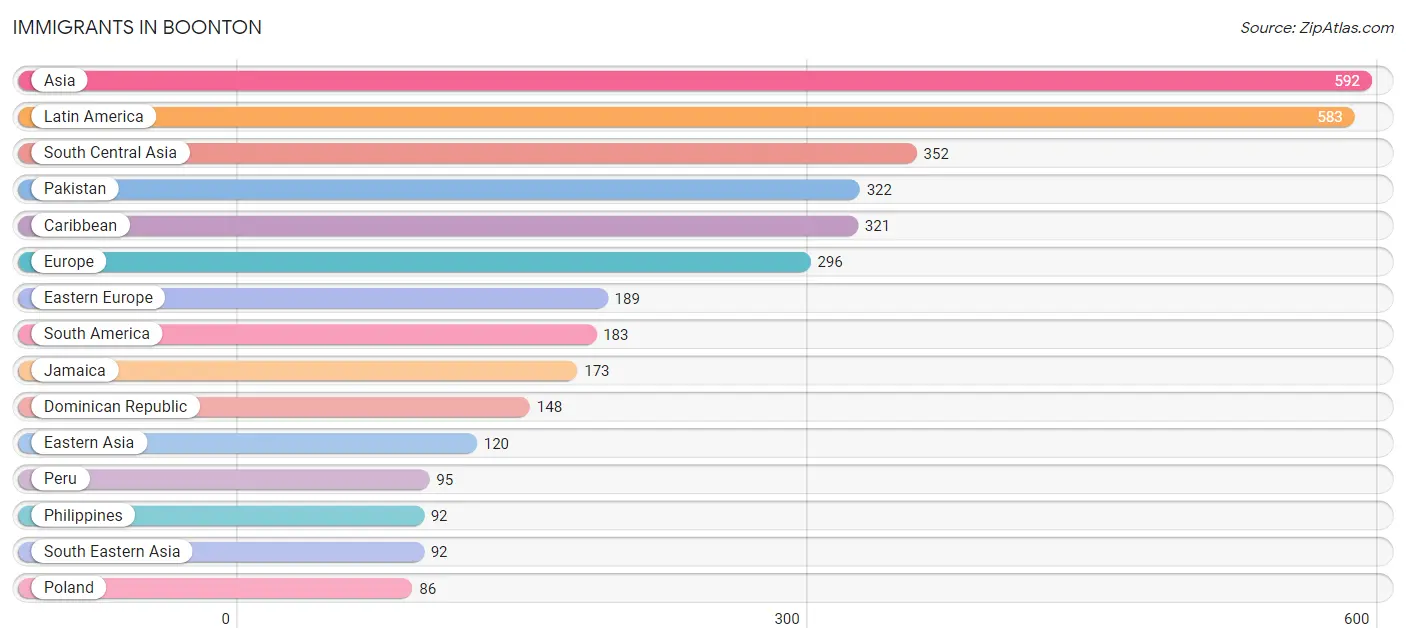
| Immigration Origin | # Population | % Population |
| Africa | 32 | 0.4% |
| Asia | 592 | 6.7% |
| Austria | 30 | 0.3% |
| Caribbean | 321 | 3.7% |
| Central America | 79 | 0.9% |
| Chile | 13 | 0.2% |
| China | 76 | 0.9% |
| Colombia | 47 | 0.5% |
| Dominican Republic | 148 | 1.7% |
| Eastern Africa | 16 | 0.2% |
| Eastern Asia | 120 | 1.4% |
| Eastern Europe | 189 | 2.1% |
| Ecuador | 17 | 0.2% |
| Egypt | 16 | 0.2% |
| England | 10 | 0.1% |
| Europe | 296 | 3.4% |
| Germany | 4 | 0.1% |
| Guatemala | 38 | 0.4% |
| Guyana | 11 | 0.1% |
| Honduras | 8 | 0.1% |
| Hungary | 27 | 0.3% |
| India | 30 | 0.3% |
| Israel | 10 | 0.1% |
| Italy | 63 | 0.7% |
| Jamaica | 173 | 2.0% |
| Japan | 29 | 0.3% |
| Korea | 15 | 0.2% |
| Latin America | 583 | 6.6% |
| Mexico | 33 | 0.4% |
| Northern Africa | 16 | 0.2% |
| Northern Europe | 10 | 0.1% |
| Pakistan | 322 | 3.7% |
| Peru | 95 | 1.1% |
| Philippines | 92 | 1.1% |
| Poland | 86 | 1.0% |
| Romania | 43 | 0.5% |
| Russia | 13 | 0.2% |
| South America | 183 | 2.1% |
| South Central Asia | 352 | 4.0% |
| South Eastern Asia | 92 | 1.1% |
| Southern Europe | 63 | 0.7% |
| Taiwan | 24 | 0.3% |
| Turkey | 18 | 0.2% |
| Western Asia | 28 | 0.3% |
| Western Europe | 34 | 0.4% | View All 45 Rows |
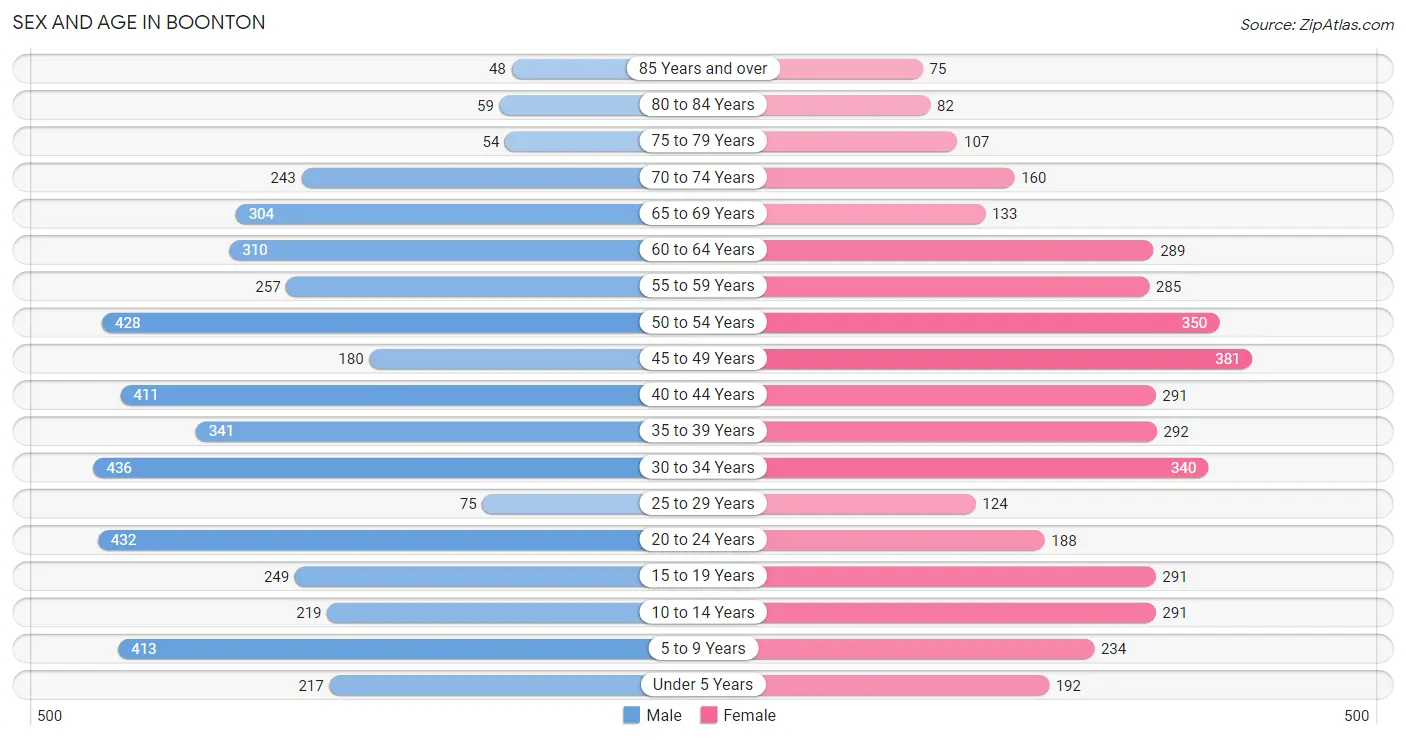
Sex and Age in Boonton
Sex and Age in Boonton
The most populous age groups in Boonton are 30 to 34 Years (436 | 9.3%) for men and 45 to 49 Years (381 | 9.3%) for women.
| Age Bracket | Male | Female |
| Under 5 Years | 217 (4.6%) | 192 (4.7%) |
| 5 to 9 Years | 413 (8.8%) | 234 (5.7%) |
| 10 to 14 Years | 219 (4.7%) | 291 (7.1%) |
| 15 to 19 Years | 249 (5.3%) | 291 (7.1%) |
| 20 to 24 Years | 432 (9.2%) | 188 (4.6%) |
| 25 to 29 Years | 75 (1.6%) | 124 (3.0%) |
| 30 to 34 Years | 436 (9.3%) | 340 (8.3%) |
| 35 to 39 Years | 341 (7.3%) | 292 (7.1%) |
| 40 to 44 Years | 411 (8.8%) | 291 (7.1%) |
| 45 to 49 Years | 180 (3.8%) | 381 (9.3%) |
| 50 to 54 Years | 428 (9.1%) | 350 (8.5%) |
| 55 to 59 Years | 257 (5.5%) | 285 (6.9%) |
| 60 to 64 Years | 310 (6.6%) | 289 (7.0%) |
| 65 to 69 Years | 304 (6.5%) | 133 (3.2%) |
| 70 to 74 Years | 243 (5.2%) | 160 (3.9%) |
| 75 to 79 Years | 54 (1.1%) | 107 (2.6%) |
| 80 to 84 Years | 59 (1.3%) | 82 (2.0%) |
| 85 Years and over | 48 (1.0%) | 75 (1.8%) |
| Total | 4,676 (100.0%) | 4,105 (100.0%) |
Families and Households in Boonton
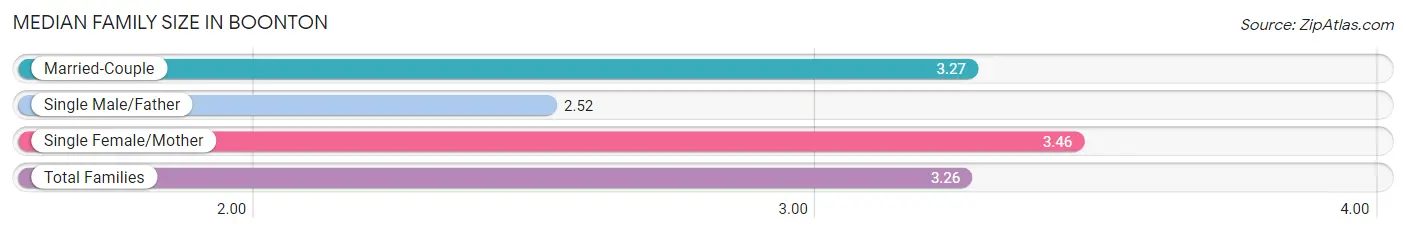
Median Family Size in Boonton
The median family size in Boonton is 3.26 persons per family, with single female/mother families (321 | 14.7%) accounting for the largest median family size of 3.46 persons per family. On the other hand, single male/father families (120 | 5.5%) represent the smallest median family size with 2.52 persons per family.
| Family Type | # Families | Family Size |
| Married-Couple | 1,740 (79.8%) | 3.27 |
| Single Male/Father | 120 (5.5%) | 2.52 |
| Single Female/Mother | 321 (14.7%) | 3.46 |
| Total Families | 2,181 (100.0%) | 3.26 |
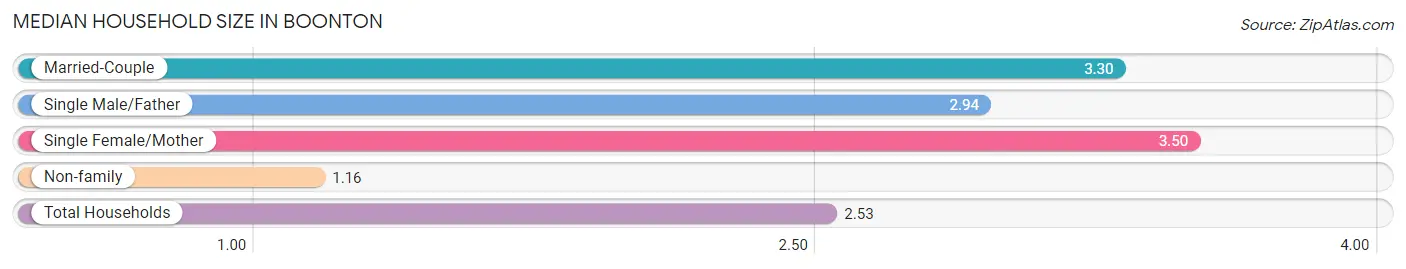
Median Household Size in Boonton
The median household size in Boonton is 2.53 persons per household, with single female/mother households (321 | 9.4%) accounting for the largest median household size of 3.5 persons per household. non-family households (1,233 | 36.1%) represent the smallest median household size with 1.16 persons per household.
| Household Type | # Households | Household Size |
| Married-Couple | 1,740 (51.0%) | 3.30 |
| Single Male/Father | 120 (3.5%) | 2.94 |
| Single Female/Mother | 321 (9.4%) | 3.50 |
| Non-family | 1,233 (36.1%) | 1.16 |
| Total Households | 3,414 (100.0%) | 2.53 |
Household Size by Marriage Status in Boonton
Out of a total of 3,414 households in Boonton, 2,181 (63.9%) are family households, while 1,233 (36.1%) are nonfamily households. The most numerous type of family households are 3-person households, comprising 782, and the most common type of nonfamily households are 1-person households, comprising 1,082.
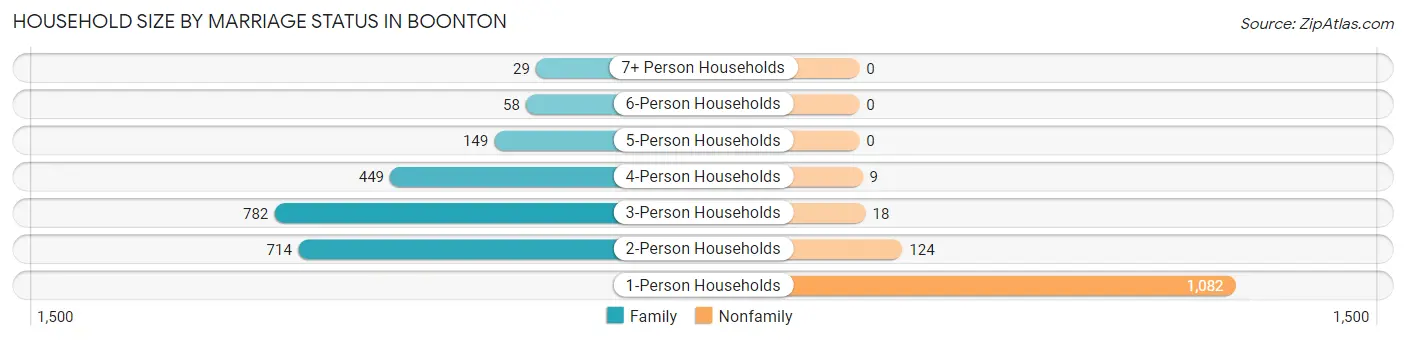
| Household Size | Family Households | Nonfamily Households |
| 1-Person Households | - | 1,082 (31.7%) |
| 2-Person Households | 714 (20.9%) | 124 (3.6%) |
| 3-Person Households | 782 (22.9%) | 18 (0.5%) |
| 4-Person Households | 449 (13.2%) | 9 (0.3%) |
| 5-Person Households | 149 (4.4%) | 0 (0.0%) |
| 6-Person Households | 58 (1.7%) | 0 (0.0%) |
| 7+ Person Households | 29 (0.9%) | 0 (0.0%) |
| Total | 2,181 (63.9%) | 1,233 (36.1%) |
Female Fertility in Boonton
Fertility by Age in Boonton
Average fertility rate in Boonton is 43.0 births per 1,000 women. Women in the age bracket of 20 to 34 years have the highest fertility rate with 87.0 births per 1,000 women. Women in the age bracket of 20 to 34 years acount for 68.7% of all women with births.
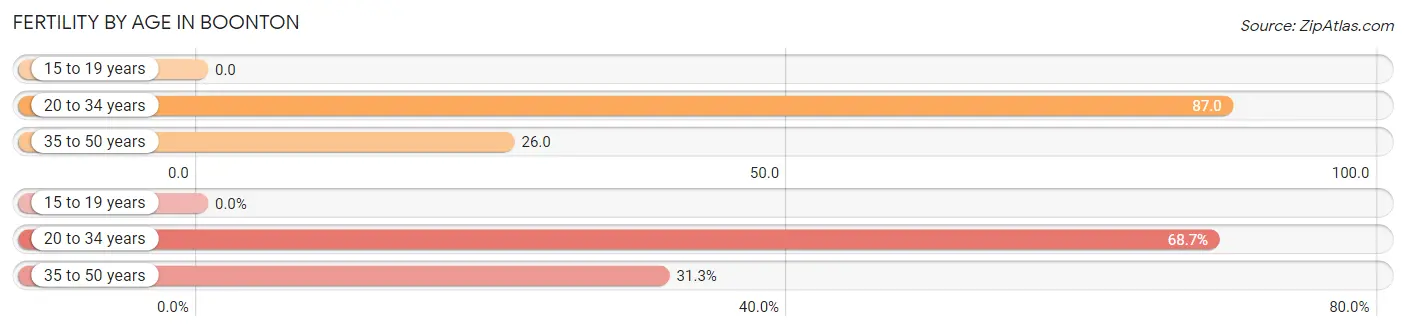
| Age Bracket | Women with Births | Births / 1,000 Women |
| 15 to 19 years | 0 (0.0%) | 0.0 |
| 20 to 34 years | 57 (68.7%) | 87.0 |
| 35 to 50 years | 26 (31.3%) | 26.0 |
| Total | 83 (100.0%) | 43.0 |
Fertility by Age by Marriage Status in Boonton
85.5% of women with births (83) in Boonton are married. The highest percentage of unmarried women with births falls into 20 to 34 years age bracket with 21.0% of them unmarried at the time of birth, while the lowest percentage of unmarried women with births belong to 35 to 50 years age bracket with 0.0% of them unmarried.
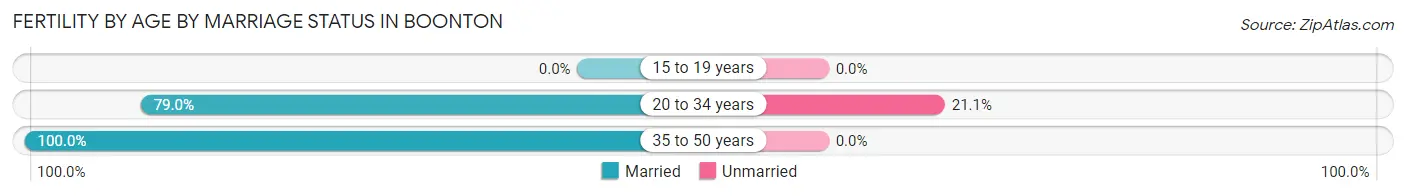
| Age Bracket | Married | Unmarried |
| 15 to 19 years | 0 (0.0%) | 0 (0.0%) |
| 20 to 34 years | 45 (78.9%) | 12 (21.0%) |
| 35 to 50 years | 26 (100.0%) | 0 (0.0%) |
| Total | 71 (85.5%) | 12 (14.5%) |
Fertility by Education in Boonton
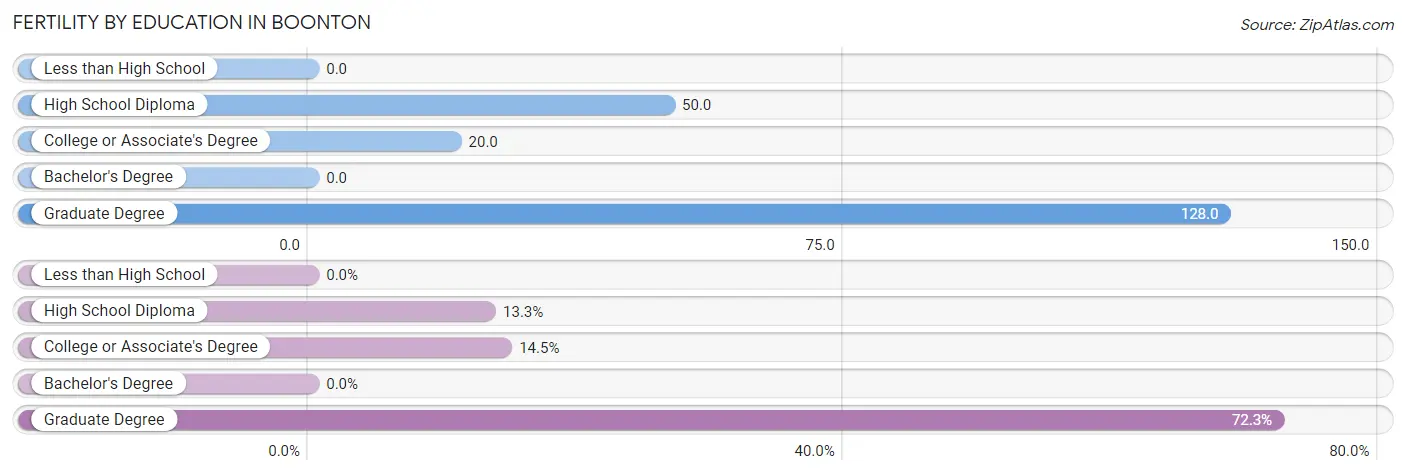
| Educational Attainment | Women with Births | Births / 1,000 Women |
| Less than High School | 0 (0.0%) | 0.0 |
| High School Diploma | 11 (13.3%) | 50.0 |
| College or Associate's Degree | 12 (14.5%) | 20.0 |
| Bachelor's Degree | 0 (0.0%) | 0.0 |
| Graduate Degree | 60 (72.3%) | 128.0 |
| Total | 83 (100.0%) | 43.0 |
Fertility by Education by Marriage Status in Boonton
14.5% of women with births in Boonton are unmarried. Women with the educational attainment of high school diploma are most likely to be married with 100.0% of them married at childbirth, while women with the educational attainment of college or associate's degree are least likely to be married with 100.0% of them unmarried at childbirth.
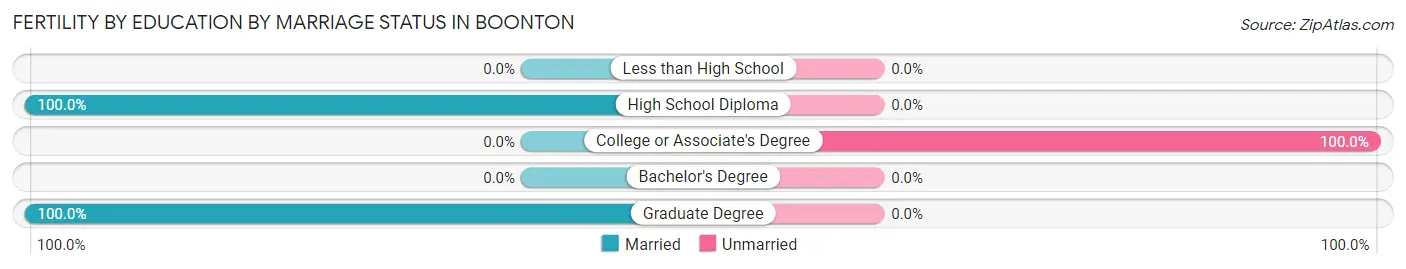
| Educational Attainment | Married | Unmarried |
| Less than High School | 0 (0.0%) | 0 (0.0%) |
| High School Diploma | 11 (100.0%) | 0 (0.0%) |
| College or Associate's Degree | 0 (0.0%) | 12 (100.0%) |
| Bachelor's Degree | 0 (0.0%) | 0 (0.0%) |
| Graduate Degree | 60 (100.0%) | 0 (0.0%) |
| Total | 71 (85.5%) | 12 (14.5%) |
Employment Characteristics in Boonton
Employment by Class of Employer in Boonton
Among the 4,713 employed individuals in Boonton, private company employees (3,368 | 71.5%), local government employees (479 | 10.2%), and self-employed (incorporated) (275 | 5.8%) make up the most common classes of employment.
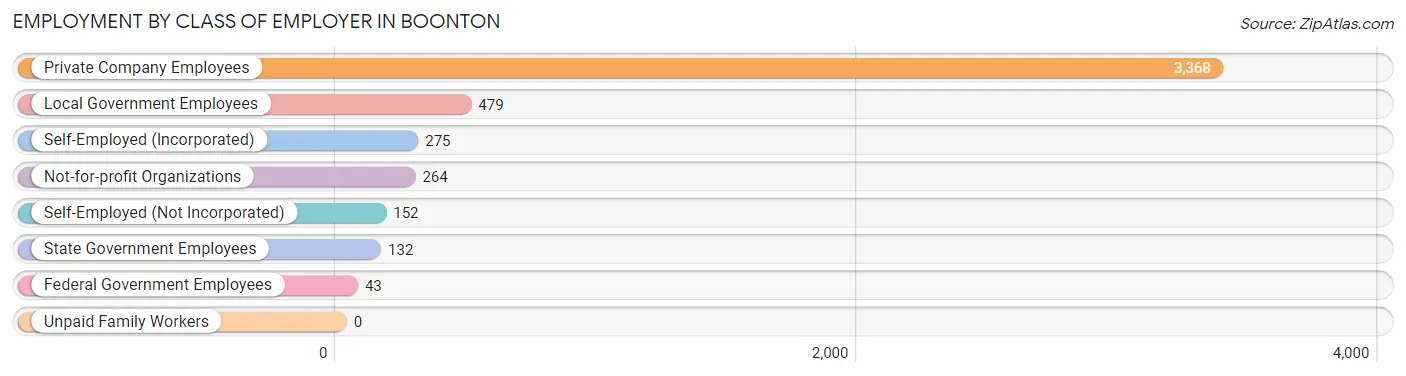
| Employer Class | # Employees | % Employees |
| Private Company Employees | 3,368 | 71.5% |
| Self-Employed (Incorporated) | 275 | 5.8% |
| Self-Employed (Not Incorporated) | 152 | 3.2% |
| Not-for-profit Organizations | 264 | 5.6% |
| Local Government Employees | 479 | 10.2% |
| State Government Employees | 132 | 2.8% |
| Federal Government Employees | 43 | 0.9% |
| Unpaid Family Workers | 0 | 0.0% |
| Total | 4,713 | 100.0% |
Employment Status by Age in Boonton
According to the labor force statistics for Boonton, out of the total population over 16 years of age (7,082), 71.2% or 5,042 individuals are in the labor force, with 3.9% or 197 of them unemployed. The age group with the highest labor force participation rate is 45 to 54 years, with 90.1% or 1,206 individuals in the labor force. Within the labor force, the 75 years and over age range has the highest percentage of unemployed individuals, with 41.4% or 29 of them being unemployed.
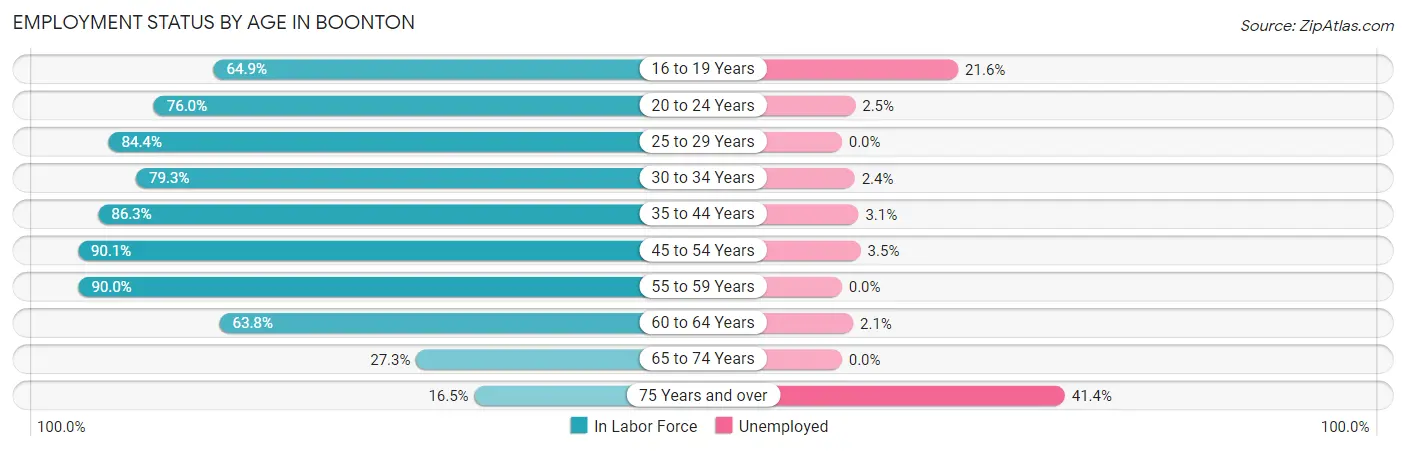
| Age Bracket | In Labor Force | Unemployed |
| 16 to 19 Years | 264 (64.9%) | 57 (21.6%) |
| 20 to 24 Years | 471 (76.0%) | 12 (2.5%) |
| 25 to 29 Years | 168 (84.4%) | 0 (0.0%) |
| 30 to 34 Years | 615 (79.3%) | 15 (2.4%) |
| 35 to 44 Years | 1,152 (86.3%) | 36 (3.1%) |
| 45 to 54 Years | 1,206 (90.1%) | 42 (3.5%) |
| 55 to 59 Years | 488 (90.0%) | 0 (0.0%) |
| 60 to 64 Years | 382 (63.8%) | 8 (2.1%) |
| 65 to 74 Years | 229 (27.3%) | 0 (0.0%) |
| 75 Years and over | 70 (16.5%) | 29 (41.4%) |
| Total | 5,042 (71.2%) | 197 (3.9%) |
Employment Status by Educational Attainment in Boonton
According to labor force statistics for Boonton, 83.7% of individuals (4,009) out of the total population between 25 and 64 years of age (4,790) are in the labor force, with 2.5% or 100 of them being unemployed. The group with the highest labor force participation rate are those with the educational attainment of college / associate degree, with 92.3% or 965 individuals in the labor force. Within the labor force, individuals with less than high school education have the highest percentage of unemployment, with 12.4% or 14 of them being unemployed.
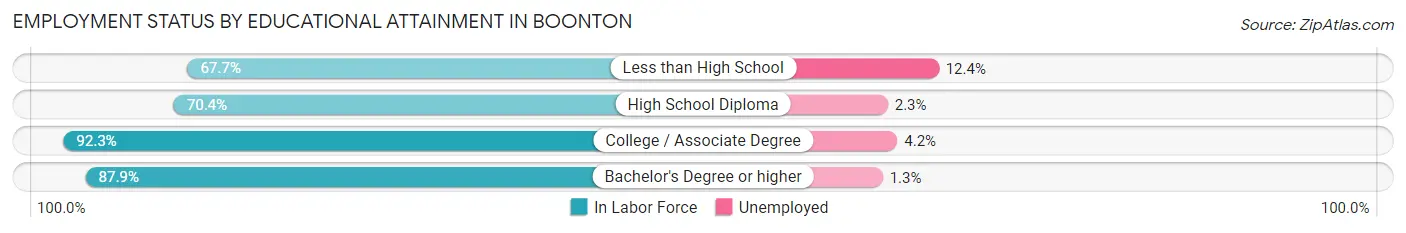
| Educational Attainment | In Labor Force | Unemployed |
| Less than High School | 113 (67.7%) | 21 (12.4%) |
| High School Diploma | 857 (70.4%) | 28 (2.3%) |
| College / Associate Degree | 965 (92.3%) | 44 (4.2%) |
| Bachelor's Degree or higher | 2,074 (87.9%) | 31 (1.3%) |
| Total | 4,009 (83.7%) | 120 (2.5%) |
Employment Occupations by Sex in Boonton
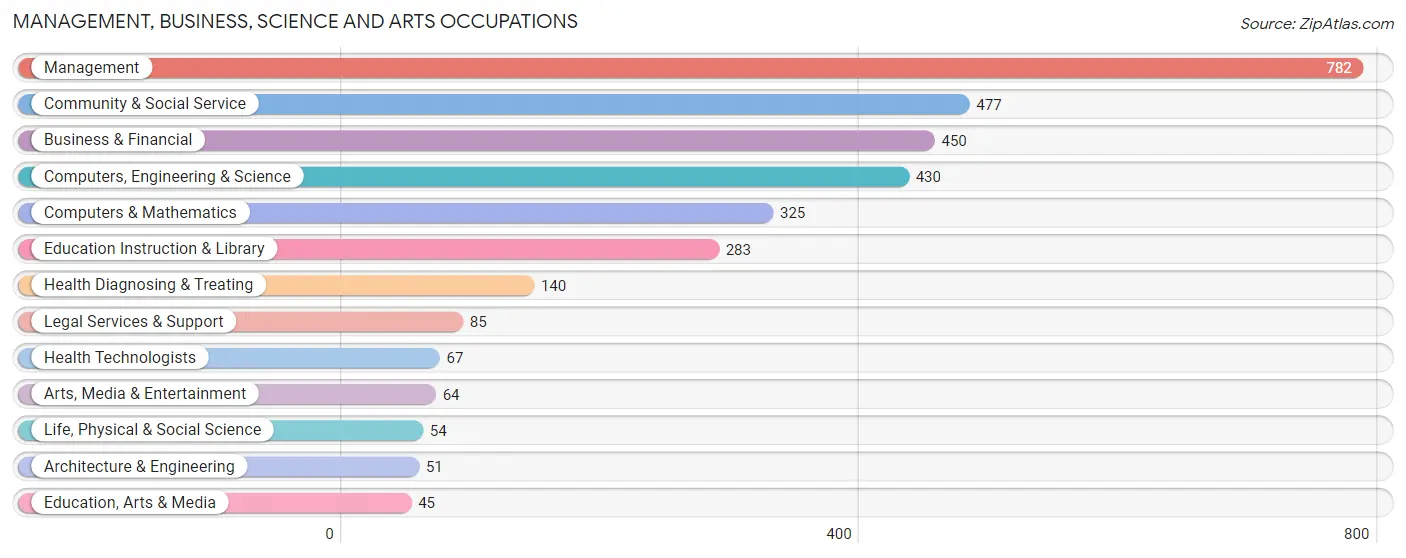
Management, Business, Science and Arts Occupations
The most common Management, Business, Science and Arts occupations in Boonton are Management (782 | 16.1%), Community & Social Service (477 | 9.8%), Business & Financial (450 | 9.3%), Computers, Engineering & Science (430 | 8.9%), and Computers & Mathematics (325 | 6.7%).
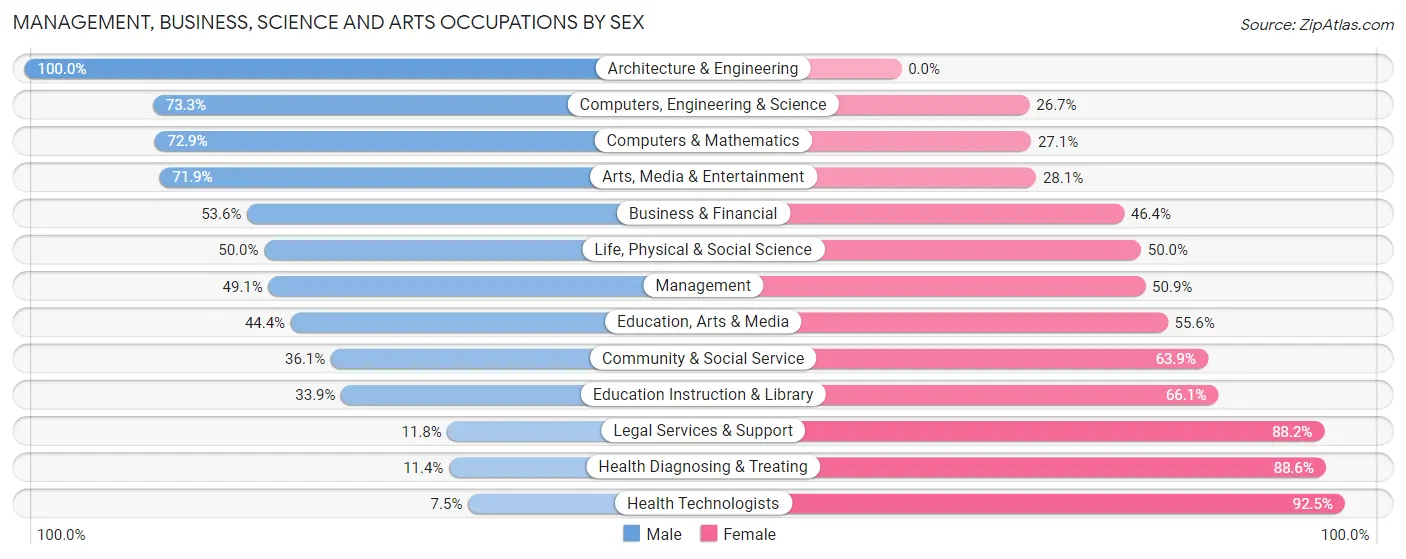
Management, Business, Science and Arts Occupations by Sex
Within the Management, Business, Science and Arts occupations in Boonton, the most male-oriented occupations are Architecture & Engineering (100.0%), Computers, Engineering & Science (73.3%), and Computers & Mathematics (72.9%), while the most female-oriented occupations are Health Technologists (92.5%), Health Diagnosing & Treating (88.6%), and Legal Services & Support (88.2%).
| Occupation | Male | Female |
| Management | 384 (49.1%) | 398 (50.9%) |
| Business & Financial | 241 (53.6%) | 209 (46.4%) |
| Computers, Engineering & Science | 315 (73.3%) | 115 (26.7%) |
| Computers & Mathematics | 237 (72.9%) | 88 (27.1%) |
| Architecture & Engineering | 51 (100.0%) | 0 (0.0%) |
| Life, Physical & Social Science | 27 (50.0%) | 27 (50.0%) |
| Community & Social Service | 172 (36.1%) | 305 (63.9%) |
| Education, Arts & Media | 20 (44.4%) | 25 (55.6%) |
| Legal Services & Support | 10 (11.8%) | 75 (88.2%) |
| Education Instruction & Library | 96 (33.9%) | 187 (66.1%) |
| Arts, Media & Entertainment | 46 (71.9%) | 18 (28.1%) |
| Health Diagnosing & Treating | 16 (11.4%) | 124 (88.6%) |
| Health Technologists | 5 (7.5%) | 62 (92.5%) |
| Total (Category) | 1,128 (49.5%) | 1,151 (50.5%) |
| Total (Overall) | 2,413 (49.8%) | 2,433 (50.2%) |
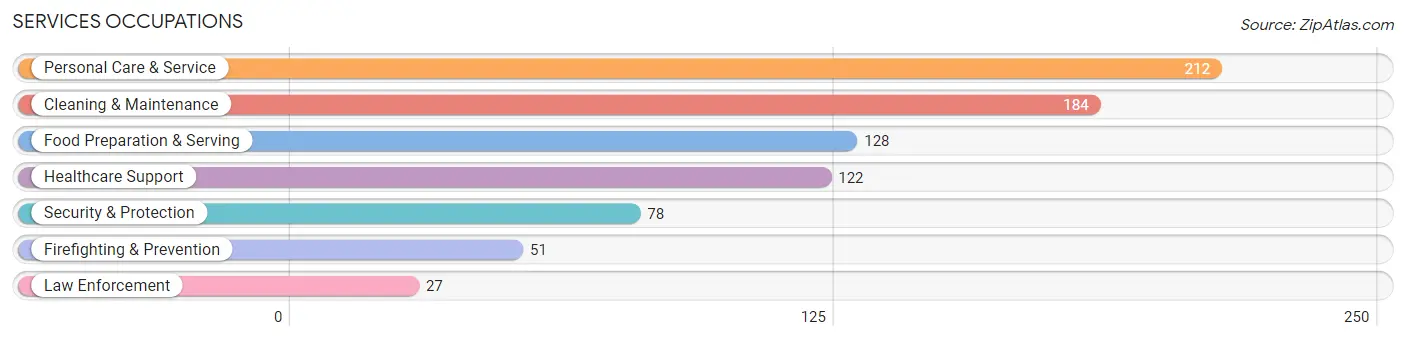
Services Occupations
The most common Services occupations in Boonton are Personal Care & Service (212 | 4.4%), Cleaning & Maintenance (184 | 3.8%), Food Preparation & Serving (128 | 2.6%), Healthcare Support (122 | 2.5%), and Security & Protection (78 | 1.6%).
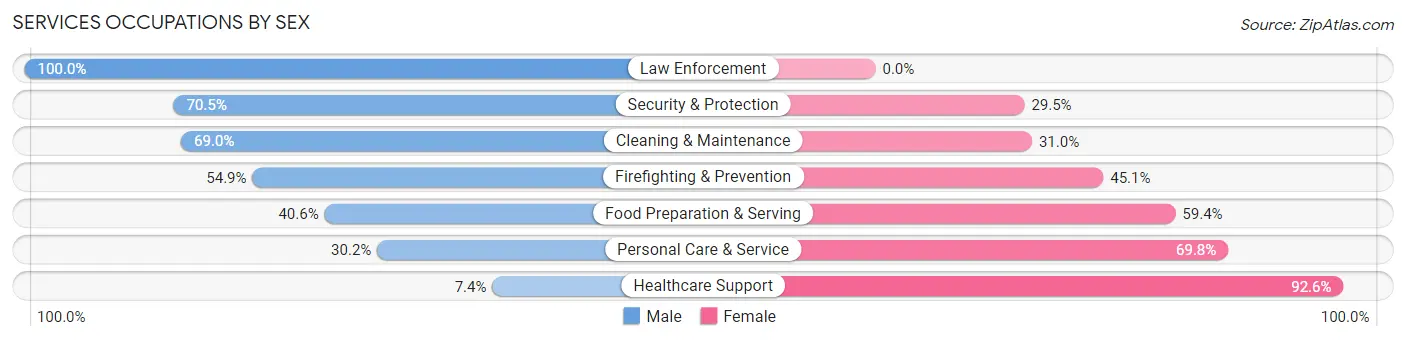
Services Occupations by Sex
Within the Services occupations in Boonton, the most male-oriented occupations are Law Enforcement (100.0%), Security & Protection (70.5%), and Cleaning & Maintenance (69.0%), while the most female-oriented occupations are Healthcare Support (92.6%), Personal Care & Service (69.8%), and Food Preparation & Serving (59.4%).
| Occupation | Male | Female |
| Healthcare Support | 9 (7.4%) | 113 (92.6%) |
| Security & Protection | 55 (70.5%) | 23 (29.5%) |
| Firefighting & Prevention | 28 (54.9%) | 23 (45.1%) |
| Law Enforcement | 27 (100.0%) | 0 (0.0%) |
| Food Preparation & Serving | 52 (40.6%) | 76 (59.4%) |
| Cleaning & Maintenance | 127 (69.0%) | 57 (31.0%) |
| Personal Care & Service | 64 (30.2%) | 148 (69.8%) |
| Total (Category) | 307 (42.4%) | 417 (57.6%) |
| Total (Overall) | 2,413 (49.8%) | 2,433 (50.2%) |
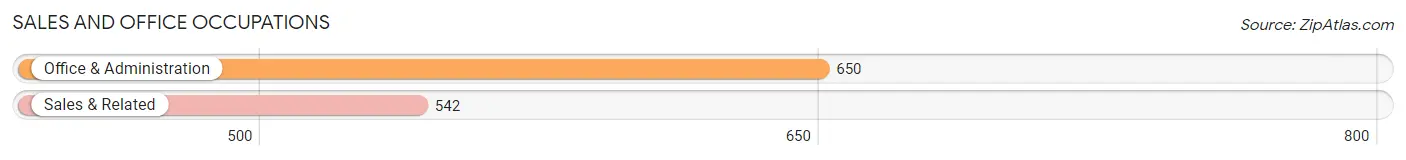
Sales and Office Occupations
The most common Sales and Office occupations in Boonton are Office & Administration (650 | 13.4%), and Sales & Related (542 | 11.2%).
Sales and Office Occupations by Sex
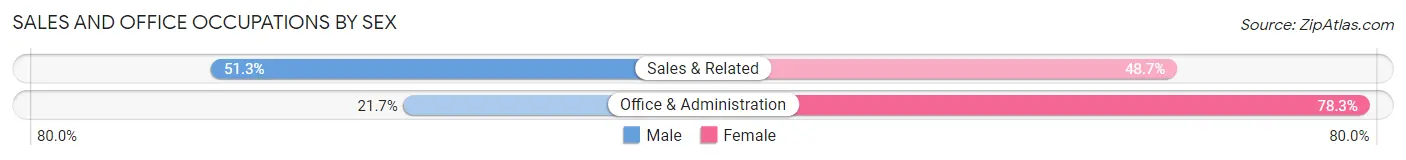
| Occupation | Male | Female |
| Sales & Related | 278 (51.3%) | 264 (48.7%) |
| Office & Administration | 141 (21.7%) | 509 (78.3%) |
| Total (Category) | 419 (35.1%) | 773 (64.8%) |
| Total (Overall) | 2,413 (49.8%) | 2,433 (50.2%) |
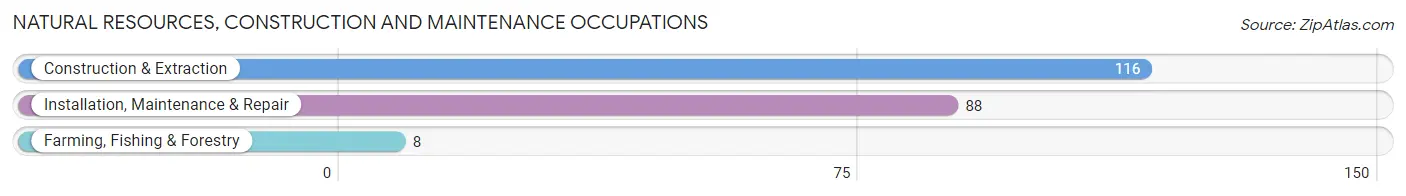
Natural Resources, Construction and Maintenance Occupations
The most common Natural Resources, Construction and Maintenance occupations in Boonton are Construction & Extraction (116 | 2.4%), Installation, Maintenance & Repair (88 | 1.8%), and Farming, Fishing & Forestry (8 | 0.2%).
Natural Resources, Construction and Maintenance Occupations by Sex
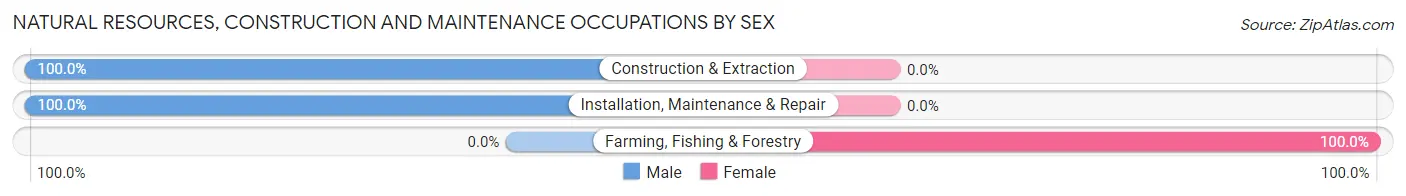
| Occupation | Male | Female |
| Farming, Fishing & Forestry | 0 (0.0%) | 8 (100.0%) |
| Construction & Extraction | 116 (100.0%) | 0 (0.0%) |
| Installation, Maintenance & Repair | 88 (100.0%) | 0 (0.0%) |
| Total (Category) | 204 (96.2%) | 8 (3.8%) |
| Total (Overall) | 2,413 (49.8%) | 2,433 (50.2%) |
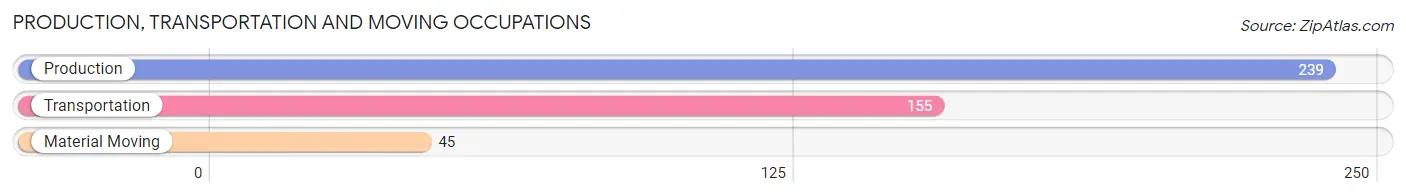
Production, Transportation and Moving Occupations
The most common Production, Transportation and Moving occupations in Boonton are Production (239 | 4.9%), Transportation (155 | 3.2%), and Material Moving (45 | 0.9%).
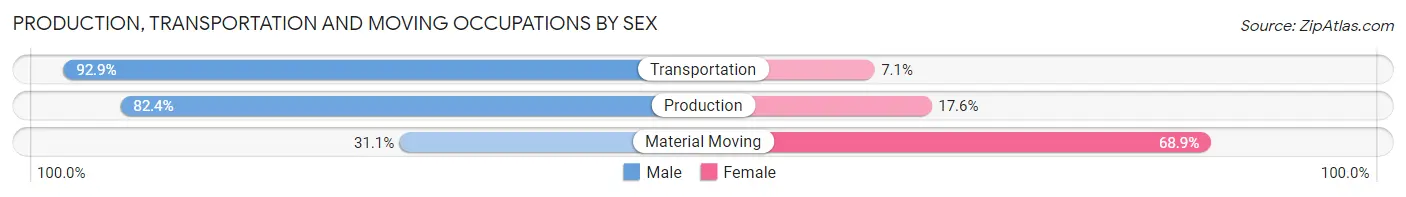
Production, Transportation and Moving Occupations by Sex
| Occupation | Male | Female |
| Production | 197 (82.4%) | 42 (17.6%) |
| Transportation | 144 (92.9%) | 11 (7.1%) |
| Material Moving | 14 (31.1%) | 31 (68.9%) |
| Total (Category) | 355 (80.9%) | 84 (19.1%) |
| Total (Overall) | 2,413 (49.8%) | 2,433 (50.2%) |
Employment Industries by Sex in Boonton
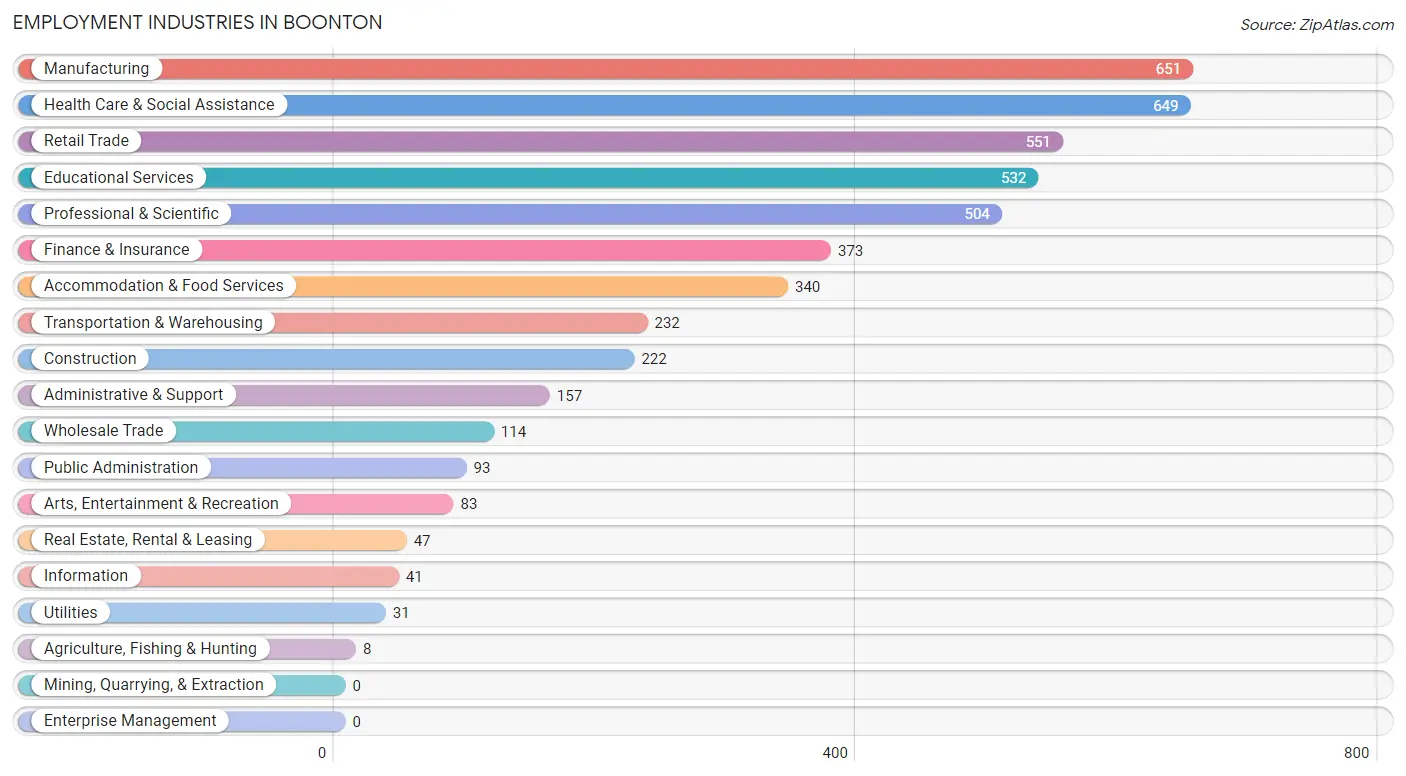
Employment Industries in Boonton
The major employment industries in Boonton include Manufacturing (651 | 13.4%), Health Care & Social Assistance (649 | 13.4%), Retail Trade (551 | 11.4%), Educational Services (532 | 11.0%), and Professional & Scientific (504 | 10.4%).
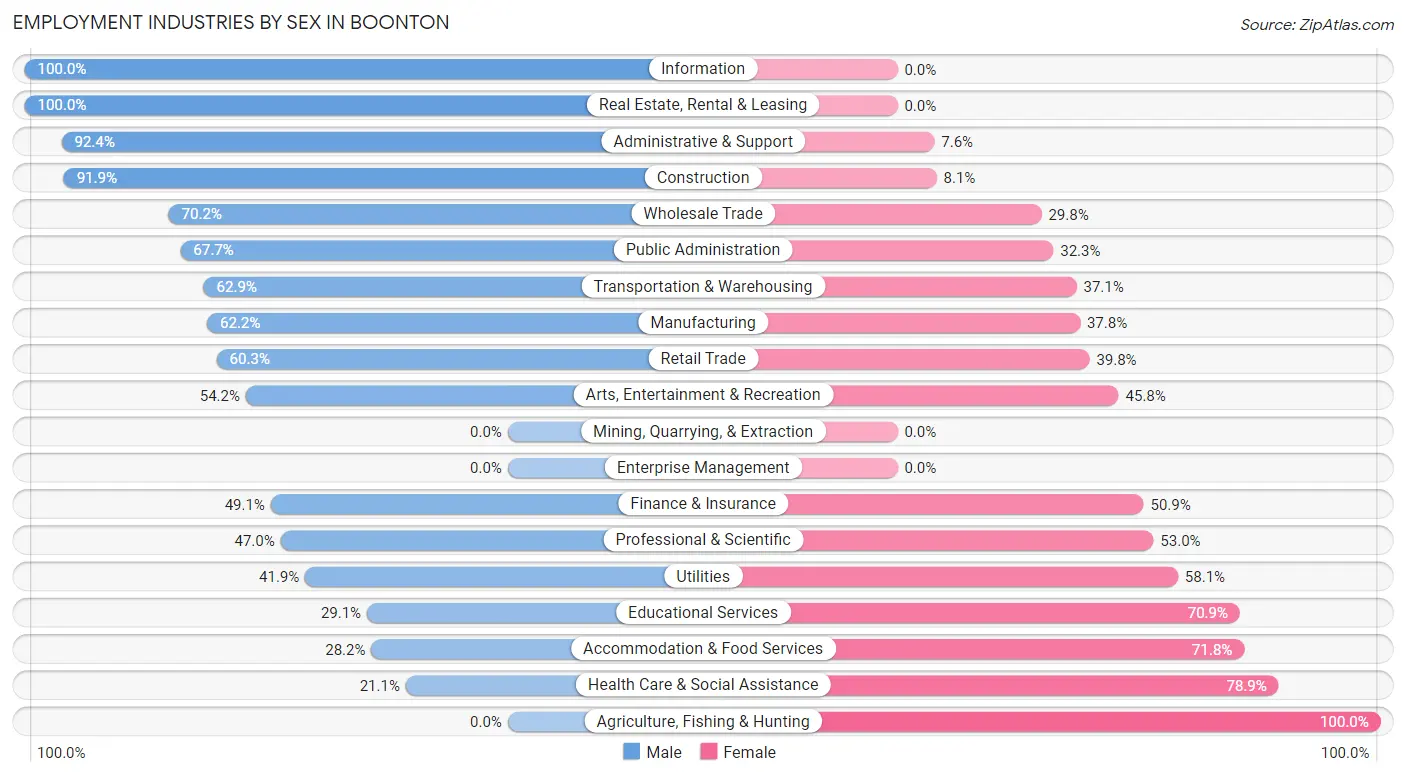
Employment Industries by Sex in Boonton
The Boonton industries that see more men than women are Information (100.0%), Real Estate, Rental & Leasing (100.0%), and Administrative & Support (92.4%), whereas the industries that tend to have a higher number of women are Agriculture, Fishing & Hunting (100.0%), Health Care & Social Assistance (78.9%), and Accommodation & Food Services (71.8%).
| Industry | Male | Female |
| Agriculture, Fishing & Hunting | 0 (0.0%) | 8 (100.0%) |
| Mining, Quarrying, & Extraction | 0 (0.0%) | 0 (0.0%) |
| Construction | 204 (91.9%) | 18 (8.1%) |
| Manufacturing | 405 (62.2%) | 246 (37.8%) |
| Wholesale Trade | 80 (70.2%) | 34 (29.8%) |
| Retail Trade | 332 (60.3%) | 219 (39.8%) |
| Transportation & Warehousing | 146 (62.9%) | 86 (37.1%) |
| Utilities | 13 (41.9%) | 18 (58.1%) |
| Information | 41 (100.0%) | 0 (0.0%) |
| Finance & Insurance | 183 (49.1%) | 190 (50.9%) |
| Real Estate, Rental & Leasing | 47 (100.0%) | 0 (0.0%) |
| Professional & Scientific | 237 (47.0%) | 267 (53.0%) |
| Enterprise Management | 0 (0.0%) | 0 (0.0%) |
| Administrative & Support | 145 (92.4%) | 12 (7.6%) |
| Educational Services | 155 (29.1%) | 377 (70.9%) |
| Health Care & Social Assistance | 137 (21.1%) | 512 (78.9%) |
| Arts, Entertainment & Recreation | 45 (54.2%) | 38 (45.8%) |
| Accommodation & Food Services | 96 (28.2%) | 244 (71.8%) |
| Public Administration | 63 (67.7%) | 30 (32.3%) |
| Total | 2,413 (49.8%) | 2,433 (50.2%) |
Education in Boonton
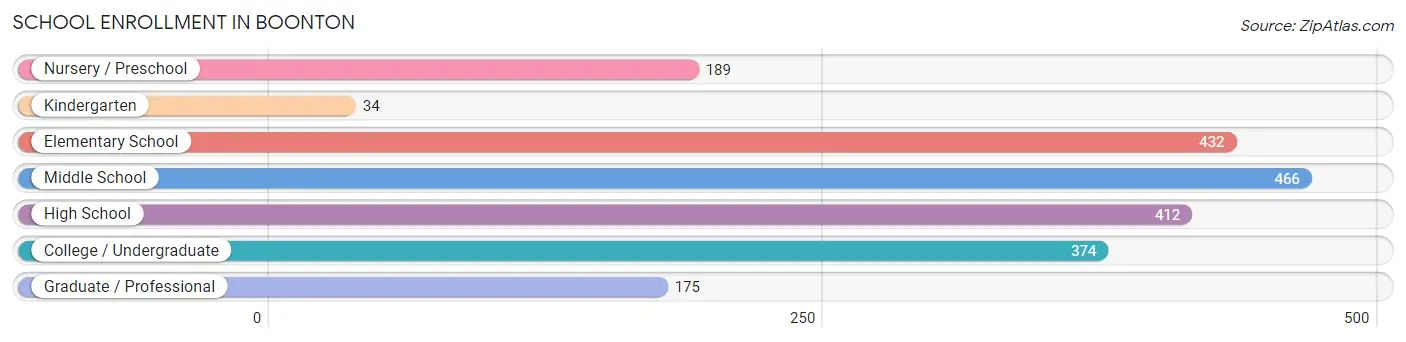
School Enrollment in Boonton
The most common levels of schooling among the 2,082 students in Boonton are middle school (466 | 22.4%), elementary school (432 | 20.7%), and high school (412 | 19.8%).
| School Level | # Students | % Students |
| Nursery / Preschool | 189 | 9.1% |
| Kindergarten | 34 | 1.6% |
| Elementary School | 432 | 20.7% |
| Middle School | 466 | 22.4% |
| High School | 412 | 19.8% |
| College / Undergraduate | 374 | 18.0% |
| Graduate / Professional | 175 | 8.4% |
| Total | 2,082 | 100.0% |
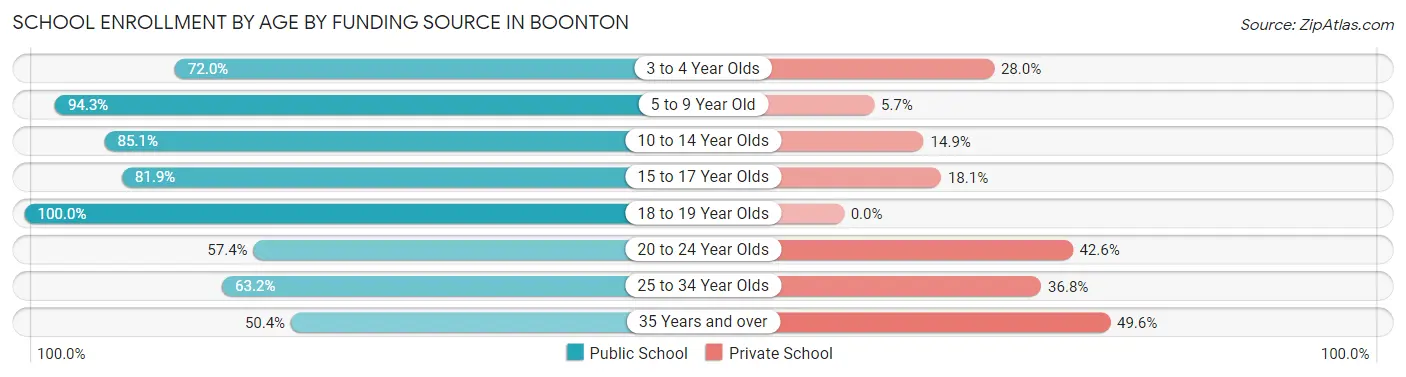
School Enrollment by Age by Funding Source in Boonton
Out of a total of 2,082 students who are enrolled in schools in Boonton, 398 (19.1%) attend a private institution, while the remaining 1,684 (80.9%) are enrolled in public schools. The age group of 35 years and over has the highest likelihood of being enrolled in private schools, with 63 (49.6% in the age bracket) enrolled. Conversely, the age group of 18 to 19 year olds has the lowest likelihood of being enrolled in a private school, with 133 (100.0% in the age bracket) attending a public institution.
| Age Bracket | Public School | Private School |
| 3 to 4 Year Olds | 90 (72.0%) | 35 (28.0%) |
| 5 to 9 Year Old | 500 (94.3%) | 30 (5.7%) |
| 10 to 14 Year Olds | 417 (85.1%) | 73 (14.9%) |
| 15 to 17 Year Olds | 289 (81.9%) | 64 (18.1%) |
| 18 to 19 Year Olds | 133 (100.0%) | 0 (0.0%) |
| 20 to 24 Year Olds | 136 (57.4%) | 101 (42.6%) |
| 25 to 34 Year Olds | 55 (63.2%) | 32 (36.8%) |
| 35 Years and over | 64 (50.4%) | 63 (49.6%) |
| Total | 1,684 (80.9%) | 398 (19.1%) |
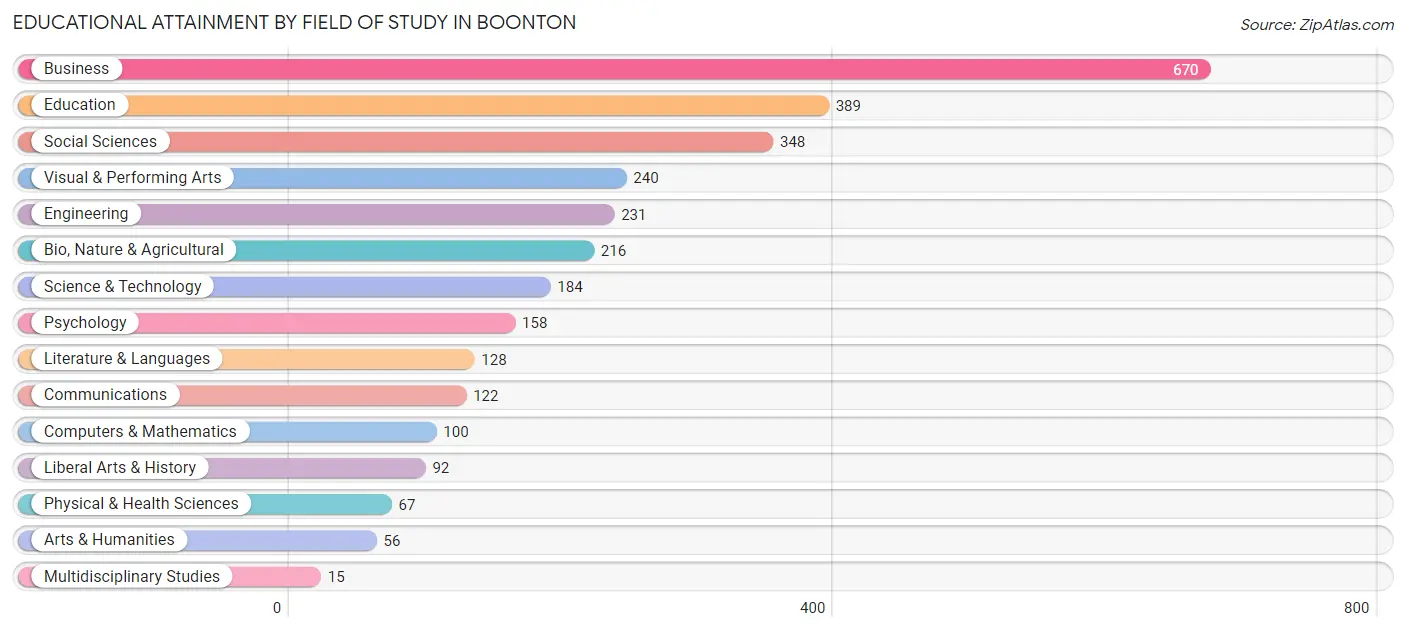
Educational Attainment by Field of Study in Boonton
Business (670 | 22.2%), education (389 | 12.9%), social sciences (348 | 11.5%), visual & performing arts (240 | 8.0%), and engineering (231 | 7.7%) are the most common fields of study among 3,016 individuals in Boonton who have obtained a bachelor's degree or higher.
| Field of Study | # Graduates | % Graduates |
| Computers & Mathematics | 100 | 3.3% |
| Bio, Nature & Agricultural | 216 | 7.2% |
| Physical & Health Sciences | 67 | 2.2% |
| Psychology | 158 | 5.2% |
| Social Sciences | 348 | 11.5% |
| Engineering | 231 | 7.7% |
| Multidisciplinary Studies | 15 | 0.5% |
| Science & Technology | 184 | 6.1% |
| Business | 670 | 22.2% |
| Education | 389 | 12.9% |
| Literature & Languages | 128 | 4.2% |
| Liberal Arts & History | 92 | 3.0% |
| Visual & Performing Arts | 240 | 8.0% |
| Communications | 122 | 4.1% |
| Arts & Humanities | 56 | 1.9% |
| Total | 3,016 | 100.0% |
Transportation & Commute in Boonton
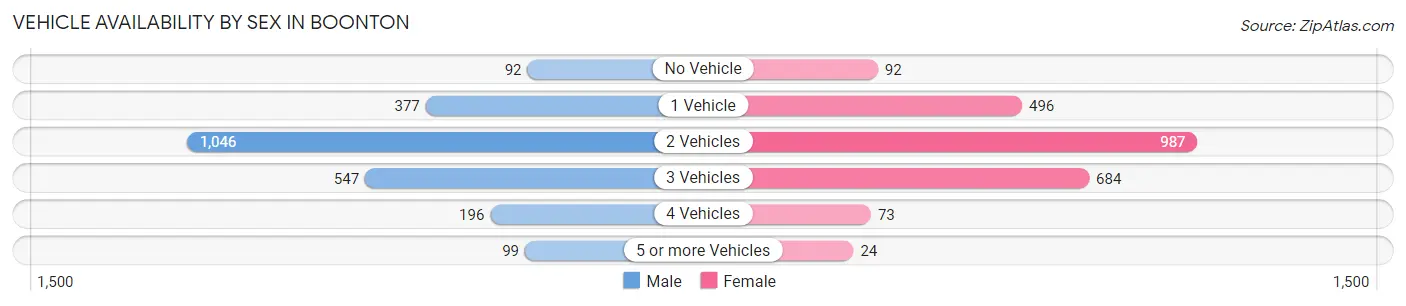
Vehicle Availability by Sex in Boonton
The most prevalent vehicle ownership categories in Boonton are males with 2 vehicles (1,046, accounting for 44.4%) and females with 2 vehicles (987, making up 44.4%).
| Vehicles Available | Male | Female |
| No Vehicle | 92 (3.9%) | 92 (3.9%) |
| 1 Vehicle | 377 (16.0%) | 496 (21.0%) |
| 2 Vehicles | 1,046 (44.4%) | 987 (41.9%) |
| 3 Vehicles | 547 (23.2%) | 684 (29.0%) |
| 4 Vehicles | 196 (8.3%) | 73 (3.1%) |
| 5 or more Vehicles | 99 (4.2%) | 24 (1.0%) |
| Total | 2,357 (100.0%) | 2,356 (100.0%) |
Commute Time in Boonton
The most frequently occuring commute durations in Boonton are 15 to 19 minutes (944 commuters, 23.2%), 20 to 24 minutes (659 commuters, 16.2%), and 10 to 14 minutes (591 commuters, 14.5%).
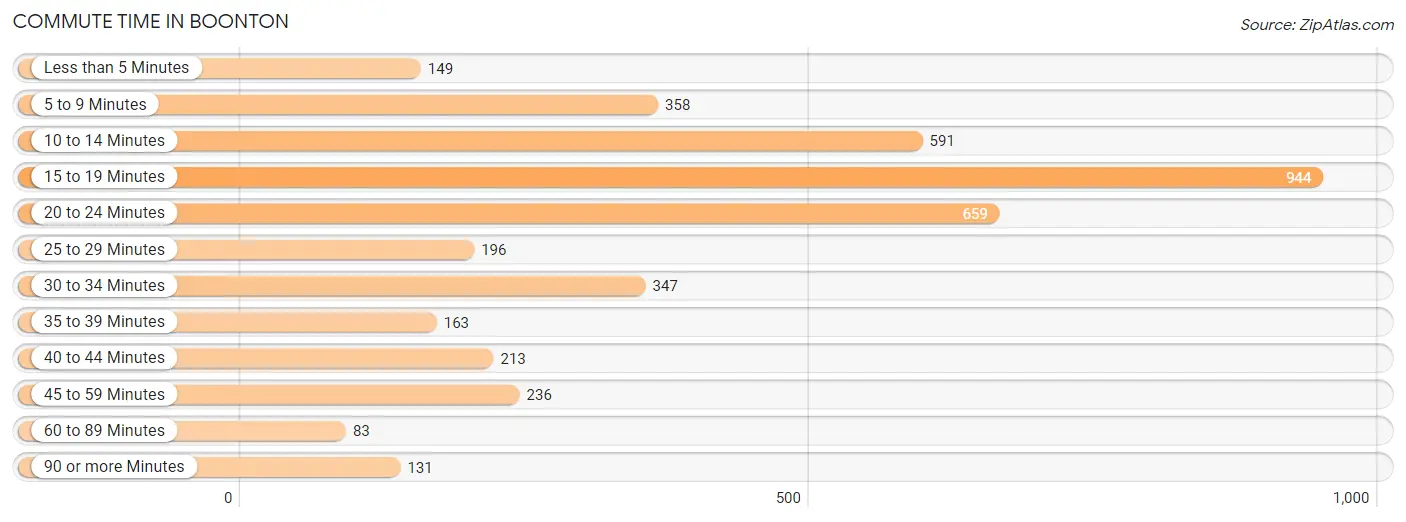
| Commute Time | # Commuters | % Commuters |
| Less than 5 Minutes | 149 | 3.7% |
| 5 to 9 Minutes | 358 | 8.8% |
| 10 to 14 Minutes | 591 | 14.5% |
| 15 to 19 Minutes | 944 | 23.2% |
| 20 to 24 Minutes | 659 | 16.2% |
| 25 to 29 Minutes | 196 | 4.8% |
| 30 to 34 Minutes | 347 | 8.5% |
| 35 to 39 Minutes | 163 | 4.0% |
| 40 to 44 Minutes | 213 | 5.2% |
| 45 to 59 Minutes | 236 | 5.8% |
| 60 to 89 Minutes | 83 | 2.0% |
| 90 or more Minutes | 131 | 3.2% |
Commute Time by Sex in Boonton
The most common commute times in Boonton are 15 to 19 minutes (467 commuters, 22.8%) for males and 15 to 19 minutes (477 commuters, 23.6%) for females.
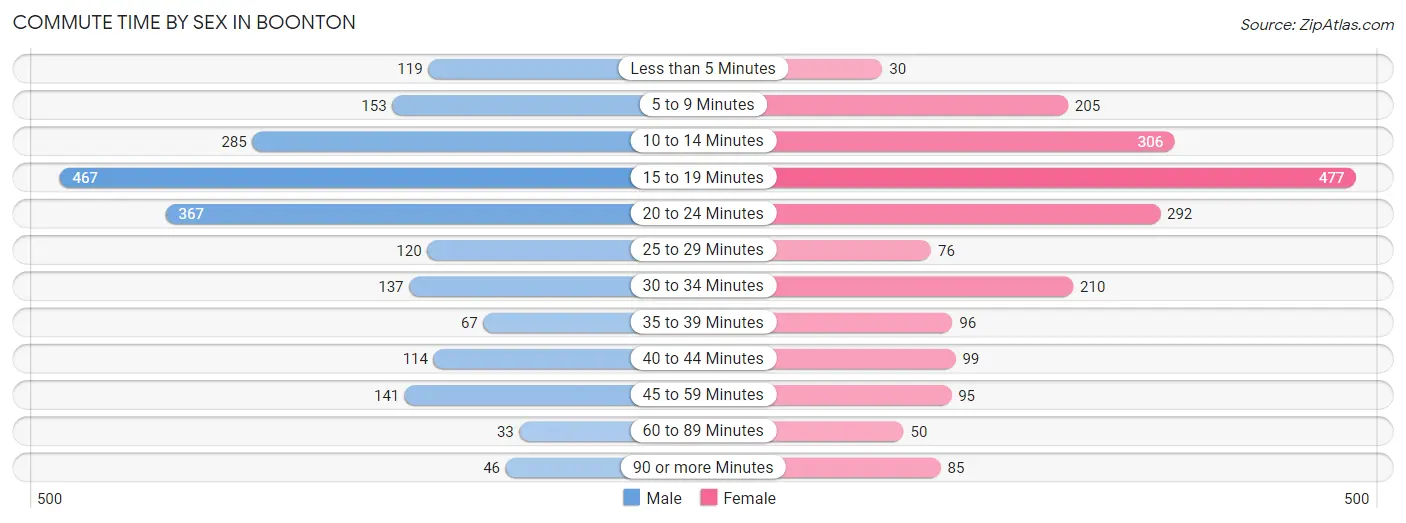
| Commute Time | Male | Female |
| Less than 5 Minutes | 119 (5.8%) | 30 (1.5%) |
| 5 to 9 Minutes | 153 (7.5%) | 205 (10.1%) |
| 10 to 14 Minutes | 285 (13.9%) | 306 (15.1%) |
| 15 to 19 Minutes | 467 (22.8%) | 477 (23.6%) |
| 20 to 24 Minutes | 367 (17.9%) | 292 (14.4%) |
| 25 to 29 Minutes | 120 (5.9%) | 76 (3.8%) |
| 30 to 34 Minutes | 137 (6.7%) | 210 (10.4%) |
| 35 to 39 Minutes | 67 (3.3%) | 96 (4.8%) |
| 40 to 44 Minutes | 114 (5.6%) | 99 (4.9%) |
| 45 to 59 Minutes | 141 (6.9%) | 95 (4.7%) |
| 60 to 89 Minutes | 33 (1.6%) | 50 (2.5%) |
| 90 or more Minutes | 46 (2.2%) | 85 (4.2%) |
Time of Departure to Work by Sex in Boonton
The most frequent times of departure to work in Boonton are 7:00 AM to 7:29 AM (290, 14.1%) for males and 7:00 AM to 7:29 AM (507, 25.1%) for females.
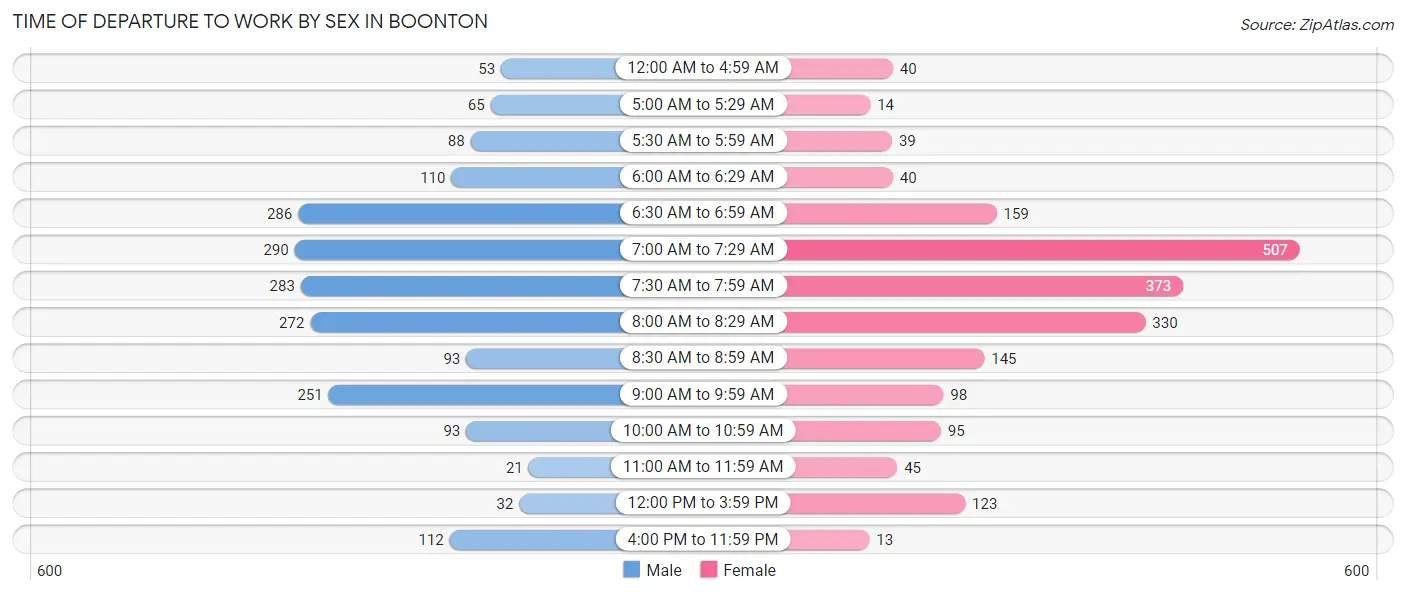
| Time of Departure | Male | Female |
| 12:00 AM to 4:59 AM | 53 (2.6%) | 40 (2.0%) |
| 5:00 AM to 5:29 AM | 65 (3.2%) | 14 (0.7%) |
| 5:30 AM to 5:59 AM | 88 (4.3%) | 39 (1.9%) |
| 6:00 AM to 6:29 AM | 110 (5.4%) | 40 (2.0%) |
| 6:30 AM to 6:59 AM | 286 (14.0%) | 159 (7.9%) |
| 7:00 AM to 7:29 AM | 290 (14.1%) | 507 (25.1%) |
| 7:30 AM to 7:59 AM | 283 (13.8%) | 373 (18.5%) |
| 8:00 AM to 8:29 AM | 272 (13.3%) | 330 (16.3%) |
| 8:30 AM to 8:59 AM | 93 (4.5%) | 145 (7.2%) |
| 9:00 AM to 9:59 AM | 251 (12.2%) | 98 (4.9%) |
| 10:00 AM to 10:59 AM | 93 (4.5%) | 95 (4.7%) |
| 11:00 AM to 11:59 AM | 21 (1.0%) | 45 (2.2%) |
| 12:00 PM to 3:59 PM | 32 (1.6%) | 123 (6.1%) |
| 4:00 PM to 11:59 PM | 112 (5.5%) | 13 (0.6%) |
| Total | 2,049 (100.0%) | 2,021 (100.0%) |
Housing Occupancy in Boonton
Occupancy by Ownership in Boonton
Of the total 3,414 dwellings in Boonton, owner-occupied units account for 1,920 (56.2%), while renter-occupied units make up 1,494 (43.8%).
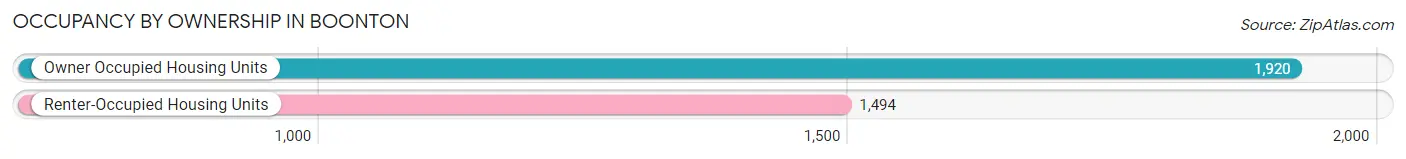
| Occupancy | # Housing Units | % Housing Units |
| Owner Occupied Housing Units | 1,920 | 56.2% |
| Renter-Occupied Housing Units | 1,494 | 43.8% |
| Total Occupied Housing Units | 3,414 | 100.0% |
Occupancy by Household Size in Boonton
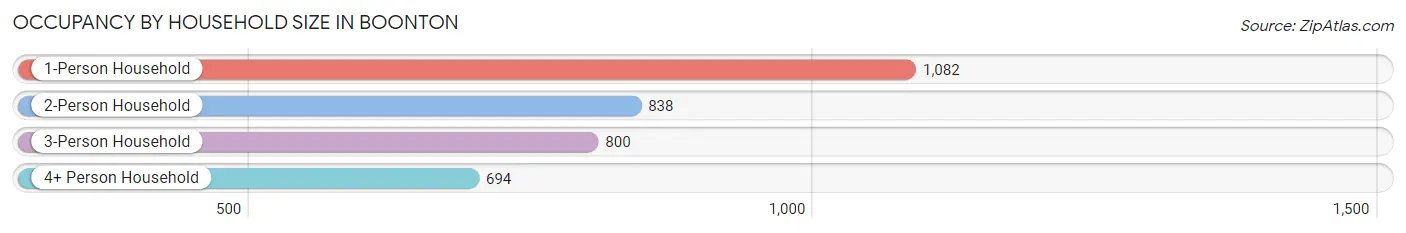
| Household Size | # Housing Units | % Housing Units |
| 1-Person Household | 1,082 | 31.7% |
| 2-Person Household | 838 | 24.5% |
| 3-Person Household | 800 | 23.4% |
| 4+ Person Household | 694 | 20.3% |
| Total Housing Units | 3,414 | 100.0% |
Occupancy by Ownership by Household Size in Boonton
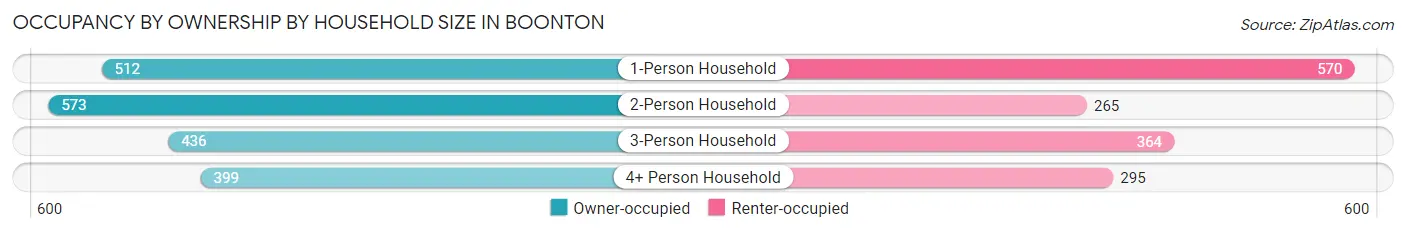
| Household Size | Owner-occupied | Renter-occupied |
| 1-Person Household | 512 (47.3%) | 570 (52.7%) |
| 2-Person Household | 573 (68.4%) | 265 (31.6%) |
| 3-Person Household | 436 (54.5%) | 364 (45.5%) |
| 4+ Person Household | 399 (57.5%) | 295 (42.5%) |
| Total Housing Units | 1,920 (56.2%) | 1,494 (43.8%) |
Occupancy by Educational Attainment in Boonton
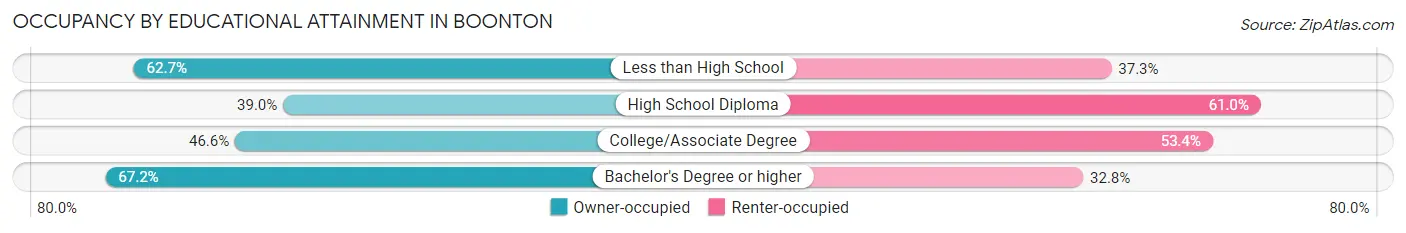
| Household Size | Owner-occupied | Renter-occupied |
| Less than High School | 79 (62.7%) | 47 (37.3%) |
| High School Diploma | 282 (39.0%) | 441 (61.0%) |
| College/Associate Degree | 372 (46.6%) | 426 (53.4%) |
| Bachelor's Degree or higher | 1,187 (67.2%) | 580 (32.8%) |
Occupancy by Age of Householder in Boonton
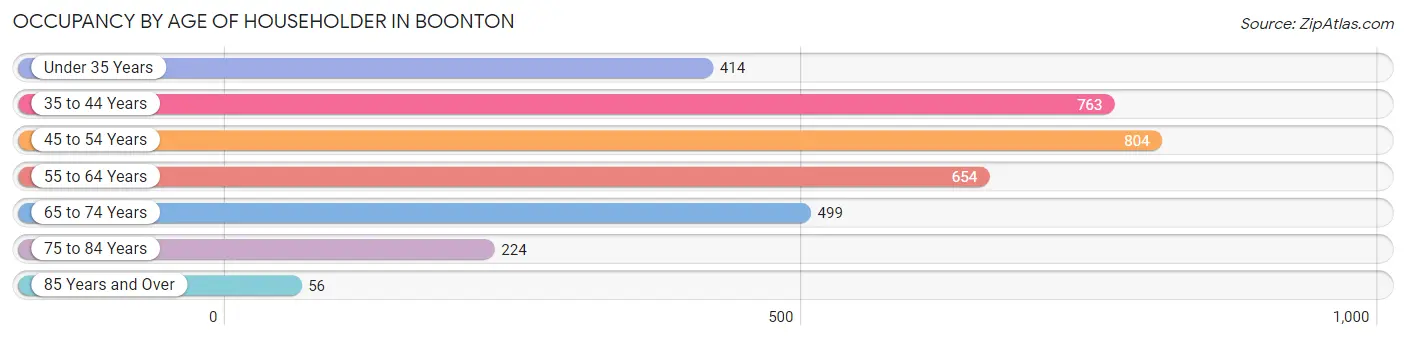
| Age Bracket | # Households | % Households |
| Under 35 Years | 414 | 12.1% |
| 35 to 44 Years | 763 | 22.4% |
| 45 to 54 Years | 804 | 23.5% |
| 55 to 64 Years | 654 | 19.2% |
| 65 to 74 Years | 499 | 14.6% |
| 75 to 84 Years | 224 | 6.6% |
| 85 Years and Over | 56 | 1.6% |
| Total | 3,414 | 100.0% |
Housing Finances in Boonton
Median Income by Occupancy in Boonton
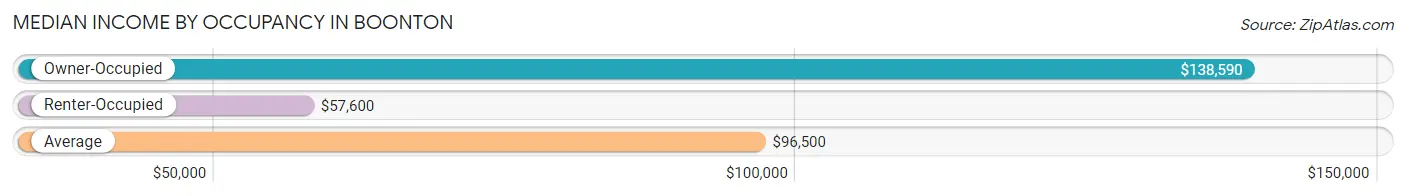
| Occupancy Type | # Households | Median Income |
| Owner-Occupied | 1,920 (56.2%) | $138,590 |
| Renter-Occupied | 1,494 (43.8%) | $57,600 |
| Average | 3,414 (100.0%) | $96,500 |
Occupancy by Householder Income Bracket in Boonton
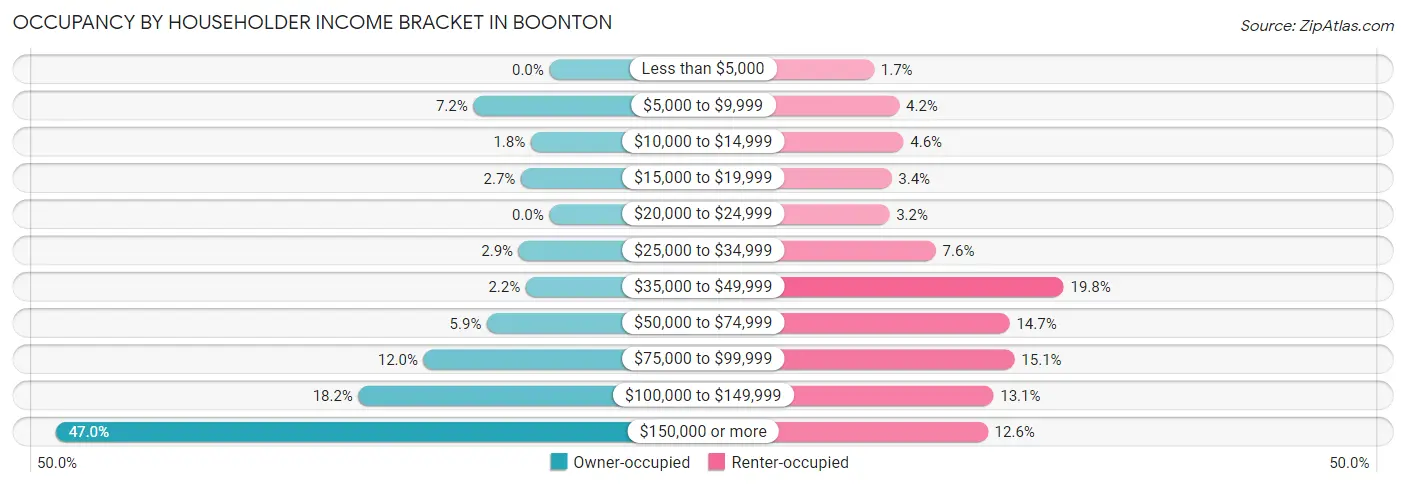
| Income Bracket | Owner-occupied | Renter-occupied |
| Less than $5,000 | 0 (0.0%) | 26 (1.7%) |
| $5,000 to $9,999 | 139 (7.2%) | 62 (4.2%) |
| $10,000 to $14,999 | 34 (1.8%) | 68 (4.5%) |
| $15,000 to $19,999 | 52 (2.7%) | 51 (3.4%) |
| $20,000 to $24,999 | 0 (0.0%) | 48 (3.2%) |
| $25,000 to $34,999 | 56 (2.9%) | 114 (7.6%) |
| $35,000 to $49,999 | 43 (2.2%) | 296 (19.8%) |
| $50,000 to $74,999 | 114 (5.9%) | 219 (14.7%) |
| $75,000 to $99,999 | 230 (12.0%) | 226 (15.1%) |
| $100,000 to $149,999 | 349 (18.2%) | 196 (13.1%) |
| $150,000 or more | 903 (47.0%) | 188 (12.6%) |
| Total | 1,920 (100.0%) | 1,494 (100.0%) |
Monthly Housing Cost Tiers in Boonton
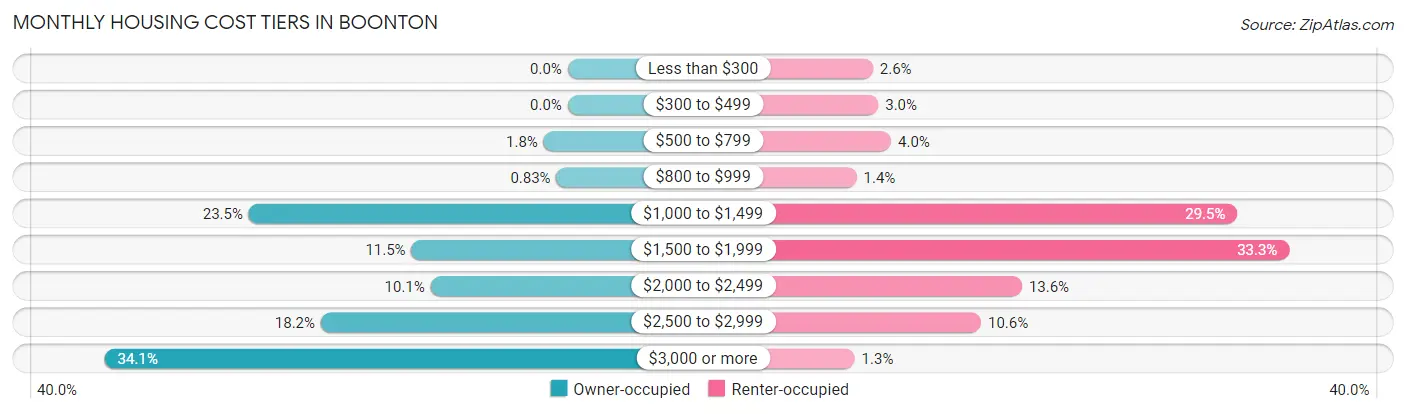
| Monthly Cost | Owner-occupied | Renter-occupied |
| Less than $300 | 0 (0.0%) | 39 (2.6%) |
| $300 to $499 | 0 (0.0%) | 45 (3.0%) |
| $500 to $799 | 34 (1.8%) | 59 (4.0%) |
| $800 to $999 | 16 (0.8%) | 21 (1.4%) |
| $1,000 to $1,499 | 451 (23.5%) | 440 (29.4%) |
| $1,500 to $1,999 | 221 (11.5%) | 497 (33.3%) |
| $2,000 to $2,499 | 194 (10.1%) | 203 (13.6%) |
| $2,500 to $2,999 | 349 (18.2%) | 158 (10.6%) |
| $3,000 or more | 655 (34.1%) | 19 (1.3%) |
| Total | 1,920 (100.0%) | 1,494 (100.0%) |
Physical Housing Characteristics in Boonton
Housing Structures in Boonton
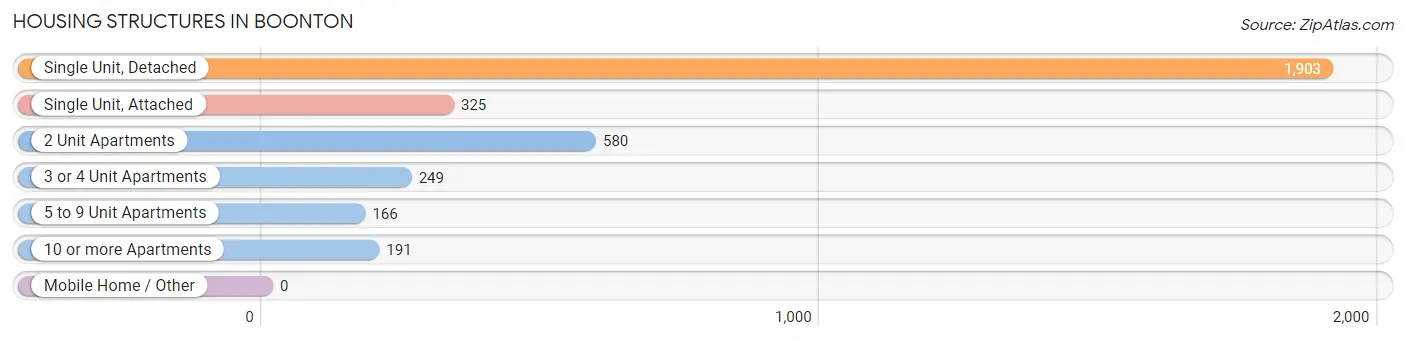
| Structure Type | # Housing Units | % Housing Units |
| Single Unit, Detached | 1,903 | 55.7% |
| Single Unit, Attached | 325 | 9.5% |
| 2 Unit Apartments | 580 | 17.0% |
| 3 or 4 Unit Apartments | 249 | 7.3% |
| 5 to 9 Unit Apartments | 166 | 4.9% |
| 10 or more Apartments | 191 | 5.6% |
| Mobile Home / Other | 0 | 0.0% |
| Total | 3,414 | 100.0% |
Housing Structures by Occupancy in Boonton
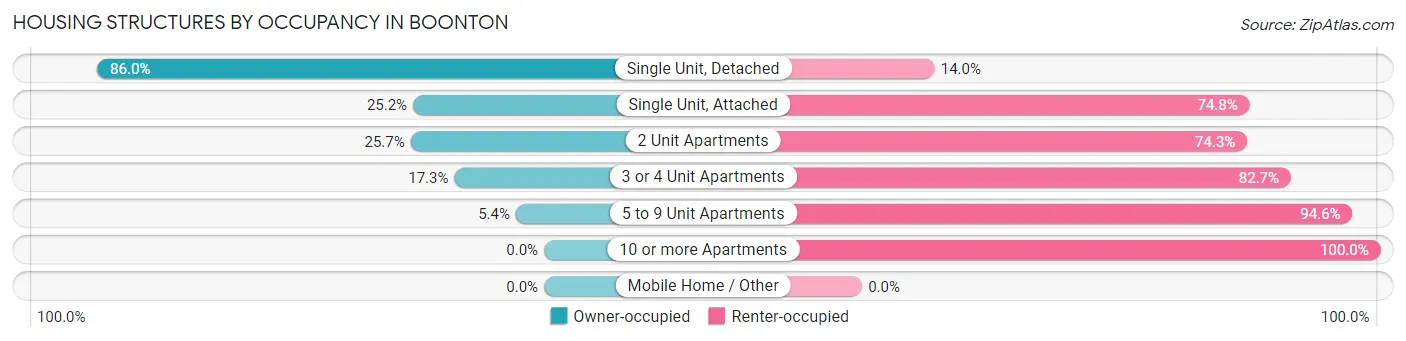
| Structure Type | Owner-occupied | Renter-occupied |
| Single Unit, Detached | 1,637 (86.0%) | 266 (14.0%) |
| Single Unit, Attached | 82 (25.2%) | 243 (74.8%) |
| 2 Unit Apartments | 149 (25.7%) | 431 (74.3%) |
| 3 or 4 Unit Apartments | 43 (17.3%) | 206 (82.7%) |
| 5 to 9 Unit Apartments | 9 (5.4%) | 157 (94.6%) |
| 10 or more Apartments | 0 (0.0%) | 191 (100.0%) |
| Mobile Home / Other | 0 (0.0%) | 0 (0.0%) |
| Total | 1,920 (56.2%) | 1,494 (43.8%) |
Housing Structures by Number of Rooms in Boonton
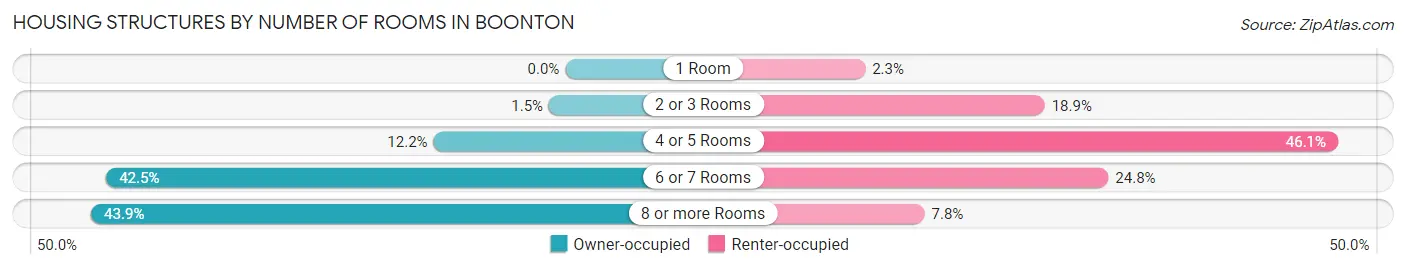
| Number of Rooms | Owner-occupied | Renter-occupied |
| 1 Room | 0 (0.0%) | 35 (2.3%) |
| 2 or 3 Rooms | 29 (1.5%) | 283 (18.9%) |
| 4 or 5 Rooms | 234 (12.2%) | 688 (46.1%) |
| 6 or 7 Rooms | 815 (42.4%) | 371 (24.8%) |
| 8 or more Rooms | 842 (43.9%) | 117 (7.8%) |
| Total | 1,920 (100.0%) | 1,494 (100.0%) |
Housing Structure by Heating Type in Boonton
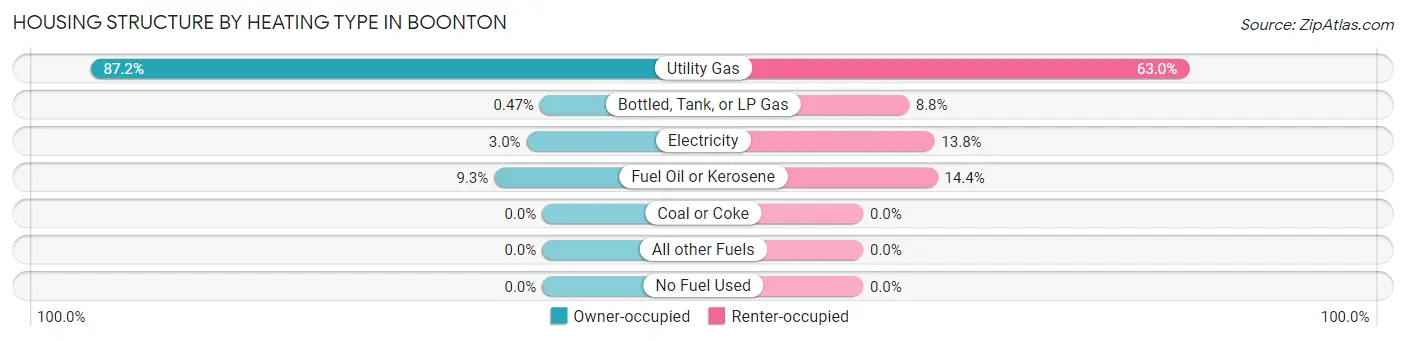
| Heating Type | Owner-occupied | Renter-occupied |
| Utility Gas | 1,675 (87.2%) | 941 (63.0%) |
| Bottled, Tank, or LP Gas | 9 (0.5%) | 132 (8.8%) |
| Electricity | 58 (3.0%) | 206 (13.8%) |
| Fuel Oil or Kerosene | 178 (9.3%) | 215 (14.4%) |
| Coal or Coke | 0 (0.0%) | 0 (0.0%) |
| All other Fuels | 0 (0.0%) | 0 (0.0%) |
| No Fuel Used | 0 (0.0%) | 0 (0.0%) |
| Total | 1,920 (100.0%) | 1,494 (100.0%) |
Household Vehicle Usage in Boonton
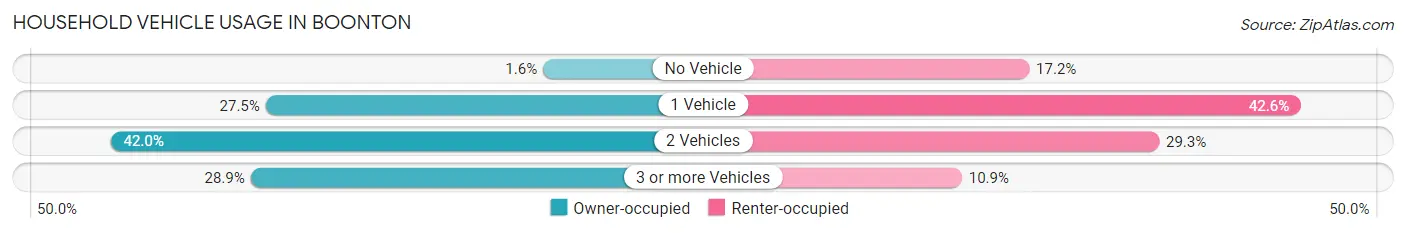
| Vehicles per Household | Owner-occupied | Renter-occupied |
| No Vehicle | 31 (1.6%) | 257 (17.2%) |
| 1 Vehicle | 528 (27.5%) | 636 (42.6%) |
| 2 Vehicles | 806 (42.0%) | 438 (29.3%) |
| 3 or more Vehicles | 555 (28.9%) | 163 (10.9%) |
| Total | 1,920 (100.0%) | 1,494 (100.0%) |
Real Estate & Mortgages in Boonton
Real Estate and Mortgage Overview in Boonton
| Characteristic | Without Mortgage | With Mortgage |
| Housing Units | 705 | 1,215 |
| Median Property Value | $456,000 | $478,600 |
| Median Household Income | $89,280 | $650 |
| Monthly Housing Costs | $1,343 | $655 |
| Real Estate Taxes | $10,001 | $7 |
Property Value by Mortgage Status in Boonton
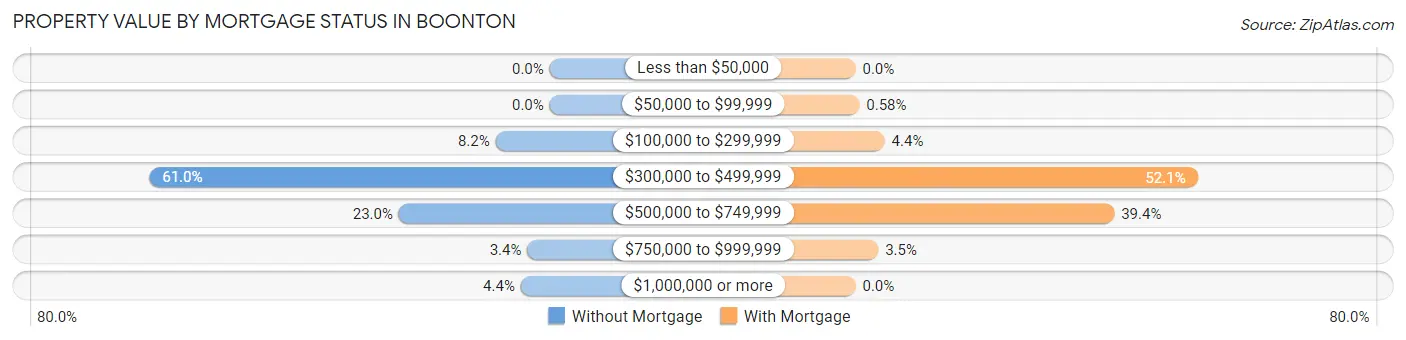
| Property Value | Without Mortgage | With Mortgage |
| Less than $50,000 | 0 (0.0%) | 0 (0.0%) |
| $50,000 to $99,999 | 0 (0.0%) | 7 (0.6%) |
| $100,000 to $299,999 | 58 (8.2%) | 54 (4.4%) |
| $300,000 to $499,999 | 430 (61.0%) | 633 (52.1%) |
| $500,000 to $749,999 | 162 (23.0%) | 479 (39.4%) |
| $750,000 to $999,999 | 24 (3.4%) | 42 (3.5%) |
| $1,000,000 or more | 31 (4.4%) | 0 (0.0%) |
| Total | 705 (100.0%) | 1,215 (100.0%) |
Household Income by Mortgage Status in Boonton
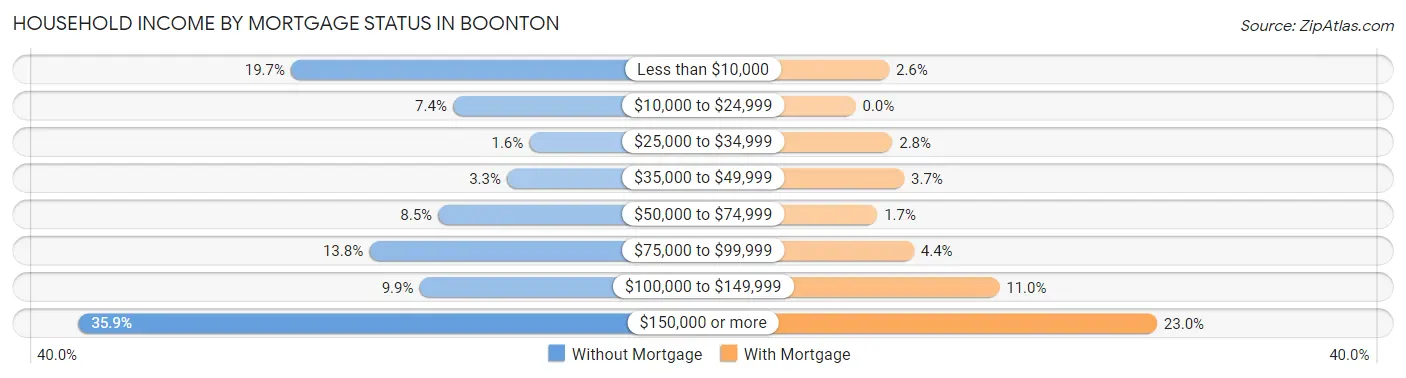
| Household Income | Without Mortgage | With Mortgage |
| Less than $10,000 | 139 (19.7%) | 31 (2.5%) |
| $10,000 to $24,999 | 52 (7.4%) | 0 (0.0%) |
| $25,000 to $34,999 | 11 (1.6%) | 34 (2.8%) |
| $35,000 to $49,999 | 23 (3.3%) | 45 (3.7%) |
| $50,000 to $74,999 | 60 (8.5%) | 20 (1.7%) |
| $75,000 to $99,999 | 97 (13.8%) | 54 (4.4%) |
| $100,000 to $149,999 | 70 (9.9%) | 133 (11.0%) |
| $150,000 or more | 253 (35.9%) | 279 (23.0%) |
| Total | 705 (100.0%) | 1,215 (100.0%) |
Property Value to Household Income Ratio in Boonton
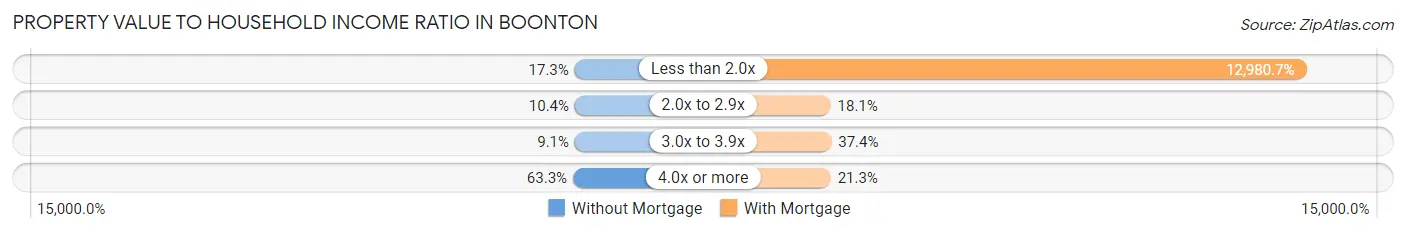
| Value-to-Income Ratio | Without Mortgage | With Mortgage |
| Less than 2.0x | 122 (17.3%) | 157,716 (12,980.7%) |
| 2.0x to 2.9x | 73 (10.3%) | 220 (18.1%) |
| 3.0x to 3.9x | 64 (9.1%) | 454 (37.4%) |
| 4.0x or more | 446 (63.3%) | 259 (21.3%) |
| Total | 705 (100.0%) | 1,215 (100.0%) |
Real Estate Taxes by Mortgage Status in Boonton
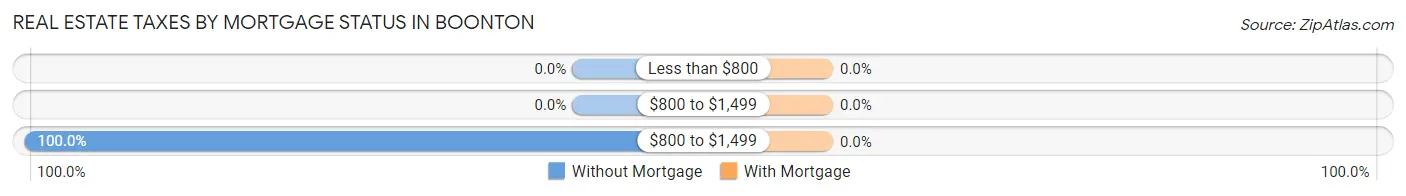
| Property Taxes | Without Mortgage | With Mortgage |
| Less than $800 | 0 (0.0%) | 0 (0.0%) |
| $800 to $1,499 | 0 (0.0%) | 0 (0.0%) |
| $800 to $1,499 | 705 (100.0%) | 0 (0.0%) |
| Total | 705 (100.0%) | 1,215 (100.0%) |
Health & Disability in Boonton
Health Insurance Coverage by Age in Boonton
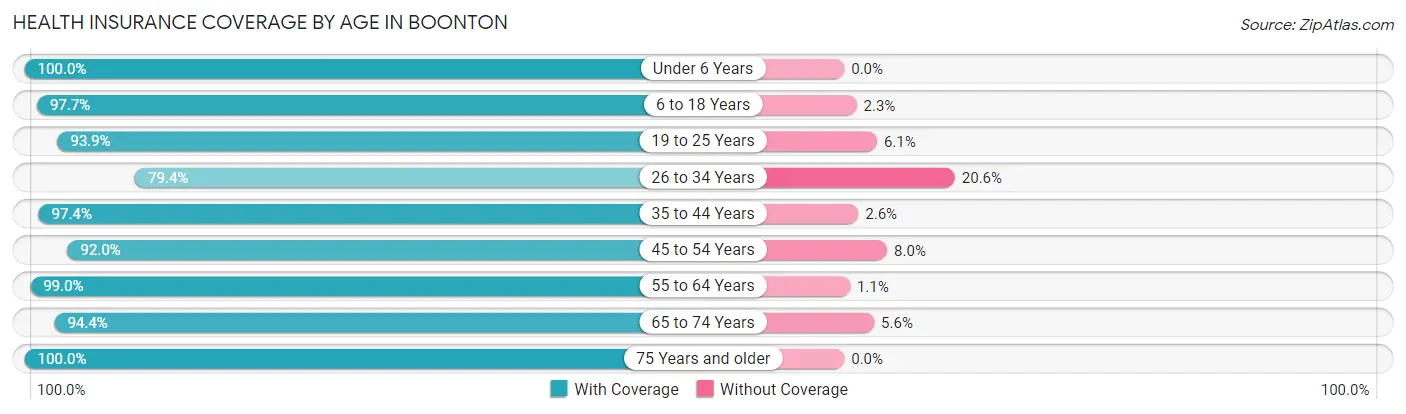
| Age Bracket | With Coverage | Without Coverage |
| Under 6 Years | 528 (100.0%) | 0 (0.0%) |
| 6 to 18 Years | 1,400 (97.7%) | 33 (2.3%) |
| 19 to 25 Years | 754 (93.9%) | 49 (6.1%) |
| 26 to 34 Years | 743 (79.4%) | 193 (20.6%) |
| 35 to 44 Years | 1,300 (97.4%) | 35 (2.6%) |
| 45 to 54 Years | 1,232 (92.0%) | 107 (8.0%) |
| 55 to 64 Years | 1,129 (99.0%) | 12 (1.1%) |
| 65 to 74 Years | 780 (94.4%) | 46 (5.6%) |
| 75 Years and older | 357 (100.0%) | 0 (0.0%) |
| Total | 8,223 (94.5%) | 475 (5.5%) |
Health Insurance Coverage by Citizenship Status in Boonton
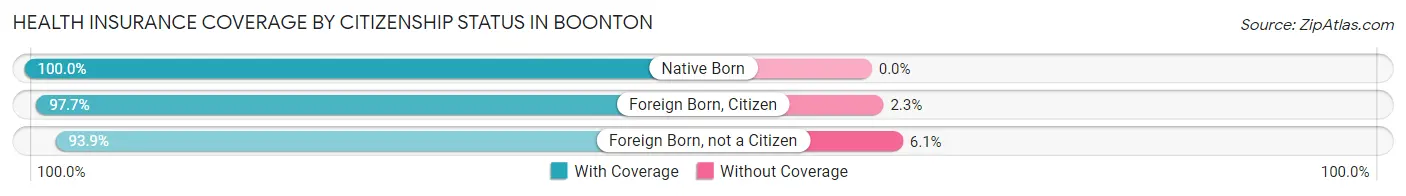
| Citizenship Status | With Coverage | Without Coverage |
| Native Born | 528 (100.0%) | 0 (0.0%) |
| Foreign Born, Citizen | 1,400 (97.7%) | 33 (2.3%) |
| Foreign Born, not a Citizen | 754 (93.9%) | 49 (6.1%) |
Health Insurance Coverage by Household Income in Boonton
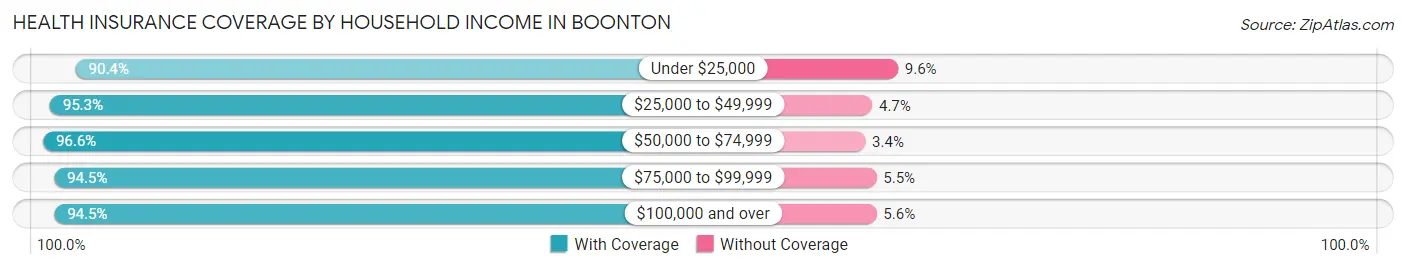
| Household Income | With Coverage | Without Coverage |
| Under $25,000 | 549 (90.4%) | 58 (9.6%) |
| $25,000 to $49,999 | 1,087 (95.3%) | 54 (4.7%) |
| $50,000 to $74,999 | 869 (96.6%) | 31 (3.4%) |
| $75,000 to $99,999 | 872 (94.5%) | 51 (5.5%) |
| $100,000 and over | 4,784 (94.5%) | 281 (5.6%) |
Public vs Private Health Insurance Coverage by Age in Boonton
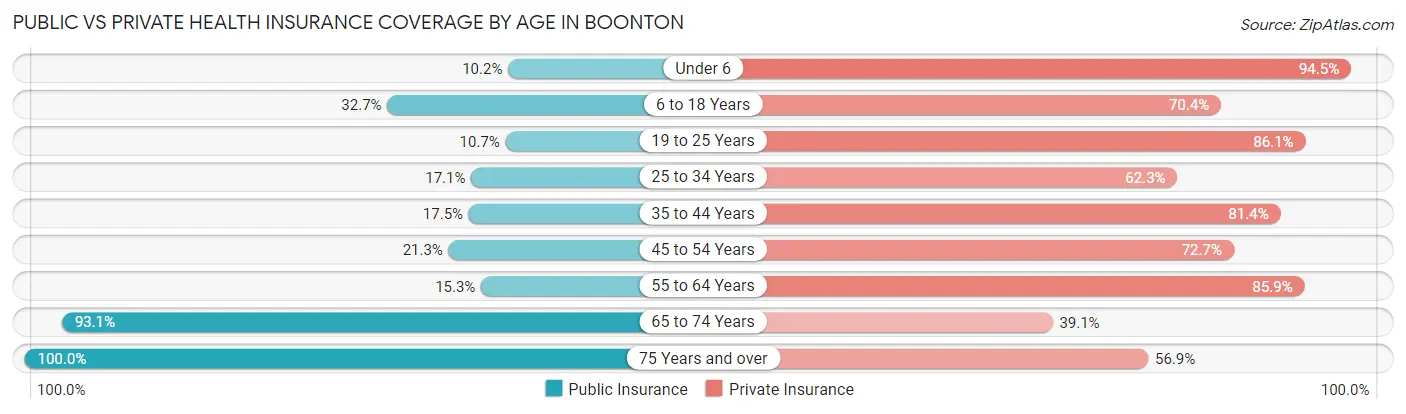
| Age Bracket | Public Insurance | Private Insurance |
| Under 6 | 54 (10.2%) | 499 (94.5%) |
| 6 to 18 Years | 468 (32.7%) | 1,009 (70.4%) |
| 19 to 25 Years | 86 (10.7%) | 691 (86.1%) |
| 25 to 34 Years | 160 (17.1%) | 583 (62.3%) |
| 35 to 44 Years | 234 (17.5%) | 1,087 (81.4%) |
| 45 to 54 Years | 285 (21.3%) | 974 (72.7%) |
| 55 to 64 Years | 174 (15.2%) | 980 (85.9%) |
| 65 to 74 Years | 769 (93.1%) | 323 (39.1%) |
| 75 Years and over | 357 (100.0%) | 203 (56.9%) |
| Total | 2,587 (29.7%) | 6,349 (73.0%) |
Disability Status by Sex by Age in Boonton
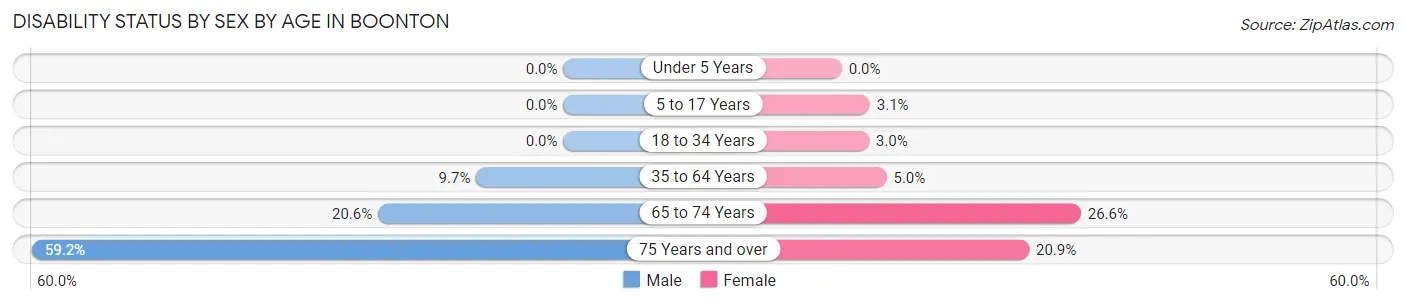
| Age Bracket | Male | Female |
| Under 5 Years | 0 (0.0%) | 0 (0.0%) |
| 5 to 17 Years | 0 (0.0%) | 21 (3.1%) |
| 18 to 34 Years | 0 (0.0%) | 24 (3.0%) |
| 35 to 64 Years | 187 (9.7%) | 94 (5.0%) |
| 65 to 74 Years | 110 (20.6%) | 78 (26.6%) |
| 75 Years and over | 58 (59.2%) | 54 (20.8%) |
Disability Class by Sex by Age in Boonton
Disability Class: Hearing Difficulty
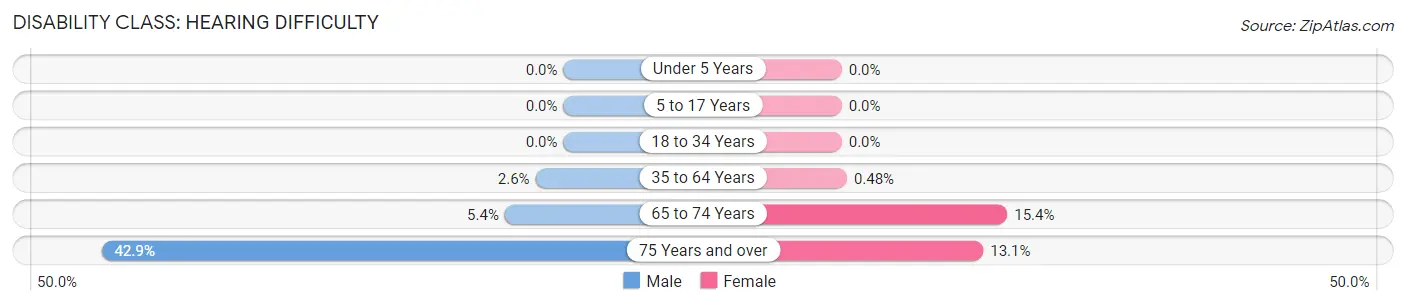
| Age Bracket | Male | Female |
| Under 5 Years | 0 (0.0%) | 0 (0.0%) |
| 5 to 17 Years | 0 (0.0%) | 0 (0.0%) |
| 18 to 34 Years | 0 (0.0%) | 0 (0.0%) |
| 35 to 64 Years | 50 (2.6%) | 9 (0.5%) |
| 65 to 74 Years | 29 (5.4%) | 45 (15.4%) |
| 75 Years and over | 42 (42.9%) | 34 (13.1%) |
Disability Class: Vision Difficulty
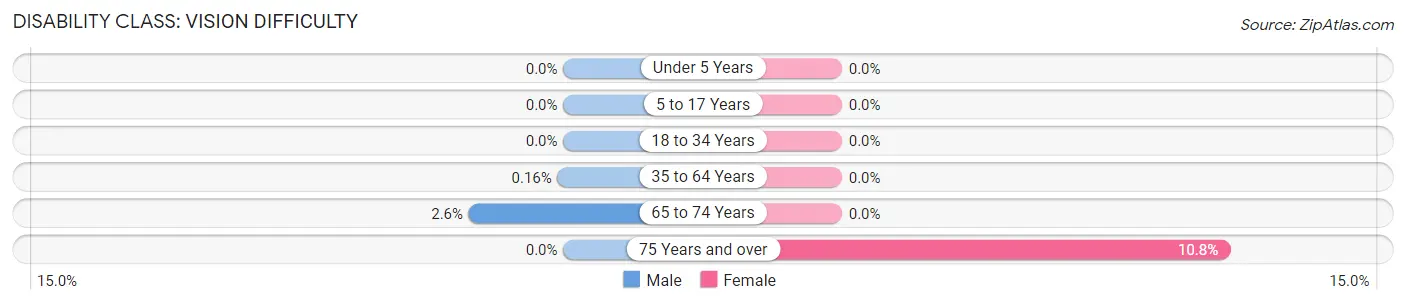
| Age Bracket | Male | Female |
| Under 5 Years | 0 (0.0%) | 0 (0.0%) |
| 5 to 17 Years | 0 (0.0%) | 0 (0.0%) |
| 18 to 34 Years | 0 (0.0%) | 0 (0.0%) |
| 35 to 64 Years | 3 (0.2%) | 0 (0.0%) |
| 65 to 74 Years | 14 (2.6%) | 0 (0.0%) |
| 75 Years and over | 0 (0.0%) | 28 (10.8%) |
Disability Class: Cognitive Difficulty
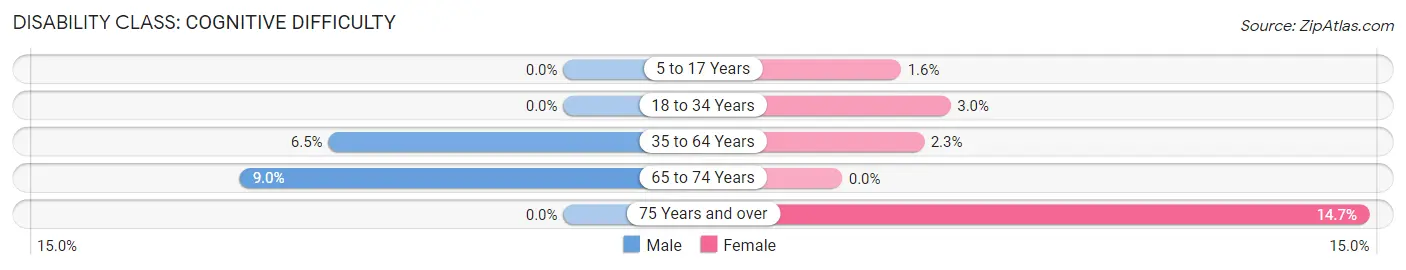
| Age Bracket | Male | Female |
| 5 to 17 Years | 0 (0.0%) | 11 (1.6%) |
| 18 to 34 Years | 0 (0.0%) | 24 (3.0%) |
| 35 to 64 Years | 126 (6.5%) | 43 (2.3%) |
| 65 to 74 Years | 48 (9.0%) | 0 (0.0%) |
| 75 Years and over | 0 (0.0%) | 38 (14.7%) |
Disability Class: Ambulatory Difficulty
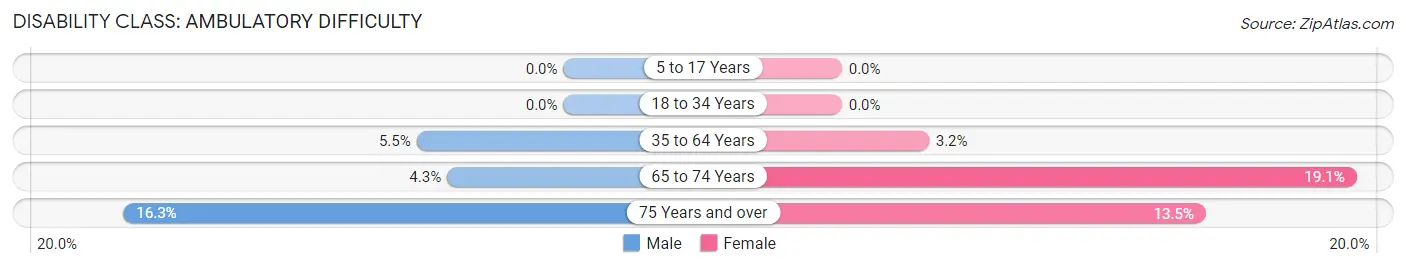
| Age Bracket | Male | Female |
| 5 to 17 Years | 0 (0.0%) | 0 (0.0%) |
| 18 to 34 Years | 0 (0.0%) | 0 (0.0%) |
| 35 to 64 Years | 105 (5.4%) | 61 (3.2%) |
| 65 to 74 Years | 23 (4.3%) | 56 (19.1%) |
| 75 Years and over | 16 (16.3%) | 35 (13.5%) |
Disability Class: Self-Care Difficulty
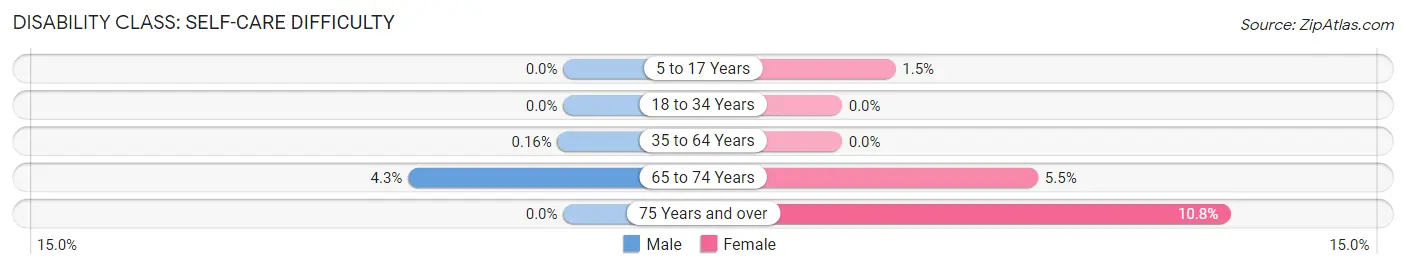
| Age Bracket | Male | Female |
| 5 to 17 Years | 0 (0.0%) | 10 (1.5%) |
| 18 to 34 Years | 0 (0.0%) | 0 (0.0%) |
| 35 to 64 Years | 3 (0.2%) | 0 (0.0%) |
| 65 to 74 Years | 23 (4.3%) | 16 (5.5%) |
| 75 Years and over | 0 (0.0%) | 28 (10.8%) |
Technology Access in Boonton
Computing Device Access in Boonton
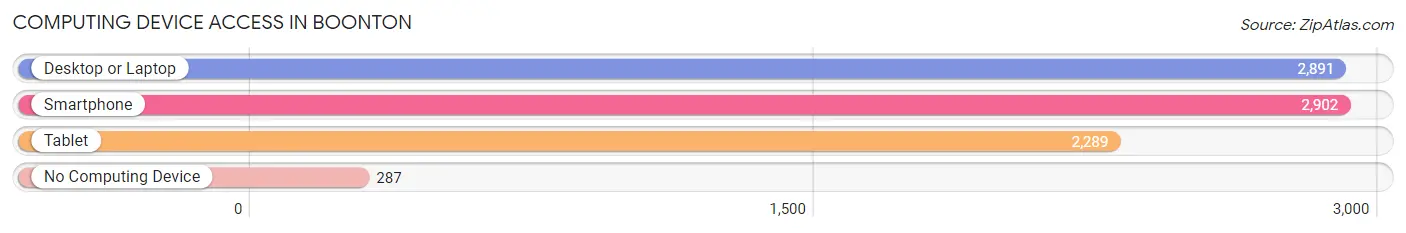
| Device Type | # Households | % Households |
| Desktop or Laptop | 2,891 | 84.7% |
| Smartphone | 2,902 | 85.0% |
| Tablet | 2,289 | 67.0% |
| No Computing Device | 287 | 8.4% |
| Total | 3,414 | 100.0% |
Internet Access in Boonton
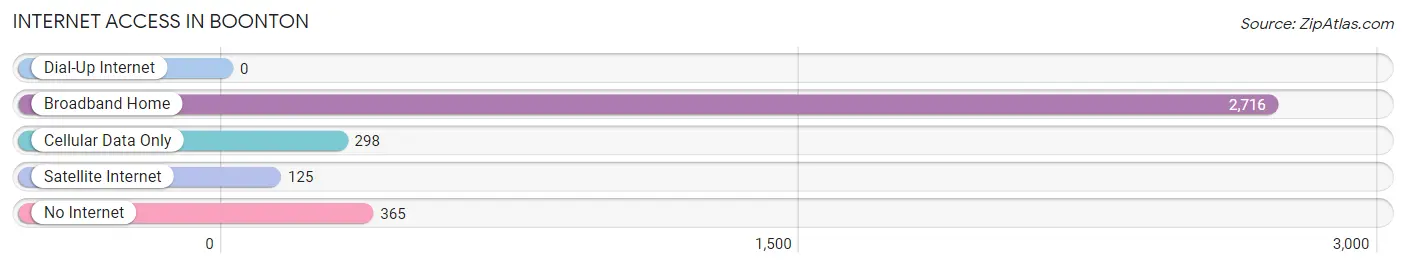
| Internet Type | # Households | % Households |
| Dial-Up Internet | 0 | 0.0% |
| Broadband Home | 2,716 | 79.5% |
| Cellular Data Only | 298 | 8.7% |
| Satellite Internet | 125 | 3.7% |
| No Internet | 365 | 10.7% |
| Total | 3,414 | 100.0% |
Boonton Summary
Boonton, NJ is a small town located in Morris County, New Jersey. It is situated on the banks of the Rockaway River and is approximately 25 miles northwest of New York City. Boonton has a population of 8,347 as of the 2010 census, making it the second-largest municipality in Morris County.
History
Boonton was first settled in 1715 by Dutch and English settlers. The town was originally known as “Boone-Towne” after the first settler, John Boon. The town was officially incorporated in 1867.
During the 19th century, Boonton was a major industrial center. It was home to several ironworks, including the Boonton Iron Works, which was founded in 1845 and was the first ironworks in the United States to use the Bessemer process for steel production. The ironworks was a major employer in the town and helped to fuel the local economy.
In the late 19th century, Boonton was also home to several silk mills, which were a major source of employment for the town. The silk industry declined in the early 20th century, but the town remained an important industrial center.
Geography
Boonton is located at 40°51'25" North, 74°27'45" West (40.856944, -74.462500). It is situated on the banks of the Rockaway River and is approximately 25 miles northwest of New York City.
The town has a total area of 2.2 square miles, all of which is land. Boonton is bordered by the towns of Parsippany-Troy Hills, Mountain Lakes, and Denville.
Economy
Boonton’s economy is largely based on manufacturing and retail. The town is home to several manufacturing companies, including Boonton Electronics, which produces electronic components, and Boonton Molding, which produces plastic products.
The town is also home to several retail stores, including a Walmart Supercenter, a Home Depot, and a Target.
Demographics
As of the 2010 census, Boonton had a population of 8,347. The racial makeup of the town was 79.2% White, 8.2% African American, 0.3% Native American, 5.2% Asian, and 6.9% from other races. Hispanic or Latino of any race were 15.2% of the population.
The median household income in Boonton was $76,944 in 2010. The median age of the town’s population was 41.7 years.
Boonton is served by the Boonton Public Schools, which includes four elementary schools, one middle school, and one high school. The town is also home to several private schools, including the Boonton Montessori School and the Boonton Christian Academy.
Common Questions
What is Per Capita Income in Boonton?
Per Capita income in Boonton is $47,574.
What is the Median Family Income in Boonton?
Median Family Income in Boonton is $126,394.
What is the Median Household income in Boonton?
Median Household Income in Boonton is $96,500.
What is Income or Wage Gap in Boonton?
Income or Wage Gap in Boonton is 33.7%.
Women in Boonton earn 66.3 cents for every dollar earned by a man.
What is Inequality or Gini Index in Boonton?
Inequality or Gini Index in Boonton is 0.44.
What is the Total Population of Boonton?
Total Population of Boonton is 8,781.
What is the Total Male Population of Boonton?
Total Male Population of Boonton is 4,676.
What is the Total Female Population of Boonton?
Total Female Population of Boonton is 4,105.
What is the Ratio of Males per 100 Females in Boonton?
There are 113.91 Males per 100 Females in Boonton.
What is the Ratio of Females per 100 Males in Boonton?
There are 87.79 Females per 100 Males in Boonton.
What is the Median Population Age in Boonton?
Median Population Age in Boonton is 40.3 Years.
What is the Average Family Size in Boonton
Average Family Size in Boonton is 3.3 People.
What is the Average Household Size in Boonton
Average Household Size in Boonton is 2.5 People.
How Large is the Labor Force in Boonton?
There are 5,042 People in the Labor Forcein in Boonton.
What is the Percentage of People in the Labor Force in Boonton?
71.2% of People are in the Labor Force in Boonton.
What is the Unemployment Rate in Boonton?
Unemployment Rate in Boonton is 3.9%.