Zip Codes with the Highest Percentage of Population Employed in Agriculture, Fishing & Hunting in Kansas City, MO
RELATED REPORTS & OPTIONS
Agriculture, Fishing & Hunting
Kansas City
Compare Zip Codes
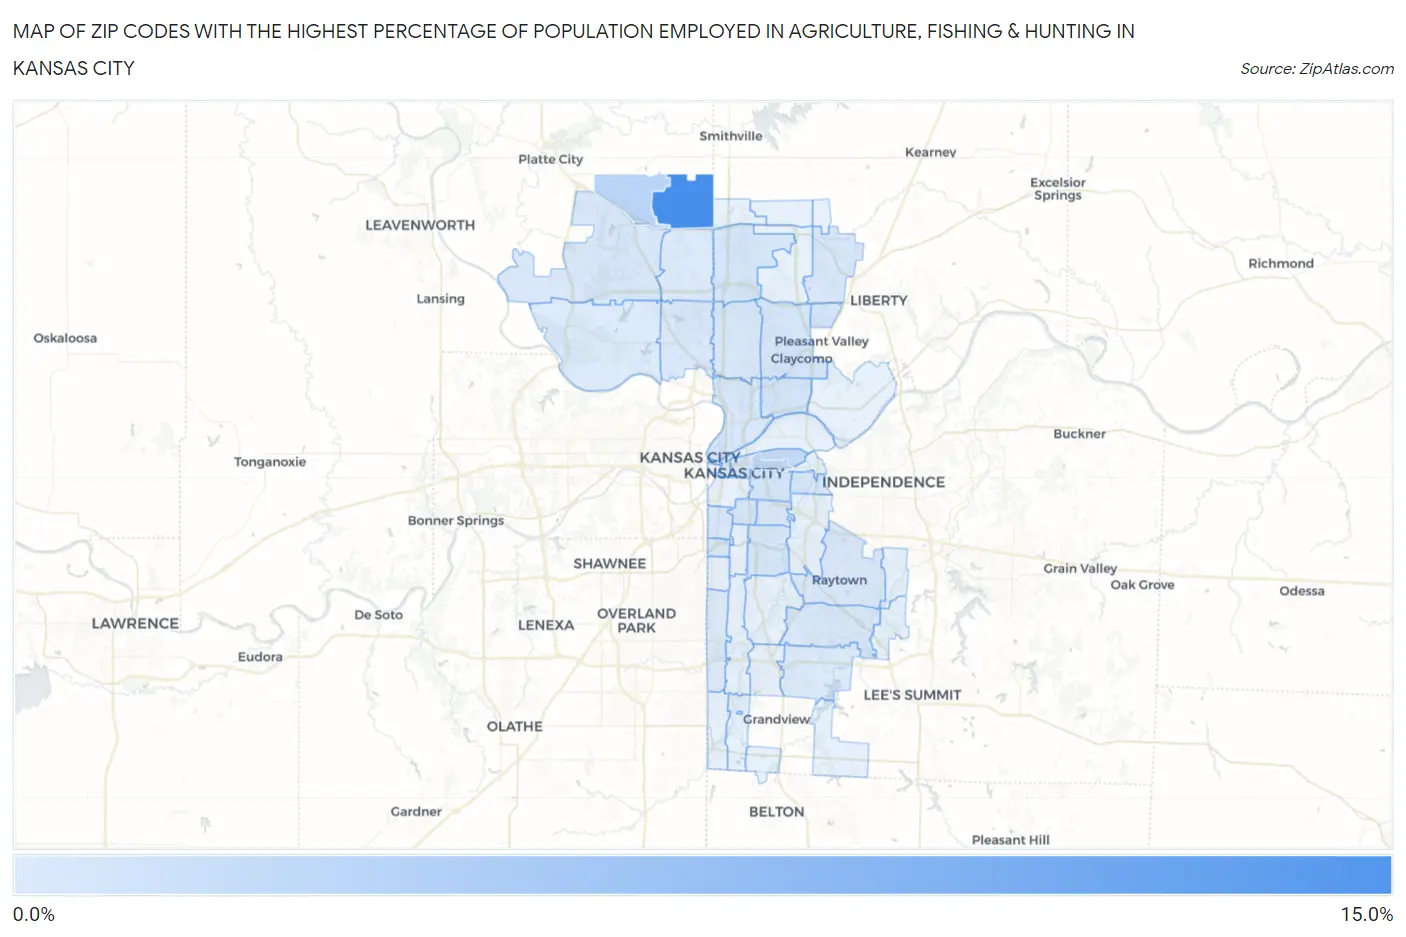
Map of Zip Codes with the Highest Percentage of Population Employed in Agriculture, Fishing & Hunting in Kansas City
0.053%
12.3%
Zip Codes with the Highest Percentage of Population Employed in Agriculture, Fishing & Hunting in Kansas City, MO
| Zip Code | % Employed | vs State | vs National | |
| 1. | 64164 | 12.3% | 1.4%(+10.8)#137 | 1.2%(+11.1)#3,402 |
| 2. | 64163 | 2.8% | 1.4%(+1.38)#463 | 1.2%(+1.62)#10,895 |
| 3. | 64124 | 2.4% | 1.4%(+0.949)#495 | 1.2%(+1.19)#11,803 |
| 4. | 64123 | 1.9% | 1.4%(+0.489)#540 | 1.2%(+0.733)#12,942 |
| 5. | 64158 | 0.86% | 1.4%(-0.584)#643 | 1.2%(-0.340)#16,928 |
| 6. | 64117 | 0.74% | 1.4%(-0.704)#661 | 1.2%(-0.460)#17,598 |
| 7. | 64119 | 0.67% | 1.4%(-0.774)#670 | 1.2%(-0.529)#18,026 |
| 8. | 64155 | 0.65% | 1.4%(-0.792)#671 | 1.2%(-0.548)#18,130 |
| 9. | 64106 | 0.63% | 1.4%(-0.809)#676 | 1.2%(-0.564)#18,237 |
| 10. | 64127 | 0.53% | 1.4%(-0.915)#696 | 1.2%(-0.671)#19,028 |
| 11. | 64109 | 0.50% | 1.4%(-0.941)#705 | 1.2%(-0.697)#19,257 |
| 12. | 64157 | 0.49% | 1.4%(-0.956)#707 | 1.2%(-0.712)#19,388 |
| 13. | 64116 | 0.47% | 1.4%(-0.978)#713 | 1.2%(-0.734)#19,572 |
| 14. | 64126 | 0.47% | 1.4%(-0.979)#715 | 1.2%(-0.734)#19,576 |
| 15. | 64118 | 0.46% | 1.4%(-0.981)#716 | 1.2%(-0.737)#19,598 |
| 16. | 64138 | 0.45% | 1.4%(-0.992)#719 | 1.2%(-0.748)#19,689 |
| 17. | 64130 | 0.42% | 1.4%(-1.02)#725 | 1.2%(-0.777)#19,959 |
| 18. | 64153 | 0.37% | 1.4%(-1.08)#742 | 1.2%(-0.832)#20,471 |
| 19. | 64133 | 0.30% | 1.4%(-1.15)#762 | 1.2%(-0.901)#21,197 |
| 20. | 64112 | 0.23% | 1.4%(-1.21)#776 | 1.2%(-0.967)#21,968 |
| 21. | 64151 | 0.21% | 1.4%(-1.23)#781 | 1.2%(-0.990)#22,247 |
| 22. | 64105 | 0.20% | 1.4%(-1.24)#783 | 1.2%(-1.000)#22,369 |
| 23. | 64128 | 0.17% | 1.4%(-1.27)#787 | 1.2%(-1.03)#22,703 |
| 24. | 64111 | 0.15% | 1.4%(-1.29)#796 | 1.2%(-1.05)#23,018 |
| 25. | 64114 | 0.12% | 1.4%(-1.32)#803 | 1.2%(-1.08)#23,411 |
| 26. | 64152 | 0.10% | 1.4%(-1.34)#805 | 1.2%(-1.10)#23,645 |
| 27. | 64134 | 0.084% | 1.4%(-1.36)#806 | 1.2%(-1.12)#23,902 |
| 28. | 64154 | 0.053% | 1.4%(-1.39)#807 | 1.2%(-1.15)#24,303 |
1
Common Questions
What are the Top 10 Zip Codes with the Highest Percentage of Population Employed in Agriculture, Fishing & Hunting in Kansas City, MO?
Top 10 Zip Codes with the Highest Percentage of Population Employed in Agriculture, Fishing & Hunting in Kansas City, MO are:
What zip code has the Highest Percentage of Population Employed in Agriculture, Fishing & Hunting in Kansas City, MO?
64164 has the Highest Percentage of Population Employed in Agriculture, Fishing & Hunting in Kansas City, MO with 12.3%.
What is the Percentage of Population Employed in Agriculture, Fishing & Hunting in Kansas City, MO?
Percentage of Population Employed in Agriculture, Fishing & Hunting in Kansas City is 0.37%.
What is the Percentage of Population Employed in Agriculture, Fishing & Hunting in Missouri?
Percentage of Population Employed in Agriculture, Fishing & Hunting in Missouri is 1.4%.
What is the Percentage of Population Employed in Agriculture, Fishing & Hunting in the United States?
Percentage of Population Employed in Agriculture, Fishing & Hunting in the United States is 1.2%.