Zip Codes with the Highest Percentage of Population Employed in Agriculture, Fishing & Hunting in Jefferson City, MO
RELATED REPORTS & OPTIONS
Agriculture, Fishing & Hunting
Jefferson City
Compare Zip Codes
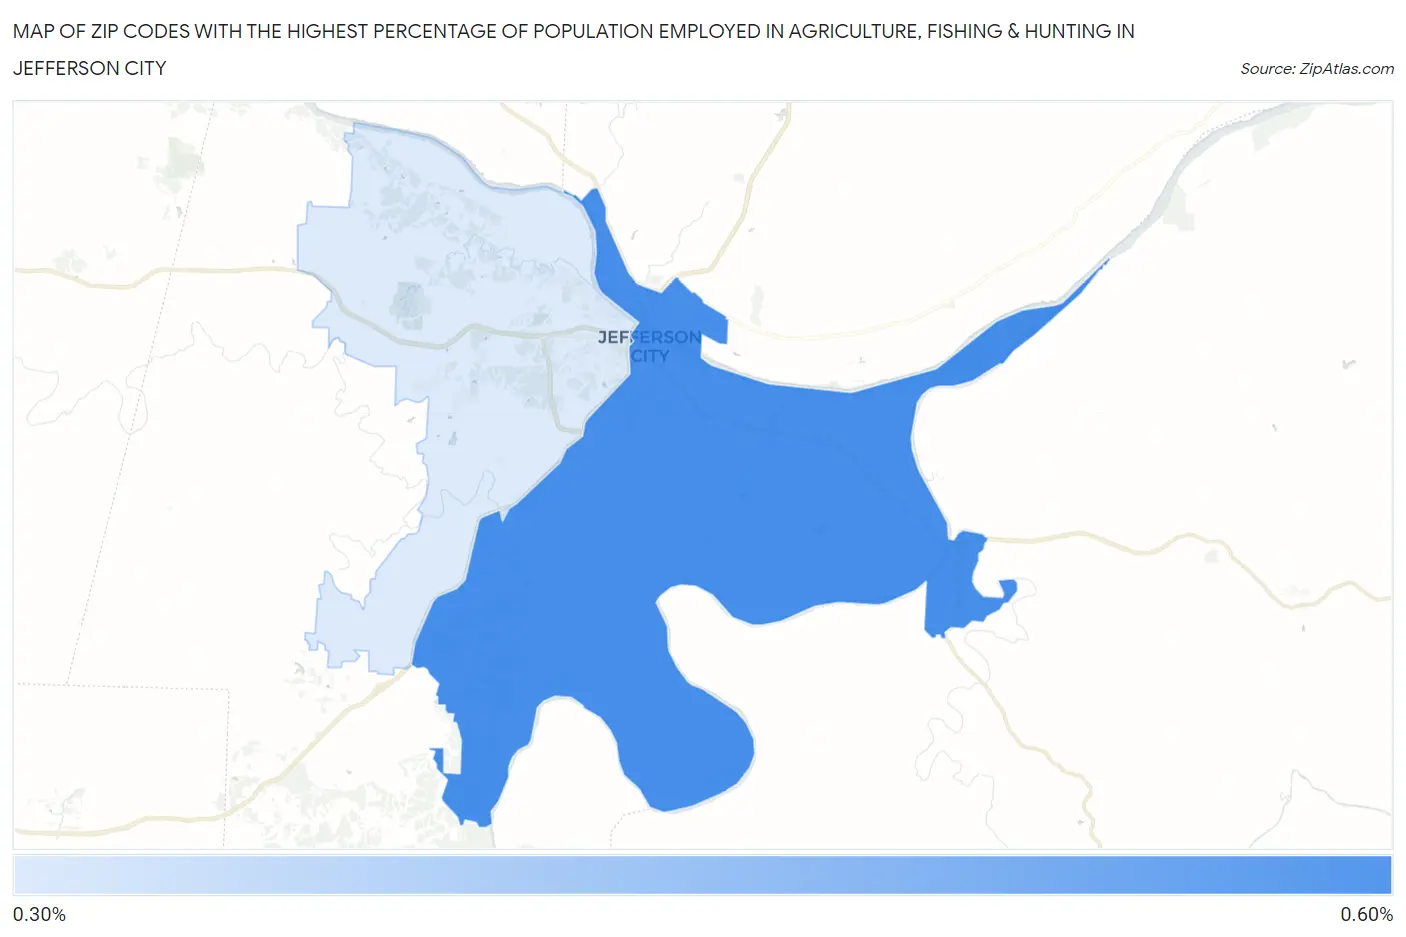
Map of Zip Codes with the Highest Percentage of Population Employed in Agriculture, Fishing & Hunting in Jefferson City
0.34%
0.52%
Zip Codes with the Highest Percentage of Population Employed in Agriculture, Fishing & Hunting in Jefferson City, MO
| Zip Code | % Employed | vs State | vs National | |
| 1. | 65101 | 0.52% | 1.4%(-0.923)#698 | 1.2%(-0.679)#19,103 |
| 2. | 65109 | 0.34% | 1.4%(-1.10)#752 | 1.2%(-0.859)#20,739 |
1
Common Questions
What are the Top Zip Codes with the Highest Percentage of Population Employed in Agriculture, Fishing & Hunting in Jefferson City, MO?
Top Zip Codes with the Highest Percentage of Population Employed in Agriculture, Fishing & Hunting in Jefferson City, MO are:
What zip code has the Highest Percentage of Population Employed in Agriculture, Fishing & Hunting in Jefferson City, MO?
65101 has the Highest Percentage of Population Employed in Agriculture, Fishing & Hunting in Jefferson City, MO with 0.52%.
What is the Percentage of Population Employed in Agriculture, Fishing & Hunting in Jefferson City, MO?
Percentage of Population Employed in Agriculture, Fishing & Hunting in Jefferson City is 0.20%.
What is the Percentage of Population Employed in Agriculture, Fishing & Hunting in Missouri?
Percentage of Population Employed in Agriculture, Fishing & Hunting in Missouri is 1.4%.
What is the Percentage of Population Employed in Agriculture, Fishing & Hunting in the United States?
Percentage of Population Employed in Agriculture, Fishing & Hunting in the United States is 1.2%.