Zip Codes with the Highest Percentage of Households Heated by Fuel Oil / Kerosene in Oregon
RELATED REPORTS & OPTIONS
Fuel Oil Heating
Oregon
Compare Zip Codes
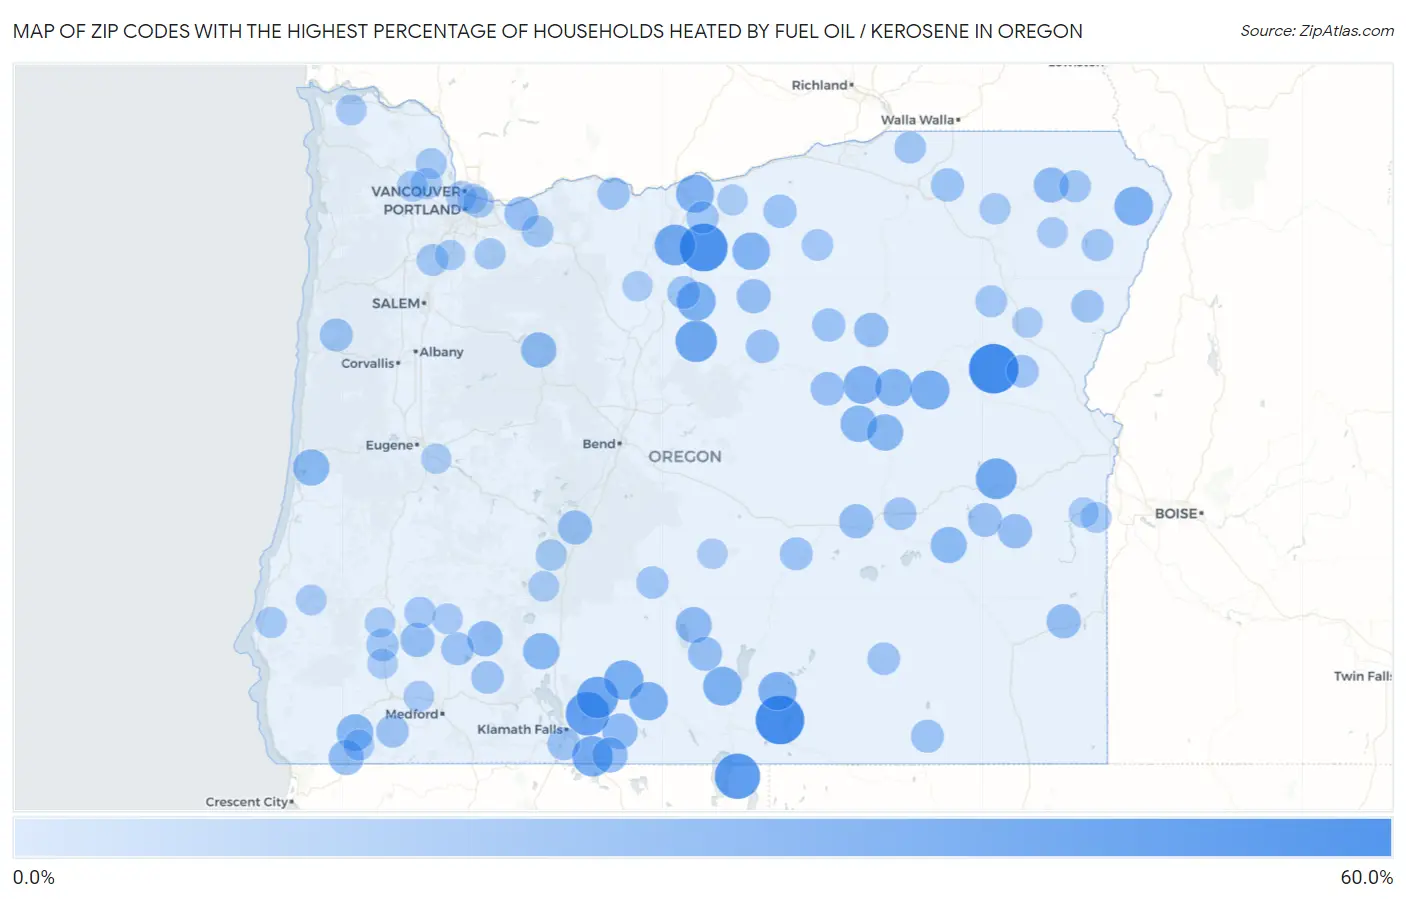
Map of Zip Codes with the Highest Percentage of Households Heated by Fuel Oil / Kerosene in Oregon
0.0%
60.0%
Zip Codes with the Highest Percentage of Households Heated by Fuel Oil / Kerosene in Oregon
| Zip Code | Fuel Oil Heating | vs State | vs National | |
| 1. | 97837 | 54.8% | 1.4%(+53.4)#1 | 4.2%(+50.6)#1,506 |
| 2. | 97620 | 52.4% | 1.4%(+51.0)#2 | 4.2%(+48.2)#1,675 |
| 3. | 97033 | 50.0% | 1.4%(+48.6)#3 | 4.2%(+45.8)#1,840 |
| 4. | 97635 | 43.6% | 1.4%(+42.2)#4 | 4.2%(+39.4)#2,290 |
| 5. | 97625 | 38.9% | 1.4%(+37.5)#5 | 4.2%(+34.7)#2,650 |
| 6. | 97711 | 33.3% | 1.4%(+31.9)#6 | 4.2%(+29.1)#3,082 |
| 7. | 97639 | 33.3% | 1.4%(+31.9)#7 | 4.2%(+29.1)#3,084 |
| 8. | 97029 | 31.5% | 1.4%(+30.1)#8 | 4.2%(+27.3)#3,219 |
| 9. | 97911 | 31.4% | 1.4%(+30.0)#9 | 4.2%(+27.2)#3,228 |
| 10. | 97633 | 30.3% | 1.4%(+28.9)#10 | 4.2%(+26.1)#3,310 |
| 11. | 97621 | 27.9% | 1.4%(+26.5)#11 | 4.2%(+23.7)#3,517 |
| 12. | 97869 | 27.0% | 1.4%(+25.6)#12 | 4.2%(+22.8)#3,589 |
| 13. | 97001 | 26.3% | 1.4%(+24.9)#13 | 4.2%(+22.1)#3,651 |
| 14. | 97630 | 26.0% | 1.4%(+24.6)#14 | 4.2%(+21.8)#3,674 |
| 15. | 97842 | 25.9% | 1.4%(+24.5)#15 | 4.2%(+21.7)#3,686 |
| 16. | 97622 | 25.0% | 1.4%(+23.6)#16 | 4.2%(+20.8)#3,781 |
| 17. | 97637 | 25.0% | 1.4%(+23.6)#17 | 4.2%(+20.8)#3,784 |
| 18. | 97865 | 24.1% | 1.4%(+22.7)#18 | 4.2%(+19.9)#3,855 |
| 19. | 97065 | 24.0% | 1.4%(+22.6)#19 | 4.2%(+19.8)#3,864 |
| 20. | 97823 | 23.0% | 1.4%(+21.6)#20 | 4.2%(+18.8)#3,980 |
| 21. | 97845 | 22.4% | 1.4%(+21.0)#21 | 4.2%(+18.2)#4,029 |
| 22. | 97531 | 20.6% | 1.4%(+19.2)#22 | 4.2%(+16.4)#4,224 |
| 23. | 97820 | 20.2% | 1.4%(+18.8)#23 | 4.2%(+16.0)#4,257 |
| 24. | 97873 | 20.2% | 1.4%(+18.8)#24 | 4.2%(+16.0)#4,264 |
| 25. | 97626 | 20.0% | 1.4%(+18.6)#25 | 4.2%(+15.8)#4,285 |
| 26. | 97493 | 19.6% | 1.4%(+18.2)#26 | 4.2%(+15.4)#4,339 |
| 27. | 97732 | 19.0% | 1.4%(+17.6)#27 | 4.2%(+14.8)#4,400 |
| 28. | 97640 | 18.8% | 1.4%(+17.4)#28 | 4.2%(+14.6)#4,422 |
| 29. | 97623 | 17.6% | 1.4%(+16.2)#29 | 4.2%(+13.4)#4,571 |
| 30. | 97536 | 17.2% | 1.4%(+15.8)#30 | 4.2%(+13.0)#4,642 |
| 31. | 97350 | 17.2% | 1.4%(+15.8)#31 | 4.2%(+13.0)#4,649 |
| 32. | 97632 | 16.7% | 1.4%(+15.3)#32 | 4.2%(+12.5)#4,721 |
| 33. | 97534 | 16.7% | 1.4%(+15.3)#33 | 4.2%(+12.5)#4,723 |
| 34. | 97885 | 16.6% | 1.4%(+15.2)#34 | 4.2%(+12.4)#4,746 |
| 35. | 97410 | 14.5% | 1.4%(+13.1)#35 | 4.2%(+10.3)#5,094 |
| 36. | 97906 | 14.5% | 1.4%(+13.1)#36 | 4.2%(+10.3)#5,095 |
| 37. | 97910 | 14.4% | 1.4%(+13.0)#37 | 4.2%(+10.2)#5,109 |
| 38. | 97856 | 14.4% | 1.4%(+13.0)#38 | 4.2%(+10.2)#5,110 |
| 39. | 97738 | 14.2% | 1.4%(+12.8)#39 | 4.2%(+10.00)#5,143 |
| 40. | 97830 | 14.2% | 1.4%(+12.8)#40 | 4.2%(+10.00)#5,146 |
| 41. | 97737 | 14.0% | 1.4%(+12.6)#41 | 4.2%(+9.80)#5,184 |
| 42. | 97636 | 13.9% | 1.4%(+12.5)#42 | 4.2%(+9.70)#5,202 |
| 43. | 97019 | 13.4% | 1.4%(+12.0)#43 | 4.2%(+9.20)#5,274 |
| 44. | 97917 | 13.3% | 1.4%(+11.9)#44 | 4.2%(+9.10)#5,297 |
| 45. | 97825 | 12.9% | 1.4%(+11.5)#45 | 4.2%(+8.70)#5,383 |
| 46. | 97750 | 11.9% | 1.4%(+10.5)#46 | 4.2%(+7.70)#5,604 |
| 47. | 97843 | 11.7% | 1.4%(+10.3)#47 | 4.2%(+7.50)#5,653 |
| 48. | 97810 | 11.6% | 1.4%(+10.2)#48 | 4.2%(+7.40)#5,679 |
| 49. | 97864 | 11.6% | 1.4%(+10.2)#49 | 4.2%(+7.40)#5,688 |
| 50. | 97357 | 11.1% | 1.4%(+9.70)#50 | 4.2%(+6.90)#5,807 |
| 51. | 97710 | 11.1% | 1.4%(+9.70)#51 | 4.2%(+6.90)#5,810 |
| 52. | 97758 | 11.1% | 1.4%(+9.70)#52 | 4.2%(+6.90)#5,811 |
| 53. | 97057 | 11.1% | 1.4%(+9.70)#53 | 4.2%(+6.90)#5,812 |
| 54. | 97541 | 11.0% | 1.4%(+9.60)#54 | 4.2%(+6.80)#5,826 |
| 55. | 97720 | 10.7% | 1.4%(+9.30)#55 | 4.2%(+6.50)#5,886 |
| 56. | 97634 | 10.6% | 1.4%(+9.20)#56 | 4.2%(+6.40)#5,934 |
| 57. | 97522 | 10.4% | 1.4%(+9.00)#57 | 4.2%(+6.20)#5,980 |
| 58. | 97544 | 10.2% | 1.4%(+8.80)#58 | 4.2%(+6.00)#6,021 |
| 59. | 97834 | 10.0% | 1.4%(+8.60)#59 | 4.2%(+5.80)#6,068 |
| 60. | 97736 | 10.0% | 1.4%(+8.60)#60 | 4.2%(+5.80)#6,073 |
| 61. | 97819 | 10.0% | 1.4%(+8.60)#61 | 4.2%(+5.80)#6,074 |
| 62. | 97040 | 9.8% | 1.4%(+8.40)#62 | 4.2%(+5.60)#6,126 |
| 63. | 97039 | 9.7% | 1.4%(+8.30)#63 | 4.2%(+5.50)#6,161 |
| 64. | 97638 | 9.6% | 1.4%(+8.20)#64 | 4.2%(+5.40)#6,191 |
| 65. | 97442 | 9.2% | 1.4%(+7.80)#65 | 4.2%(+5.00)#6,299 |
| 66. | 97828 | 8.5% | 1.4%(+7.10)#66 | 4.2%(+4.30)#6,519 |
| 67. | 97846 | 8.5% | 1.4%(+7.10)#67 | 4.2%(+4.30)#6,522 |
| 68. | 97011 | 8.3% | 1.4%(+6.90)#68 | 4.2%(+4.10)#6,600 |
| 69. | 97835 | 8.3% | 1.4%(+6.90)#69 | 4.2%(+4.10)#6,608 |
| 70. | 97137 | 8.0% | 1.4%(+6.60)#70 | 4.2%(+3.80)#6,716 |
| 71. | 97833 | 8.0% | 1.4%(+6.60)#71 | 4.2%(+3.80)#6,722 |
| 72. | 97836 | 7.3% | 1.4%(+5.90)#72 | 4.2%(+3.10)#7,005 |
| 73. | 97429 | 7.1% | 1.4%(+5.70)#73 | 4.2%(+2.90)#7,082 |
| 74. | 97876 | 6.7% | 1.4%(+5.30)#74 | 4.2%(+2.50)#7,261 |
| 75. | 97133 | 6.4% | 1.4%(+5.00)#75 | 4.2%(+2.20)#7,385 |
| 76. | 97733 | 6.4% | 1.4%(+5.00)#76 | 4.2%(+2.20)#7,417 |
| 77. | 97056 | 6.3% | 1.4%(+4.90)#77 | 4.2%(+2.10)#7,427 |
| 78. | 97106 | 6.2% | 1.4%(+4.80)#78 | 4.2%(+2.00)#7,487 |
| 79. | 97004 | 6.1% | 1.4%(+4.70)#79 | 4.2%(+1.90)#7,536 |
| 80. | 97450 | 6.0% | 1.4%(+4.60)#80 | 4.2%(+1.80)#7,592 |
| 81. | 97523 | 5.9% | 1.4%(+4.50)#81 | 4.2%(+1.70)#7,628 |
| 82. | 97812 | 5.4% | 1.4%(+4.00)#82 | 4.2%(+1.20)#7,921 |
| 83. | 97901 | 5.4% | 1.4%(+4.00)#83 | 4.2%(+1.20)#7,925 |
| 84. | 97857 | 5.4% | 1.4%(+4.00)#84 | 4.2%(+1.20)#7,926 |
| 85. | 97484 | 5.4% | 1.4%(+4.00)#85 | 4.2%(+1.20)#7,935 |
| 86. | 97103 | 5.3% | 1.4%(+3.90)#86 | 4.2%(+1.10)#7,948 |
| 87. | 97525 | 5.1% | 1.4%(+3.70)#87 | 4.2%(+0.900)#8,081 |
| 88. | 97458 | 5.1% | 1.4%(+3.70)#88 | 4.2%(+0.900)#8,082 |
| 89. | 97731 | 5.1% | 1.4%(+3.70)#89 | 4.2%(+0.900)#8,109 |
| 90. | 97217 | 4.9% | 1.4%(+3.50)#90 | 4.2%(+0.700)#8,155 |
| 91. | 97220 | 4.9% | 1.4%(+3.50)#91 | 4.2%(+0.700)#8,156 |
| 92. | 97469 | 4.6% | 1.4%(+3.20)#92 | 4.2%(+0.400)#8,396 |
| 93. | 97814 | 4.5% | 1.4%(+3.10)#93 | 4.2%(+0.300)#8,444 |
| 94. | 97211 | 4.4% | 1.4%(+3.00)#94 | 4.2%(+0.200)#8,490 |
| 95. | 97913 | 4.4% | 1.4%(+3.00)#95 | 4.2%(+0.200)#8,505 |
| 96. | 97641 | 4.4% | 1.4%(+3.00)#96 | 4.2%(+0.200)#8,530 |
| 97. | 97497 | 4.4% | 1.4%(+3.00)#97 | 4.2%(+0.200)#8,533 |
| 98. | 97037 | 4.3% | 1.4%(+2.90)#98 | 4.2%(+0.100)#8,605 |
| 99. | 97002 | 4.2% | 1.4%(+2.80)#99 | 4.2%(=0.000)#8,656 |
| 100. | 97455 | 4.2% | 1.4%(+2.80)#100 | 4.2%(=0.000)#8,669 |
Common Questions
What are the Top 10 Zip Codes with the Highest Percentage of Households Heated by Fuel Oil / Kerosene in Oregon?
Top 10 Zip Codes with the Highest Percentage of Households Heated by Fuel Oil / Kerosene in Oregon are:
What zip code has the Highest Percentage of Households Heated by Fuel Oil / Kerosene in Oregon?
97837 has the Highest Percentage of Households Heated by Fuel Oil / Kerosene in Oregon with 54.8%.
What is the Percentage of Households Heated by Fuel Oil / Kerosene in the State of Oregon?
Percentage of Households Heated by Fuel Oil / Kerosene in Oregon is 1.4%.
What is the Percentage of Households Heated by Fuel Oil / Kerosene in the United States?
Percentage of Households Heated by Fuel Oil / Kerosene in the United States is 4.2%.