Zip Codes with the Highest Percentage of Households Heated by Fuel Oil / Kerosene in Rhode Island
RELATED REPORTS & OPTIONS
Fuel Oil Heating
Rhode Island
Compare Zip Codes
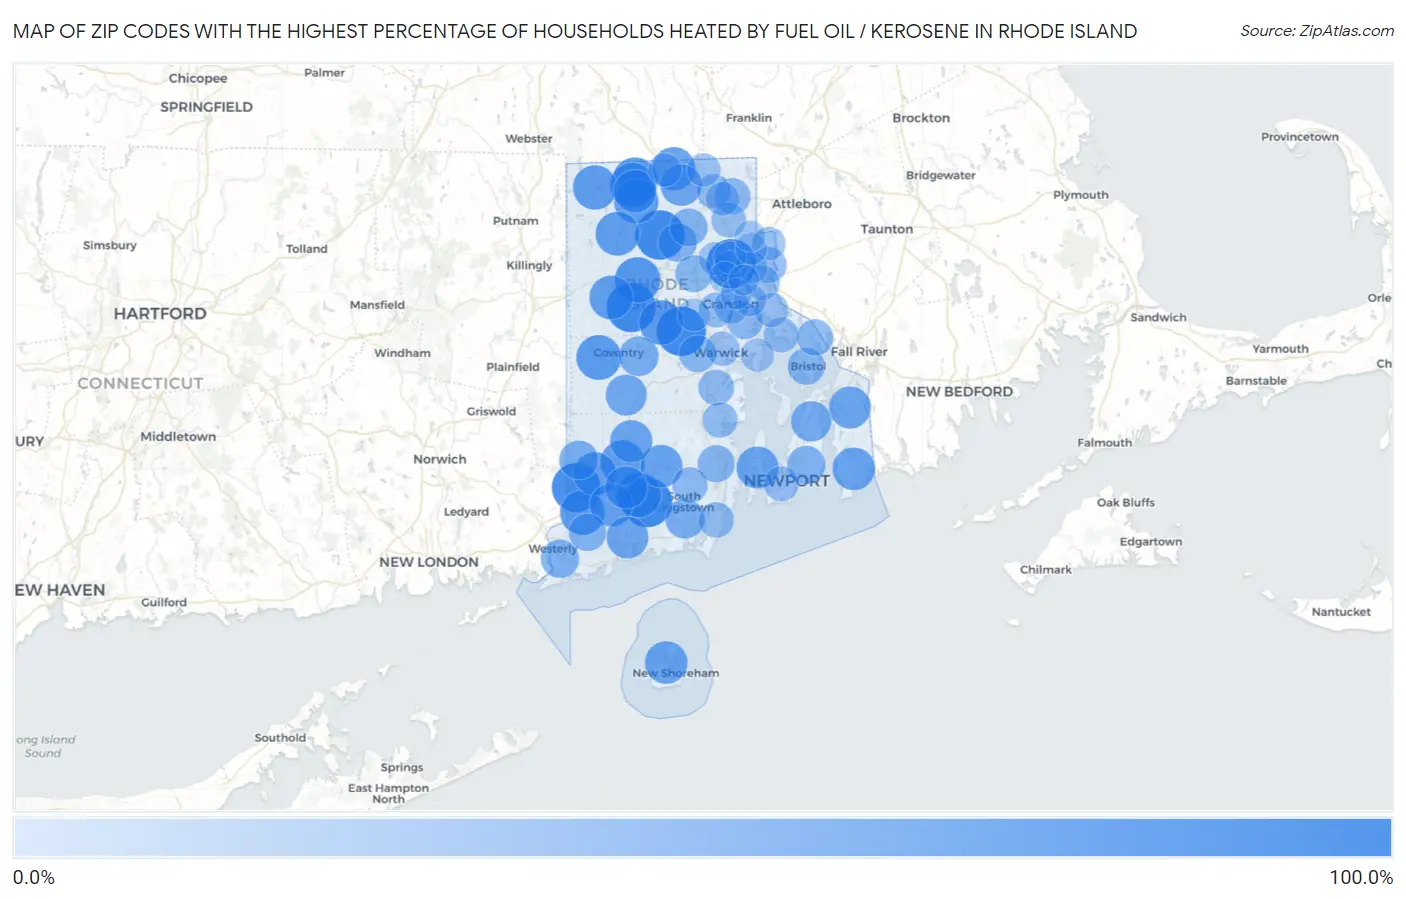
Map of Zip Codes with the Highest Percentage of Households Heated by Fuel Oil / Kerosene in Rhode Island
0.0%
100.0%
Zip Codes with the Highest Percentage of Households Heated by Fuel Oil / Kerosene in Rhode Island
| Zip Code | Fuel Oil Heating | vs State | vs National | |
| 1. | 02918 | 100.0% | 27.6%(+72.4)#1 | 4.2%(+95.8)#1 |
| 2. | 02815 | 100.0% | 27.6%(+72.4)#2 | 4.2%(+95.8)#27 |
| 3. | 02836 | 100.0% | 27.6%(+72.4)#3 | 4.2%(+95.8)#39 |
| 4. | 02829 | 100.0% | 27.6%(+72.4)#4 | 4.2%(+95.8)#41 |
| 5. | 02823 | 100.0% | 27.6%(+72.4)#5 | 4.2%(+95.8)#86 |
| 6. | 02833 | 96.2% | 27.6%(+68.6)#6 | 4.2%(+92.0)#114 |
| 7. | 02857 | 80.0% | 27.6%(+52.4)#7 | 4.2%(+75.8)#261 |
| 8. | 02826 | 76.4% | 27.6%(+48.8)#8 | 4.2%(+72.2)#330 |
| 9. | 02827 | 75.7% | 27.6%(+48.1)#9 | 4.2%(+71.5)#347 |
| 10. | 02830 | 75.4% | 27.6%(+47.8)#10 | 4.2%(+71.2)#353 |
| 11. | 02875 | 75.3% | 27.6%(+47.7)#11 | 4.2%(+71.1)#358 |
| 12. | 02804 | 75.0% | 27.6%(+47.4)#12 | 4.2%(+70.8)#364 |
| 13. | 02831 | 73.5% | 27.6%(+45.9)#13 | 4.2%(+69.3)#399 |
| 14. | 02839 | 73.5% | 27.6%(+45.9)#14 | 4.2%(+69.3)#400 |
| 15. | 02898 | 72.5% | 27.6%(+44.9)#15 | 4.2%(+68.3)#432 |
| 16. | 02859 | 72.4% | 27.6%(+44.8)#16 | 4.2%(+68.2)#436 |
| 17. | 02814 | 70.5% | 27.6%(+42.9)#17 | 4.2%(+66.3)#493 |
| 18. | 02825 | 69.4% | 27.6%(+41.8)#18 | 4.2%(+65.2)#553 |
| 19. | 02824 | 67.5% | 27.6%(+39.9)#19 | 4.2%(+63.3)#645 |
| 20. | 02832 | 66.9% | 27.6%(+39.3)#20 | 4.2%(+62.7)#681 |
| 21. | 02894 | 66.3% | 27.6%(+38.7)#21 | 4.2%(+62.1)#723 |
| 22. | 02858 | 64.8% | 27.6%(+37.2)#22 | 4.2%(+60.6)#794 |
| 23. | 02892 | 63.7% | 27.6%(+36.1)#23 | 4.2%(+59.5)#869 |
| 24. | 02807 | 63.6% | 27.6%(+36.0)#24 | 4.2%(+59.4)#880 |
| 25. | 02837 | 63.1% | 27.6%(+35.5)#25 | 4.2%(+58.9)#906 |
| 26. | 02812 | 62.1% | 27.6%(+34.5)#26 | 4.2%(+57.9)#961 |
| 27. | 02822 | 61.4% | 27.6%(+33.8)#27 | 4.2%(+57.2)#1,019 |
| 28. | 02878 | 60.9% | 27.6%(+33.3)#28 | 4.2%(+56.7)#1,043 |
| 29. | 02835 | 60.5% | 27.6%(+32.9)#29 | 4.2%(+56.3)#1,069 |
| 30. | 02813 | 60.0% | 27.6%(+32.4)#30 | 4.2%(+55.8)#1,099 |
| 31. | 02896 | 58.2% | 27.6%(+30.6)#31 | 4.2%(+54.0)#1,234 |
| 32. | 02817 | 55.5% | 27.6%(+27.9)#32 | 4.2%(+51.3)#1,430 |
| 33. | 02871 | 51.6% | 27.6%(+24.0)#33 | 4.2%(+47.4)#1,736 |
| 34. | 02816 | 47.8% | 27.6%(+20.2)#34 | 4.2%(+43.6)#1,985 |
| 35. | 02879 | 46.7% | 27.6%(+19.1)#35 | 4.2%(+42.5)#2,065 |
| 36. | 02873 | 44.8% | 27.6%(+17.2)#36 | 4.2%(+40.6)#2,201 |
| 37. | 02828 | 41.7% | 27.6%(+14.1)#37 | 4.2%(+37.5)#2,427 |
| 38. | 02891 | 41.1% | 27.6%(+13.5)#38 | 4.2%(+36.9)#2,475 |
| 39. | 02842 | 41.1% | 27.6%(+13.5)#39 | 4.2%(+36.9)#2,477 |
| 40. | 02917 | 38.3% | 27.6%(+10.7)#40 | 4.2%(+34.1)#2,686 |
| 41. | 02808 | 36.7% | 27.6%(+9.10)#41 | 4.2%(+32.5)#2,811 |
| 42. | 02809 | 35.3% | 27.6%(+7.70)#42 | 4.2%(+31.1)#2,919 |
| 43. | 02874 | 35.0% | 27.6%(+7.40)#43 | 4.2%(+30.8)#2,951 |
| 44. | 02919 | 34.2% | 27.6%(+6.60)#44 | 4.2%(+30.0)#3,018 |
| 45. | 02893 | 34.1% | 27.6%(+6.50)#45 | 4.2%(+29.9)#3,030 |
| 46. | 02885 | 31.2% | 27.6%(+3.60)#46 | 4.2%(+27.0)#3,243 |
| 47. | 02864 | 30.8% | 27.6%(+3.20)#47 | 4.2%(+26.6)#3,270 |
| 48. | 02888 | 29.1% | 27.6%(+1.50)#48 | 4.2%(+24.9)#3,400 |
| 49. | 02818 | 27.8% | 27.6%(+0.200)#49 | 4.2%(+23.6)#3,522 |
| 50. | 02916 | 27.8% | 27.6%(+0.200)#50 | 4.2%(+23.6)#3,524 |
| 51. | 02881 | 27.7% | 27.6%(+0.100)#51 | 4.2%(+23.5)#3,535 |
| 52. | 02882 | 26.4% | 27.6%(-1.20)#52 | 4.2%(+22.2)#3,636 |
| 53. | 02852 | 25.0% | 27.6%(-2.60)#53 | 4.2%(+20.8)#3,766 |
| 54. | 02806 | 24.3% | 27.6%(-3.30)#54 | 4.2%(+20.1)#3,833 |
| 55. | 02920 | 24.1% | 27.6%(-3.50)#55 | 4.2%(+19.9)#3,851 |
| 56. | 02840 | 23.7% | 27.6%(-3.90)#56 | 4.2%(+19.5)#3,890 |
| 57. | 02910 | 23.7% | 27.6%(-3.90)#57 | 4.2%(+19.5)#3,891 |
| 58. | 02865 | 22.6% | 27.6%(-5.00)#58 | 4.2%(+18.4)#4,007 |
| 59. | 02838 | 21.7% | 27.6%(-5.90)#59 | 4.2%(+17.5)#4,102 |
| 60. | 02914 | 21.2% | 27.6%(-6.40)#60 | 4.2%(+17.0)#4,148 |
| 61. | 02886 | 20.8% | 27.6%(-6.80)#61 | 4.2%(+16.6)#4,190 |
| 62. | 02915 | 20.7% | 27.6%(-6.90)#62 | 4.2%(+16.5)#4,208 |
| 63. | 02802 | 18.1% | 27.6%(-9.50)#63 | 4.2%(+13.9)#4,503 |
| 64. | 02861 | 17.2% | 27.6%(-10.4)#64 | 4.2%(+13.0)#4,634 |
| 65. | 02895 | 16.4% | 27.6%(-11.2)#65 | 4.2%(+12.2)#4,763 |
| 66. | 02876 | 16.0% | 27.6%(-11.6)#66 | 4.2%(+11.8)#4,835 |
| 67. | 02911 | 15.1% | 27.6%(-12.5)#67 | 4.2%(+10.9)#4,970 |
| 68. | 02889 | 14.9% | 27.6%(-12.7)#68 | 4.2%(+10.7)#5,000 |
| 69. | 02908 | 13.7% | 27.6%(-13.9)#69 | 4.2%(+9.50)#5,224 |
| 70. | 02906 | 11.9% | 27.6%(-15.7)#70 | 4.2%(+7.70)#5,591 |
| 71. | 02905 | 11.8% | 27.6%(-15.8)#71 | 4.2%(+7.60)#5,608 |
| 72. | 02921 | 11.8% | 27.6%(-15.8)#72 | 4.2%(+7.60)#5,612 |
| 73. | 02904 | 10.3% | 27.6%(-17.3)#73 | 4.2%(+6.10)#5,988 |
| 74. | 02860 | 7.8% | 27.6%(-19.8)#74 | 4.2%(+3.60)#6,773 |
| 75. | 02909 | 7.1% | 27.6%(-20.5)#75 | 4.2%(+2.90)#7,052 |
| 76. | 02907 | 5.7% | 27.6%(-21.9)#76 | 4.2%(+1.50)#7,712 |
| 77. | 02863 | 4.3% | 27.6%(-23.3)#77 | 4.2%(+0.100)#8,558 |
| 78. | 02903 | 2.6% | 27.6%(-25.0)#78 | 4.2%(-1.60)#10,114 |
1
Common Questions
What are the Top 10 Zip Codes with the Highest Percentage of Households Heated by Fuel Oil / Kerosene in Rhode Island?
Top 10 Zip Codes with the Highest Percentage of Households Heated by Fuel Oil / Kerosene in Rhode Island are:
What zip code has the Highest Percentage of Households Heated by Fuel Oil / Kerosene in Rhode Island?
02918 has the Highest Percentage of Households Heated by Fuel Oil / Kerosene in Rhode Island with 100.0%.
What is the Percentage of Households Heated by Fuel Oil / Kerosene in the State of Rhode Island?
Percentage of Households Heated by Fuel Oil / Kerosene in Rhode Island is 27.6%.
What is the Percentage of Households Heated by Fuel Oil / Kerosene in the United States?
Percentage of Households Heated by Fuel Oil / Kerosene in the United States is 4.2%.