Zip Codes with the Highest Percentage of Families with Income Below $10,000 in Chesterfield, MO
RELATED REPORTS & OPTIONS
Family Income | $0-10k
Chesterfield
Compare Zip Codes
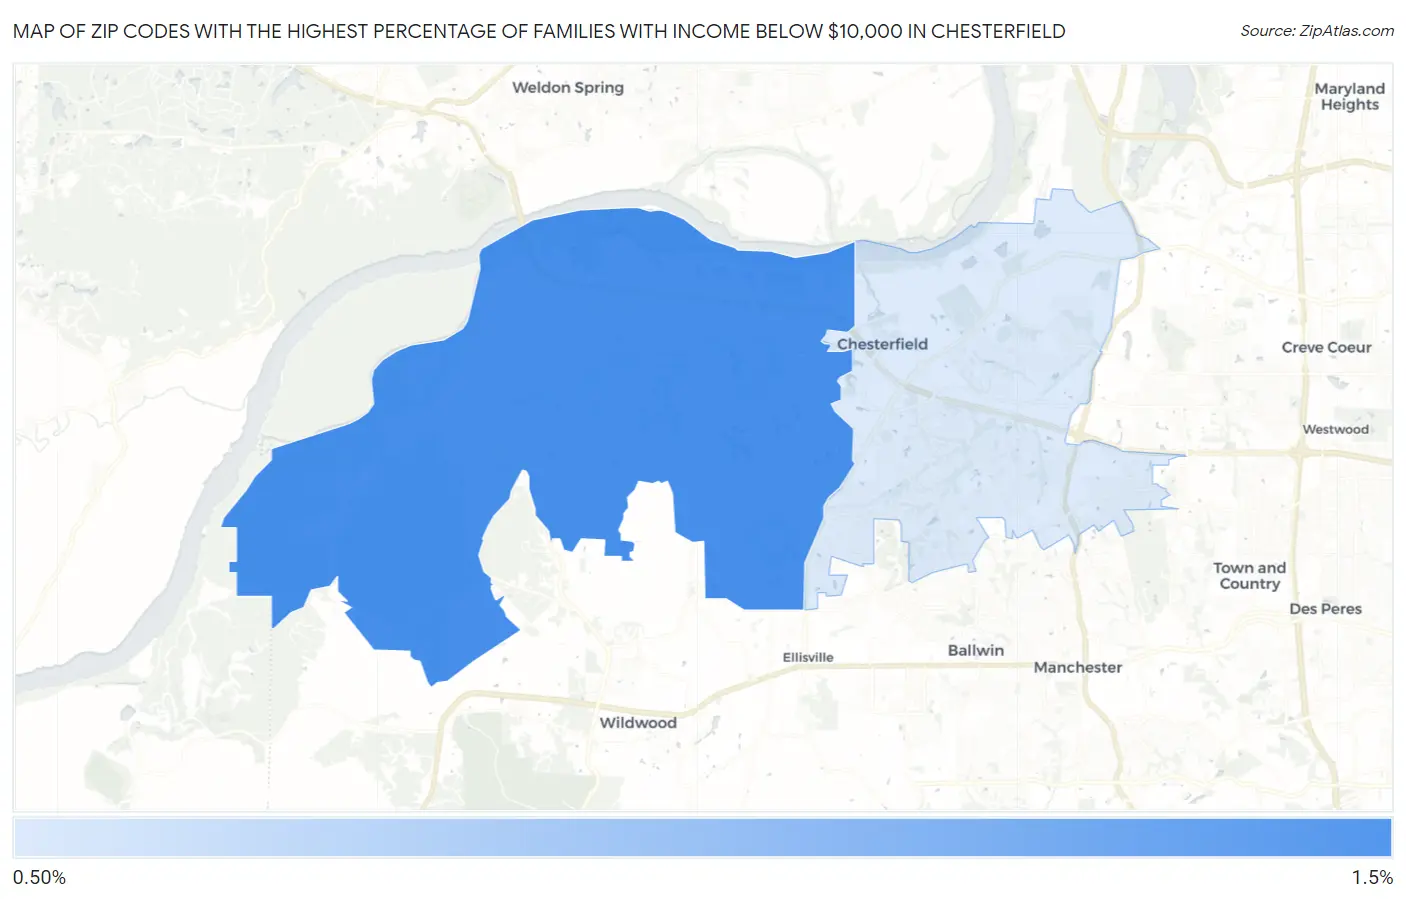
Map of Zip Codes with the Highest Percentage of Families with Income Below $10,000 in Chesterfield
1.1%
1.2%
Zip Codes with the Highest Percentage of Families with Income Below $10,000 in Chesterfield, MO
| Zip Code | Families with Income < $10k | vs State | vs National | |
| 1. | 63005 | 1.2% | 2.8%(-1.60)#607 | 3.1%(-1.90)#19,339 |
| 2. | 63017 | 1.1% | 2.8%(-1.70)#617 | 3.1%(-2.00)#19,720 |
1
Common Questions
What are the Top Zip Codes with the Highest Percentage of Families with Income Below $10,000 in Chesterfield, MO?
Top Zip Codes with the Highest Percentage of Families with Income Below $10,000 in Chesterfield, MO are:
What zip code has the Highest Percentage of Families with Income Below $10,000 in Chesterfield, MO?
63005 has the Highest Percentage of Families with Income Below $10,000 in Chesterfield, MO with 1.2%.
What is the Percentage of Families with Income Below $10,000 in Chesterfield, MO?
Percentage of Families with Income Below $10,000 in Chesterfield is 1.0%.
What is the Percentage of Families with Income Below $10,000 in Missouri?
Percentage of Families with Income Below $10,000 in Missouri is 2.8%.
What is the Percentage of Families with Income Below $10,000 in the United States?
Percentage of Families with Income Below $10,000 in the United States is 3.1%.