Zip Codes with the Highest Percentage of Population Employed in Food Preparation & Serving in Columbia, MO
RELATED REPORTS & OPTIONS
Food Preparation & Serving
Columbia
Compare Zip Codes
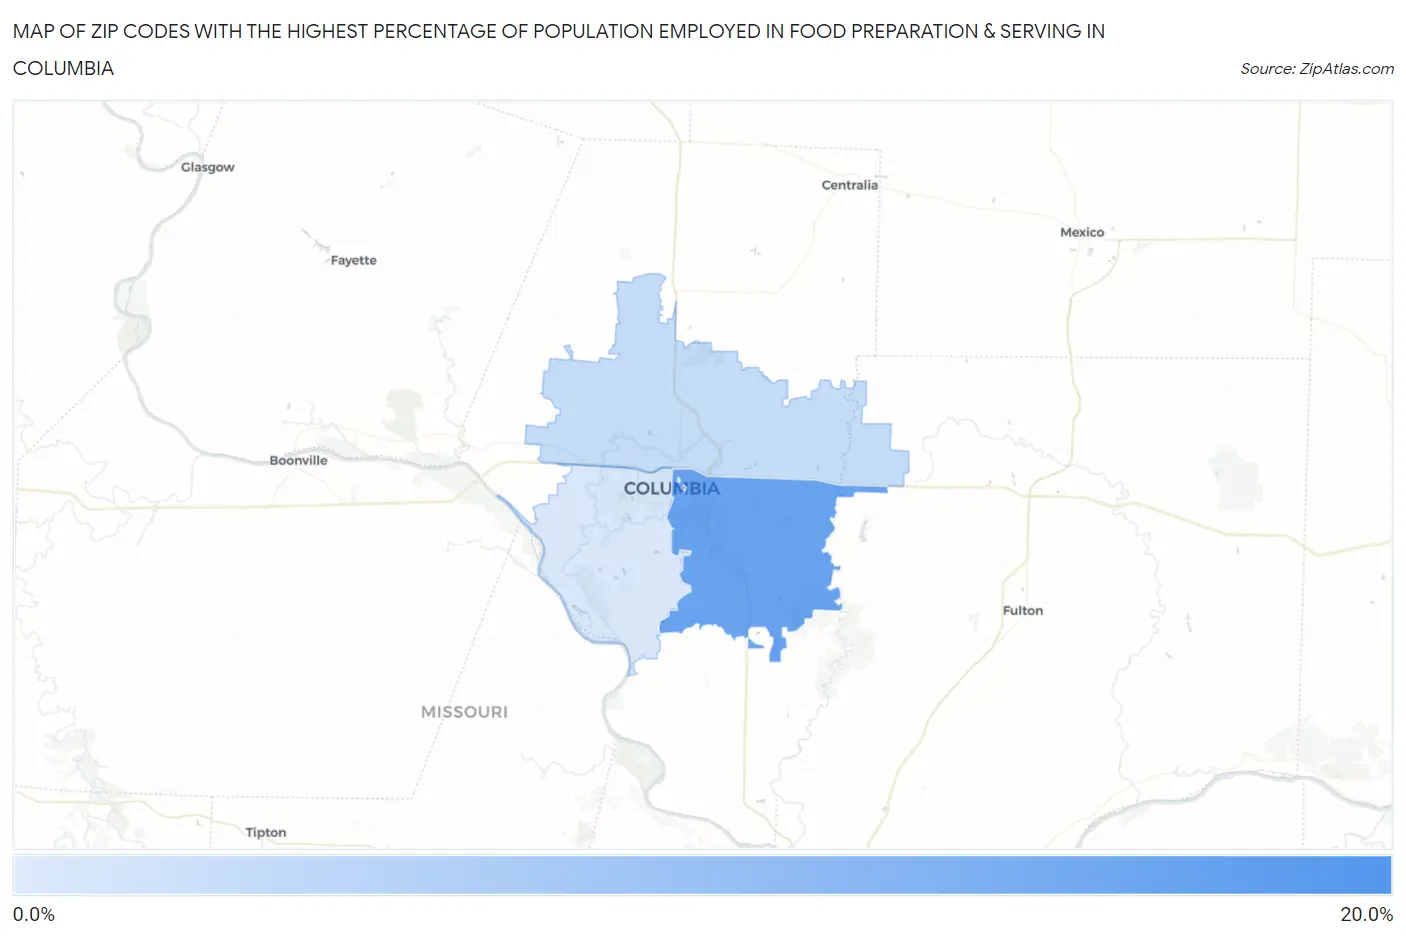
Map of Zip Codes with the Highest Percentage of Population Employed in Food Preparation & Serving in Columbia
4.4%
15.9%
Zip Codes with the Highest Percentage of Population Employed in Food Preparation & Serving in Columbia, MO
| Zip Code | % Employed | vs State | vs National | |
| 1. | 65216 | 15.9% | 5.2%(+10.6)#34 | 5.3%(+10.6)#877 |
| 2. | 65201 | 13.3% | 5.2%(+8.05)#52 | 5.3%(+8.00)#1,322 |
| 3. | 65202 | 6.1% | 5.2%(+0.906)#282 | 5.3%(+0.856)#8,898 |
| 4. | 65203 | 4.7% | 5.2%(-0.536)#418 | 5.3%(-0.586)#14,162 |
| 5. | 65215 | 4.4% | 5.2%(-0.840)#452 | 5.3%(-0.890)#15,442 |
1
Common Questions
What are the Top 3 Zip Codes with the Highest Percentage of Population Employed in Food Preparation & Serving in Columbia, MO?
Top 3 Zip Codes with the Highest Percentage of Population Employed in Food Preparation & Serving in Columbia, MO are:
What zip code has the Highest Percentage of Population Employed in Food Preparation & Serving in Columbia, MO?
65216 has the Highest Percentage of Population Employed in Food Preparation & Serving in Columbia, MO with 15.9%.
What is the Percentage of Population Employed in Food Preparation & Serving in Columbia, MO?
Percentage of Population Employed in Food Preparation & Serving in Columbia is 8.5%.
What is the Percentage of Population Employed in Food Preparation & Serving in Missouri?
Percentage of Population Employed in Food Preparation & Serving in Missouri is 5.2%.
What is the Percentage of Population Employed in Food Preparation & Serving in the United States?
Percentage of Population Employed in Food Preparation & Serving in the United States is 5.3%.