Monticello, MO Map & Demographics
Monticello Map
Monticello Overview
$22,903
PER CAPITA INCOME
$180,156
AVG FAMILY INCOME
$108,750
AVG HOUSEHOLD INCOME
2.7%
WAGE / INCOME GAP [ % ]
97.3¢/ $1
WAGE / INCOME GAP [ $ ]
0.33
INEQUALITY / GINI INDEX
309
TOTAL POPULATION
138
MALE POPULATION
171
FEMALE POPULATION
80.70
MALES / 100 FEMALES
123.91
FEMALES / 100 MALES
28.5
MEDIAN AGE
6.6
AVG FAMILY SIZE
6.3
AVG HOUSEHOLD SIZE
183
LABOR FORCE [ PEOPLE ]
79.9%
PERCENT IN LABOR FORCE
Monticello Zip Codes
Monticello Area Codes
Income in Monticello
Income Overview in Monticello
Per Capita Income in Monticello is $22,903, while median incomes of families and households are $180,156 and $108,750 respectively.
| Characteristic | Number | Measure |
| Per Capita Income | 309 | $22,903 |
| Median Family Income | 34 | $180,156 |
| Mean Family Income | 34 | $144,568 |
| Median Household Income | 46 | $108,750 |
| Mean Household Income | 46 | $119,613 |
| Income Deficit | 34 | $0 |
| Wage / Income Gap (%) | 309 | 2.67% |
| Wage / Income Gap ($) | 309 | 97.33¢ per $1 |
| Gini / Inequality Index | 309 | 0.33 |
Earnings by Sex in Monticello
Average Earnings in Monticello are $30,357, $29,741 for men and $30,556 for women, a difference of 2.7%.
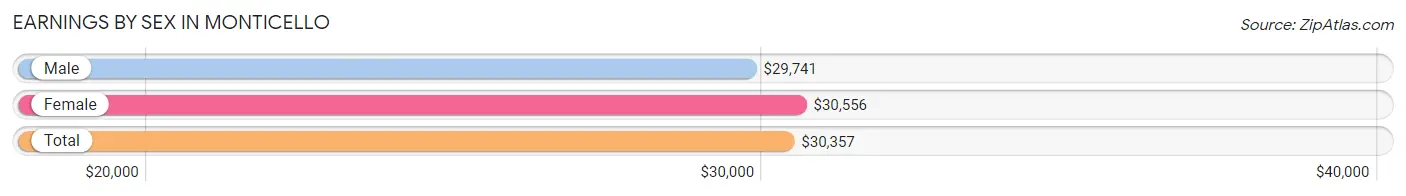
| Sex | Number | Average Earnings |
| Male | 68 (35.4%) | $29,741 |
| Female | 124 (64.6%) | $30,556 |
| Total | 192 (100.0%) | $30,357 |
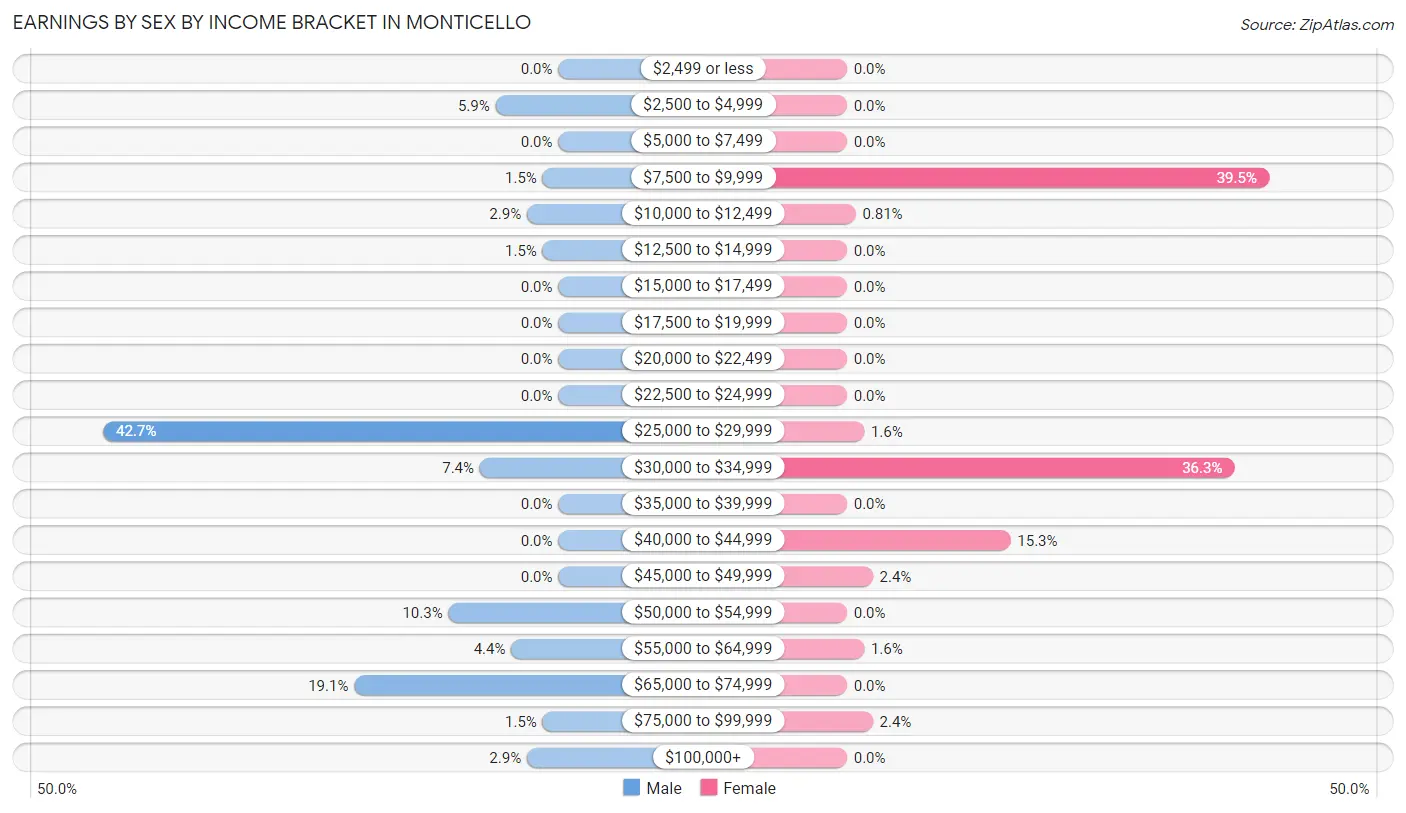
Earnings by Sex by Income Bracket in Monticello
The most common earnings brackets in Monticello are $25,000 to $29,999 for men (29 | 42.6%) and $7,500 to $9,999 for women (49 | 39.5%).
| Income | Male | Female |
| $2,499 or less | 0 (0.0%) | 0 (0.0%) |
| $2,500 to $4,999 | 4 (5.9%) | 0 (0.0%) |
| $5,000 to $7,499 | 0 (0.0%) | 0 (0.0%) |
| $7,500 to $9,999 | 1 (1.5%) | 49 (39.5%) |
| $10,000 to $12,499 | 2 (2.9%) | 1 (0.8%) |
| $12,500 to $14,999 | 1 (1.5%) | 0 (0.0%) |
| $15,000 to $17,499 | 0 (0.0%) | 0 (0.0%) |
| $17,500 to $19,999 | 0 (0.0%) | 0 (0.0%) |
| $20,000 to $22,499 | 0 (0.0%) | 0 (0.0%) |
| $22,500 to $24,999 | 0 (0.0%) | 0 (0.0%) |
| $25,000 to $29,999 | 29 (42.6%) | 2 (1.6%) |
| $30,000 to $34,999 | 5 (7.3%) | 45 (36.3%) |
| $35,000 to $39,999 | 0 (0.0%) | 0 (0.0%) |
| $40,000 to $44,999 | 0 (0.0%) | 19 (15.3%) |
| $45,000 to $49,999 | 0 (0.0%) | 3 (2.4%) |
| $50,000 to $54,999 | 7 (10.3%) | 0 (0.0%) |
| $55,000 to $64,999 | 3 (4.4%) | 2 (1.6%) |
| $65,000 to $74,999 | 13 (19.1%) | 0 (0.0%) |
| $75,000 to $99,999 | 1 (1.5%) | 3 (2.4%) |
| $100,000+ | 2 (2.9%) | 0 (0.0%) |
| Total | 68 (100.0%) | 124 (100.0%) |
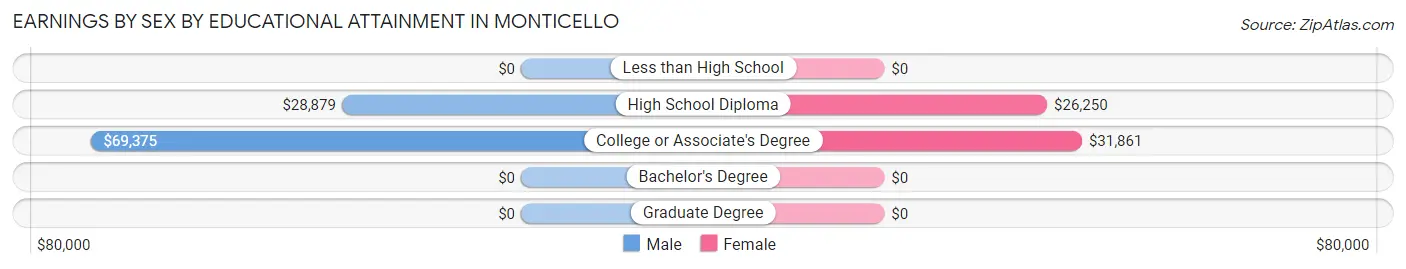
Earnings by Sex by Educational Attainment in Monticello
Average earnings in Monticello are $29,784 for men and $31,889 for women, a difference of 6.6%. Men with an educational attainment of college or associate's degree enjoy the highest average annual earnings of $69,375, while those with high school diploma education earn the least with $28,879. Women with an educational attainment of college or associate's degree earn the most with the average annual earnings of $31,861, while those with high school diploma education have the smallest earnings of $26,250.
| Educational Attainment | Male Income | Female Income |
| Less than High School | - | - |
| High School Diploma | $28,879 | $26,250 |
| College or Associate's Degree | $69,375 | $31,861 |
| Bachelor's Degree | - | - |
| Graduate Degree | - | - |
| Total | $29,784 | $31,889 |
Family Income in Monticello
Family Income Brackets in Monticello
According to the Monticello family income data, there are 16 families falling into the $150,000 to $199,999 income range, which is the most common income bracket and makes up 47.1% of all families.
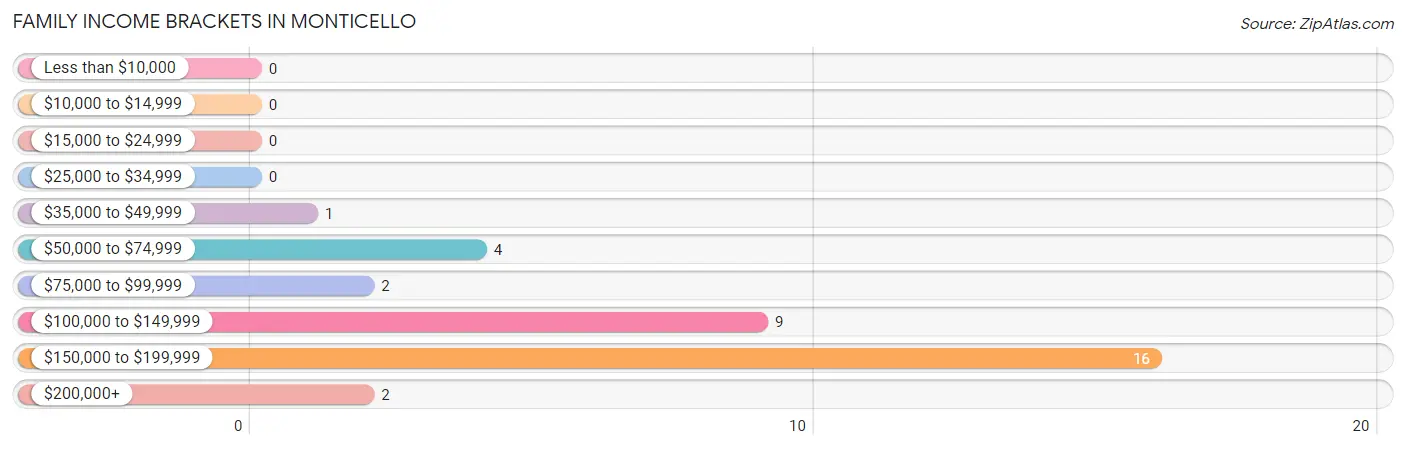
| Income Bracket | # Families | % Families |
| Less than $10,000 | 0 | 0.0% |
| $10,000 to $14,999 | 0 | 0.0% |
| $15,000 to $24,999 | 0 | 0.0% |
| $25,000 to $34,999 | 0 | 0.0% |
| $35,000 to $49,999 | 1 | 2.9% |
| $50,000 to $74,999 | 4 | 11.8% |
| $75,000 to $99,999 | 2 | 5.9% |
| $100,000 to $149,999 | 9 | 26.5% |
| $150,000 to $199,999 | 16 | 47.1% |
| $200,000+ | 2 | 5.9% |
Family Income by Famaliy Size in Monticello
2-person families (13 | 38.2%) account for the highest median family income in Monticello with $99,375 per family, while 2-person families (13 | 38.2%) have the highest median income of $49,688 per family member.
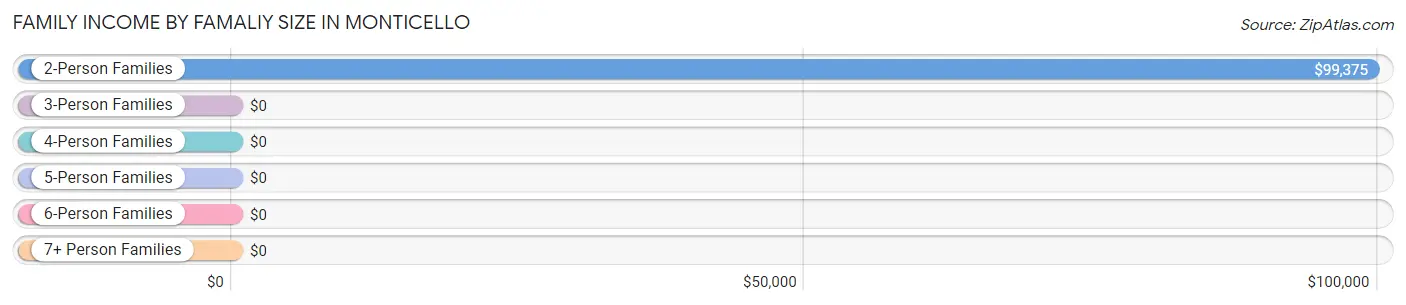
| Income Bracket | # Families | Median Income |
| 2-Person Families | 13 (38.2%) | $99,375 |
| 3-Person Families | 0 (0.0%) | $0 |
| 4-Person Families | 2 (5.9%) | $0 |
| 5-Person Families | 3 (8.8%) | $0 |
| 6-Person Families | 0 (0.0%) | $0 |
| 7+ Person Families | 16 (47.1%) | $0 |
| Total | 34 (100.0%) | $180,156 |
Family Income by Number of Earners in Monticello
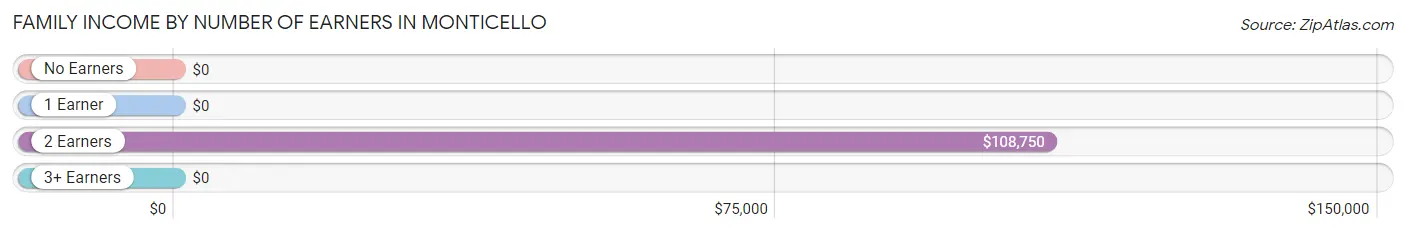
| Number of Earners | # Families | Median Income |
| No Earners | 1 (2.9%) | $0 |
| 1 Earner | 3 (8.8%) | $0 |
| 2 Earners | 14 (41.2%) | $108,750 |
| 3+ Earners | 16 (47.1%) | $0 |
| Total | 34 (100.0%) | $180,156 |
Household Income in Monticello
Household Income Brackets in Monticello
With 16 households falling in the category, the $150,000 to $199,999 income range is the most frequent in Monticello, accounting for 34.8% of all households.
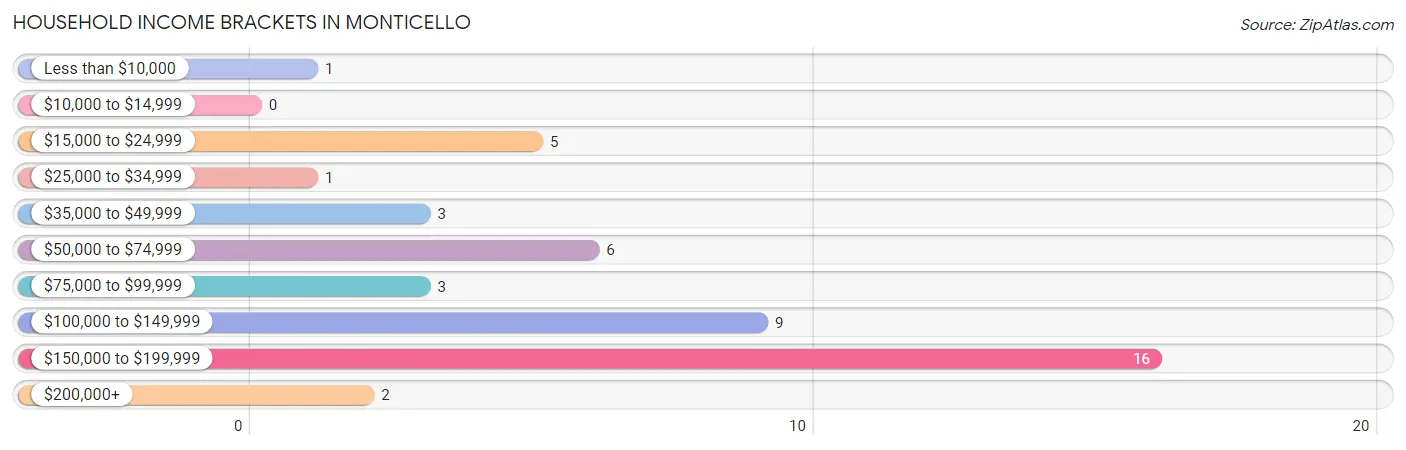
| Income Bracket | # Households | % Households |
| Less than $10,000 | 1 | 2.2% |
| $10,000 to $14,999 | 0 | 0.0% |
| $15,000 to $24,999 | 5 | 10.9% |
| $25,000 to $34,999 | 1 | 2.2% |
| $35,000 to $49,999 | 3 | 6.5% |
| $50,000 to $74,999 | 6 | 13.0% |
| $75,000 to $99,999 | 3 | 6.5% |
| $100,000 to $149,999 | 9 | 19.6% |
| $150,000 to $199,999 | 16 | 34.8% |
| $200,000+ | 2 | 4.3% |
Household Income by Householder Age in Monticello
The median household income in Monticello is $108,750, with the highest median household income of $190,625 found in the 45 to 64 years age bracket for the primary householder. A total of 28 households (60.9%) fall into this category.
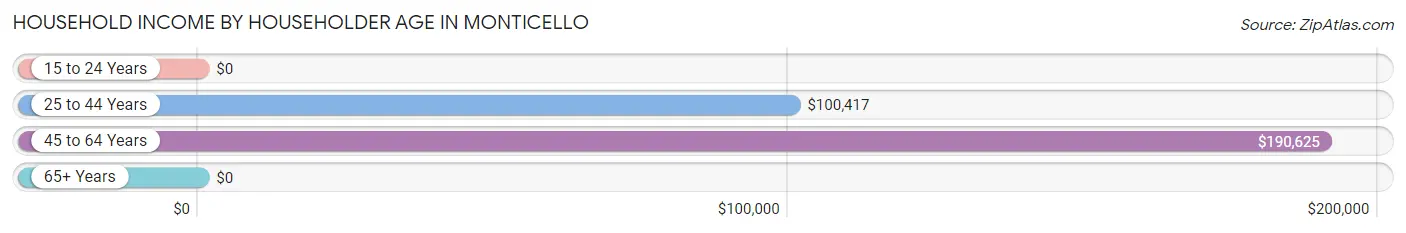
| Income Bracket | # Households | Median Income |
| 15 to 24 Years | 0 (0.0%) | $0 |
| 25 to 44 Years | 7 (15.2%) | $100,417 |
| 45 to 64 Years | 28 (60.9%) | $190,625 |
| 65+ Years | 11 (23.9%) | $0 |
| Total | 46 (100.0%) | $108,750 |
Poverty in Monticello
Income Below Poverty by Sex and Age in Monticello
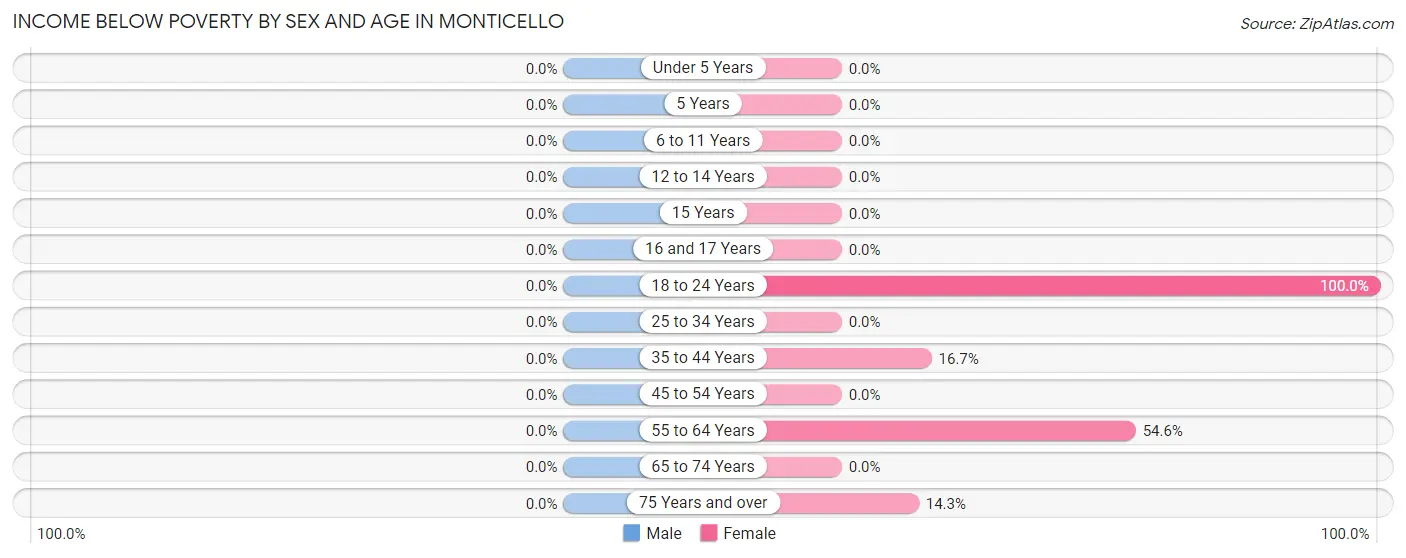
| Age Bracket | Male | Female |
| Under 5 Years | 0 (0.0%) | 0 (0.0%) |
| 5 Years | 0 (0.0%) | 0 (0.0%) |
| 6 to 11 Years | 0 (0.0%) | 0 (0.0%) |
| 12 to 14 Years | 0 (0.0%) | 0 (0.0%) |
| 15 Years | 0 (0.0%) | 0 (0.0%) |
| 16 and 17 Years | 0 (0.0%) | 0 (0.0%) |
| 18 to 24 Years | 0 (0.0%) | 48 (100.0%) |
| 25 to 34 Years | 0 (0.0%) | 0 (0.0%) |
| 35 to 44 Years | 0 (0.0%) | 1 (16.7%) |
| 45 to 54 Years | 0 (0.0%) | 0 (0.0%) |
| 55 to 64 Years | 0 (0.0%) | 6 (54.5%) |
| 65 to 74 Years | 0 (0.0%) | 0 (0.0%) |
| 75 Years and over | 0 (0.0%) | 1 (14.3%) |
| Total | 0 (0.0%) | 56 (33.1%) |
Income Above Poverty by Sex and Age in Monticello
According to the poverty statistics in Monticello, males aged under 5 years and females aged under 5 years are the age groups that are most secure financially, with 100.0% of males and 100.0% of females in these age groups living above the poverty line.
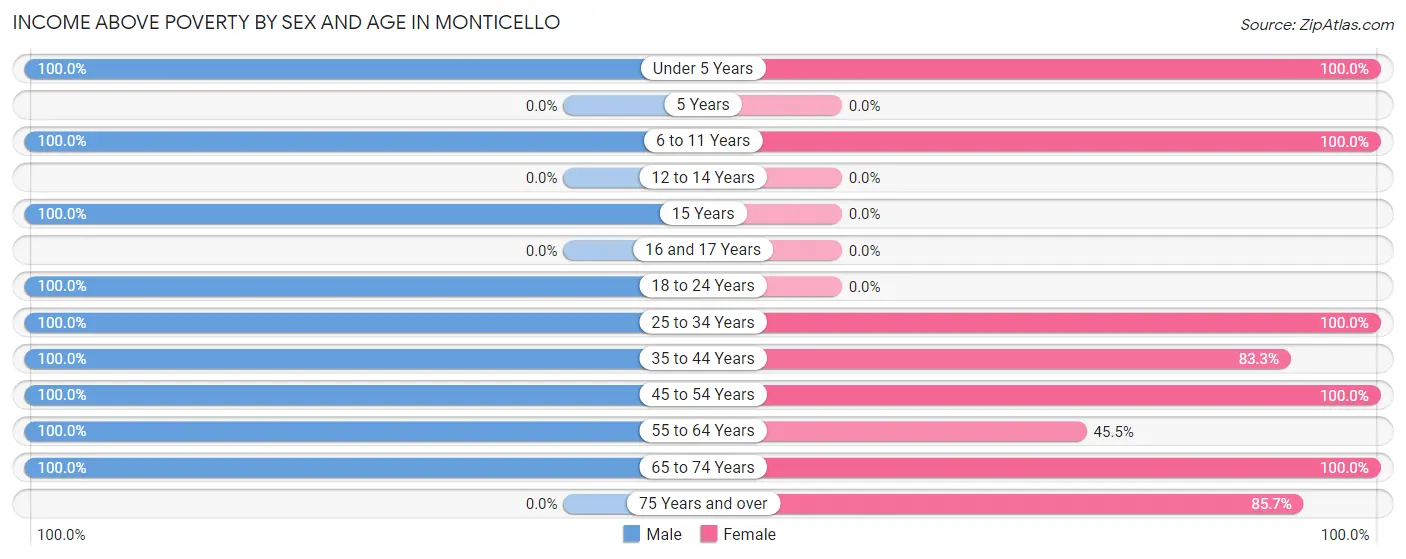
| Age Bracket | Male | Female |
| Under 5 Years | 17 (100.0%) | 25 (100.0%) |
| 5 Years | 0 (0.0%) | 0 (0.0%) |
| 6 to 11 Years | 31 (100.0%) | 3 (100.0%) |
| 12 to 14 Years | 0 (0.0%) | 0 (0.0%) |
| 15 Years | 4 (100.0%) | 0 (0.0%) |
| 16 and 17 Years | 0 (0.0%) | 0 (0.0%) |
| 18 to 24 Years | 7 (100.0%) | 0 (0.0%) |
| 25 to 34 Years | 30 (100.0%) | 46 (100.0%) |
| 35 to 44 Years | 5 (100.0%) | 5 (83.3%) |
| 45 to 54 Years | 3 (100.0%) | 19 (100.0%) |
| 55 to 64 Years | 16 (100.0%) | 5 (45.5%) |
| 65 to 74 Years | 10 (100.0%) | 4 (100.0%) |
| 75 Years and over | 0 (0.0%) | 6 (85.7%) |
| Total | 123 (100.0%) | 113 (66.9%) |
Income Below Poverty Among Married-Couple Families in Monticello
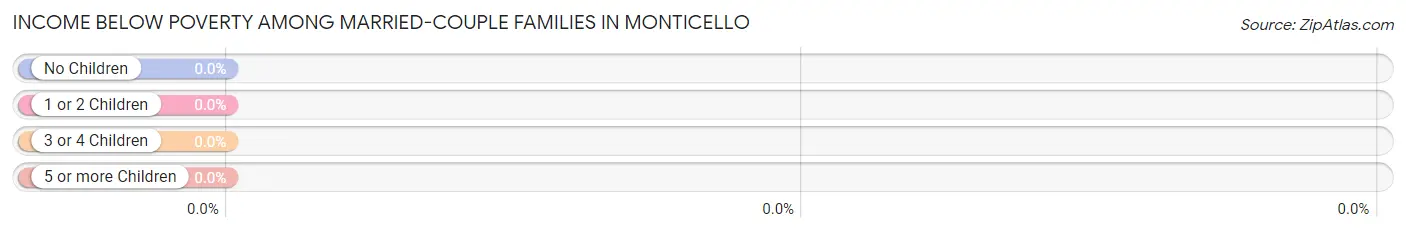
| Children | Above Poverty | Below Poverty |
| No Children | 11 (100.0%) | 0 (0.0%) |
| 1 or 2 Children | 0 (0.0%) | 0 (0.0%) |
| 3 or 4 Children | 19 (100.0%) | 0 (0.0%) |
| 5 or more Children | 0 (0.0%) | 0 (0.0%) |
| Total | 30 (100.0%) | 0 (0.0%) |
Income Below Poverty Among Single-Parent Households in Monticello
| Children | Single Father | Single Mother |
| No Children | 0 (0.0%) | 0 (0.0%) |
| 1 or 2 Children | 0 (0.0%) | 0 (0.0%) |
| 3 or 4 Children | 0 (0.0%) | 0 (0.0%) |
| 5 or more Children | 0 (0.0%) | 0 (0.0%) |
| Total | 0 (0.0%) | 0 (0.0%) |
Income Below Poverty Among Married-Couple vs Single-Parent Households in Monticello
| Children | Married-Couple Families | Single-Parent Households |
| No Children | 0 (0.0%) | 0 (0.0%) |
| 1 or 2 Children | 0 (0.0%) | 0 (0.0%) |
| 3 or 4 Children | 0 (0.0%) | 0 (0.0%) |
| 5 or more Children | 0 (0.0%) | 0 (0.0%) |
| Total | 0 (0.0%) | 0 (0.0%) |
Race in Monticello
The most populous races in Monticello are White / Caucasian (281 | 90.9%), Two or more Races (17 | 5.5%), and Black / African American (11 | 3.6%).
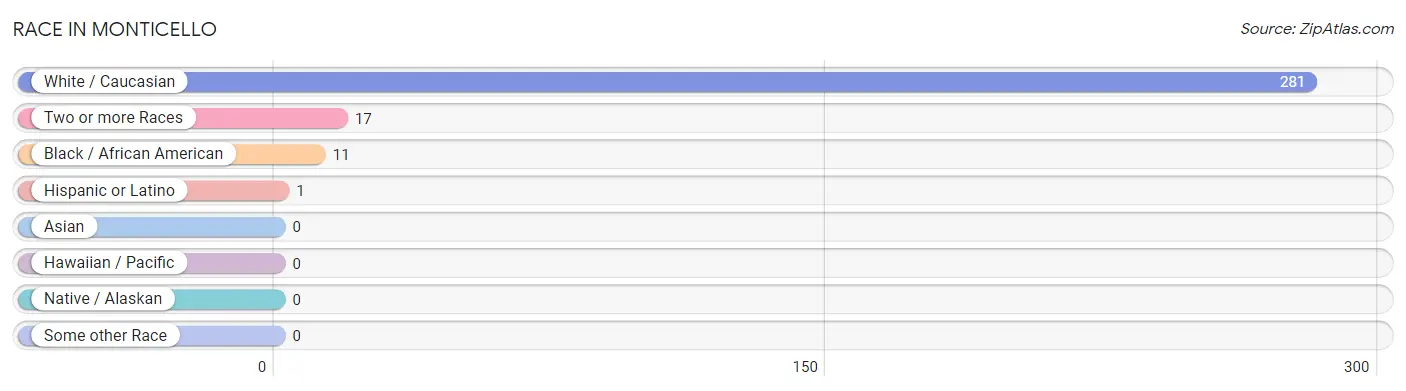
| Race | # Population | % Population |
| Asian | 0 | 0.0% |
| Black / African American | 11 | 3.6% |
| Hawaiian / Pacific | 0 | 0.0% |
| Hispanic or Latino | 1 | 0.3% |
| Native / Alaskan | 0 | 0.0% |
| White / Caucasian | 281 | 90.9% |
| Two or more Races | 17 | 5.5% |
| Some other Race | 0 | 0.0% |
| Total | 309 | 100.0% |
Ancestry in Monticello
The most populous ancestries reported in Monticello are American (227 | 73.5%), German (25 | 8.1%), English (8 | 2.6%), Irish (3 | 1.0%), and African (2 | 0.6%), together accounting for 85.8% of all Monticello residents.
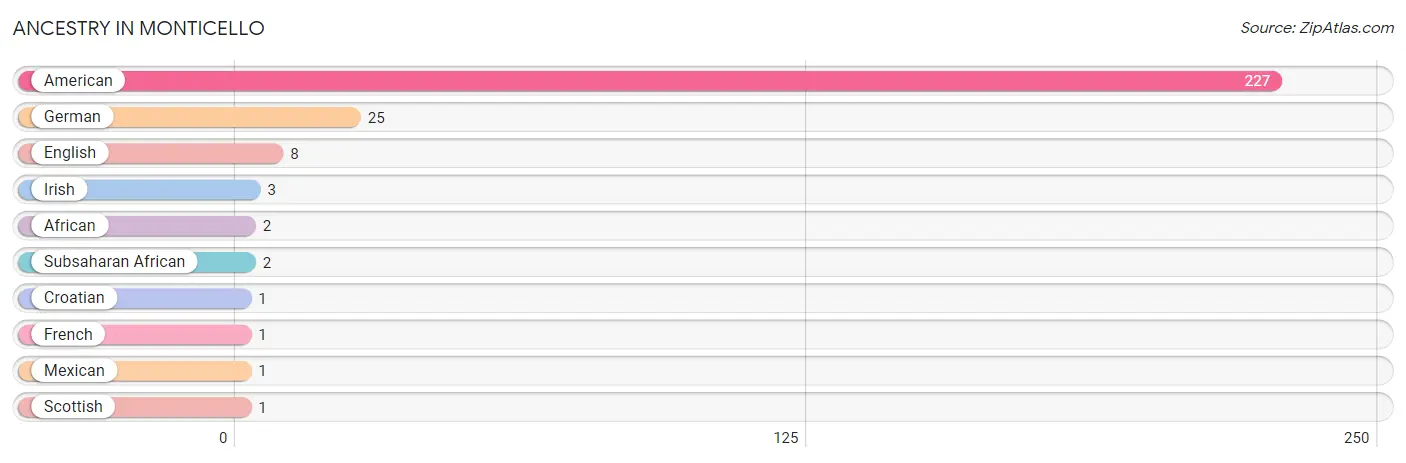
| Ancestry | # Population | % Population |
| African | 2 | 0.6% |
| American | 227 | 73.5% |
| Croatian | 1 | 0.3% |
| English | 8 | 2.6% |
| French | 1 | 0.3% |
| German | 25 | 8.1% |
| Irish | 3 | 1.0% |
| Mexican | 1 | 0.3% |
| Scottish | 1 | 0.3% |
| Subsaharan African | 2 | 0.6% | View All 10 Rows |
Immigrants in Monticello

| Immigration Origin | # Population | % Population | View All 0 Rows |
Sex and Age in Monticello
Sex and Age in Monticello
The most populous age groups in Monticello are 25 to 29 Years (33 | 23.9%) for men and 20 to 24 Years (48 | 28.1%) for women.
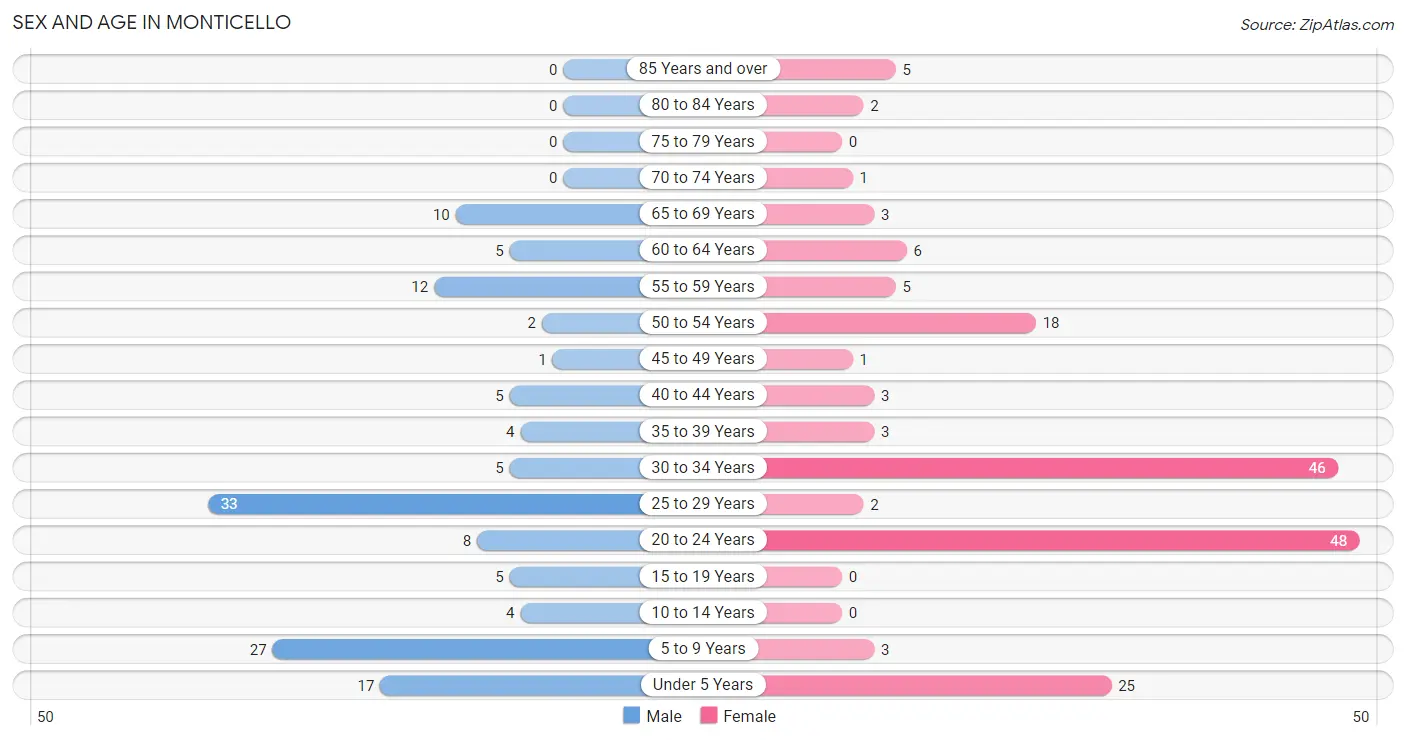
| Age Bracket | Male | Female |
| Under 5 Years | 17 (12.3%) | 25 (14.6%) |
| 5 to 9 Years | 27 (19.6%) | 3 (1.8%) |
| 10 to 14 Years | 4 (2.9%) | 0 (0.0%) |
| 15 to 19 Years | 5 (3.6%) | 0 (0.0%) |
| 20 to 24 Years | 8 (5.8%) | 48 (28.1%) |
| 25 to 29 Years | 33 (23.9%) | 2 (1.2%) |
| 30 to 34 Years | 5 (3.6%) | 46 (26.9%) |
| 35 to 39 Years | 4 (2.9%) | 3 (1.8%) |
| 40 to 44 Years | 5 (3.6%) | 3 (1.8%) |
| 45 to 49 Years | 1 (0.7%) | 1 (0.6%) |
| 50 to 54 Years | 2 (1.5%) | 18 (10.5%) |
| 55 to 59 Years | 12 (8.7%) | 5 (2.9%) |
| 60 to 64 Years | 5 (3.6%) | 6 (3.5%) |
| 65 to 69 Years | 10 (7.2%) | 3 (1.8%) |
| 70 to 74 Years | 0 (0.0%) | 1 (0.6%) |
| 75 to 79 Years | 0 (0.0%) | 0 (0.0%) |
| 80 to 84 Years | 0 (0.0%) | 2 (1.2%) |
| 85 Years and over | 0 (0.0%) | 5 (2.9%) |
| Total | 138 (100.0%) | 171 (100.0%) |
Families and Households in Monticello
Median Family Size in Monticello
The median family size in Monticello is 6.62 persons per family, with single male/father families (2 | 5.9%) accounting for the largest median family size of 8 persons per family. On the other hand, single female/mother families (2 | 5.9%) represent the smallest median family size with 2.50 persons per family.
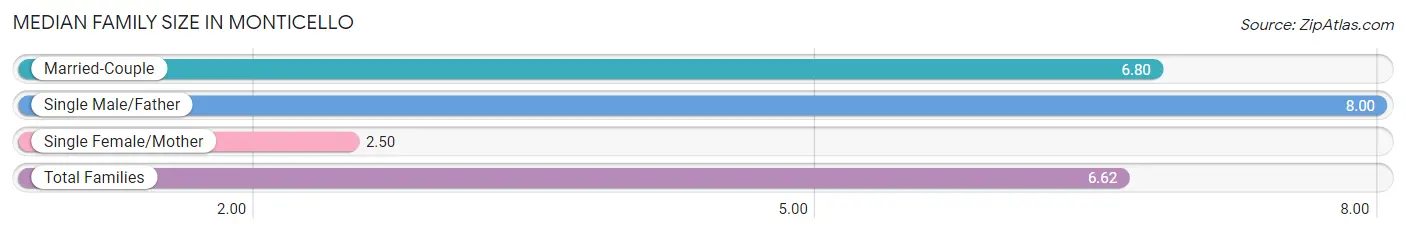
| Family Type | # Families | Family Size |
| Married-Couple | 30 (88.2%) | 6.80 |
| Single Male/Father | 2 (5.9%) | 8.00 |
| Single Female/Mother | 2 (5.9%) | 2.50 |
| Total Families | 34 (100.0%) | 6.62 |
Median Household Size in Monticello
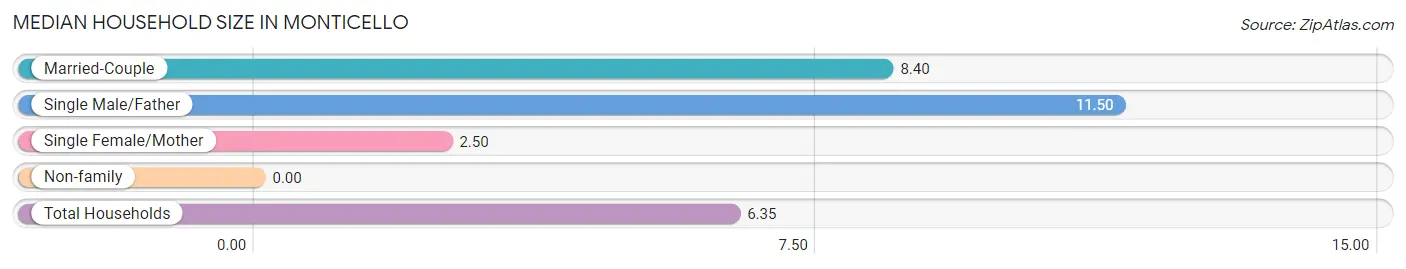
| Household Type | # Households | Household Size |
| Married-Couple | 30 (65.2%) | 8.40 |
| Single Male/Father | 2 (4.3%) | 11.50 |
| Single Female/Mother | 2 (4.3%) | 2.50 |
| Non-family | 12 (26.1%) | - |
| Total Households | 46 (100.0%) | 6.35 |
Household Size by Marriage Status in Monticello
Out of a total of 46 households in Monticello, 34 (73.9%) are family households, while 12 (26.1%) are nonfamily households. The most numerous type of family households are 7+ person households, comprising 16, and the most common type of nonfamily households are 1-person households, comprising 12.
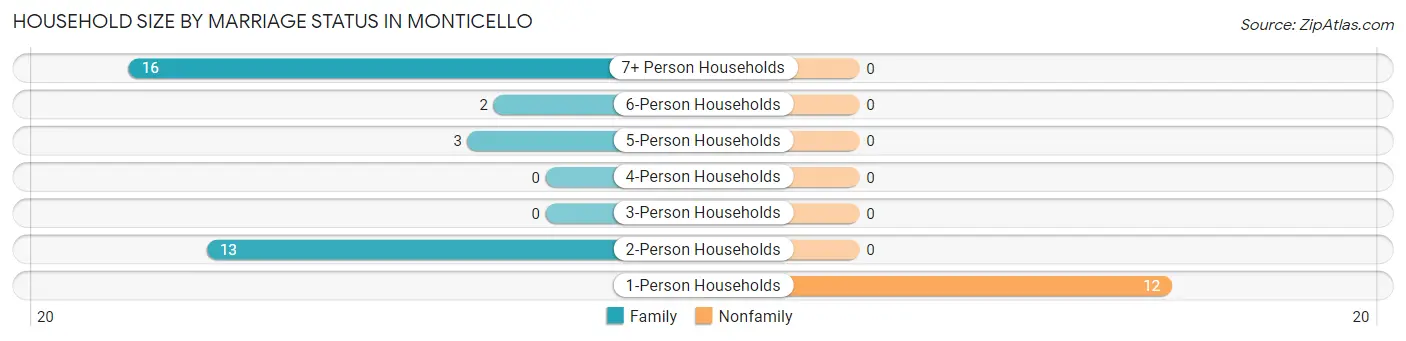
| Household Size | Family Households | Nonfamily Households |
| 1-Person Households | - | 12 (26.1%) |
| 2-Person Households | 13 (28.3%) | 0 (0.0%) |
| 3-Person Households | 0 (0.0%) | 0 (0.0%) |
| 4-Person Households | 0 (0.0%) | 0 (0.0%) |
| 5-Person Households | 3 (6.5%) | 0 (0.0%) |
| 6-Person Households | 2 (4.3%) | 0 (0.0%) |
| 7+ Person Households | 16 (34.8%) | 0 (0.0%) |
| Total | 34 (73.9%) | 12 (26.1%) |
Female Fertility in Monticello
Fertility by Age in Monticello
| Age Bracket | Women with Births | Births / 1,000 Women |
| 15 to 19 years | 0 (0.0%) | 0.0 |
| 20 to 34 years | 0 (0.0%) | 0.0 |
| 35 to 50 years | 0 (0.0%) | 0.0 |
| Total | 0 (0.0%) | 0.0 |
Fertility by Age by Marriage Status in Monticello
| Age Bracket | Married | Unmarried |
| 15 to 19 years | 0 (0.0%) | 0 (0.0%) |
| 20 to 34 years | 0 (0.0%) | 0 (0.0%) |
| 35 to 50 years | 0 (0.0%) | 0 (0.0%) |
| Total | 0 (0.0%) | 0 (0.0%) |
Fertility by Education in Monticello
| Educational Attainment | Women with Births | Births / 1,000 Women |
| Less than High School | 0 (0.0%) | 0.0 |
| High School Diploma | 0 (0.0%) | 0.0 |
| College or Associate's Degree | 0 (0.0%) | 0.0 |
| Bachelor's Degree | 0 (0.0%) | 0.0 |
| Graduate Degree | 0 (0.0%) | 0.0 |
| Total | 0 (0.0%) | 0.0 |
Fertility by Education by Marriage Status in Monticello
| Educational Attainment | Married | Unmarried |
| Less than High School | 0 (0.0%) | 0 (0.0%) |
| High School Diploma | 0 (0.0%) | 0 (0.0%) |
| College or Associate's Degree | 0 (0.0%) | 0 (0.0%) |
| Bachelor's Degree | 0 (0.0%) | 0 (0.0%) |
| Graduate Degree | 0 (0.0%) | 0 (0.0%) |
| Total | 0 (0.0%) | 0 (0.0%) |
Employment Characteristics in Monticello
Employment by Class of Employer in Monticello
Among the 183 employed individuals in Monticello, private company employees (148 | 80.9%), not-for-profit organizations (20 | 10.9%), and self-employed (not incorporated) (6 | 3.3%) make up the most common classes of employment.
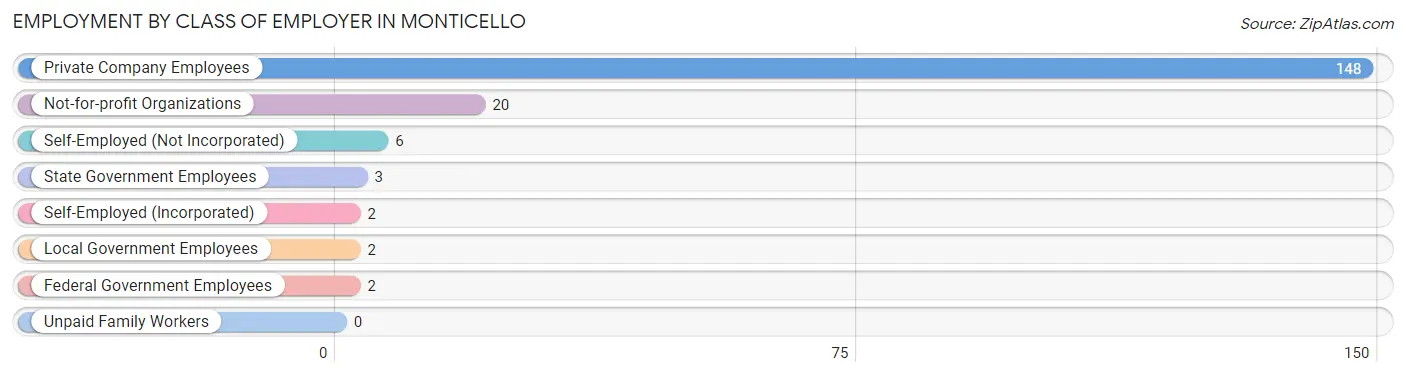
| Employer Class | # Employees | % Employees |
| Private Company Employees | 148 | 80.9% |
| Self-Employed (Incorporated) | 2 | 1.1% |
| Self-Employed (Not Incorporated) | 6 | 3.3% |
| Not-for-profit Organizations | 20 | 10.9% |
| Local Government Employees | 2 | 1.1% |
| State Government Employees | 3 | 1.6% |
| Federal Government Employees | 2 | 1.1% |
| Unpaid Family Workers | 0 | 0.0% |
| Total | 183 | 100.0% |
Employment Status by Age in Monticello
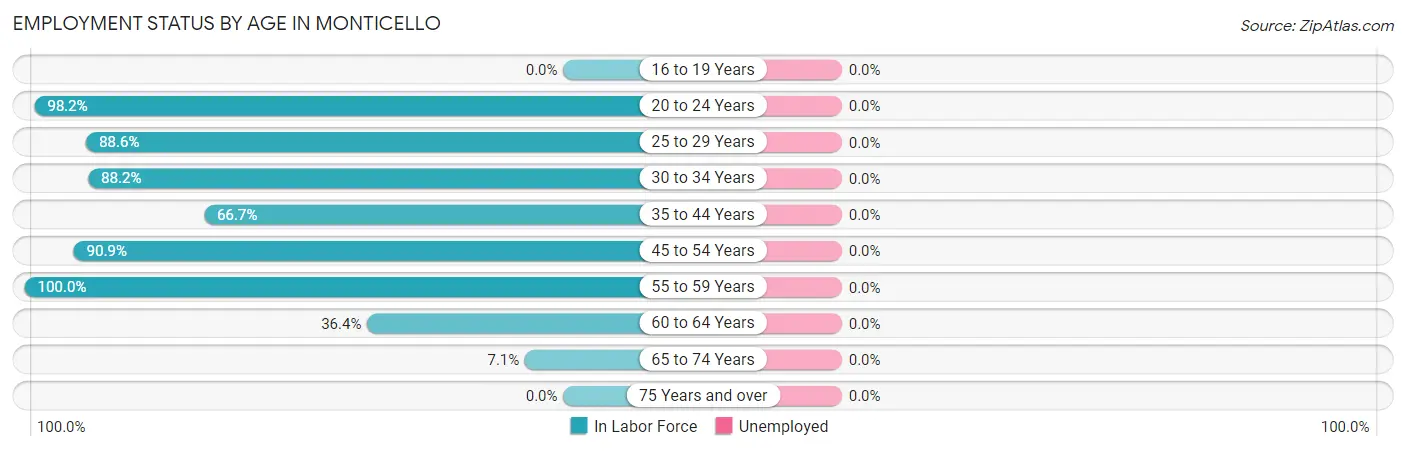
| Age Bracket | In Labor Force | Unemployed |
| 16 to 19 Years | 0 (0.0%) | 0 (0.0%) |
| 20 to 24 Years | 55 (98.2%) | 0 (0.0%) |
| 25 to 29 Years | 31 (88.6%) | 0 (0.0%) |
| 30 to 34 Years | 45 (88.2%) | 0 (0.0%) |
| 35 to 44 Years | 10 (66.7%) | 0 (0.0%) |
| 45 to 54 Years | 20 (90.9%) | 0 (0.0%) |
| 55 to 59 Years | 17 (100.0%) | 0 (0.0%) |
| 60 to 64 Years | 4 (36.4%) | 0 (0.0%) |
| 65 to 74 Years | 1 (7.1%) | 0 (0.0%) |
| 75 Years and over | 0 (0.0%) | 0 (0.0%) |
| Total | 183 (79.9%) | 0 (0.0%) |
Employment Status by Educational Attainment in Monticello
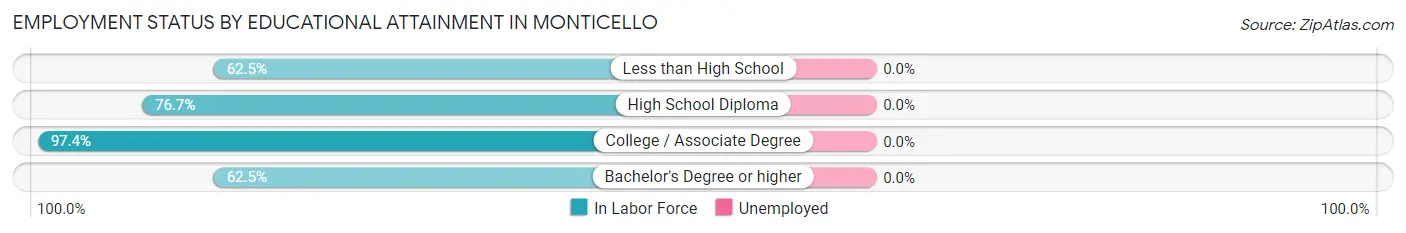
| Educational Attainment | In Labor Force | Unemployed |
| Less than High School | 10 (62.5%) | 0 (0.0%) |
| High School Diploma | 33 (76.7%) | 0 (0.0%) |
| College / Associate Degree | 74 (97.4%) | 0 (0.0%) |
| Bachelor's Degree or higher | 10 (62.5%) | 0 (0.0%) |
| Total | 127 (84.1%) | 0 (0.0%) |
Employment Occupations by Sex in Monticello
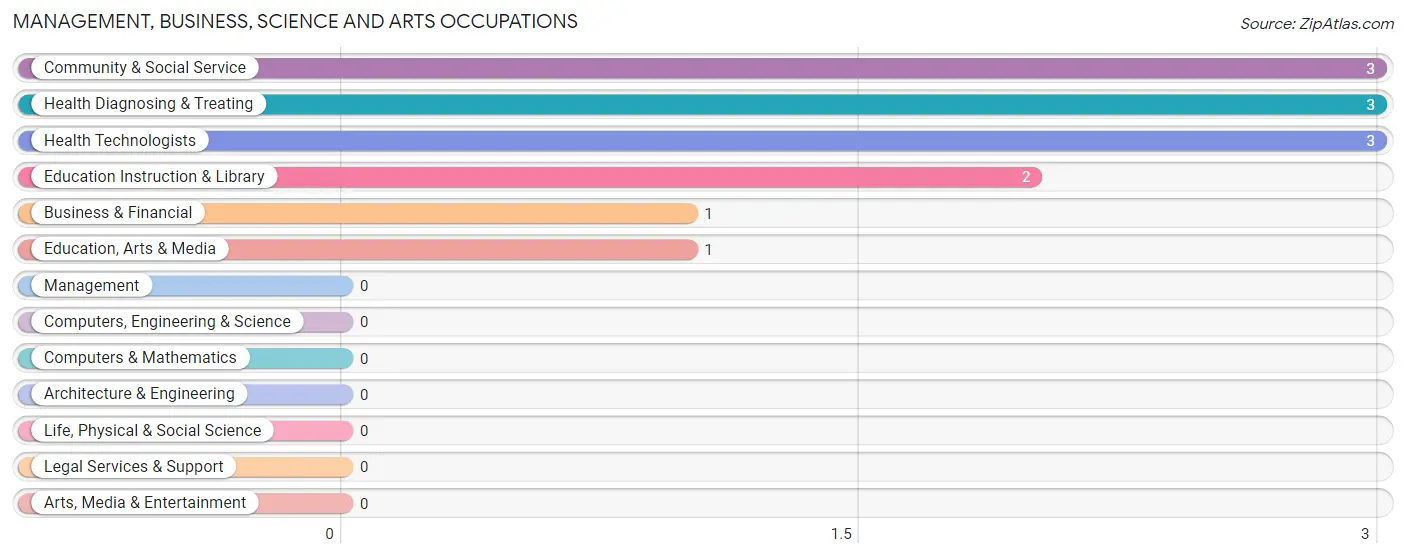
Management, Business, Science and Arts Occupations
The most common Management, Business, Science and Arts occupations in Monticello are Community & Social Service (3 | 1.6%), Health Diagnosing & Treating (3 | 1.6%), Health Technologists (3 | 1.6%), Education Instruction & Library (2 | 1.1%), and Business & Financial (1 | 0.5%).
Management, Business, Science and Arts Occupations by Sex
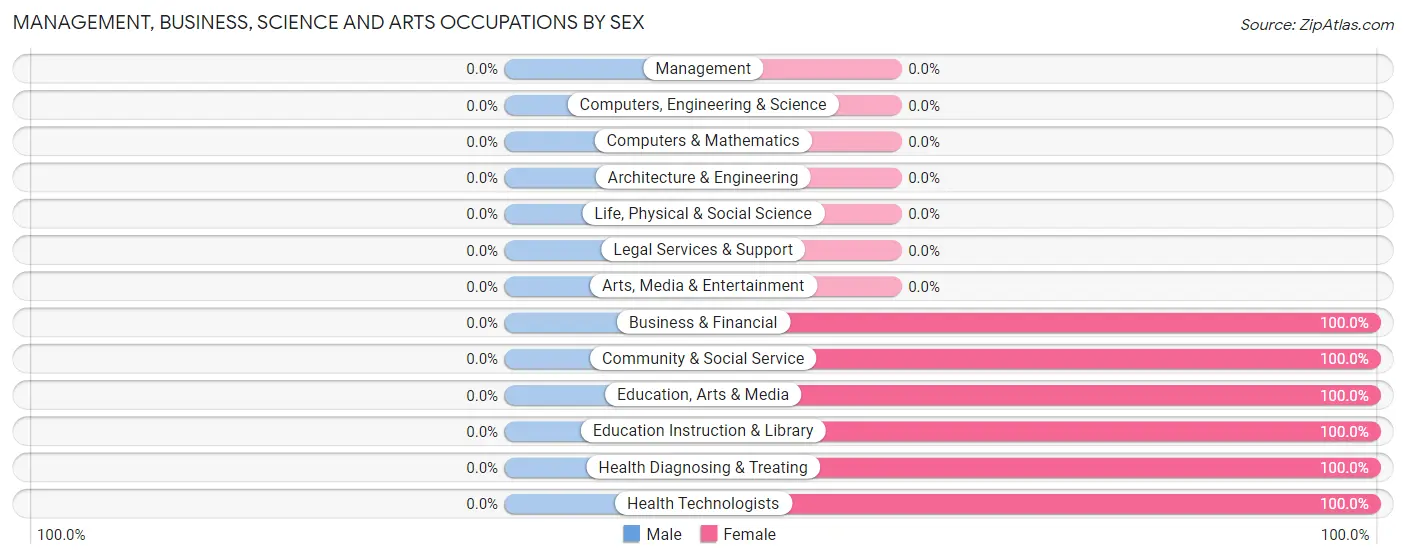
| Occupation | Male | Female |
| Management | 0 (0.0%) | 0 (0.0%) |
| Business & Financial | 0 (0.0%) | 1 (100.0%) |
| Computers, Engineering & Science | 0 (0.0%) | 0 (0.0%) |
| Computers & Mathematics | 0 (0.0%) | 0 (0.0%) |
| Architecture & Engineering | 0 (0.0%) | 0 (0.0%) |
| Life, Physical & Social Science | 0 (0.0%) | 0 (0.0%) |
| Community & Social Service | 0 (0.0%) | 3 (100.0%) |
| Education, Arts & Media | 0 (0.0%) | 1 (100.0%) |
| Legal Services & Support | 0 (0.0%) | 0 (0.0%) |
| Education Instruction & Library | 0 (0.0%) | 2 (100.0%) |
| Arts, Media & Entertainment | 0 (0.0%) | 0 (0.0%) |
| Health Diagnosing & Treating | 0 (0.0%) | 3 (100.0%) |
| Health Technologists | 0 (0.0%) | 3 (100.0%) |
| Total (Category) | 0 (0.0%) | 7 (100.0%) |
| Total (Overall) | 61 (33.3%) | 122 (66.7%) |
Services Occupations
The most common Services occupations in Monticello are Food Preparation & Serving (49 | 26.8%), and Healthcare Support (4 | 2.2%).
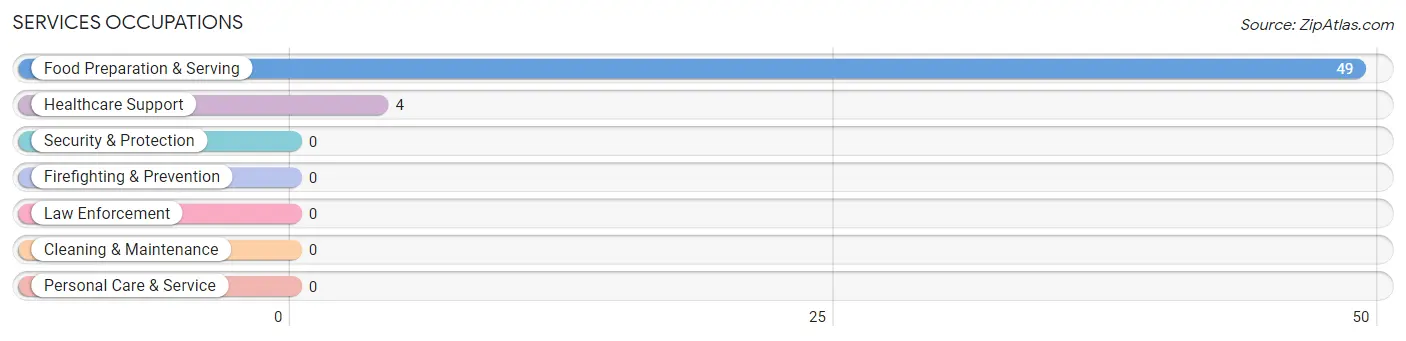
Services Occupations by Sex
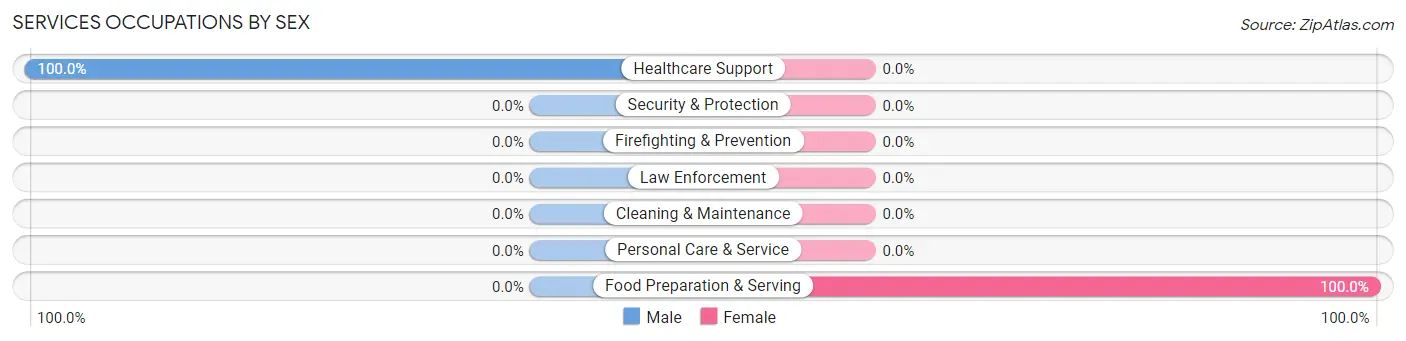
| Occupation | Male | Female |
| Healthcare Support | 4 (100.0%) | 0 (0.0%) |
| Security & Protection | 0 (0.0%) | 0 (0.0%) |
| Firefighting & Prevention | 0 (0.0%) | 0 (0.0%) |
| Law Enforcement | 0 (0.0%) | 0 (0.0%) |
| Food Preparation & Serving | 0 (0.0%) | 49 (100.0%) |
| Cleaning & Maintenance | 0 (0.0%) | 0 (0.0%) |
| Personal Care & Service | 0 (0.0%) | 0 (0.0%) |
| Total (Category) | 4 (7.5%) | 49 (92.4%) |
| Total (Overall) | 61 (33.3%) | 122 (66.7%) |
Sales and Office Occupations
The most common Sales and Office occupations in Monticello are , and Office & Administration (67 | 36.6%).
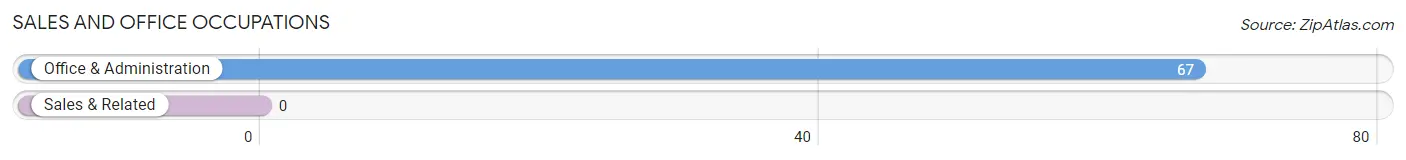
Sales and Office Occupations by Sex
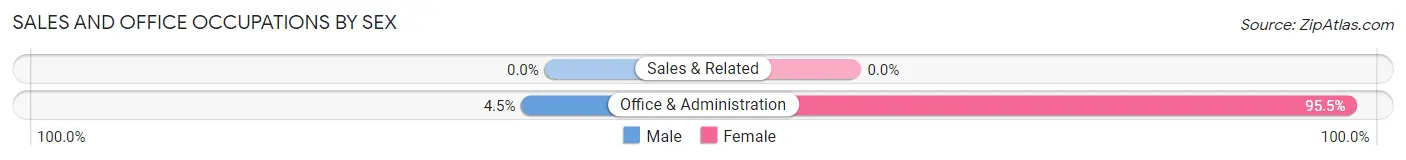
| Occupation | Male | Female |
| Sales & Related | 0 (0.0%) | 0 (0.0%) |
| Office & Administration | 3 (4.5%) | 64 (95.5%) |
| Total (Category) | 3 (4.5%) | 64 (95.5%) |
| Total (Overall) | 61 (33.3%) | 122 (66.7%) |
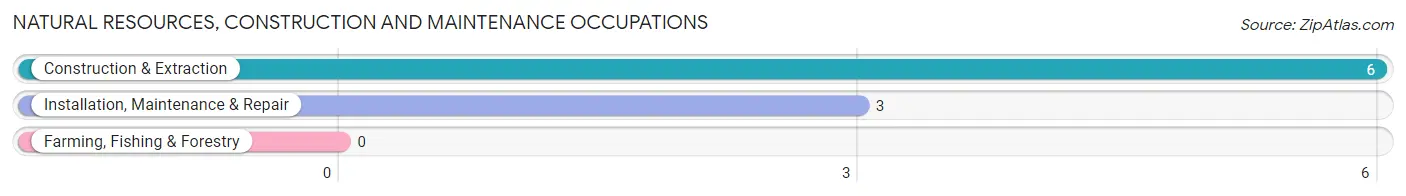
Natural Resources, Construction and Maintenance Occupations
The most common Natural Resources, Construction and Maintenance occupations in Monticello are Construction & Extraction (6 | 3.3%), and Installation, Maintenance & Repair (3 | 1.6%).
Natural Resources, Construction and Maintenance Occupations by Sex
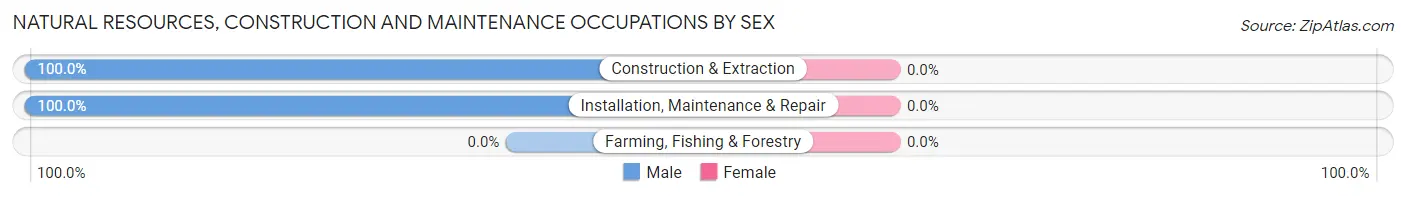
| Occupation | Male | Female |
| Farming, Fishing & Forestry | 0 (0.0%) | 0 (0.0%) |
| Construction & Extraction | 6 (100.0%) | 0 (0.0%) |
| Installation, Maintenance & Repair | 3 (100.0%) | 0 (0.0%) |
| Total (Category) | 9 (100.0%) | 0 (0.0%) |
| Total (Overall) | 61 (33.3%) | 122 (66.7%) |
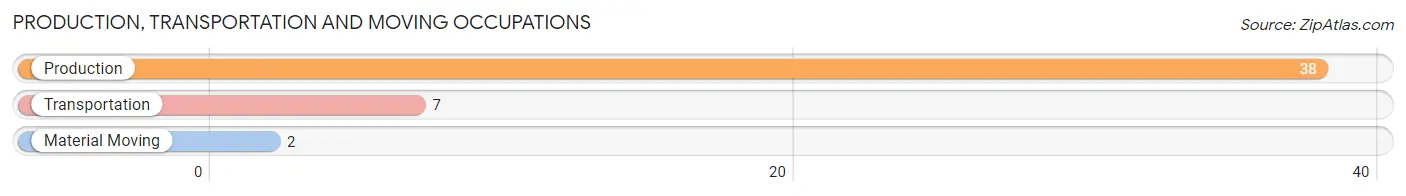
Production, Transportation and Moving Occupations
The most common Production, Transportation and Moving occupations in Monticello are Production (38 | 20.8%), Transportation (7 | 3.8%), and Material Moving (2 | 1.1%).
Production, Transportation and Moving Occupations by Sex
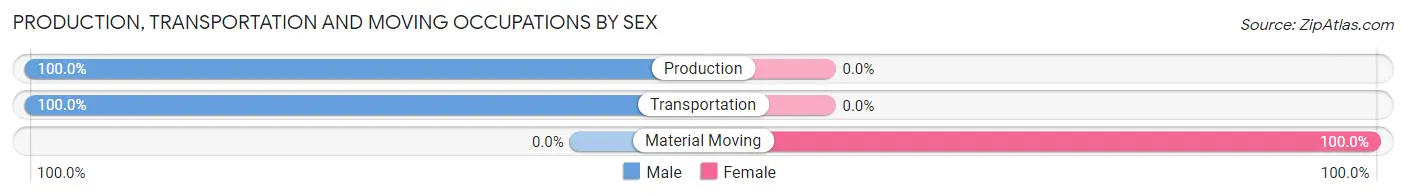
| Occupation | Male | Female |
| Production | 38 (100.0%) | 0 (0.0%) |
| Transportation | 7 (100.0%) | 0 (0.0%) |
| Material Moving | 0 (0.0%) | 2 (100.0%) |
| Total (Category) | 45 (95.7%) | 2 (4.3%) |
| Total (Overall) | 61 (33.3%) | 122 (66.7%) |
Employment Industries by Sex in Monticello
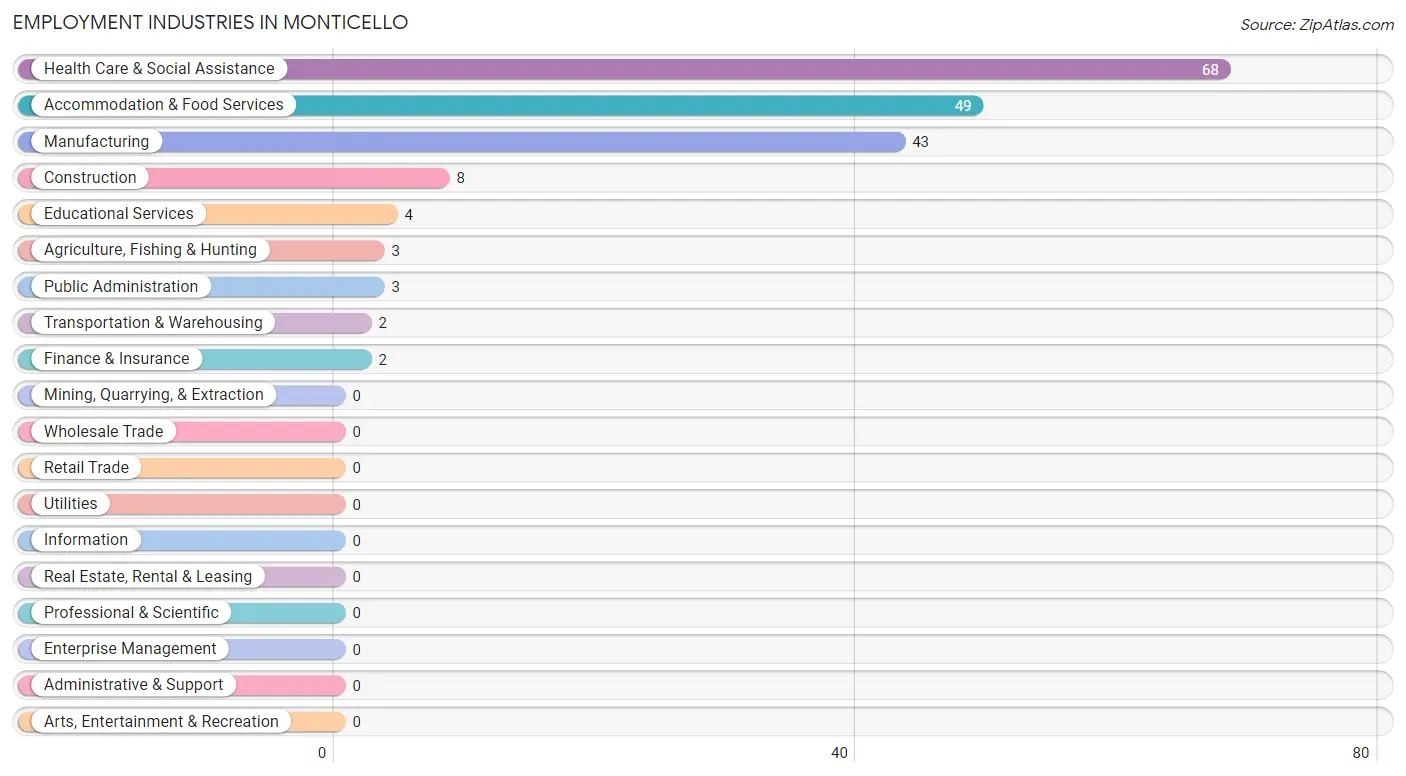
Employment Industries in Monticello
The major employment industries in Monticello include Health Care & Social Assistance (68 | 37.2%), Accommodation & Food Services (49 | 26.8%), Manufacturing (43 | 23.5%), Construction (8 | 4.4%), and Educational Services (4 | 2.2%).
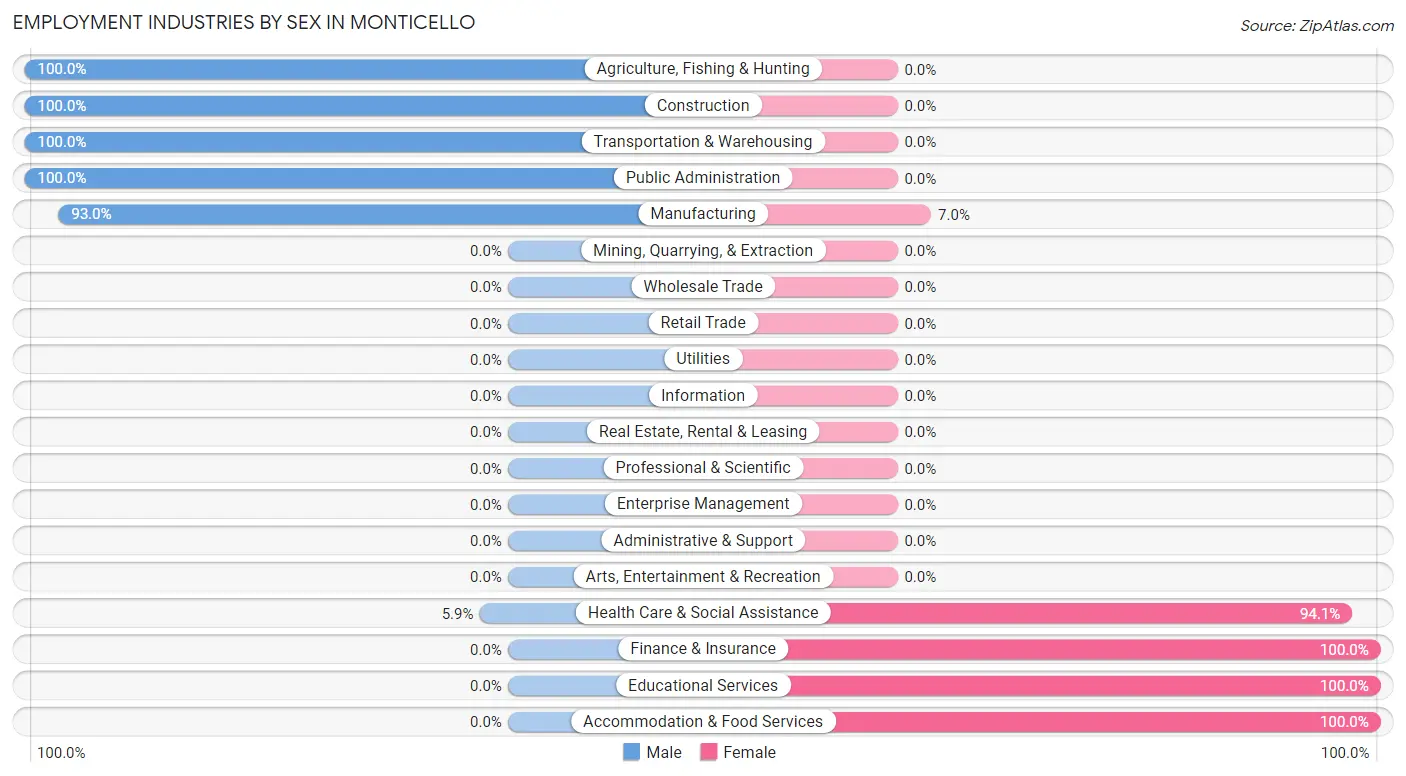
Employment Industries by Sex in Monticello
The Monticello industries that see more men than women are Agriculture, Fishing & Hunting (100.0%), Construction (100.0%), and Transportation & Warehousing (100.0%), whereas the industries that tend to have a higher number of women are Finance & Insurance (100.0%), Educational Services (100.0%), and Accommodation & Food Services (100.0%).
| Industry | Male | Female |
| Agriculture, Fishing & Hunting | 3 (100.0%) | 0 (0.0%) |
| Mining, Quarrying, & Extraction | 0 (0.0%) | 0 (0.0%) |
| Construction | 8 (100.0%) | 0 (0.0%) |
| Manufacturing | 40 (93.0%) | 3 (7.0%) |
| Wholesale Trade | 0 (0.0%) | 0 (0.0%) |
| Retail Trade | 0 (0.0%) | 0 (0.0%) |
| Transportation & Warehousing | 2 (100.0%) | 0 (0.0%) |
| Utilities | 0 (0.0%) | 0 (0.0%) |
| Information | 0 (0.0%) | 0 (0.0%) |
| Finance & Insurance | 0 (0.0%) | 2 (100.0%) |
| Real Estate, Rental & Leasing | 0 (0.0%) | 0 (0.0%) |
| Professional & Scientific | 0 (0.0%) | 0 (0.0%) |
| Enterprise Management | 0 (0.0%) | 0 (0.0%) |
| Administrative & Support | 0 (0.0%) | 0 (0.0%) |
| Educational Services | 0 (0.0%) | 4 (100.0%) |
| Health Care & Social Assistance | 4 (5.9%) | 64 (94.1%) |
| Arts, Entertainment & Recreation | 0 (0.0%) | 0 (0.0%) |
| Accommodation & Food Services | 0 (0.0%) | 49 (100.0%) |
| Public Administration | 3 (100.0%) | 0 (0.0%) |
| Total | 61 (33.3%) | 122 (66.7%) |
Education in Monticello
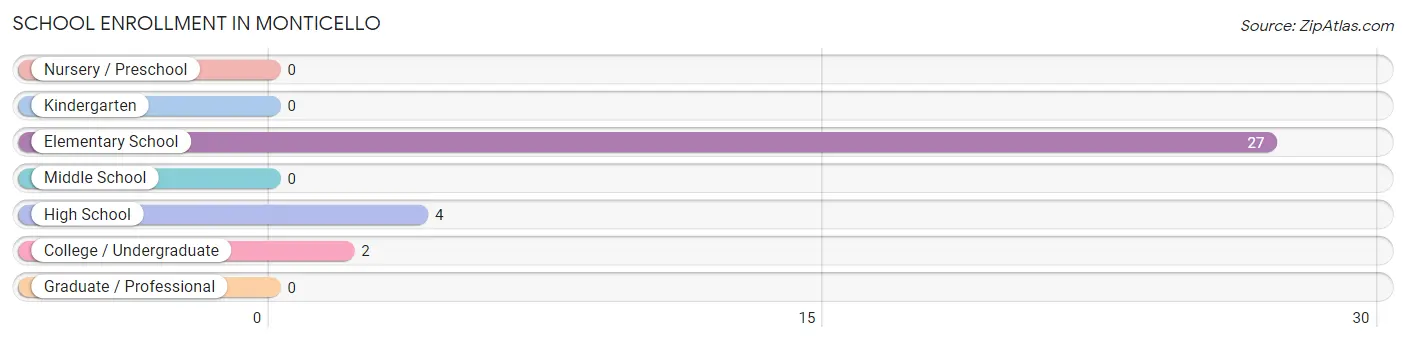
School Enrollment in Monticello
The most common levels of schooling among the 33 students in Monticello are elementary school (27 | 81.8%), high school (4 | 12.1%), and college / undergraduate (2 | 6.1%).
| School Level | # Students | % Students |
| Nursery / Preschool | 0 | 0.0% |
| Kindergarten | 0 | 0.0% |
| Elementary School | 27 | 81.8% |
| Middle School | 0 | 0.0% |
| High School | 4 | 12.1% |
| College / Undergraduate | 2 | 6.1% |
| Graduate / Professional | 0 | 0.0% |
| Total | 33 | 100.0% |
School Enrollment by Age by Funding Source in Monticello
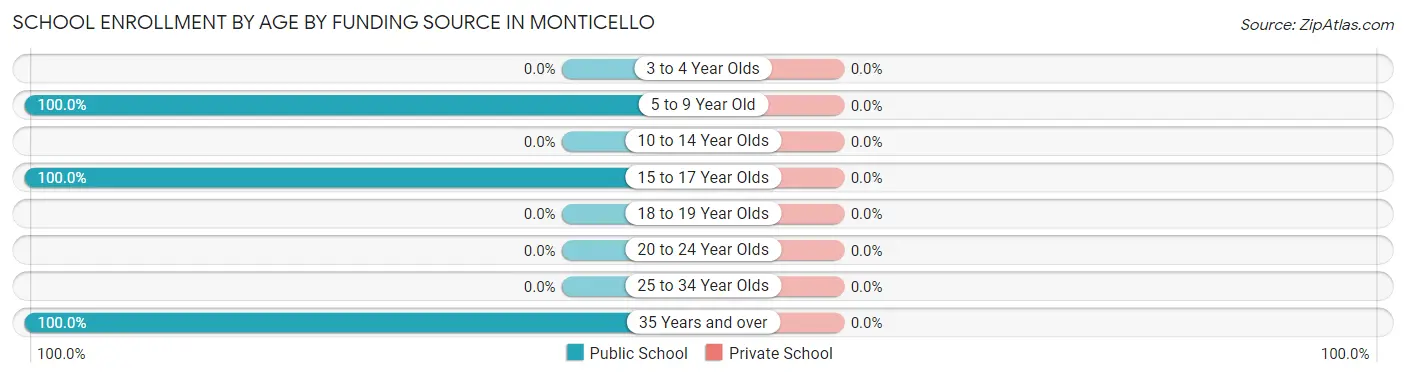
| Age Bracket | Public School | Private School |
| 3 to 4 Year Olds | 0 (0.0%) | 0 (0.0%) |
| 5 to 9 Year Old | 27 (100.0%) | 0 (0.0%) |
| 10 to 14 Year Olds | 0 (0.0%) | 0 (0.0%) |
| 15 to 17 Year Olds | 4 (100.0%) | 0 (0.0%) |
| 18 to 19 Year Olds | 0 (0.0%) | 0 (0.0%) |
| 20 to 24 Year Olds | 0 (0.0%) | 0 (0.0%) |
| 25 to 34 Year Olds | 0 (0.0%) | 0 (0.0%) |
| 35 Years and over | 2 (100.0%) | 0 (0.0%) |
| Total | 33 (100.0%) | 0 (0.0%) |
Educational Attainment by Field of Study in Monticello
Education (15 | 62.5%), arts & humanities (5 | 20.8%), science & technology (2 | 8.3%), and liberal arts & history (2 | 8.3%) are the most common fields of study among 24 individuals in Monticello who have obtained a bachelor's degree or higher.
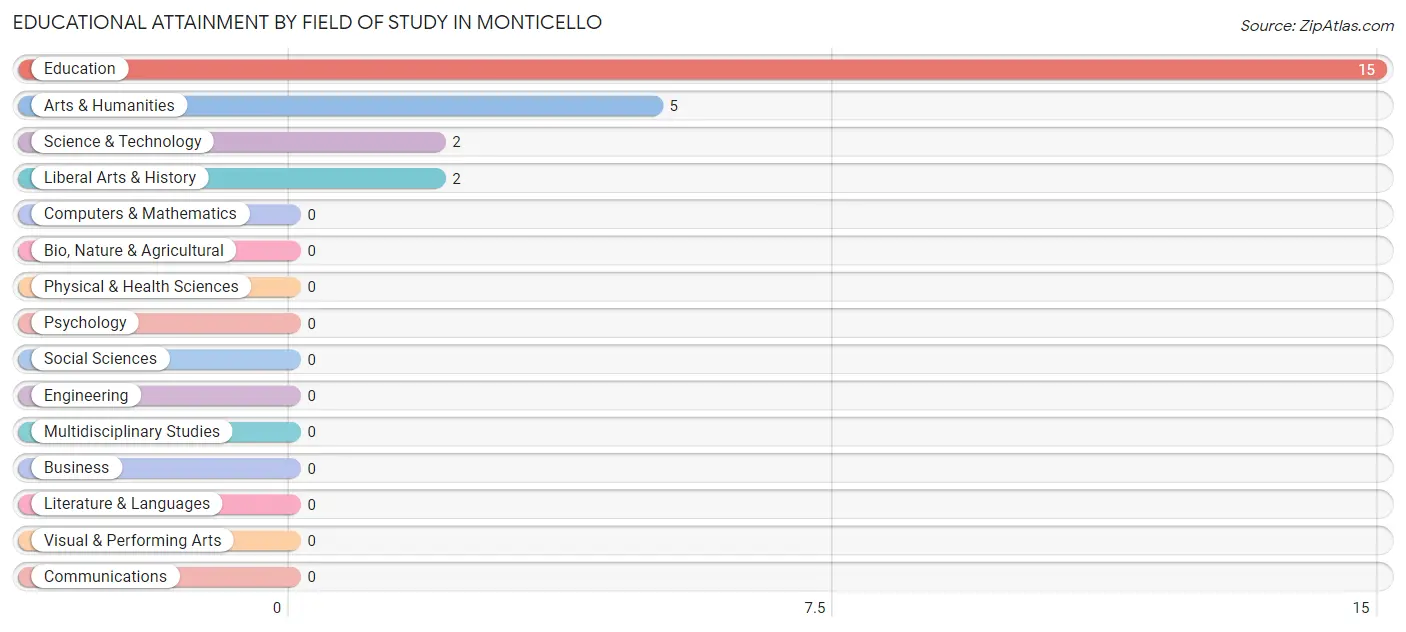
| Field of Study | # Graduates | % Graduates |
| Computers & Mathematics | 0 | 0.0% |
| Bio, Nature & Agricultural | 0 | 0.0% |
| Physical & Health Sciences | 0 | 0.0% |
| Psychology | 0 | 0.0% |
| Social Sciences | 0 | 0.0% |
| Engineering | 0 | 0.0% |
| Multidisciplinary Studies | 0 | 0.0% |
| Science & Technology | 2 | 8.3% |
| Business | 0 | 0.0% |
| Education | 15 | 62.5% |
| Literature & Languages | 0 | 0.0% |
| Liberal Arts & History | 2 | 8.3% |
| Visual & Performing Arts | 0 | 0.0% |
| Communications | 0 | 0.0% |
| Arts & Humanities | 5 | 20.8% |
| Total | 24 | 100.0% |
Transportation & Commute in Monticello
Vehicle Availability by Sex in Monticello
The most prevalent vehicle ownership categories in Monticello are males with 5 or more vehicles (44, accounting for 72.1%) and females with 5 or more vehicles (109, making up 36.1%).
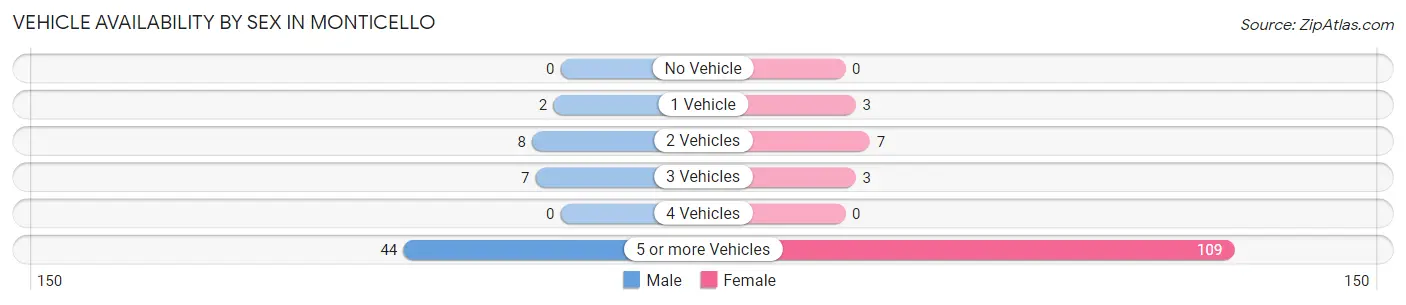
| Vehicles Available | Male | Female |
| No Vehicle | 0 (0.0%) | 0 (0.0%) |
| 1 Vehicle | 2 (3.3%) | 3 (2.5%) |
| 2 Vehicles | 8 (13.1%) | 7 (5.7%) |
| 3 Vehicles | 7 (11.5%) | 3 (2.5%) |
| 4 Vehicles | 0 (0.0%) | 0 (0.0%) |
| 5 or more Vehicles | 44 (72.1%) | 109 (89.3%) |
| Total | 61 (100.0%) | 122 (100.0%) |
Commute Time in Monticello
The most frequently occuring commute durations in Monticello are 20 to 24 minutes (66 commuters, 36.7%), 60 to 89 minutes (50 commuters, 27.8%), and 40 to 44 minutes (41 commuters, 22.8%).
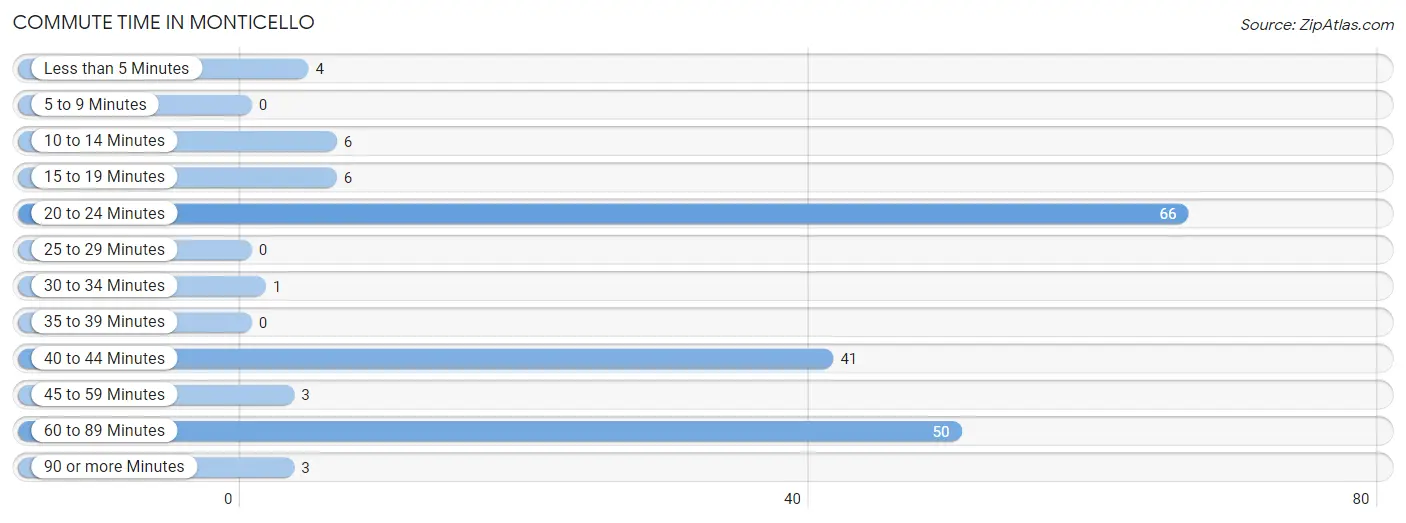
| Commute Time | # Commuters | % Commuters |
| Less than 5 Minutes | 4 | 2.2% |
| 5 to 9 Minutes | 0 | 0.0% |
| 10 to 14 Minutes | 6 | 3.3% |
| 15 to 19 Minutes | 6 | 3.3% |
| 20 to 24 Minutes | 66 | 36.7% |
| 25 to 29 Minutes | 0 | 0.0% |
| 30 to 34 Minutes | 1 | 0.6% |
| 35 to 39 Minutes | 0 | 0.0% |
| 40 to 44 Minutes | 41 | 22.8% |
| 45 to 59 Minutes | 3 | 1.7% |
| 60 to 89 Minutes | 50 | 27.8% |
| 90 or more Minutes | 3 | 1.7% |
Commute Time by Sex in Monticello
The most common commute times in Monticello are 40 to 44 minutes (40 commuters, 65.6%) for males and 20 to 24 minutes (66 commuters, 55.5%) for females.
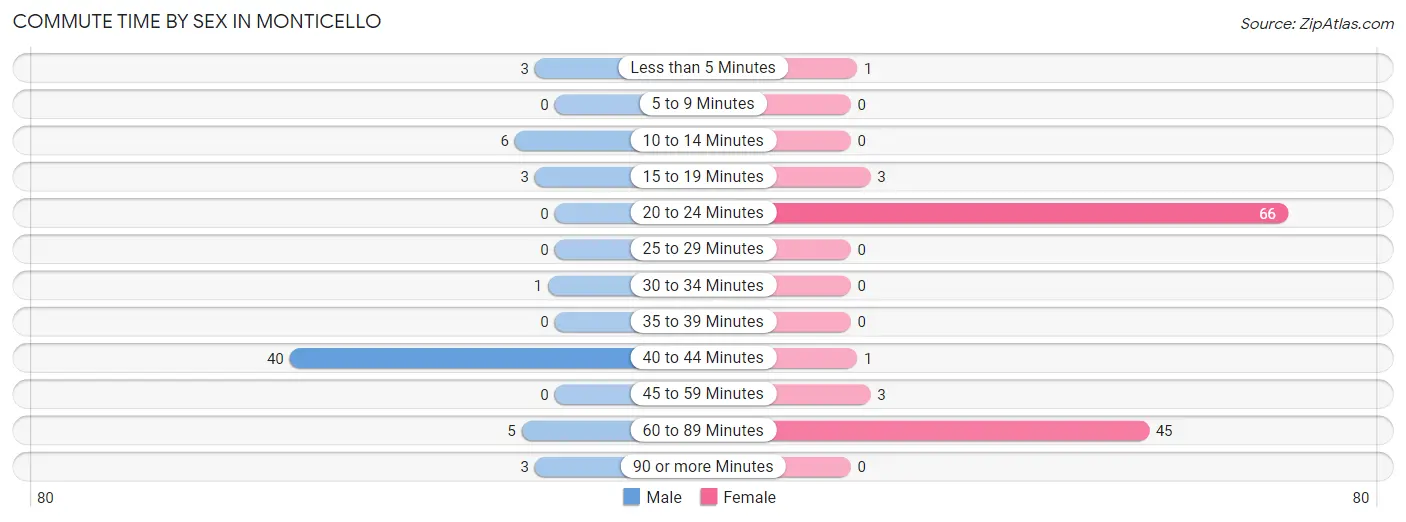
| Commute Time | Male | Female |
| Less than 5 Minutes | 3 (4.9%) | 1 (0.8%) |
| 5 to 9 Minutes | 0 (0.0%) | 0 (0.0%) |
| 10 to 14 Minutes | 6 (9.8%) | 0 (0.0%) |
| 15 to 19 Minutes | 3 (4.9%) | 3 (2.5%) |
| 20 to 24 Minutes | 0 (0.0%) | 66 (55.5%) |
| 25 to 29 Minutes | 0 (0.0%) | 0 (0.0%) |
| 30 to 34 Minutes | 1 (1.6%) | 0 (0.0%) |
| 35 to 39 Minutes | 0 (0.0%) | 0 (0.0%) |
| 40 to 44 Minutes | 40 (65.6%) | 1 (0.8%) |
| 45 to 59 Minutes | 0 (0.0%) | 3 (2.5%) |
| 60 to 89 Minutes | 5 (8.2%) | 45 (37.8%) |
| 90 or more Minutes | 3 (4.9%) | 0 (0.0%) |
Time of Departure to Work by Sex in Monticello
The most frequent times of departure to work in Monticello are 12:00 PM to 3:59 PM (28, 45.9%) for males and 4:00 PM to 11:59 PM (48, 40.3%) for females.
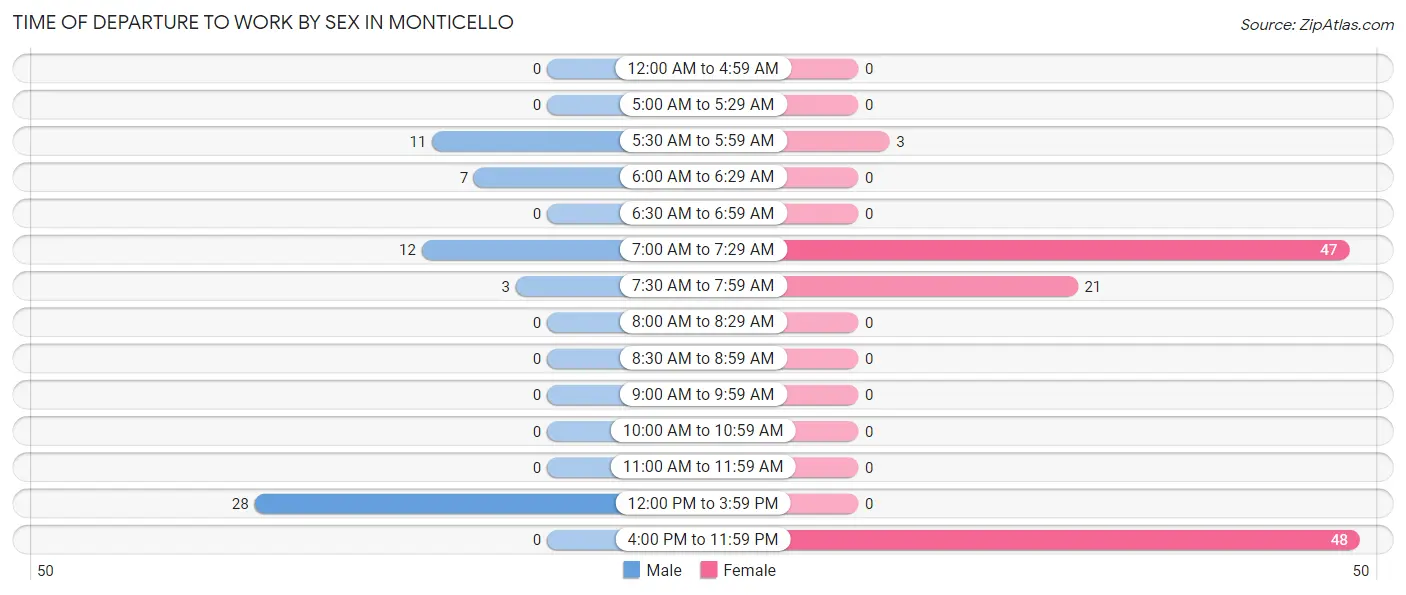
| Time of Departure | Male | Female |
| 12:00 AM to 4:59 AM | 0 (0.0%) | 0 (0.0%) |
| 5:00 AM to 5:29 AM | 0 (0.0%) | 0 (0.0%) |
| 5:30 AM to 5:59 AM | 11 (18.0%) | 3 (2.5%) |
| 6:00 AM to 6:29 AM | 7 (11.5%) | 0 (0.0%) |
| 6:30 AM to 6:59 AM | 0 (0.0%) | 0 (0.0%) |
| 7:00 AM to 7:29 AM | 12 (19.7%) | 47 (39.5%) |
| 7:30 AM to 7:59 AM | 3 (4.9%) | 21 (17.6%) |
| 8:00 AM to 8:29 AM | 0 (0.0%) | 0 (0.0%) |
| 8:30 AM to 8:59 AM | 0 (0.0%) | 0 (0.0%) |
| 9:00 AM to 9:59 AM | 0 (0.0%) | 0 (0.0%) |
| 10:00 AM to 10:59 AM | 0 (0.0%) | 0 (0.0%) |
| 11:00 AM to 11:59 AM | 0 (0.0%) | 0 (0.0%) |
| 12:00 PM to 3:59 PM | 28 (45.9%) | 0 (0.0%) |
| 4:00 PM to 11:59 PM | 0 (0.0%) | 48 (40.3%) |
| Total | 61 (100.0%) | 119 (100.0%) |
Housing Occupancy in Monticello
Occupancy by Ownership in Monticello
Of the total 46 dwellings in Monticello, owner-occupied units account for 42 (91.3%), while renter-occupied units make up 4 (8.7%).
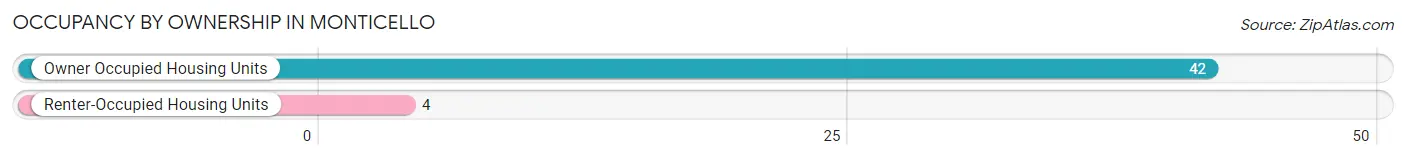
| Occupancy | # Housing Units | % Housing Units |
| Owner Occupied Housing Units | 42 | 91.3% |
| Renter-Occupied Housing Units | 4 | 8.7% |
| Total Occupied Housing Units | 46 | 100.0% |
Occupancy by Household Size in Monticello
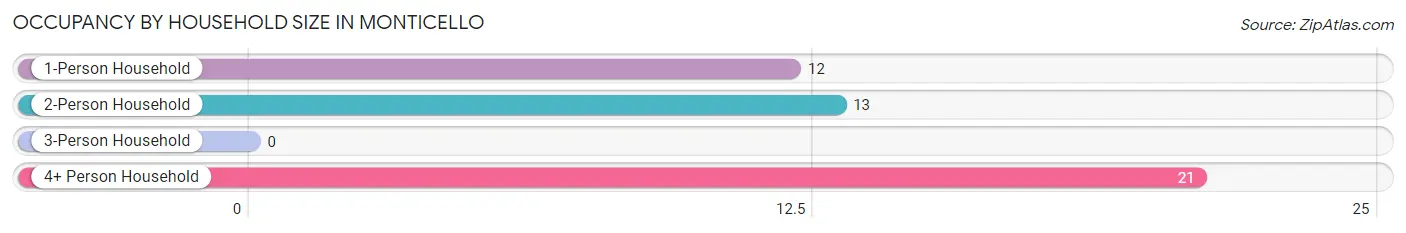
| Household Size | # Housing Units | % Housing Units |
| 1-Person Household | 12 | 26.1% |
| 2-Person Household | 13 | 28.3% |
| 3-Person Household | 0 | 0.0% |
| 4+ Person Household | 21 | 45.7% |
| Total Housing Units | 46 | 100.0% |
Occupancy by Ownership by Household Size in Monticello
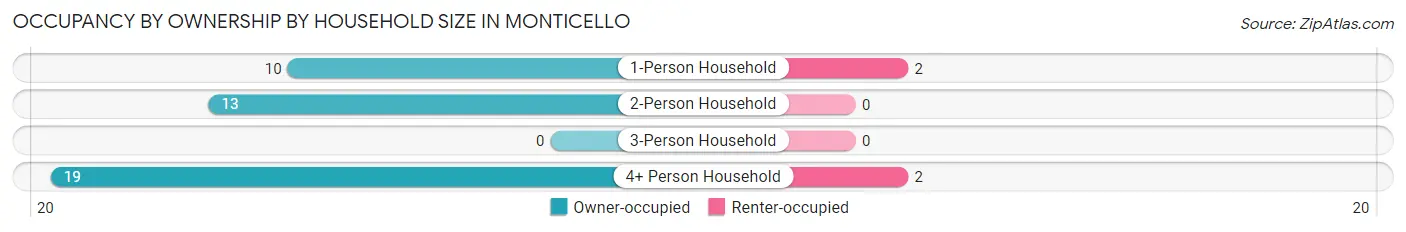
| Household Size | Owner-occupied | Renter-occupied |
| 1-Person Household | 10 (83.3%) | 2 (16.7%) |
| 2-Person Household | 13 (100.0%) | 0 (0.0%) |
| 3-Person Household | 0 (0.0%) | 0 (0.0%) |
| 4+ Person Household | 19 (90.5%) | 2 (9.5%) |
| Total Housing Units | 42 (91.3%) | 4 (8.7%) |
Occupancy by Educational Attainment in Monticello
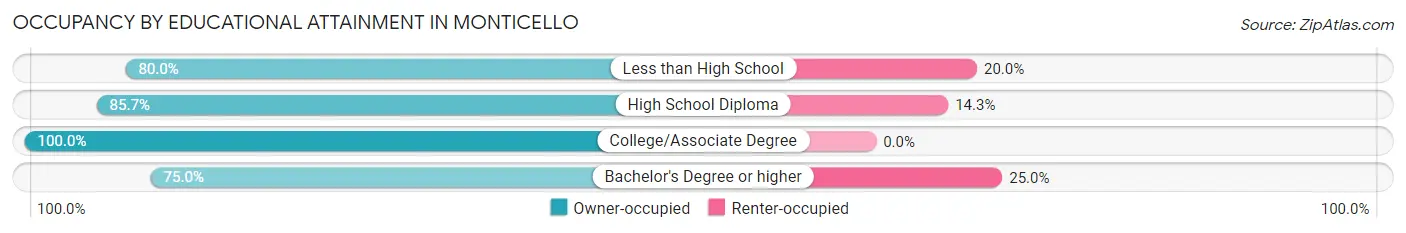
| Household Size | Owner-occupied | Renter-occupied |
| Less than High School | 4 (80.0%) | 1 (20.0%) |
| High School Diploma | 6 (85.7%) | 1 (14.3%) |
| College/Associate Degree | 26 (100.0%) | 0 (0.0%) |
| Bachelor's Degree or higher | 6 (75.0%) | 2 (25.0%) |
Occupancy by Age of Householder in Monticello
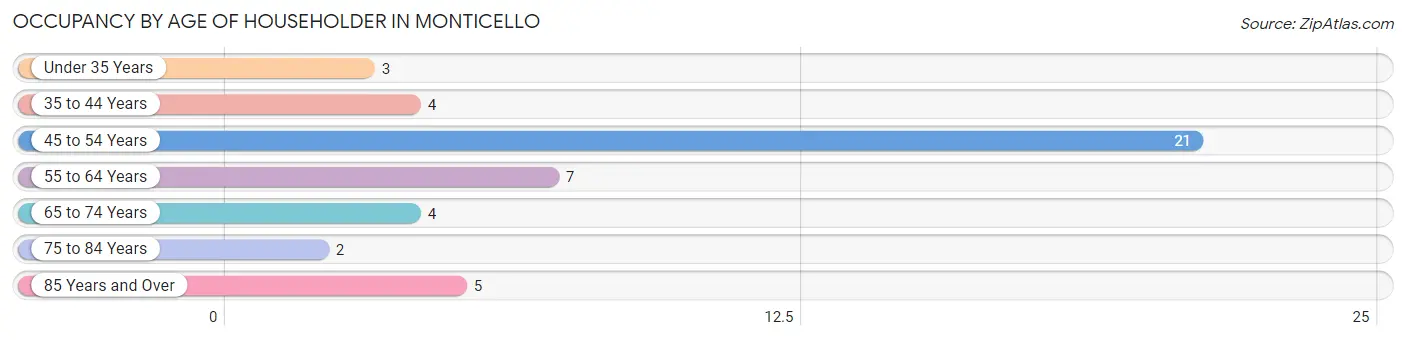
| Age Bracket | # Households | % Households |
| Under 35 Years | 3 | 6.5% |
| 35 to 44 Years | 4 | 8.7% |
| 45 to 54 Years | 21 | 45.7% |
| 55 to 64 Years | 7 | 15.2% |
| 65 to 74 Years | 4 | 8.7% |
| 75 to 84 Years | 2 | 4.3% |
| 85 Years and Over | 5 | 10.9% |
| Total | 46 | 100.0% |
Housing Finances in Monticello
Median Income by Occupancy in Monticello
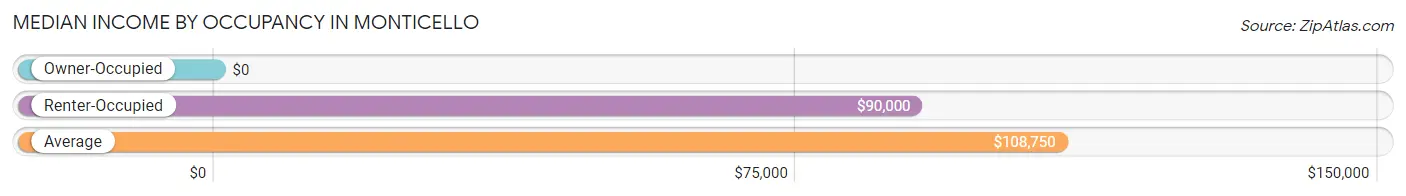
| Occupancy Type | # Households | Median Income |
| Owner-Occupied | 42 (91.3%) | $0 |
| Renter-Occupied | 4 (8.7%) | $90,000 |
| Average | 46 (100.0%) | $108,750 |
Occupancy by Householder Income Bracket in Monticello
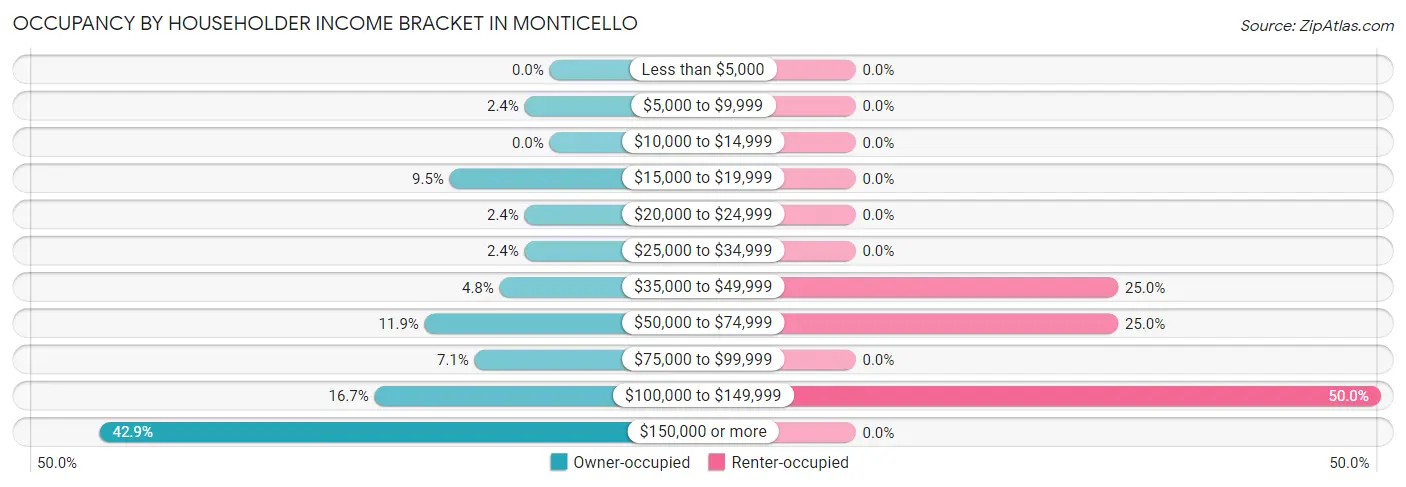
| Income Bracket | Owner-occupied | Renter-occupied |
| Less than $5,000 | 0 (0.0%) | 0 (0.0%) |
| $5,000 to $9,999 | 1 (2.4%) | 0 (0.0%) |
| $10,000 to $14,999 | 0 (0.0%) | 0 (0.0%) |
| $15,000 to $19,999 | 4 (9.5%) | 0 (0.0%) |
| $20,000 to $24,999 | 1 (2.4%) | 0 (0.0%) |
| $25,000 to $34,999 | 1 (2.4%) | 0 (0.0%) |
| $35,000 to $49,999 | 2 (4.8%) | 1 (25.0%) |
| $50,000 to $74,999 | 5 (11.9%) | 1 (25.0%) |
| $75,000 to $99,999 | 3 (7.1%) | 0 (0.0%) |
| $100,000 to $149,999 | 7 (16.7%) | 2 (50.0%) |
| $150,000 or more | 18 (42.9%) | 0 (0.0%) |
| Total | 42 (100.0%) | 4 (100.0%) |
Monthly Housing Cost Tiers in Monticello
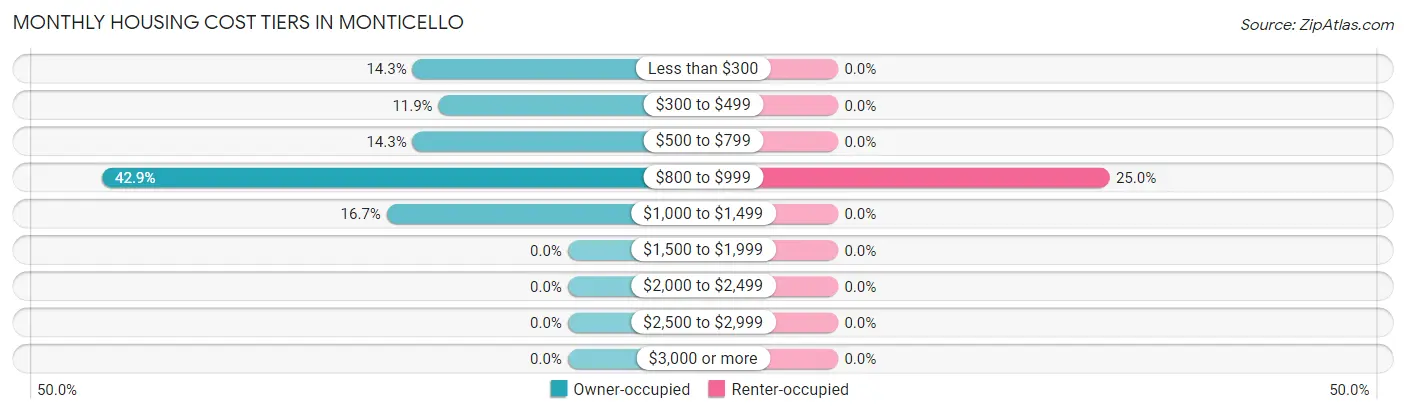
| Monthly Cost | Owner-occupied | Renter-occupied |
| Less than $300 | 6 (14.3%) | 0 (0.0%) |
| $300 to $499 | 5 (11.9%) | 0 (0.0%) |
| $500 to $799 | 6 (14.3%) | 0 (0.0%) |
| $800 to $999 | 18 (42.9%) | 1 (25.0%) |
| $1,000 to $1,499 | 7 (16.7%) | 0 (0.0%) |
| $1,500 to $1,999 | 0 (0.0%) | 0 (0.0%) |
| $2,000 to $2,499 | 0 (0.0%) | 0 (0.0%) |
| $2,500 to $2,999 | 0 (0.0%) | 0 (0.0%) |
| $3,000 or more | 0 (0.0%) | 0 (0.0%) |
| Total | 42 (100.0%) | 4 (100.0%) |
Physical Housing Characteristics in Monticello
Housing Structures in Monticello
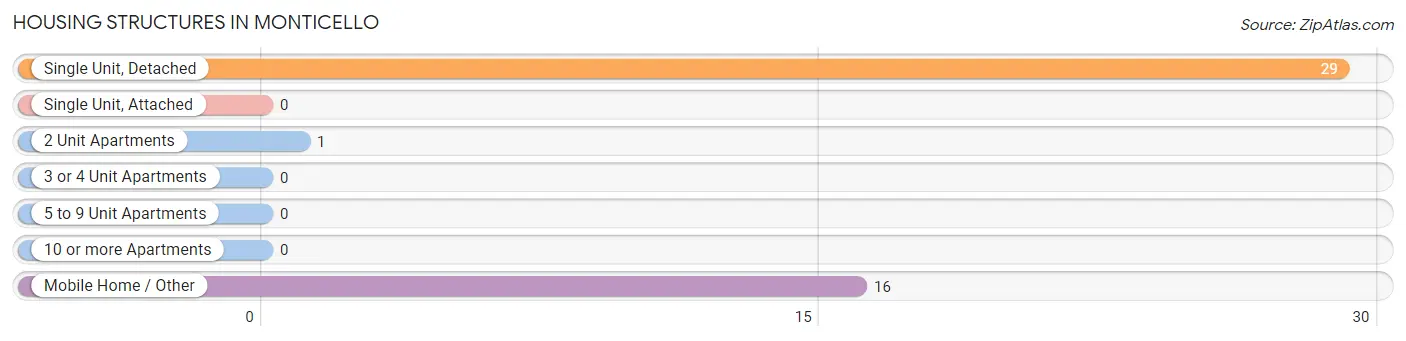
| Structure Type | # Housing Units | % Housing Units |
| Single Unit, Detached | 29 | 63.0% |
| Single Unit, Attached | 0 | 0.0% |
| 2 Unit Apartments | 1 | 2.2% |
| 3 or 4 Unit Apartments | 0 | 0.0% |
| 5 to 9 Unit Apartments | 0 | 0.0% |
| 10 or more Apartments | 0 | 0.0% |
| Mobile Home / Other | 16 | 34.8% |
| Total | 46 | 100.0% |
Housing Structures by Occupancy in Monticello
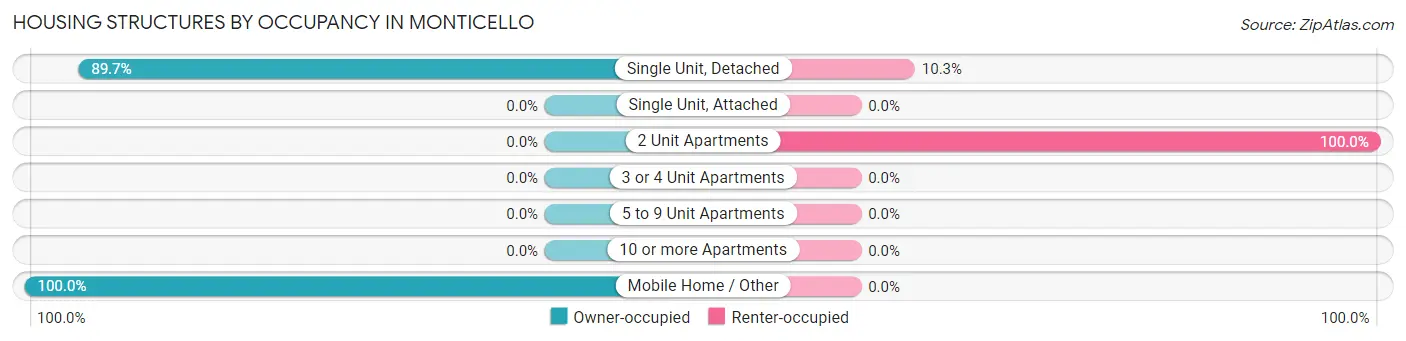
| Structure Type | Owner-occupied | Renter-occupied |
| Single Unit, Detached | 26 (89.7%) | 3 (10.3%) |
| Single Unit, Attached | 0 (0.0%) | 0 (0.0%) |
| 2 Unit Apartments | 0 (0.0%) | 1 (100.0%) |
| 3 or 4 Unit Apartments | 0 (0.0%) | 0 (0.0%) |
| 5 to 9 Unit Apartments | 0 (0.0%) | 0 (0.0%) |
| 10 or more Apartments | 0 (0.0%) | 0 (0.0%) |
| Mobile Home / Other | 16 (100.0%) | 0 (0.0%) |
| Total | 42 (91.3%) | 4 (8.7%) |
Housing Structures by Number of Rooms in Monticello
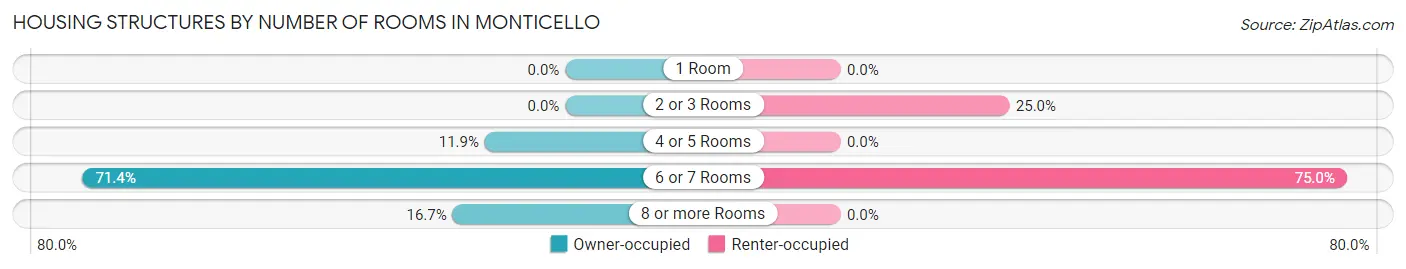
| Number of Rooms | Owner-occupied | Renter-occupied |
| 1 Room | 0 (0.0%) | 0 (0.0%) |
| 2 or 3 Rooms | 0 (0.0%) | 1 (25.0%) |
| 4 or 5 Rooms | 5 (11.9%) | 0 (0.0%) |
| 6 or 7 Rooms | 30 (71.4%) | 3 (75.0%) |
| 8 or more Rooms | 7 (16.7%) | 0 (0.0%) |
| Total | 42 (100.0%) | 4 (100.0%) |
Housing Structure by Heating Type in Monticello
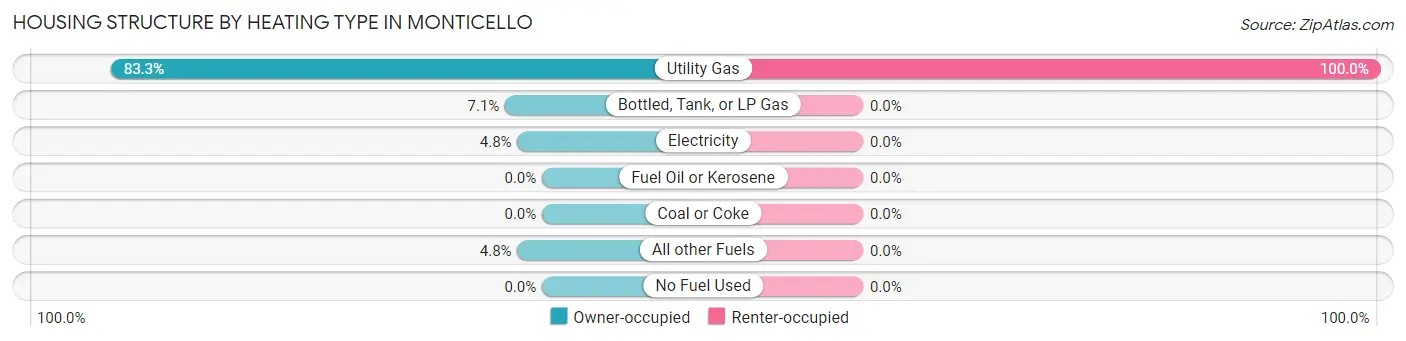
| Heating Type | Owner-occupied | Renter-occupied |
| Utility Gas | 35 (83.3%) | 4 (100.0%) |
| Bottled, Tank, or LP Gas | 3 (7.1%) | 0 (0.0%) |
| Electricity | 2 (4.8%) | 0 (0.0%) |
| Fuel Oil or Kerosene | 0 (0.0%) | 0 (0.0%) |
| Coal or Coke | 0 (0.0%) | 0 (0.0%) |
| All other Fuels | 2 (4.8%) | 0 (0.0%) |
| No Fuel Used | 0 (0.0%) | 0 (0.0%) |
| Total | 42 (100.0%) | 4 (100.0%) |
Household Vehicle Usage in Monticello
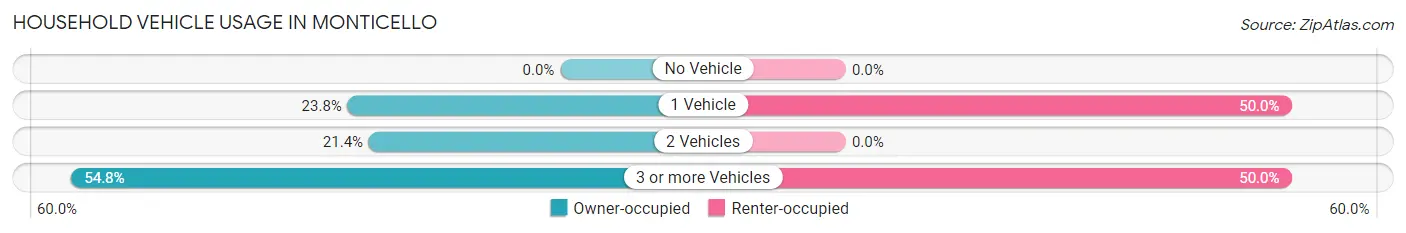
| Vehicles per Household | Owner-occupied | Renter-occupied |
| No Vehicle | 0 (0.0%) | 0 (0.0%) |
| 1 Vehicle | 10 (23.8%) | 2 (50.0%) |
| 2 Vehicles | 9 (21.4%) | 0 (0.0%) |
| 3 or more Vehicles | 23 (54.8%) | 2 (50.0%) |
| Total | 42 (100.0%) | 4 (100.0%) |
Real Estate & Mortgages in Monticello
Real Estate and Mortgage Overview in Monticello
| Characteristic | Without Mortgage | With Mortgage |
| Housing Units | 14 | 28 |
| Median Property Value | $75,000 | $109,400 |
| Median Household Income | - | - |
| Monthly Housing Costs | $325 | $0 |
| Real Estate Taxes | $520 | $0 |
Property Value by Mortgage Status in Monticello
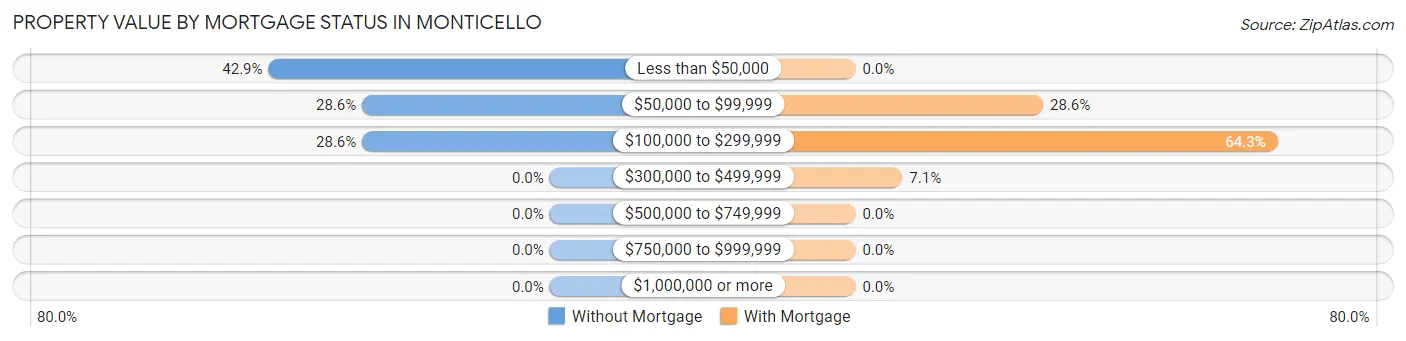
| Property Value | Without Mortgage | With Mortgage |
| Less than $50,000 | 6 (42.9%) | 0 (0.0%) |
| $50,000 to $99,999 | 4 (28.6%) | 8 (28.6%) |
| $100,000 to $299,999 | 4 (28.6%) | 18 (64.3%) |
| $300,000 to $499,999 | 0 (0.0%) | 2 (7.1%) |
| $500,000 to $749,999 | 0 (0.0%) | 0 (0.0%) |
| $750,000 to $999,999 | 0 (0.0%) | 0 (0.0%) |
| $1,000,000 or more | 0 (0.0%) | 0 (0.0%) |
| Total | 14 (100.0%) | 28 (100.0%) |
Household Income by Mortgage Status in Monticello
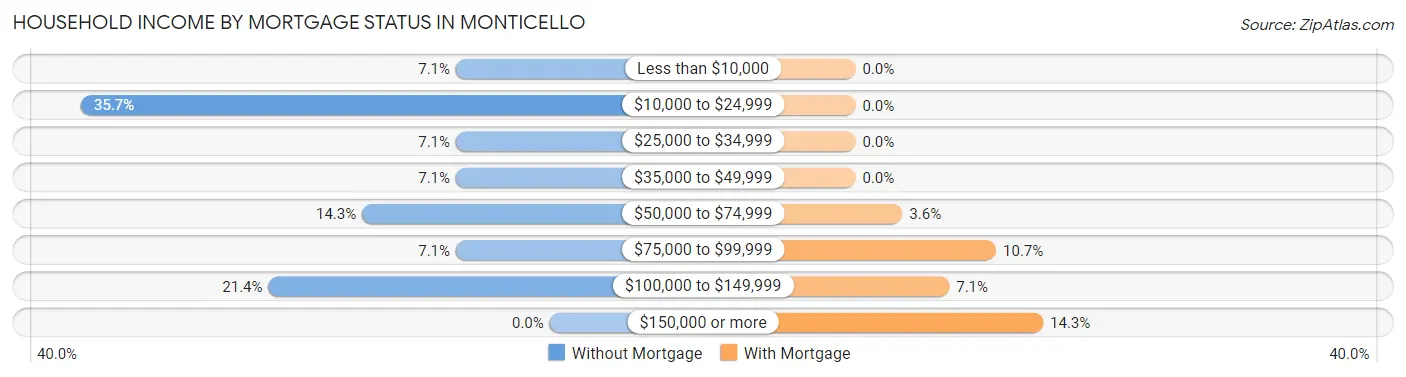
| Household Income | Without Mortgage | With Mortgage |
| Less than $10,000 | 1 (7.1%) | 0 (0.0%) |
| $10,000 to $24,999 | 5 (35.7%) | 0 (0.0%) |
| $25,000 to $34,999 | 1 (7.1%) | 0 (0.0%) |
| $35,000 to $49,999 | 1 (7.1%) | 0 (0.0%) |
| $50,000 to $74,999 | 2 (14.3%) | 1 (3.6%) |
| $75,000 to $99,999 | 1 (7.1%) | 3 (10.7%) |
| $100,000 to $149,999 | 3 (21.4%) | 2 (7.1%) |
| $150,000 or more | 0 (0.0%) | 4 (14.3%) |
| Total | 14 (100.0%) | 28 (100.0%) |
Property Value to Household Income Ratio in Monticello
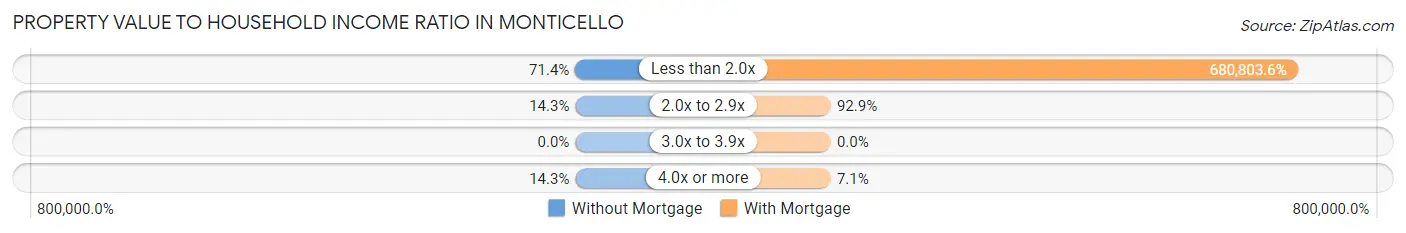
| Value-to-Income Ratio | Without Mortgage | With Mortgage |
| Less than 2.0x | 10 (71.4%) | 190,625 (680,803.6%) |
| 2.0x to 2.9x | 2 (14.3%) | 26 (92.9%) |
| 3.0x to 3.9x | 0 (0.0%) | 0 (0.0%) |
| 4.0x or more | 2 (14.3%) | 2 (7.1%) |
| Total | 14 (100.0%) | 28 (100.0%) |
Real Estate Taxes by Mortgage Status in Monticello
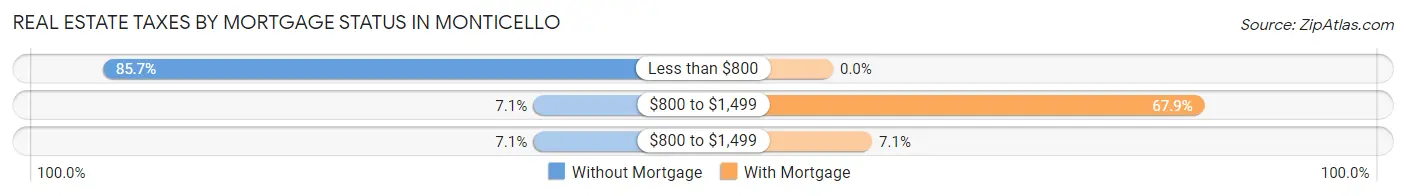
| Property Taxes | Without Mortgage | With Mortgage |
| Less than $800 | 12 (85.7%) | 0 (0.0%) |
| $800 to $1,499 | 1 (7.1%) | 19 (67.9%) |
| $800 to $1,499 | 1 (7.1%) | 2 (7.1%) |
| Total | 14 (100.0%) | 28 (100.0%) |
Health & Disability in Monticello
Health Insurance Coverage by Age in Monticello
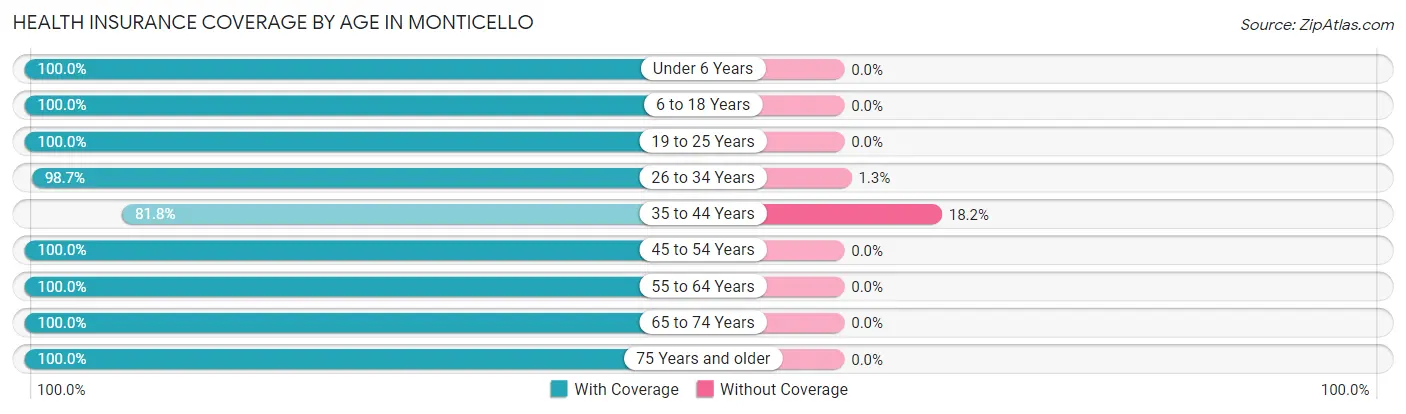
| Age Bracket | With Coverage | Without Coverage |
| Under 6 Years | 42 (100.0%) | 0 (0.0%) |
| 6 to 18 Years | 38 (100.0%) | 0 (0.0%) |
| 19 to 25 Years | 56 (100.0%) | 0 (0.0%) |
| 26 to 34 Years | 74 (98.7%) | 1 (1.3%) |
| 35 to 44 Years | 9 (81.8%) | 2 (18.2%) |
| 45 to 54 Years | 22 (100.0%) | 0 (0.0%) |
| 55 to 64 Years | 27 (100.0%) | 0 (0.0%) |
| 65 to 74 Years | 14 (100.0%) | 0 (0.0%) |
| 75 Years and older | 7 (100.0%) | 0 (0.0%) |
| Total | 289 (99.0%) | 3 (1.0%) |
Health Insurance Coverage by Citizenship Status in Monticello
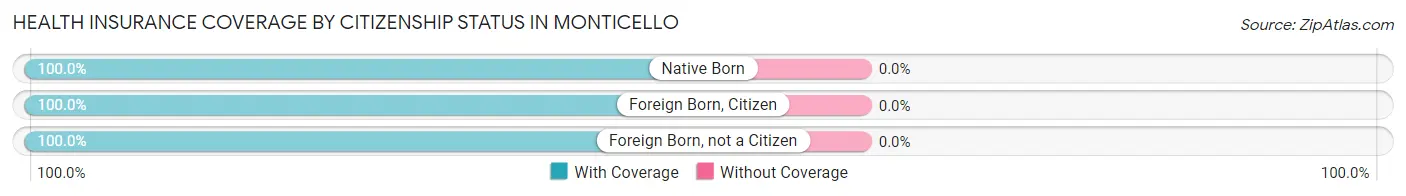
| Citizenship Status | With Coverage | Without Coverage |
| Native Born | 42 (100.0%) | 0 (0.0%) |
| Foreign Born, Citizen | 38 (100.0%) | 0 (0.0%) |
| Foreign Born, not a Citizen | 56 (100.0%) | 0 (0.0%) |
Health Insurance Coverage by Household Income in Monticello
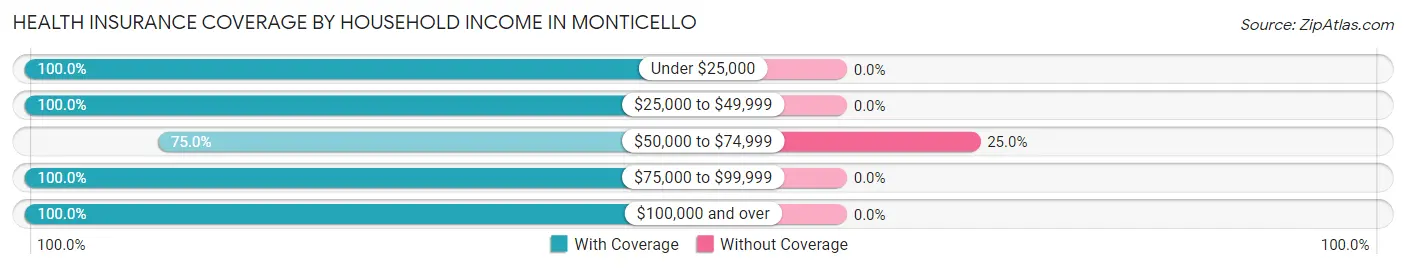
| Household Income | With Coverage | Without Coverage |
| Under $25,000 | 6 (100.0%) | 0 (0.0%) |
| $25,000 to $49,999 | 5 (100.0%) | 0 (0.0%) |
| $50,000 to $74,999 | 9 (75.0%) | 3 (25.0%) |
| $75,000 to $99,999 | 6 (100.0%) | 0 (0.0%) |
| $100,000 and over | 263 (100.0%) | 0 (0.0%) |
Public vs Private Health Insurance Coverage by Age in Monticello
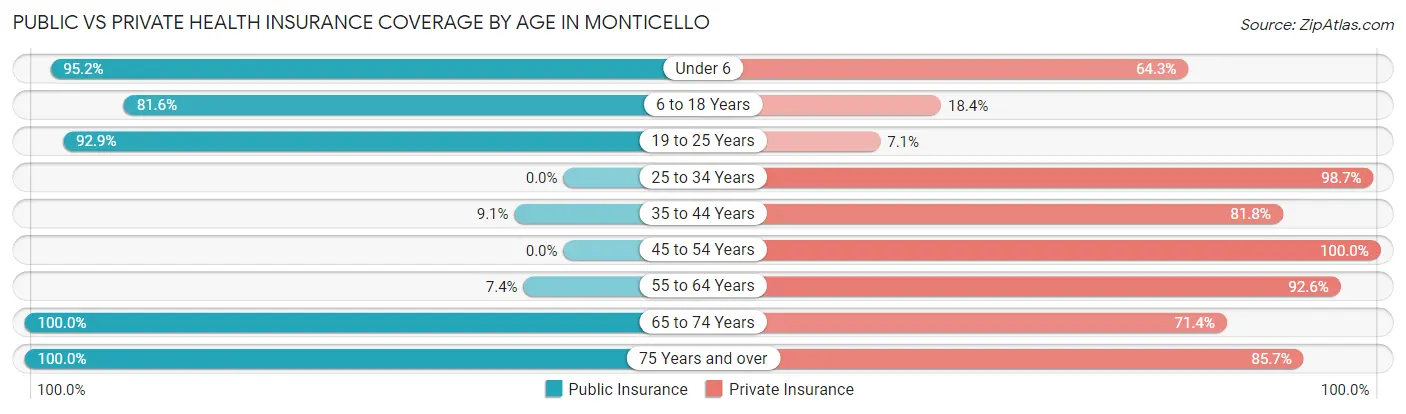
| Age Bracket | Public Insurance | Private Insurance |
| Under 6 | 40 (95.2%) | 27 (64.3%) |
| 6 to 18 Years | 31 (81.6%) | 7 (18.4%) |
| 19 to 25 Years | 52 (92.9%) | 4 (7.1%) |
| 25 to 34 Years | 0 (0.0%) | 74 (98.7%) |
| 35 to 44 Years | 1 (9.1%) | 9 (81.8%) |
| 45 to 54 Years | 0 (0.0%) | 22 (100.0%) |
| 55 to 64 Years | 2 (7.4%) | 25 (92.6%) |
| 65 to 74 Years | 14 (100.0%) | 10 (71.4%) |
| 75 Years and over | 7 (100.0%) | 6 (85.7%) |
| Total | 147 (50.3%) | 184 (63.0%) |
Disability Status by Sex by Age in Monticello
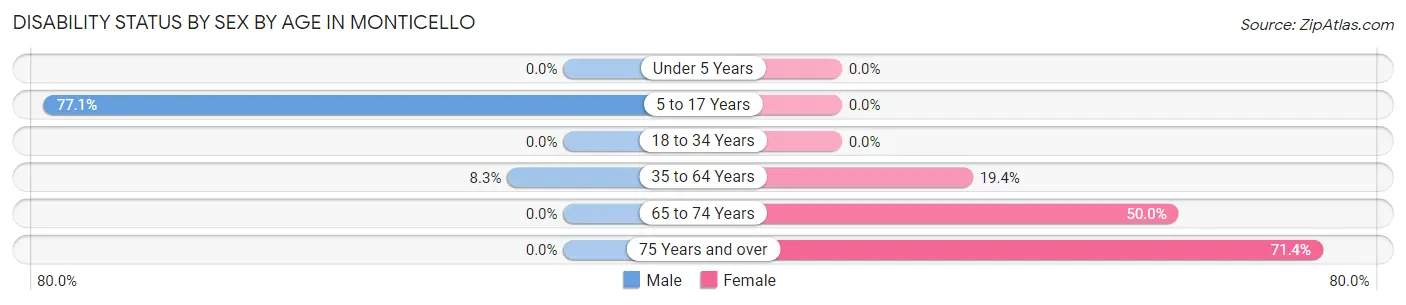
| Age Bracket | Male | Female |
| Under 5 Years | 0 (0.0%) | 0 (0.0%) |
| 5 to 17 Years | 27 (77.1%) | 0 (0.0%) |
| 18 to 34 Years | 0 (0.0%) | 0 (0.0%) |
| 35 to 64 Years | 2 (8.3%) | 7 (19.4%) |
| 65 to 74 Years | 0 (0.0%) | 2 (50.0%) |
| 75 Years and over | 0 (0.0%) | 5 (71.4%) |
Disability Class by Sex by Age in Monticello
Disability Class: Hearing Difficulty
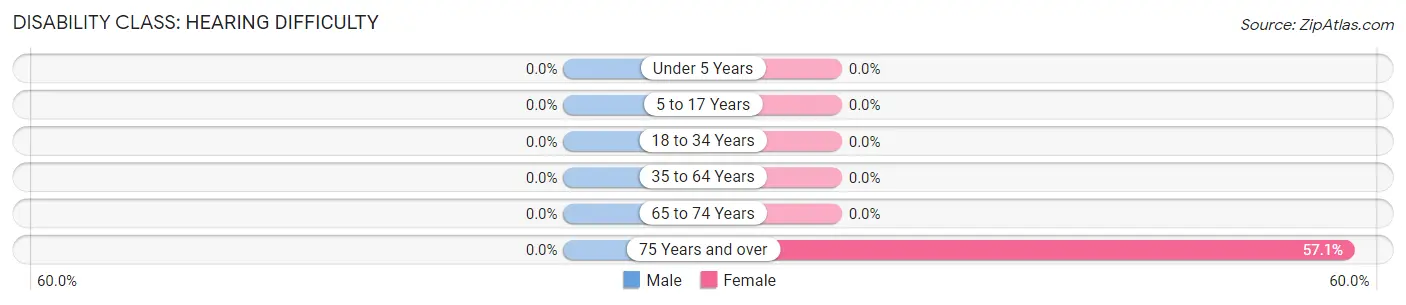
| Age Bracket | Male | Female |
| Under 5 Years | 0 (0.0%) | 0 (0.0%) |
| 5 to 17 Years | 0 (0.0%) | 0 (0.0%) |
| 18 to 34 Years | 0 (0.0%) | 0 (0.0%) |
| 35 to 64 Years | 0 (0.0%) | 0 (0.0%) |
| 65 to 74 Years | 0 (0.0%) | 0 (0.0%) |
| 75 Years and over | 0 (0.0%) | 4 (57.1%) |
Disability Class: Vision Difficulty
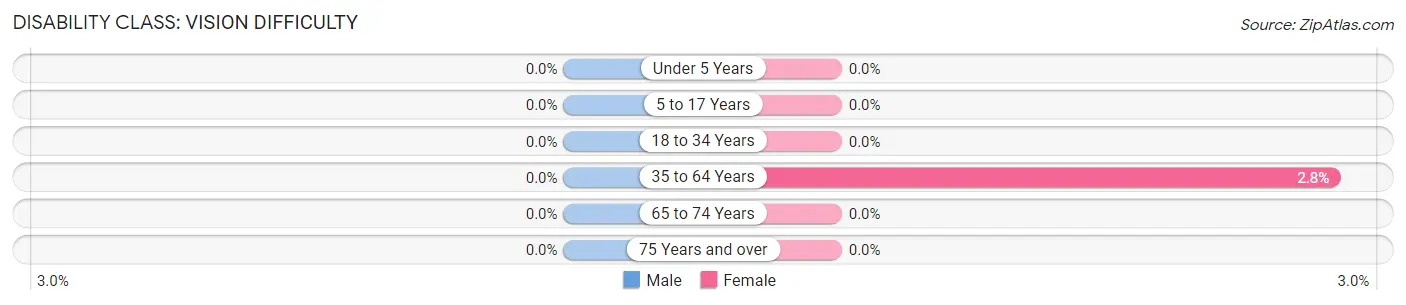
| Age Bracket | Male | Female |
| Under 5 Years | 0 (0.0%) | 0 (0.0%) |
| 5 to 17 Years | 0 (0.0%) | 0 (0.0%) |
| 18 to 34 Years | 0 (0.0%) | 0 (0.0%) |
| 35 to 64 Years | 0 (0.0%) | 1 (2.8%) |
| 65 to 74 Years | 0 (0.0%) | 0 (0.0%) |
| 75 Years and over | 0 (0.0%) | 0 (0.0%) |
Disability Class: Cognitive Difficulty
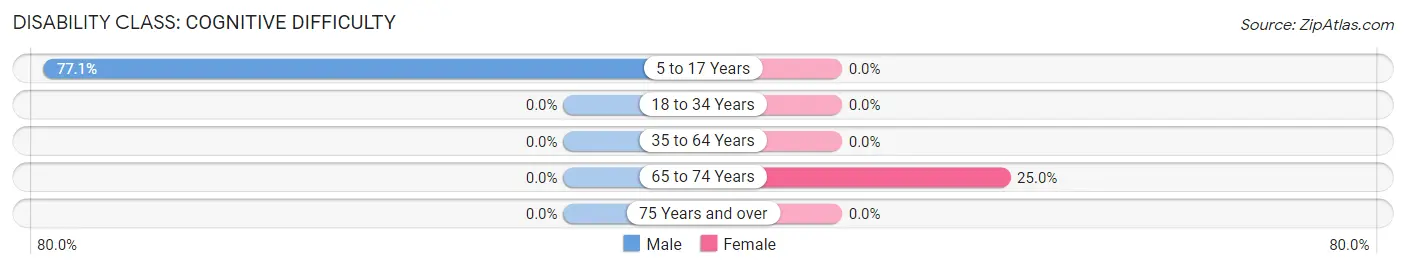
| Age Bracket | Male | Female |
| 5 to 17 Years | 27 (77.1%) | 0 (0.0%) |
| 18 to 34 Years | 0 (0.0%) | 0 (0.0%) |
| 35 to 64 Years | 0 (0.0%) | 0 (0.0%) |
| 65 to 74 Years | 0 (0.0%) | 1 (25.0%) |
| 75 Years and over | 0 (0.0%) | 0 (0.0%) |
Disability Class: Ambulatory Difficulty
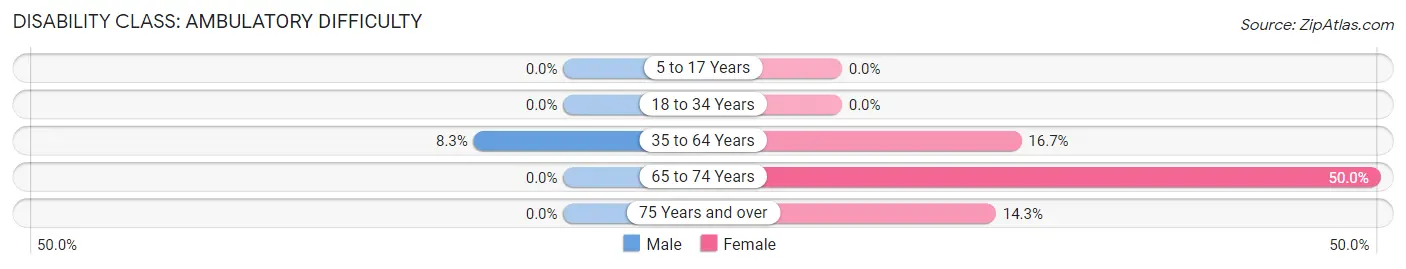
| Age Bracket | Male | Female |
| 5 to 17 Years | 0 (0.0%) | 0 (0.0%) |
| 18 to 34 Years | 0 (0.0%) | 0 (0.0%) |
| 35 to 64 Years | 2 (8.3%) | 6 (16.7%) |
| 65 to 74 Years | 0 (0.0%) | 2 (50.0%) |
| 75 Years and over | 0 (0.0%) | 1 (14.3%) |
Disability Class: Self-Care Difficulty
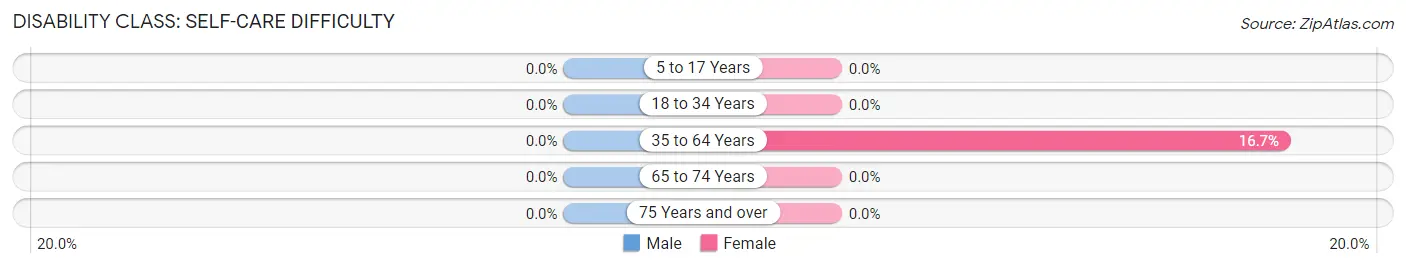
| Age Bracket | Male | Female |
| 5 to 17 Years | 0 (0.0%) | 0 (0.0%) |
| 18 to 34 Years | 0 (0.0%) | 0 (0.0%) |
| 35 to 64 Years | 0 (0.0%) | 6 (16.7%) |
| 65 to 74 Years | 0 (0.0%) | 0 (0.0%) |
| 75 Years and over | 0 (0.0%) | 0 (0.0%) |
Technology Access in Monticello
Computing Device Access in Monticello
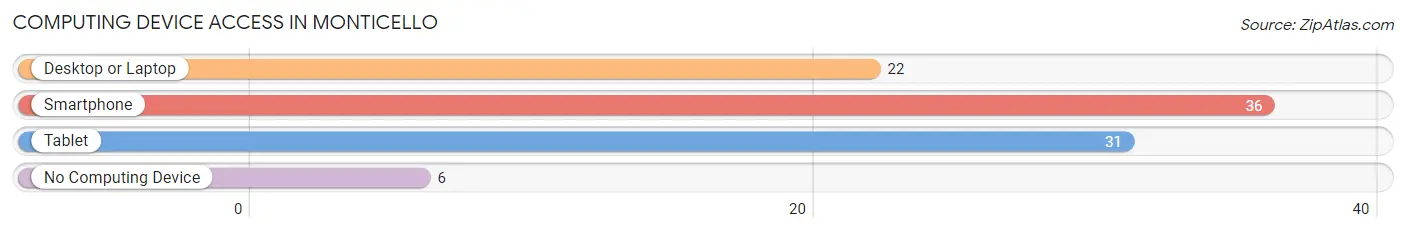
| Device Type | # Households | % Households |
| Desktop or Laptop | 22 | 47.8% |
| Smartphone | 36 | 78.3% |
| Tablet | 31 | 67.4% |
| No Computing Device | 6 | 13.0% |
| Total | 46 | 100.0% |
Internet Access in Monticello
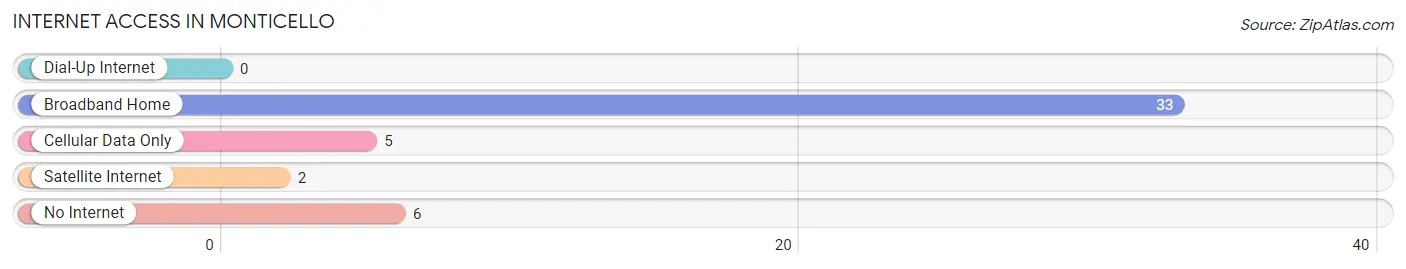
| Internet Type | # Households | % Households |
| Dial-Up Internet | 0 | 0.0% |
| Broadband Home | 33 | 71.7% |
| Cellular Data Only | 5 | 10.9% |
| Satellite Internet | 2 | 4.3% |
| No Internet | 6 | 13.0% |
| Total | 46 | 100.0% |
Monticello Summary
Monticello, Missouri is a small town located in the northeast corner of the state, near the Mississippi River. It is part of the Hannibal-LaGrange University district and is home to a population of just over 1,000 people. The town is known for its rich history, beautiful geography, and vibrant economy.
History
Monticello was founded in 1819 by a group of settlers from Kentucky. The town was named after Thomas Jefferson’s home in Virginia, and the settlers were hoping to create a similar atmosphere of freedom and opportunity. The town quickly grew and by 1820, it had a population of over 500 people.
The town was an important stop on the Underground Railroad, and many escaped slaves found refuge in Monticello. The town was also a major stop on the Hannibal and St. Joseph Railroad, which connected the town to the rest of the country.
During the Civil War, Monticello was a major supply center for the Union Army. The town was also the site of a major battle in 1862, when Confederate forces attempted to take control of the town. The Union forces were able to repel the attack and the town remained in Union hands for the remainder of the war.
Geography
Monticello is located in the northeast corner of Missouri, near the Mississippi River. The town is situated on a bluff overlooking the river, and is surrounded by rolling hills and lush forests. The town is located in the Ozark Mountains, and is home to a variety of wildlife, including deer, turkey, and other small game.
The town is located in Marion County, and is part of the Hannibal-LaGrange University district. The town is located about 30 miles from Hannibal, and is a popular destination for tourists and outdoor enthusiasts.
Economy
Monticello’s economy is largely based on agriculture and tourism. The town is home to several farms, and the surrounding area is known for its production of corn, soybeans, and other crops. The town is also home to several small businesses, including restaurants, shops, and other services.
Tourism is an important part of the town’s economy, and the town is home to several attractions, including the Monticello Museum, the Monticello Opera House, and the Monticello Historical Society. The town is also home to several festivals and events throughout the year, including the Monticello Music Festival and the Monticello Harvest Festival.
Demographics
As of the 2010 census, Monticello had a population of 1,072 people. The town is predominantly white, with a small African American population. The median household income is $37,000, and the median age is 43. The town is home to a variety of religious denominations, including Baptist, Methodist, and Catholic.
Monticello is a small town with a rich history, beautiful geography, and vibrant economy. The town is home to a diverse population, and is a popular destination for tourists and outdoor enthusiasts. The town is a great place to live, work, and raise a family, and is a great example of small-town America.
Common Questions
What is Per Capita Income in Monticello?
Per Capita income in Monticello is $22,903.
What is the Median Family Income in Monticello?
Median Family Income in Monticello is $180,156.
What is the Median Household income in Monticello?
Median Household Income in Monticello is $108,750.
What is Income or Wage Gap in Monticello?
Income or Wage Gap in Monticello is 2.7%.
Women in Monticello earn 97.3 cents for every dollar earned by a man.
What is Inequality or Gini Index in Monticello?
Inequality or Gini Index in Monticello is 0.33.
What is the Total Population of Monticello?
Total Population of Monticello is 309.
What is the Total Male Population of Monticello?
Total Male Population of Monticello is 138.
What is the Total Female Population of Monticello?
Total Female Population of Monticello is 171.
What is the Ratio of Males per 100 Females in Monticello?
There are 80.70 Males per 100 Females in Monticello.
What is the Ratio of Females per 100 Males in Monticello?
There are 123.91 Females per 100 Males in Monticello.
What is the Median Population Age in Monticello?
Median Population Age in Monticello is 28.5 Years.
What is the Average Family Size in Monticello
Average Family Size in Monticello is 6.6 People.
What is the Average Household Size in Monticello
Average Household Size in Monticello is 6.3 People.
How Large is the Labor Force in Monticello?
There are 183 People in the Labor Forcein in Monticello.
What is the Percentage of People in the Labor Force in Monticello?
79.9% of People are in the Labor Force in Monticello.