Holcomb, MO Map & Demographics
Holcomb Map
Holcomb Overview
$27,286
PER CAPITA INCOME
$58,587
AVG FAMILY INCOME
$49,342
AVG HOUSEHOLD INCOME
47.3%
WAGE / INCOME GAP [ % ]
52.7¢/ $1
WAGE / INCOME GAP [ $ ]
$10,585
FAMILY INCOME DEFICIT
0.45
INEQUALITY / GINI INDEX
764
TOTAL POPULATION
366
MALE POPULATION
398
FEMALE POPULATION
91.96
MALES / 100 FEMALES
108.74
FEMALES / 100 MALES
29.1
MEDIAN AGE
3.3
AVG FAMILY SIZE
2.7
AVG HOUSEHOLD SIZE
315
LABOR FORCE [ PEOPLE ]
57.7%
PERCENT IN LABOR FORCE
4.4%
UNEMPLOYMENT RATE
Holcomb Zip Codes
Holcomb Area Codes
Income in Holcomb
Income Overview in Holcomb
Per Capita Income in Holcomb is $27,286, while median incomes of families and households are $58,587 and $49,342 respectively.
| Characteristic | Number | Measure |
| Per Capita Income | 764 | $27,286 |
| Median Family Income | 184 | $58,587 |
| Mean Family Income | 184 | $87,967 |
| Median Household Income | 282 | $49,342 |
| Mean Household Income | 282 | $71,774 |
| Income Deficit | 184 | $10,585 |
| Wage / Income Gap (%) | 764 | 47.33% |
| Wage / Income Gap ($) | 764 | 52.67¢ per $1 |
| Gini / Inequality Index | 764 | 0.45 |
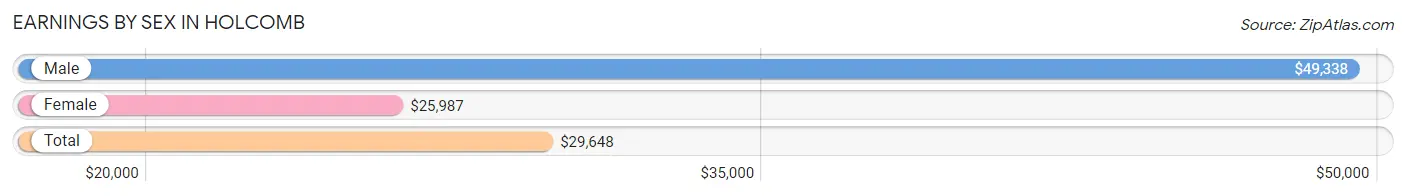
Earnings by Sex in Holcomb
Average Earnings in Holcomb are $29,648, $49,338 for men and $25,987 for women, a difference of 47.3%.
| Sex | Number | Average Earnings |
| Male | 165 (48.4%) | $49,338 |
| Female | 176 (51.6%) | $25,987 |
| Total | 341 (100.0%) | $29,648 |
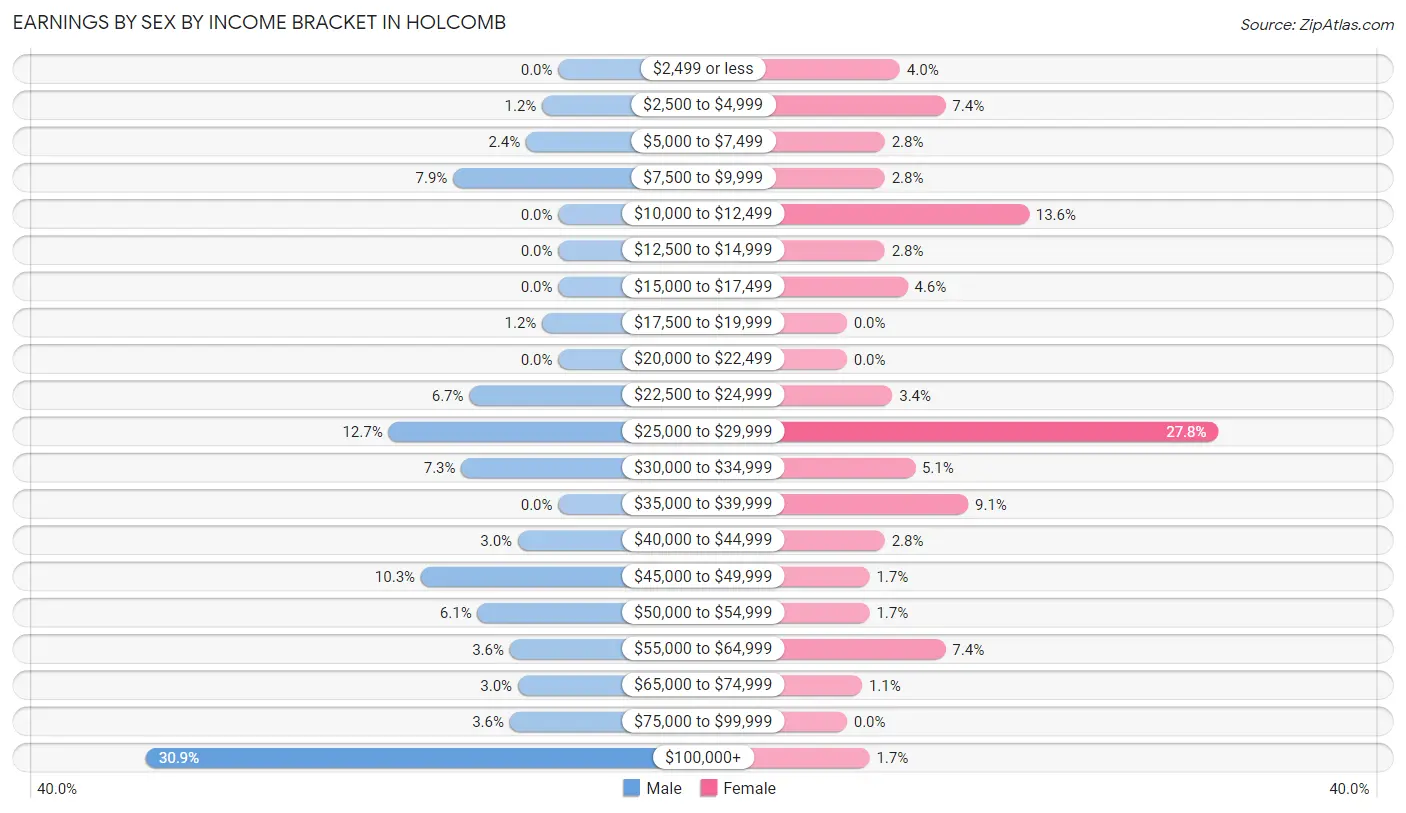
Earnings by Sex by Income Bracket in Holcomb
The most common earnings brackets in Holcomb are $100,000+ for men (51 | 30.9%) and $25,000 to $29,999 for women (49 | 27.8%).
| Income | Male | Female |
| $2,499 or less | 0 (0.0%) | 7 (4.0%) |
| $2,500 to $4,999 | 2 (1.2%) | 13 (7.4%) |
| $5,000 to $7,499 | 4 (2.4%) | 5 (2.8%) |
| $7,500 to $9,999 | 13 (7.9%) | 5 (2.8%) |
| $10,000 to $12,499 | 0 (0.0%) | 24 (13.6%) |
| $12,500 to $14,999 | 0 (0.0%) | 5 (2.8%) |
| $15,000 to $17,499 | 0 (0.0%) | 8 (4.5%) |
| $17,500 to $19,999 | 2 (1.2%) | 0 (0.0%) |
| $20,000 to $22,499 | 0 (0.0%) | 0 (0.0%) |
| $22,500 to $24,999 | 11 (6.7%) | 6 (3.4%) |
| $25,000 to $29,999 | 21 (12.7%) | 49 (27.8%) |
| $30,000 to $34,999 | 12 (7.3%) | 9 (5.1%) |
| $35,000 to $39,999 | 0 (0.0%) | 16 (9.1%) |
| $40,000 to $44,999 | 5 (3.0%) | 5 (2.8%) |
| $45,000 to $49,999 | 17 (10.3%) | 3 (1.7%) |
| $50,000 to $54,999 | 10 (6.1%) | 3 (1.7%) |
| $55,000 to $64,999 | 6 (3.6%) | 13 (7.4%) |
| $65,000 to $74,999 | 5 (3.0%) | 2 (1.1%) |
| $75,000 to $99,999 | 6 (3.6%) | 0 (0.0%) |
| $100,000+ | 51 (30.9%) | 3 (1.7%) |
| Total | 165 (100.0%) | 176 (100.0%) |
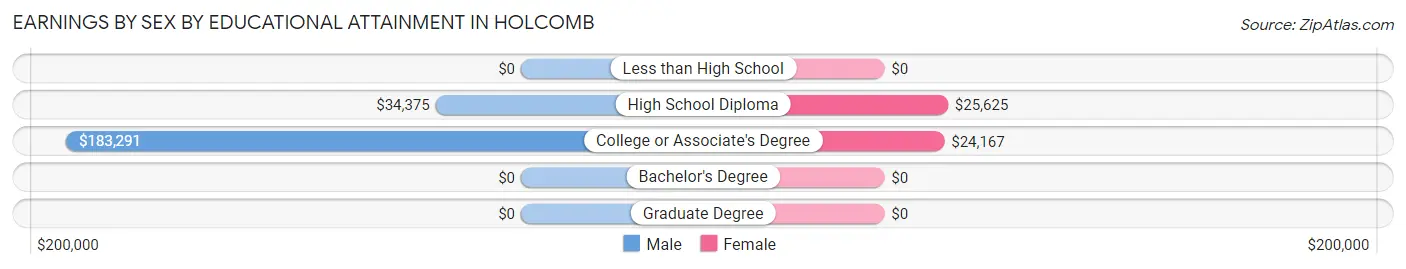
Earnings by Sex by Educational Attainment in Holcomb
| Educational Attainment | Male Income | Female Income |
| Less than High School | - | - |
| High School Diploma | $34,375 | $25,625 |
| College or Associate's Degree | $183,291 | $24,167 |
| Bachelor's Degree | - | - |
| Graduate Degree | - | - |
| Total | - | - |
Family Income in Holcomb
Family Income Brackets in Holcomb
According to the Holcomb family income data, there are 53 families falling into the $150,000 to $199,999 income range, which is the most common income bracket and makes up 28.8% of all families.
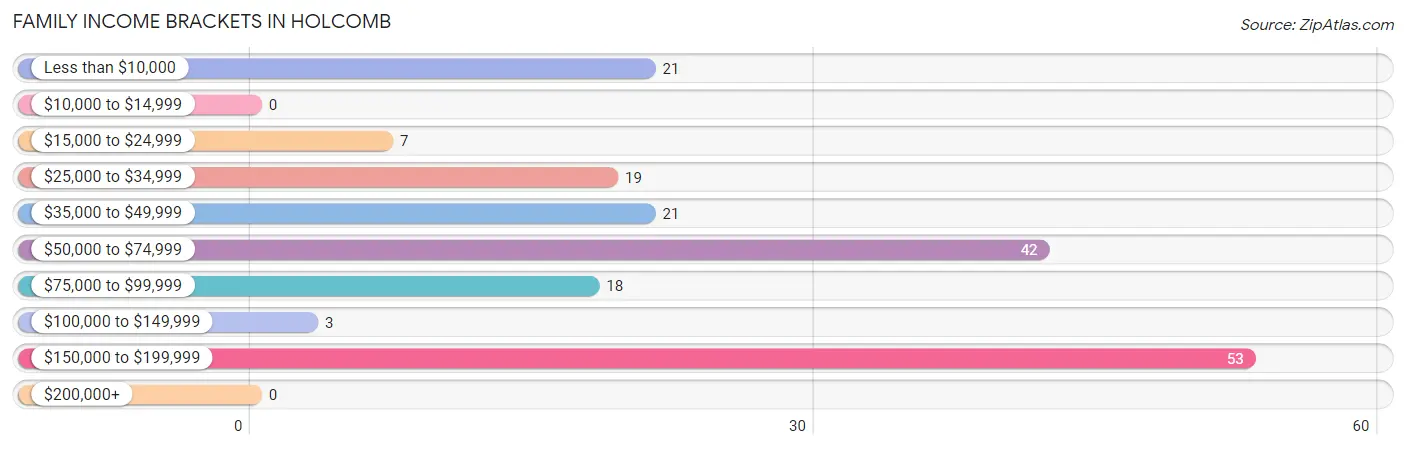
| Income Bracket | # Families | % Families |
| Less than $10,000 | 21 | 11.4% |
| $10,000 to $14,999 | 0 | 0.0% |
| $15,000 to $24,999 | 7 | 3.8% |
| $25,000 to $34,999 | 19 | 10.3% |
| $35,000 to $49,999 | 21 | 11.4% |
| $50,000 to $74,999 | 42 | 22.8% |
| $75,000 to $99,999 | 18 | 9.8% |
| $100,000 to $149,999 | 3 | 1.6% |
| $150,000 to $199,999 | 53 | 28.8% |
| $200,000+ | 0 | 0.0% |
Family Income by Famaliy Size in Holcomb
4-person families (71 | 38.6%) account for the highest median family income in Holcomb with $193,189 per family, while 4-person families (71 | 38.6%) have the highest median income of $48,297 per family member.
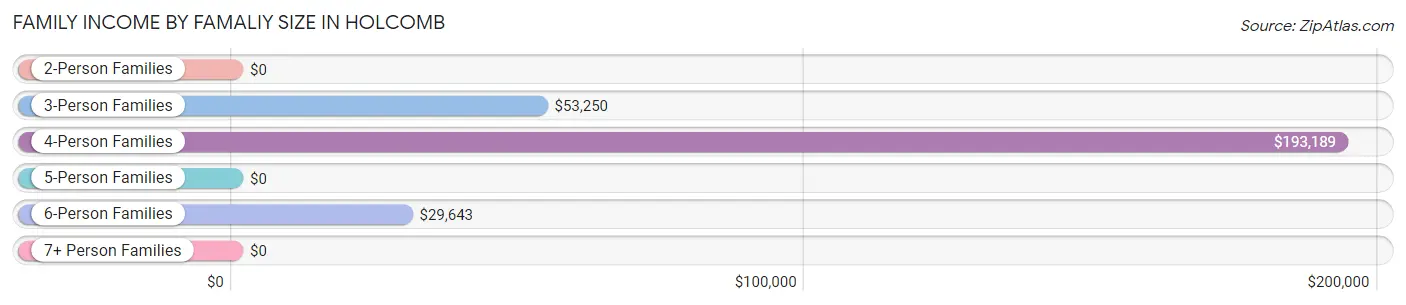
| Income Bracket | # Families | Median Income |
| 2-Person Families | 47 (25.5%) | $0 |
| 3-Person Families | 45 (24.5%) | $53,250 |
| 4-Person Families | 71 (38.6%) | $193,189 |
| 5-Person Families | 9 (4.9%) | $0 |
| 6-Person Families | 12 (6.5%) | $29,643 |
| 7+ Person Families | 0 (0.0%) | $0 |
| Total | 184 (100.0%) | $58,587 |
Family Income by Number of Earners in Holcomb
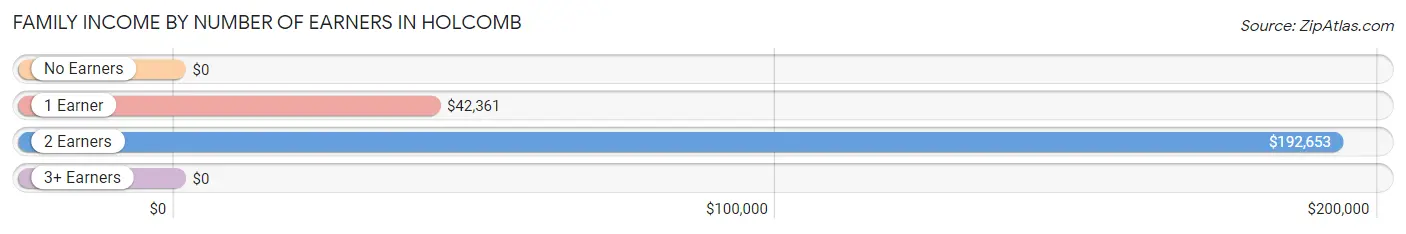
| Number of Earners | # Families | Median Income |
| No Earners | 30 (16.3%) | $0 |
| 1 Earner | 57 (31.0%) | $42,361 |
| 2 Earners | 92 (50.0%) | $192,653 |
| 3+ Earners | 5 (2.7%) | $0 |
| Total | 184 (100.0%) | $58,587 |
Household Income in Holcomb
Household Income Brackets in Holcomb
With 53 households falling in the category, the $35,000 to $49,999 income range is the most frequent in Holcomb, accounting for 18.8% of all households.
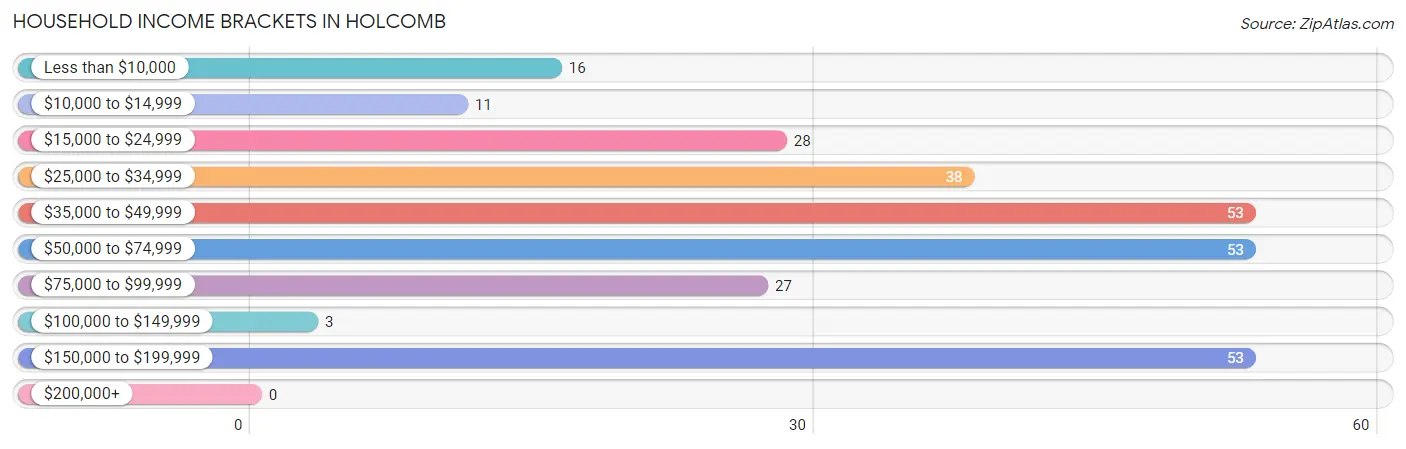
| Income Bracket | # Households | % Households |
| Less than $10,000 | 16 | 5.7% |
| $10,000 to $14,999 | 11 | 3.9% |
| $15,000 to $24,999 | 28 | 9.9% |
| $25,000 to $34,999 | 38 | 13.5% |
| $35,000 to $49,999 | 53 | 18.8% |
| $50,000 to $74,999 | 53 | 18.8% |
| $75,000 to $99,999 | 27 | 9.6% |
| $100,000 to $149,999 | 3 | 1.1% |
| $150,000 to $199,999 | 53 | 18.8% |
| $200,000+ | 0 | 0.0% |
Household Income by Householder Age in Holcomb
The median household income in Holcomb is $49,342, with the highest median household income of $47,917 found in the 15 to 24 years age bracket for the primary householder. A total of 41 households (14.5%) fall into this category. Meanwhile, the 25 to 44 years age bracket for the primary householder has the lowest median household income of $0, with 107 households (37.9%) in this group.
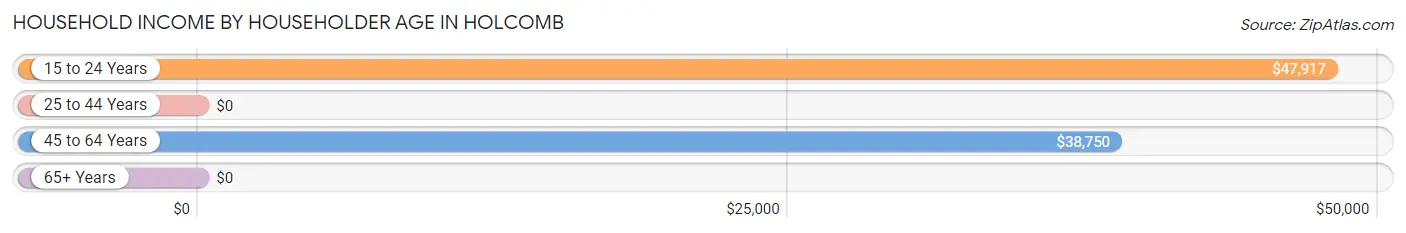
| Income Bracket | # Households | Median Income |
| 15 to 24 Years | 41 (14.5%) | $47,917 |
| 25 to 44 Years | 107 (37.9%) | $0 |
| 45 to 64 Years | 88 (31.2%) | $38,750 |
| 65+ Years | 46 (16.3%) | $0 |
| Total | 282 (100.0%) | $49,342 |
Poverty in Holcomb
Income Below Poverty by Sex and Age in Holcomb
With 20.2% poverty level for males and 26.6% for females among the residents of Holcomb, 45 to 54 year old males and 6 to 11 year old females are the most vulnerable to poverty, with 15 males (53.6%) and 17 females (100.0%) in their respective age groups living below the poverty level.
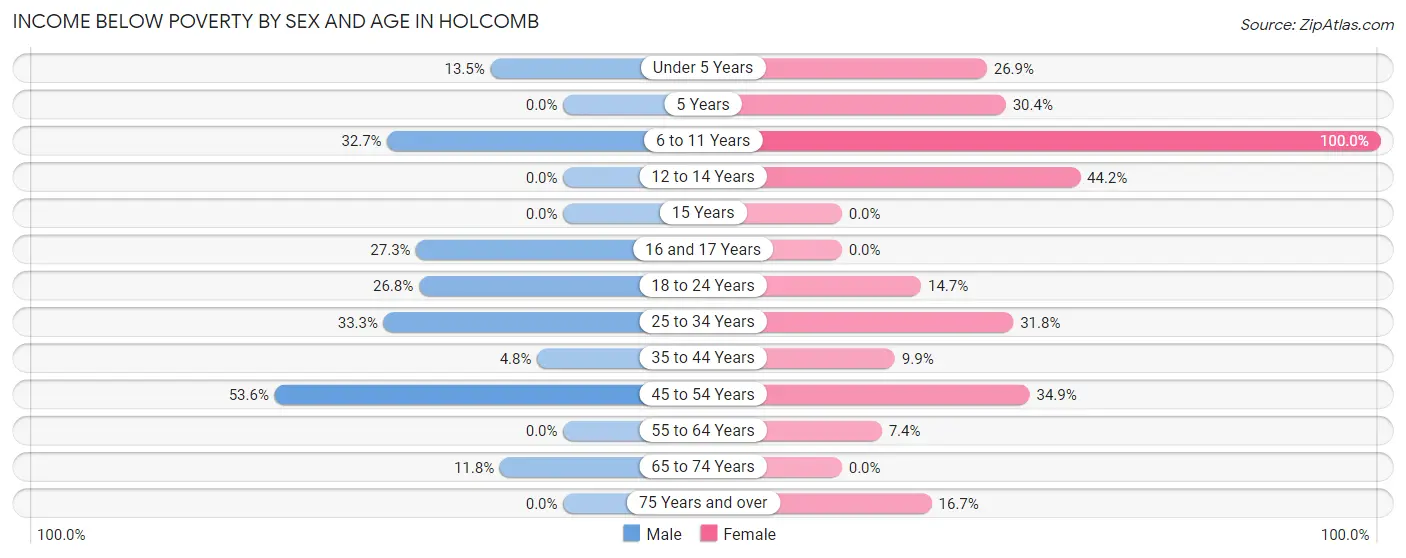
| Age Bracket | Male | Female |
| Under 5 Years | 5 (13.5%) | 7 (26.9%) |
| 5 Years | 0 (0.0%) | 7 (30.4%) |
| 6 to 11 Years | 16 (32.7%) | 17 (100.0%) |
| 12 to 14 Years | 0 (0.0%) | 23 (44.2%) |
| 15 Years | 0 (0.0%) | 0 (0.0%) |
| 16 and 17 Years | 3 (27.3%) | 0 (0.0%) |
| 18 to 24 Years | 15 (26.8%) | 10 (14.7%) |
| 25 to 34 Years | 15 (33.3%) | 7 (31.8%) |
| 35 to 44 Years | 3 (4.8%) | 7 (9.9%) |
| 45 to 54 Years | 15 (53.6%) | 23 (34.8%) |
| 55 to 64 Years | 0 (0.0%) | 2 (7.4%) |
| 65 to 74 Years | 2 (11.8%) | 0 (0.0%) |
| 75 Years and over | 0 (0.0%) | 3 (16.7%) |
| Total | 74 (20.2%) | 106 (26.6%) |
Income Above Poverty by Sex and Age in Holcomb
According to the poverty statistics in Holcomb, males aged 12 to 14 years and females aged 65 to 74 years are the age groups that are most secure financially, with 100.0% of males and 100.0% of females in these age groups living above the poverty line.
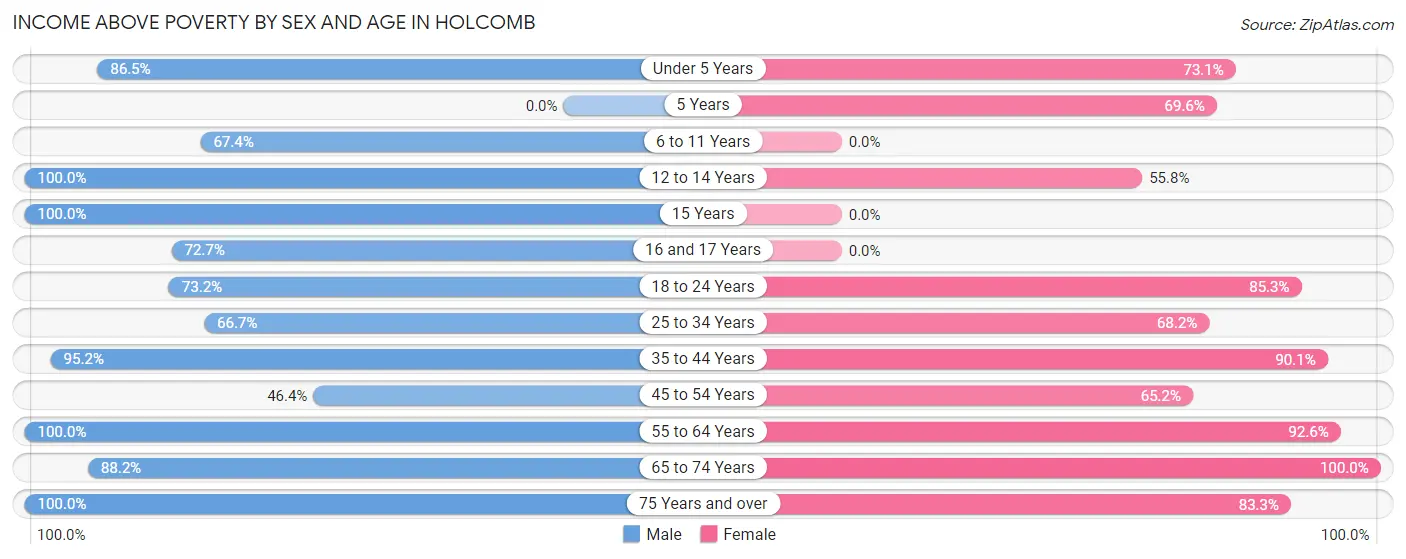
| Age Bracket | Male | Female |
| Under 5 Years | 32 (86.5%) | 19 (73.1%) |
| 5 Years | 0 (0.0%) | 16 (69.6%) |
| 6 to 11 Years | 33 (67.3%) | 0 (0.0%) |
| 12 to 14 Years | 12 (100.0%) | 29 (55.8%) |
| 15 Years | 2 (100.0%) | 0 (0.0%) |
| 16 and 17 Years | 8 (72.7%) | 0 (0.0%) |
| 18 to 24 Years | 41 (73.2%) | 58 (85.3%) |
| 25 to 34 Years | 30 (66.7%) | 15 (68.2%) |
| 35 to 44 Years | 59 (95.2%) | 64 (90.1%) |
| 45 to 54 Years | 13 (46.4%) | 43 (65.1%) |
| 55 to 64 Years | 32 (100.0%) | 25 (92.6%) |
| 65 to 74 Years | 15 (88.2%) | 8 (100.0%) |
| 75 Years and over | 15 (100.0%) | 15 (83.3%) |
| Total | 292 (79.8%) | 292 (73.4%) |
Income Below Poverty Among Married-Couple Families in Holcomb
The poverty statistics for married-couple families in Holcomb show that 11.3% or 14 of the total 124 families live below the poverty line. Families with 1 or 2 children have the highest poverty rate of 14.8%, comprising of 12 families. On the other hand, families with 3 or 4 children have the lowest poverty rate of 0.0%, which includes 0 families.
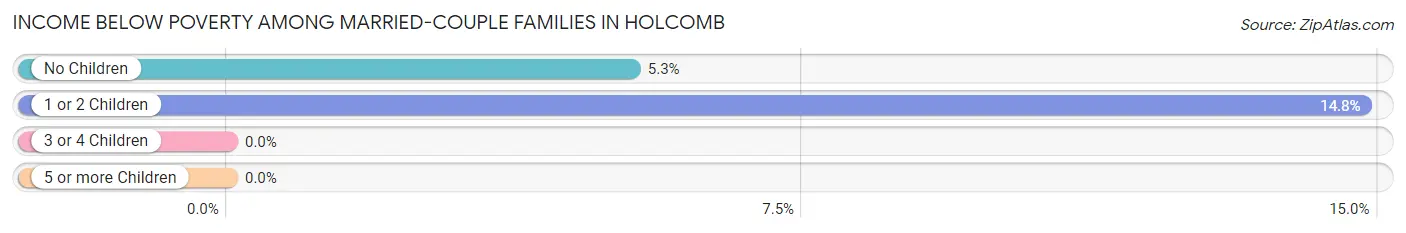
| Children | Above Poverty | Below Poverty |
| No Children | 36 (94.7%) | 2 (5.3%) |
| 1 or 2 Children | 69 (85.2%) | 12 (14.8%) |
| 3 or 4 Children | 5 (100.0%) | 0 (0.0%) |
| 5 or more Children | 0 (0.0%) | 0 (0.0%) |
| Total | 110 (88.7%) | 14 (11.3%) |
Income Below Poverty Among Single-Parent Households in Holcomb
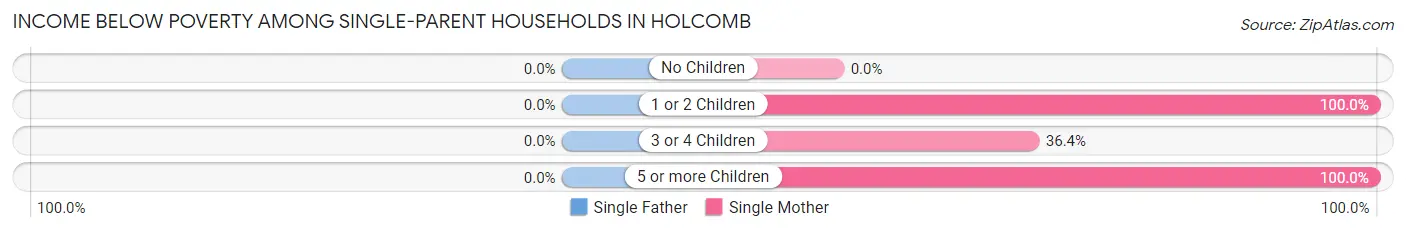
| Children | Single Father | Single Mother |
| No Children | 0 (0.0%) | 0 (0.0%) |
| 1 or 2 Children | 0 (0.0%) | 16 (100.0%) |
| 3 or 4 Children | 0 (0.0%) | 4 (36.4%) |
| 5 or more Children | 0 (0.0%) | 7 (100.0%) |
| Total | 0 (0.0%) | 27 (61.4%) |
Income Below Poverty Among Married-Couple vs Single-Parent Households in Holcomb
The poverty data for Holcomb shows that 14 of the married-couple family households (11.3%) and 27 of the single-parent households (45.0%) are living below the poverty level. Within the married-couple family households, those with 1 or 2 children have the highest poverty rate, with 12 households (14.8%) falling below the poverty line. Among the single-parent households, those with 5 or more children have the highest poverty rate, with 7 household (100.0%) living below poverty.
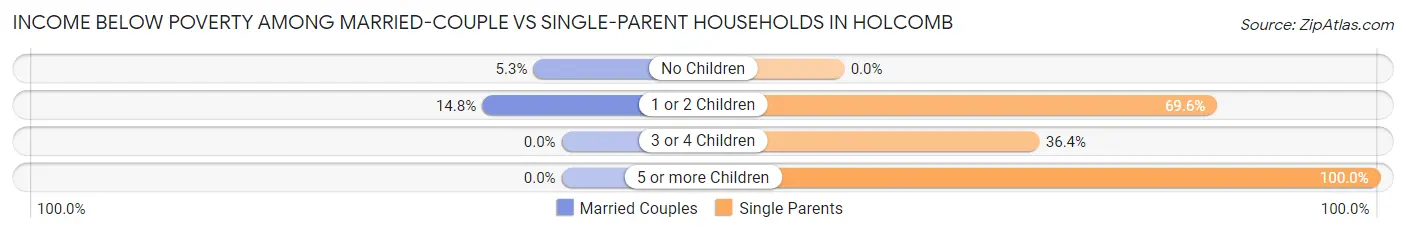
| Children | Married-Couple Families | Single-Parent Households |
| No Children | 2 (5.3%) | 0 (0.0%) |
| 1 or 2 Children | 12 (14.8%) | 16 (69.6%) |
| 3 or 4 Children | 0 (0.0%) | 4 (36.4%) |
| 5 or more Children | 0 (0.0%) | 7 (100.0%) |
| Total | 14 (11.3%) | 27 (45.0%) |
Race in Holcomb
The most populous races in Holcomb are White / Caucasian (633 | 82.9%), Two or more Races (123 | 16.1%), and Hispanic or Latino (67 | 8.8%).
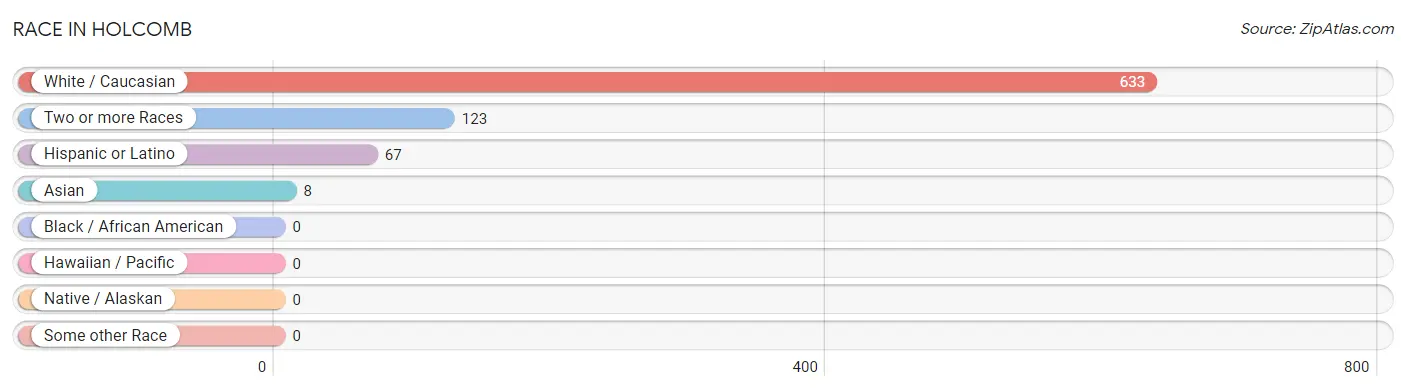
| Race | # Population | % Population |
| Asian | 8 | 1.1% |
| Black / African American | 0 | 0.0% |
| Hawaiian / Pacific | 0 | 0.0% |
| Hispanic or Latino | 67 | 8.8% |
| Native / Alaskan | 0 | 0.0% |
| White / Caucasian | 633 | 82.9% |
| Two or more Races | 123 | 16.1% |
| Some other Race | 0 | 0.0% |
| Total | 764 | 100.0% |
Ancestry in Holcomb
The most populous ancestries reported in Holcomb are Irish (156 | 20.4%), German (115 | 15.0%), Mexican (67 | 8.8%), American (65 | 8.5%), and English (62 | 8.1%), together accounting for 60.9% of all Holcomb residents.
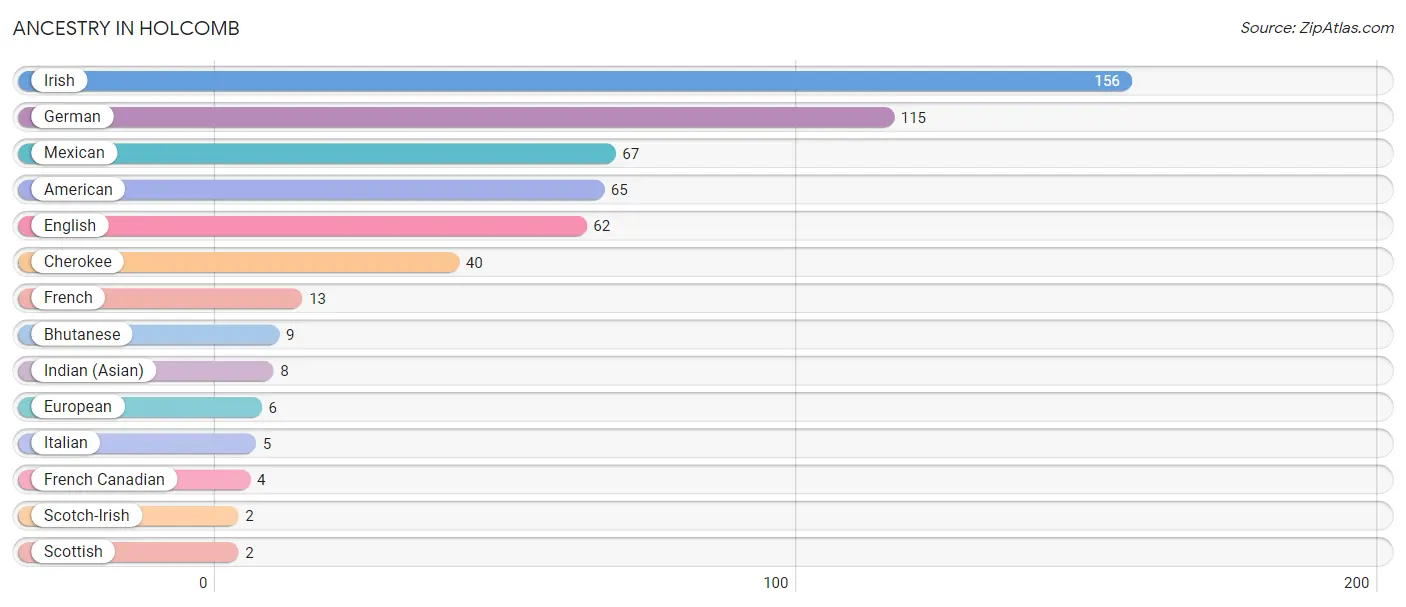
| Ancestry | # Population | % Population |
| American | 65 | 8.5% |
| Bhutanese | 9 | 1.2% |
| Cherokee | 40 | 5.2% |
| English | 62 | 8.1% |
| European | 6 | 0.8% |
| French | 13 | 1.7% |
| French Canadian | 4 | 0.5% |
| German | 115 | 15.0% |
| Indian (Asian) | 8 | 1.1% |
| Irish | 156 | 20.4% |
| Italian | 5 | 0.6% |
| Mexican | 67 | 8.8% |
| Scotch-Irish | 2 | 0.3% |
| Scottish | 2 | 0.3% | View All 14 Rows |
Immigrants in Holcomb
The most numerous immigrant groups reported in Holcomb came from Central America (13 | 1.7%), Latin America (13 | 1.7%), Mexico (13 | 1.7%), Asia (8 | 1.1%), and Malaysia (8 | 1.1%), together accounting for 7.2% of all Holcomb residents.
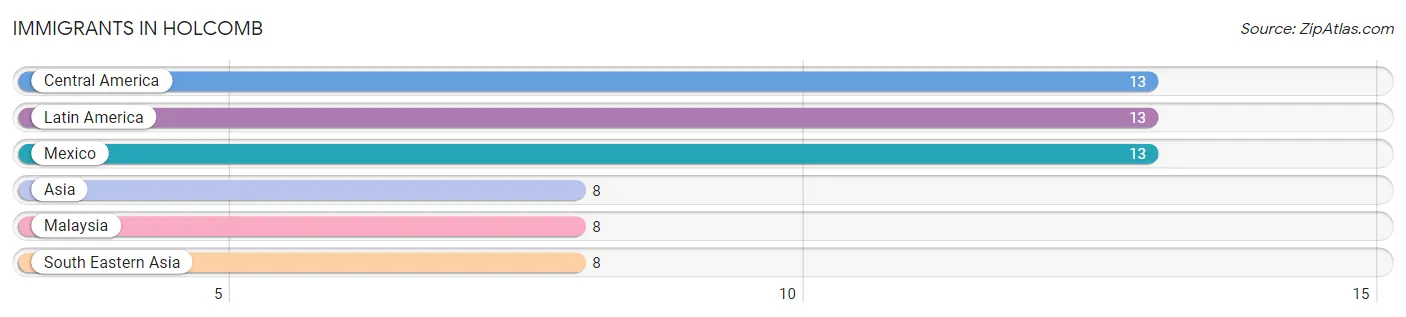
| Immigration Origin | # Population | % Population |
| Asia | 8 | 1.1% |
| Central America | 13 | 1.7% |
| Latin America | 13 | 1.7% |
| Malaysia | 8 | 1.1% |
| Mexico | 13 | 1.7% |
| South Eastern Asia | 8 | 1.1% | View All 6 Rows |
Sex and Age in Holcomb
Sex and Age in Holcomb
The most populous age groups in Holcomb are 40 to 44 Years (57 | 15.6%) for men and 10 to 14 Years (58 | 14.6%) for women.
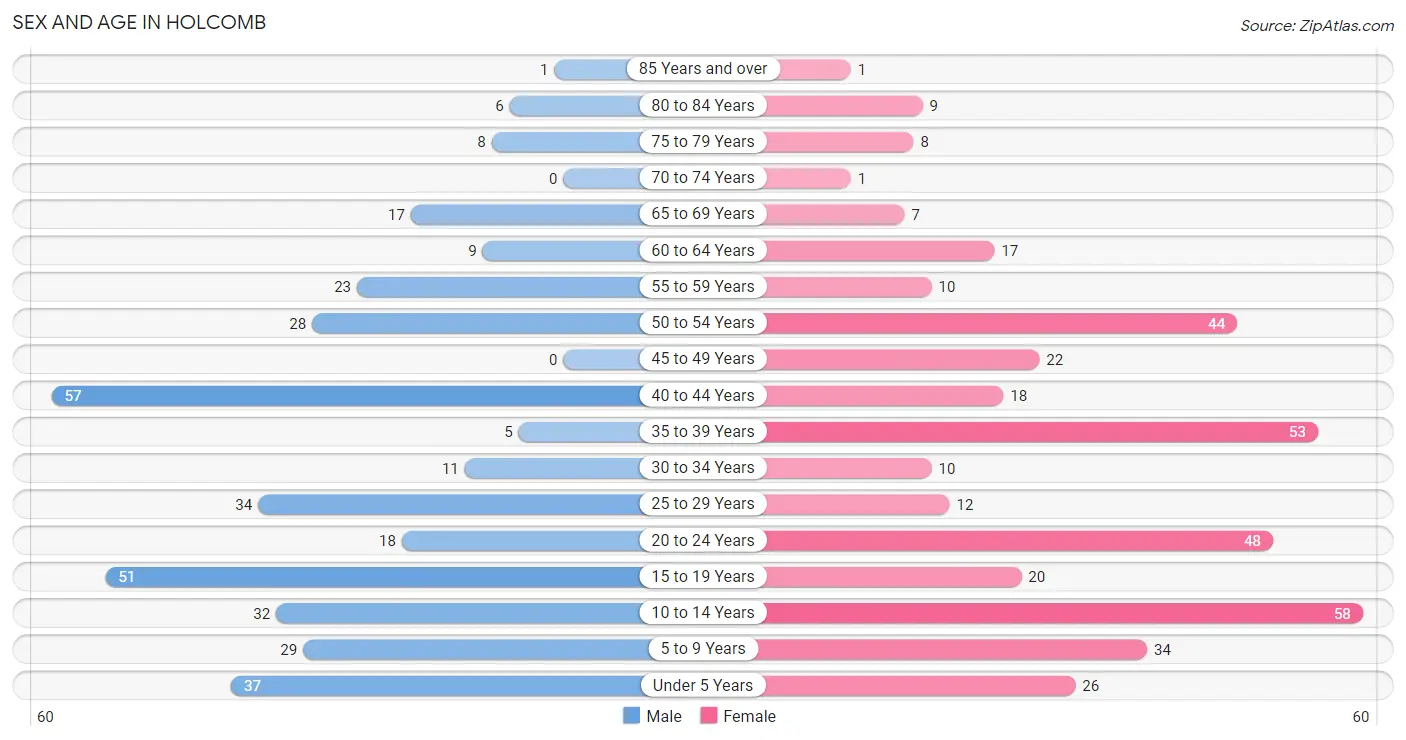
| Age Bracket | Male | Female |
| Under 5 Years | 37 (10.1%) | 26 (6.5%) |
| 5 to 9 Years | 29 (7.9%) | 34 (8.5%) |
| 10 to 14 Years | 32 (8.7%) | 58 (14.6%) |
| 15 to 19 Years | 51 (13.9%) | 20 (5.0%) |
| 20 to 24 Years | 18 (4.9%) | 48 (12.1%) |
| 25 to 29 Years | 34 (9.3%) | 12 (3.0%) |
| 30 to 34 Years | 11 (3.0%) | 10 (2.5%) |
| 35 to 39 Years | 5 (1.4%) | 53 (13.3%) |
| 40 to 44 Years | 57 (15.6%) | 18 (4.5%) |
| 45 to 49 Years | 0 (0.0%) | 22 (5.5%) |
| 50 to 54 Years | 28 (7.6%) | 44 (11.1%) |
| 55 to 59 Years | 23 (6.3%) | 10 (2.5%) |
| 60 to 64 Years | 9 (2.5%) | 17 (4.3%) |
| 65 to 69 Years | 17 (4.6%) | 7 (1.8%) |
| 70 to 74 Years | 0 (0.0%) | 1 (0.3%) |
| 75 to 79 Years | 8 (2.2%) | 8 (2.0%) |
| 80 to 84 Years | 6 (1.6%) | 9 (2.3%) |
| 85 Years and over | 1 (0.3%) | 1 (0.3%) |
| Total | 366 (100.0%) | 398 (100.0%) |
Families and Households in Holcomb
Median Family Size in Holcomb
The median family size in Holcomb is 3.32 persons per family, with married-couple families (124 | 67.4%) accounting for the largest median family size of 3.41 persons per family. On the other hand, single male/father families (16 | 8.7%) represent the smallest median family size with 2.56 persons per family.
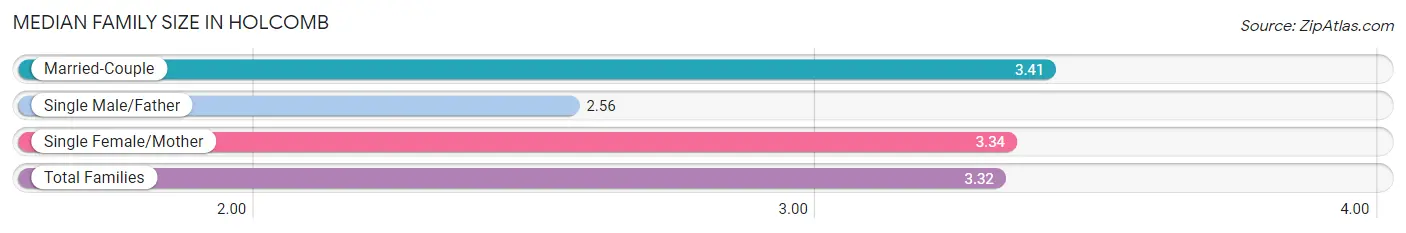
| Family Type | # Families | Family Size |
| Married-Couple | 124 (67.4%) | 3.41 |
| Single Male/Father | 16 (8.7%) | 2.56 |
| Single Female/Mother | 44 (23.9%) | 3.34 |
| Total Families | 184 (100.0%) | 3.32 |
Median Household Size in Holcomb
The median household size in Holcomb is 2.68 persons per household, with single female/mother households (44 | 15.6%) accounting for the largest median household size of 4.09 persons per household. non-family households (98 | 34.7%) represent the smallest median household size with 1.14 persons per household.
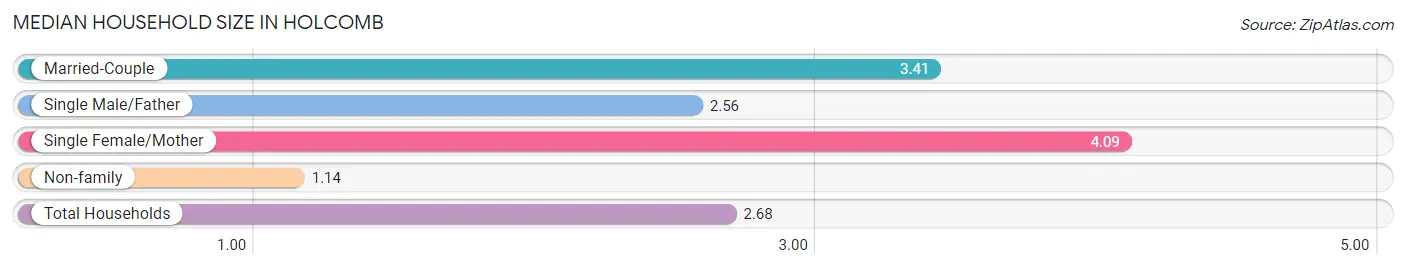
| Household Type | # Households | Household Size |
| Married-Couple | 124 (44.0%) | 3.41 |
| Single Male/Father | 16 (5.7%) | 2.56 |
| Single Female/Mother | 44 (15.6%) | 4.09 |
| Non-family | 98 (34.7%) | 1.14 |
| Total Households | 282 (100.0%) | 2.68 |
Household Size by Marriage Status in Holcomb
Out of a total of 282 households in Holcomb, 184 (65.2%) are family households, while 98 (34.7%) are nonfamily households. The most numerous type of family households are 4-person households, comprising 83, and the most common type of nonfamily households are 1-person households, comprising 87.
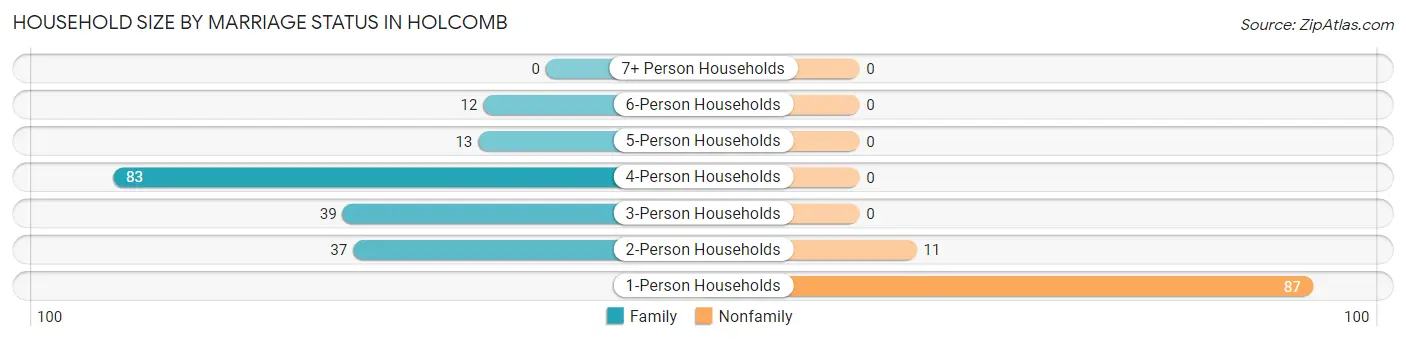
| Household Size | Family Households | Nonfamily Households |
| 1-Person Households | - | 87 (30.8%) |
| 2-Person Households | 37 (13.1%) | 11 (3.9%) |
| 3-Person Households | 39 (13.8%) | 0 (0.0%) |
| 4-Person Households | 83 (29.4%) | 0 (0.0%) |
| 5-Person Households | 13 (4.6%) | 0 (0.0%) |
| 6-Person Households | 12 (4.3%) | 0 (0.0%) |
| 7+ Person Households | 0 (0.0%) | 0 (0.0%) |
| Total | 184 (65.2%) | 98 (34.7%) |
Female Fertility in Holcomb
Fertility by Age in Holcomb
Average fertility rate in Holcomb is 144.0 births per 1,000 women. Women in the age bracket of 20 to 34 years have the highest fertility rate with 171.0 births per 1,000 women. Women in the age bracket of 35 to 50 years acount for 57.1% of all women with births.
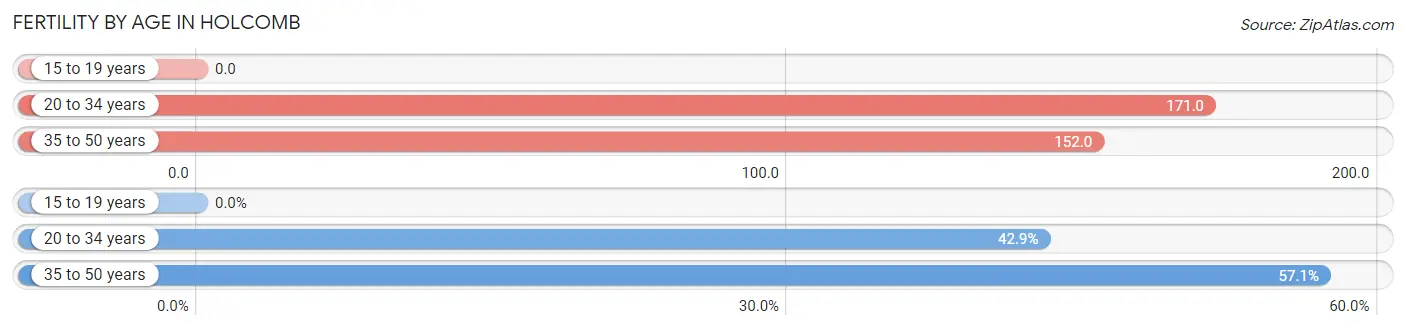
| Age Bracket | Women with Births | Births / 1,000 Women |
| 15 to 19 years | 0 (0.0%) | 0.0 |
| 20 to 34 years | 12 (42.9%) | 171.0 |
| 35 to 50 years | 16 (57.1%) | 152.0 |
| Total | 28 (100.0%) | 144.0 |
Fertility by Age by Marriage Status in Holcomb
67.9% of women with births (28) in Holcomb are married. The highest percentage of unmarried women with births falls into 20 to 34 years age bracket with 75.0% of them unmarried at the time of birth, while the lowest percentage of unmarried women with births belong to 35 to 50 years age bracket with 0.0% of them unmarried.
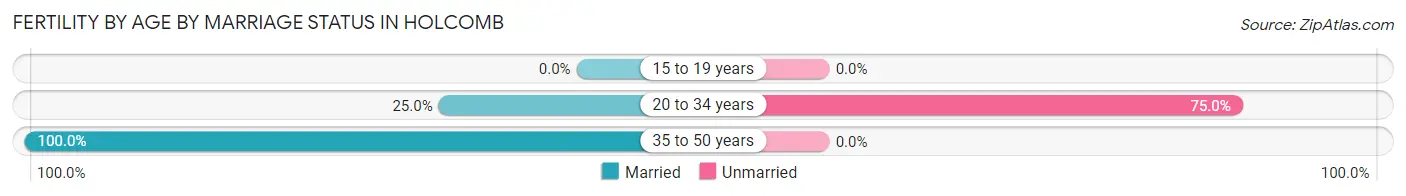
| Age Bracket | Married | Unmarried |
| 15 to 19 years | 0 (0.0%) | 0 (0.0%) |
| 20 to 34 years | 3 (25.0%) | 9 (75.0%) |
| 35 to 50 years | 16 (100.0%) | 0 (0.0%) |
| Total | 19 (67.9%) | 9 (32.1%) |
Fertility by Education in Holcomb
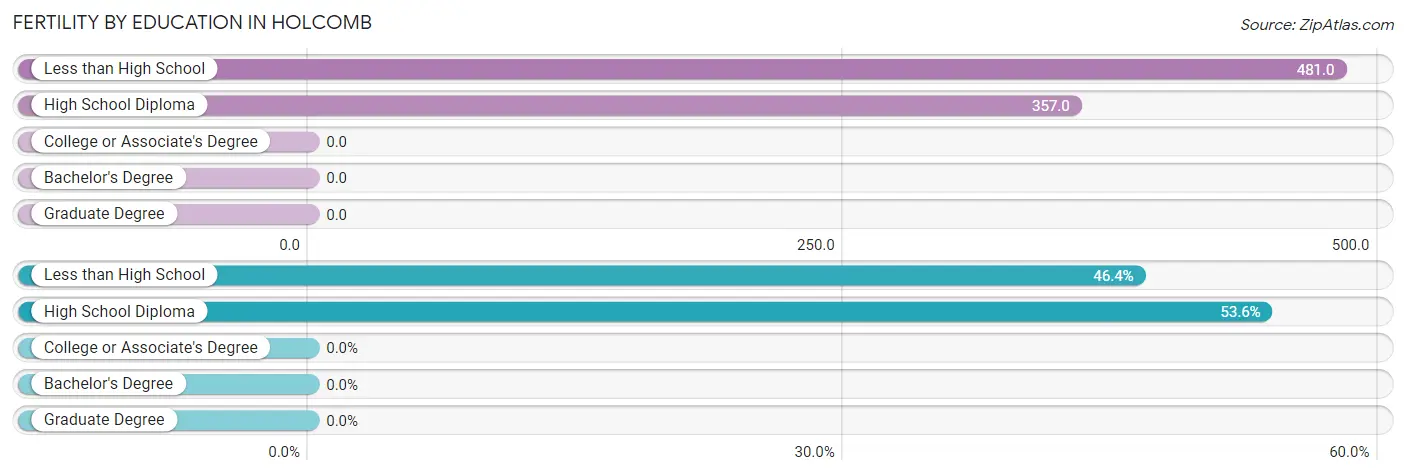
| Educational Attainment | Women with Births | Births / 1,000 Women |
| Less than High School | 13 (46.4%) | 481.0 |
| High School Diploma | 15 (53.6%) | 357.0 |
| College or Associate's Degree | 0 (0.0%) | 0.0 |
| Bachelor's Degree | 0 (0.0%) | 0.0 |
| Graduate Degree | 0 (0.0%) | 0.0 |
| Total | 28 (100.0%) | 144.0 |
Fertility by Education by Marriage Status in Holcomb
32.1% of women with births in Holcomb are unmarried. Women with the educational attainment of less than high school are most likely to be married with 100.0% of them married at childbirth, while women with the educational attainment of high school diploma are least likely to be married with 60.0% of them unmarried at childbirth.
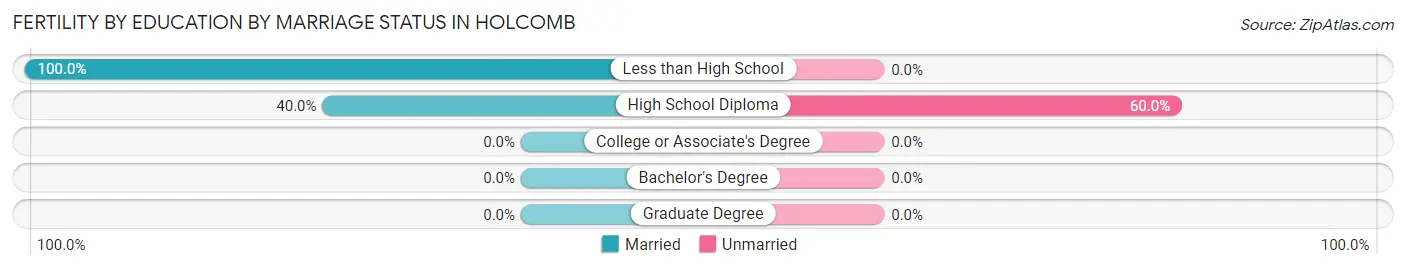
| Educational Attainment | Married | Unmarried |
| Less than High School | 13 (100.0%) | 0 (0.0%) |
| High School Diploma | 6 (40.0%) | 9 (60.0%) |
| College or Associate's Degree | 0 (0.0%) | 0 (0.0%) |
| Bachelor's Degree | 0 (0.0%) | 0 (0.0%) |
| Graduate Degree | 0 (0.0%) | 0 (0.0%) |
| Total | 19 (67.9%) | 9 (32.1%) |
Employment Characteristics in Holcomb
Employment by Class of Employer in Holcomb
Among the 283 employed individuals in Holcomb, private company employees (183 | 64.7%), not-for-profit organizations (38 | 13.4%), and state government employees (22 | 7.8%) make up the most common classes of employment.
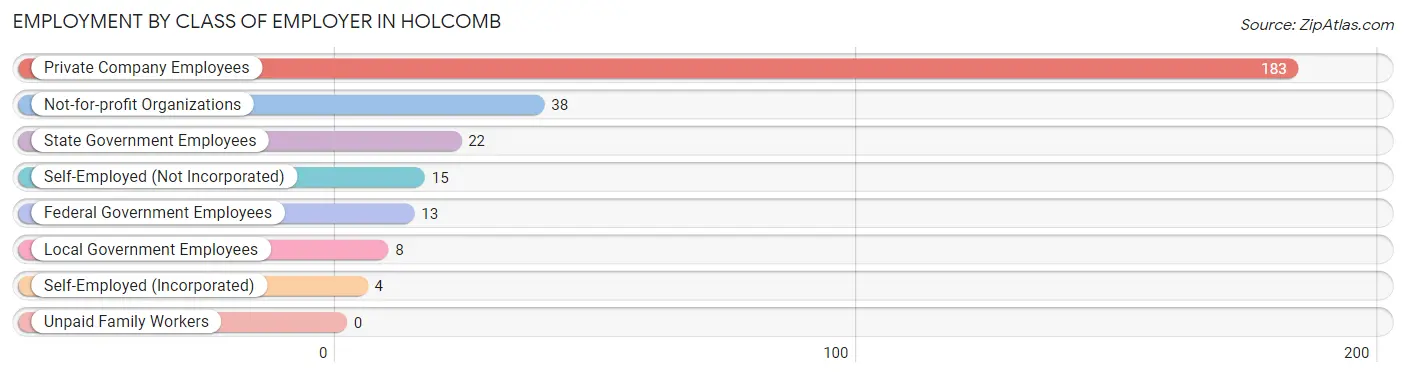
| Employer Class | # Employees | % Employees |
| Private Company Employees | 183 | 64.7% |
| Self-Employed (Incorporated) | 4 | 1.4% |
| Self-Employed (Not Incorporated) | 15 | 5.3% |
| Not-for-profit Organizations | 38 | 13.4% |
| Local Government Employees | 8 | 2.8% |
| State Government Employees | 22 | 7.8% |
| Federal Government Employees | 13 | 4.6% |
| Unpaid Family Workers | 0 | 0.0% |
| Total | 283 | 100.0% |
Employment Status by Age in Holcomb
According to the labor force statistics for Holcomb, out of the total population over 16 years of age (546), 57.7% or 315 individuals are in the labor force, with 4.4% or 14 of them unemployed. The age group with the highest labor force participation rate is 30 to 34 years, with 100.0% or 21 individuals in the labor force. Within the labor force, the 55 to 59 years age range has the highest percentage of unemployed individuals, with 53.8% or 14 of them being unemployed.
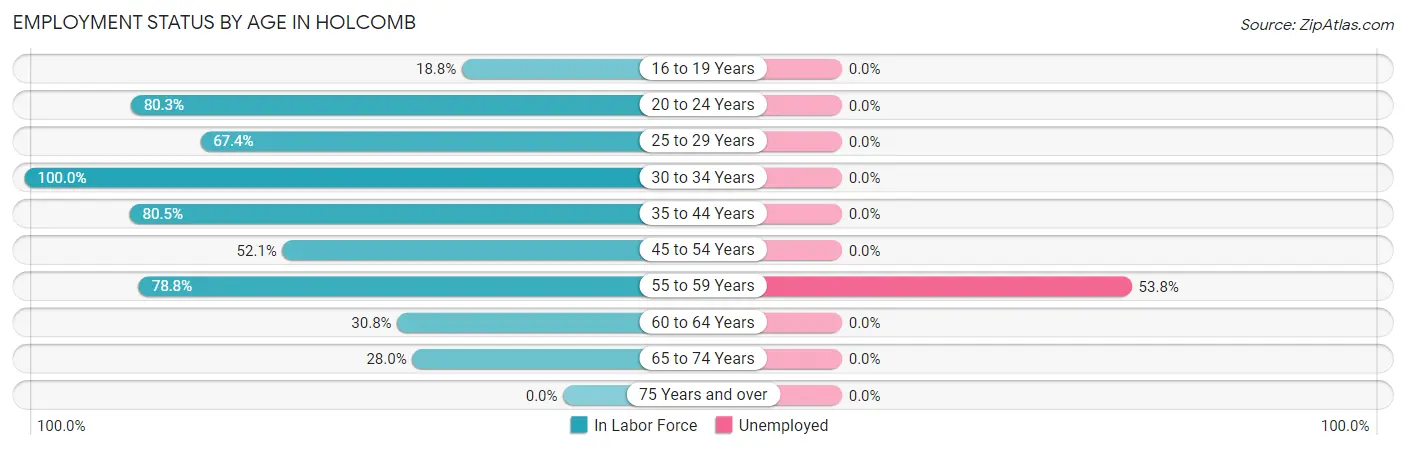
| Age Bracket | In Labor Force | Unemployed |
| 16 to 19 Years | 13 (18.8%) | 0 (0.0%) |
| 20 to 24 Years | 53 (80.3%) | 0 (0.0%) |
| 25 to 29 Years | 31 (67.4%) | 0 (0.0%) |
| 30 to 34 Years | 21 (100.0%) | 0 (0.0%) |
| 35 to 44 Years | 107 (80.5%) | 0 (0.0%) |
| 45 to 54 Years | 49 (52.1%) | 0 (0.0%) |
| 55 to 59 Years | 26 (78.8%) | 14 (53.8%) |
| 60 to 64 Years | 8 (30.8%) | 0 (0.0%) |
| 65 to 74 Years | 7 (28.0%) | 0 (0.0%) |
| 75 Years and over | 0 (0.0%) | 0 (0.0%) |
| Total | 315 (57.7%) | 14 (4.4%) |
Employment Status by Educational Attainment in Holcomb
According to labor force statistics for Holcomb, 68.6% of individuals (242) out of the total population between 25 and 64 years of age (353) are in the labor force, with 5.8% or 14 of them being unemployed. The group with the highest labor force participation rate are those with the educational attainment of bachelor's degree or higher, with 91.7% or 33 individuals in the labor force. Within the labor force, individuals with high school diploma education have the highest percentage of unemployment, with 20.9% or 14 of them being unemployed.
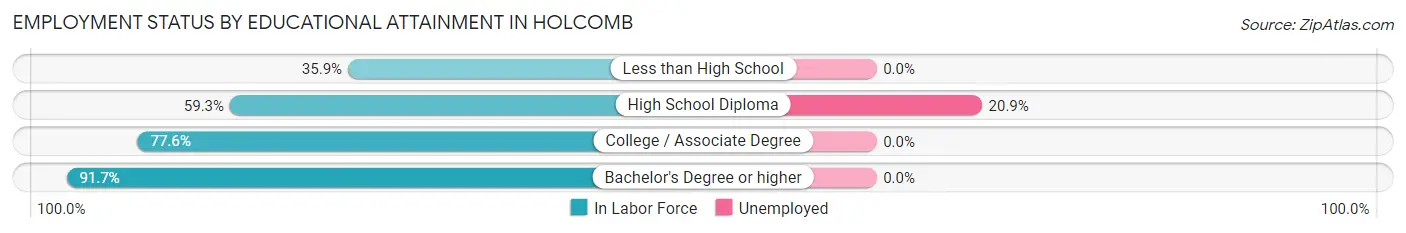
| Educational Attainment | In Labor Force | Unemployed |
| Less than High School | 14 (35.9%) | 0 (0.0%) |
| High School Diploma | 67 (59.3%) | 24 (20.9%) |
| College / Associate Degree | 128 (77.6%) | 0 (0.0%) |
| Bachelor's Degree or higher | 33 (91.7%) | 0 (0.0%) |
| Total | 242 (68.6%) | 20 (5.8%) |
Employment Occupations by Sex in Holcomb
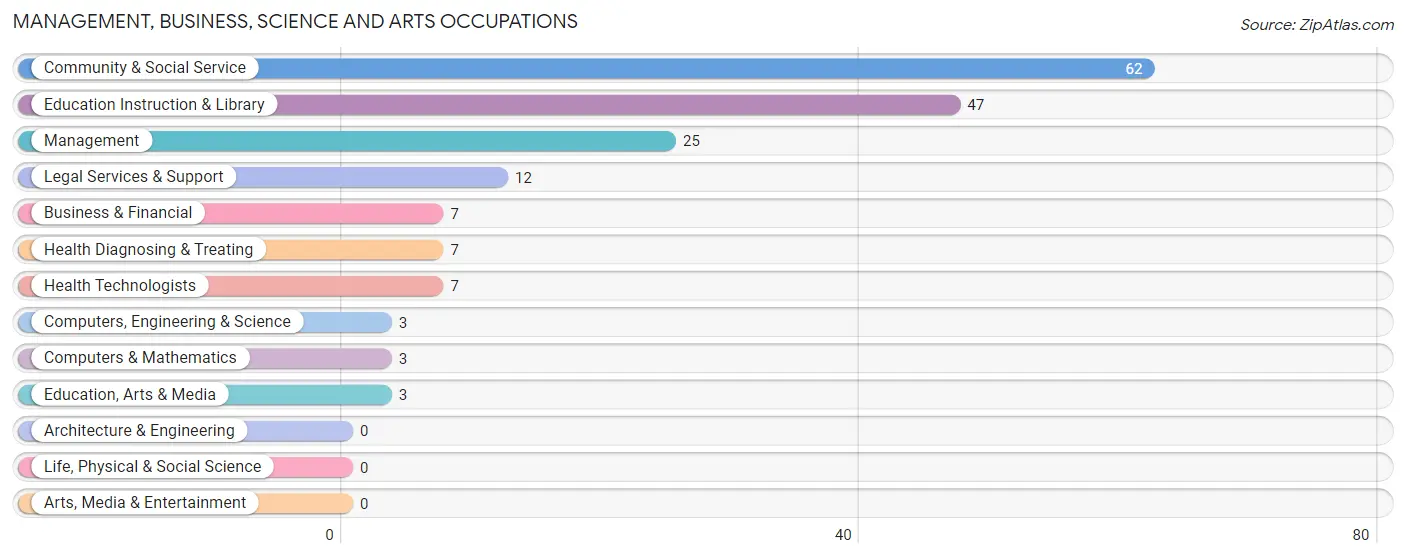
Management, Business, Science and Arts Occupations
The most common Management, Business, Science and Arts occupations in Holcomb are Community & Social Service (62 | 20.6%), Education Instruction & Library (47 | 15.6%), Management (25 | 8.3%), Legal Services & Support (12 | 4.0%), and Business & Financial (7 | 2.3%).
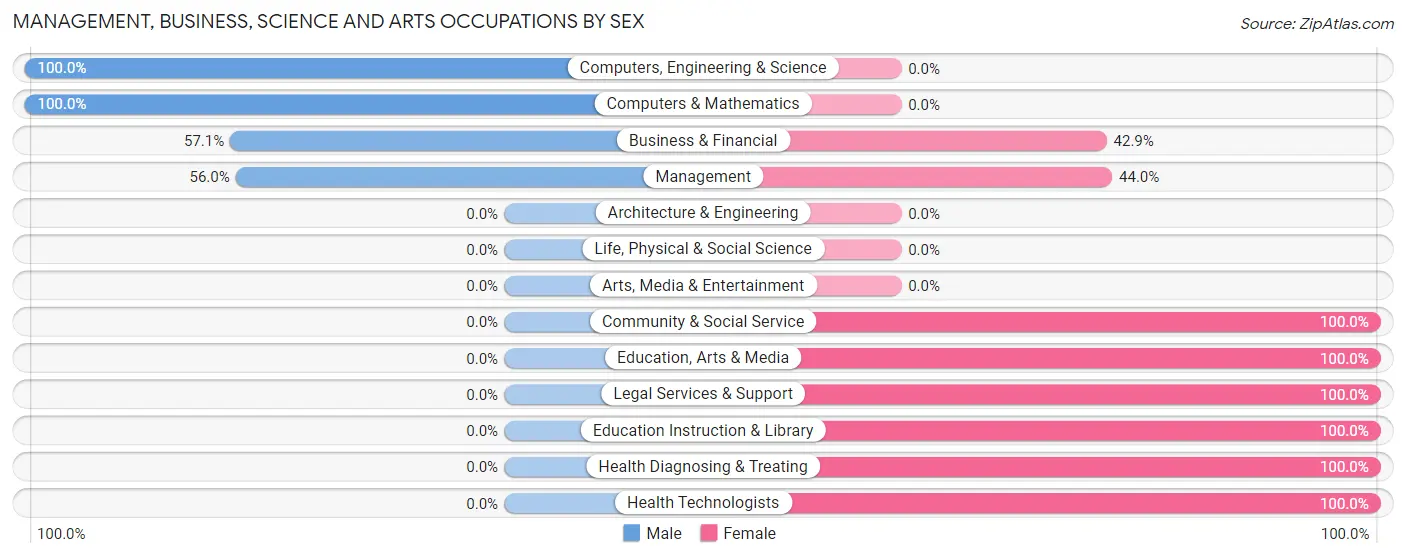
Management, Business, Science and Arts Occupations by Sex
Within the Management, Business, Science and Arts occupations in Holcomb, the most male-oriented occupations are Computers, Engineering & Science (100.0%), Computers & Mathematics (100.0%), and Business & Financial (57.1%), while the most female-oriented occupations are Community & Social Service (100.0%), Education, Arts & Media (100.0%), and Legal Services & Support (100.0%).
| Occupation | Male | Female |
| Management | 14 (56.0%) | 11 (44.0%) |
| Business & Financial | 4 (57.1%) | 3 (42.9%) |
| Computers, Engineering & Science | 3 (100.0%) | 0 (0.0%) |
| Computers & Mathematics | 3 (100.0%) | 0 (0.0%) |
| Architecture & Engineering | 0 (0.0%) | 0 (0.0%) |
| Life, Physical & Social Science | 0 (0.0%) | 0 (0.0%) |
| Community & Social Service | 0 (0.0%) | 62 (100.0%) |
| Education, Arts & Media | 0 (0.0%) | 3 (100.0%) |
| Legal Services & Support | 0 (0.0%) | 12 (100.0%) |
| Education Instruction & Library | 0 (0.0%) | 47 (100.0%) |
| Arts, Media & Entertainment | 0 (0.0%) | 0 (0.0%) |
| Health Diagnosing & Treating | 0 (0.0%) | 7 (100.0%) |
| Health Technologists | 0 (0.0%) | 7 (100.0%) |
| Total (Category) | 21 (20.2%) | 83 (79.8%) |
| Total (Overall) | 145 (48.2%) | 156 (51.8%) |
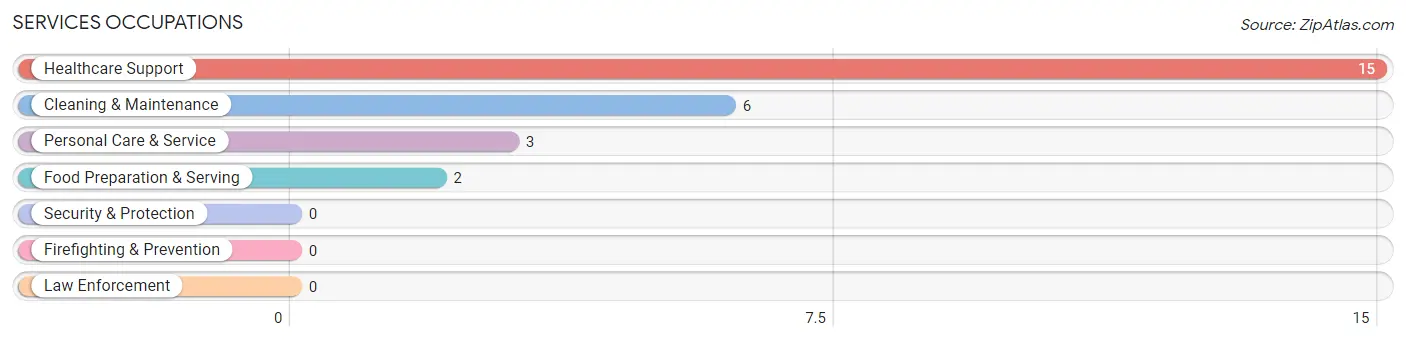
Services Occupations
The most common Services occupations in Holcomb are Healthcare Support (15 | 5.0%), Cleaning & Maintenance (6 | 2.0%), Personal Care & Service (3 | 1.0%), and Food Preparation & Serving (2 | 0.7%).
Services Occupations by Sex
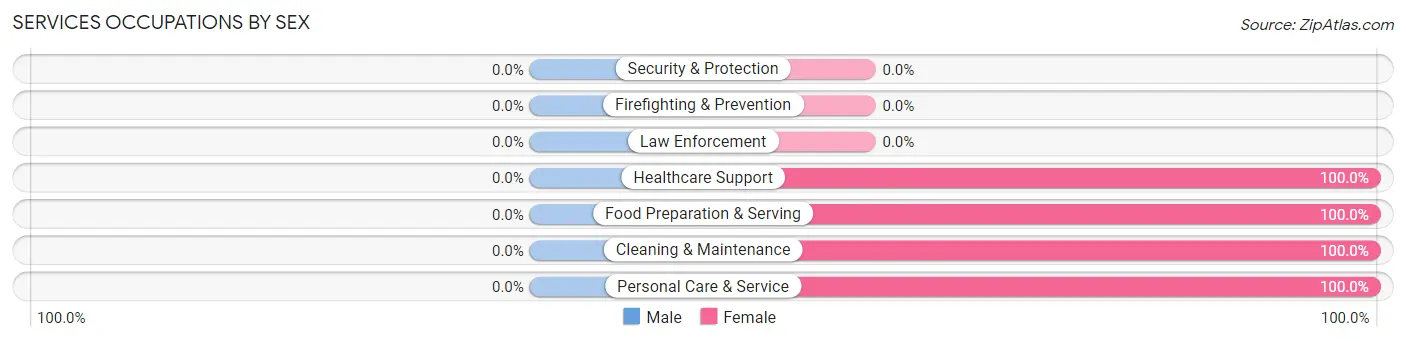
| Occupation | Male | Female |
| Healthcare Support | 0 (0.0%) | 15 (100.0%) |
| Security & Protection | 0 (0.0%) | 0 (0.0%) |
| Firefighting & Prevention | 0 (0.0%) | 0 (0.0%) |
| Law Enforcement | 0 (0.0%) | 0 (0.0%) |
| Food Preparation & Serving | 0 (0.0%) | 2 (100.0%) |
| Cleaning & Maintenance | 0 (0.0%) | 6 (100.0%) |
| Personal Care & Service | 0 (0.0%) | 3 (100.0%) |
| Total (Category) | 0 (0.0%) | 26 (100.0%) |
| Total (Overall) | 145 (48.2%) | 156 (51.8%) |
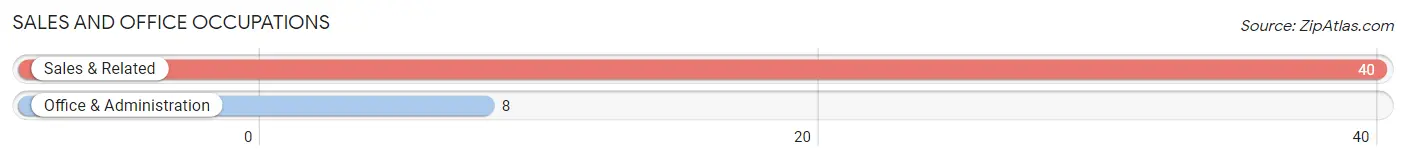
Sales and Office Occupations
The most common Sales and Office occupations in Holcomb are Sales & Related (40 | 13.3%), and Office & Administration (8 | 2.7%).
Sales and Office Occupations by Sex
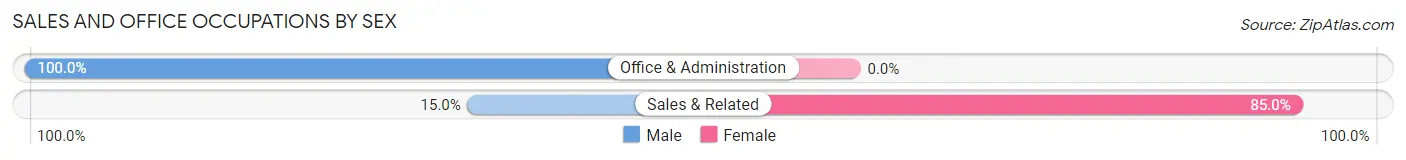
| Occupation | Male | Female |
| Sales & Related | 6 (15.0%) | 34 (85.0%) |
| Office & Administration | 8 (100.0%) | 0 (0.0%) |
| Total (Category) | 14 (29.2%) | 34 (70.8%) |
| Total (Overall) | 145 (48.2%) | 156 (51.8%) |
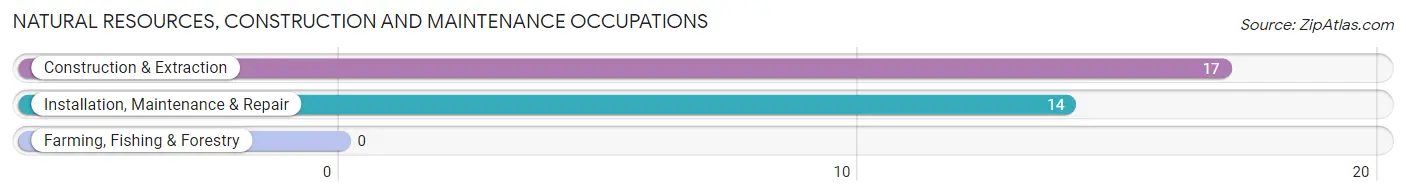
Natural Resources, Construction and Maintenance Occupations
The most common Natural Resources, Construction and Maintenance occupations in Holcomb are Construction & Extraction (17 | 5.7%), and Installation, Maintenance & Repair (14 | 4.6%).
Natural Resources, Construction and Maintenance Occupations by Sex
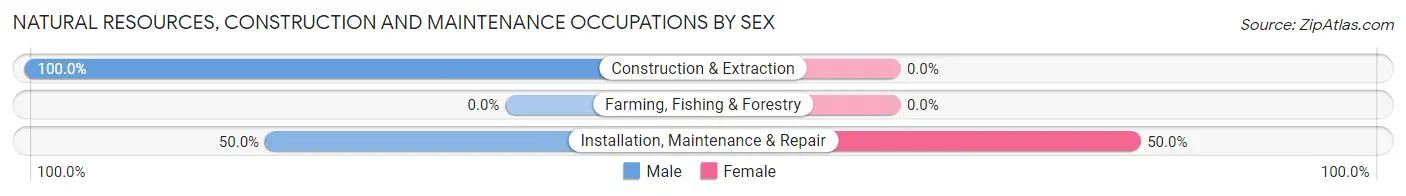
| Occupation | Male | Female |
| Farming, Fishing & Forestry | 0 (0.0%) | 0 (0.0%) |
| Construction & Extraction | 17 (100.0%) | 0 (0.0%) |
| Installation, Maintenance & Repair | 7 (50.0%) | 7 (50.0%) |
| Total (Category) | 24 (77.4%) | 7 (22.6%) |
| Total (Overall) | 145 (48.2%) | 156 (51.8%) |
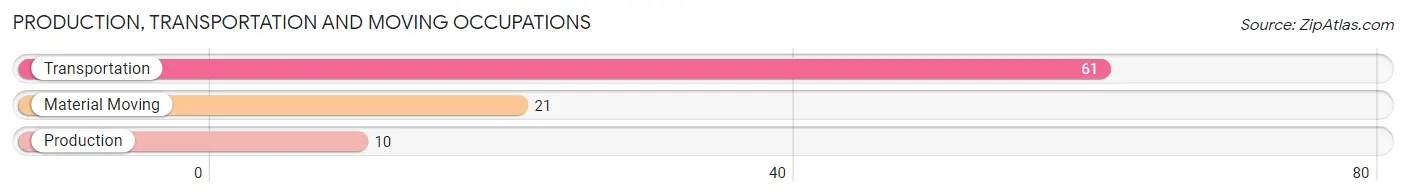
Production, Transportation and Moving Occupations
The most common Production, Transportation and Moving occupations in Holcomb are Transportation (61 | 20.3%), Material Moving (21 | 7.0%), and Production (10 | 3.3%).
Production, Transportation and Moving Occupations by Sex
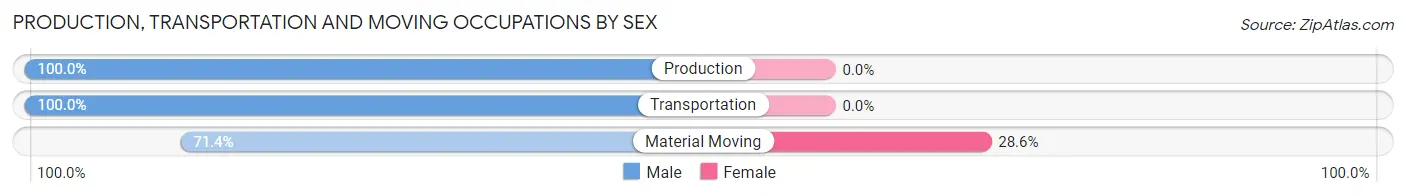
| Occupation | Male | Female |
| Production | 10 (100.0%) | 0 (0.0%) |
| Transportation | 61 (100.0%) | 0 (0.0%) |
| Material Moving | 15 (71.4%) | 6 (28.6%) |
| Total (Category) | 86 (93.5%) | 6 (6.5%) |
| Total (Overall) | 145 (48.2%) | 156 (51.8%) |
Employment Industries by Sex in Holcomb
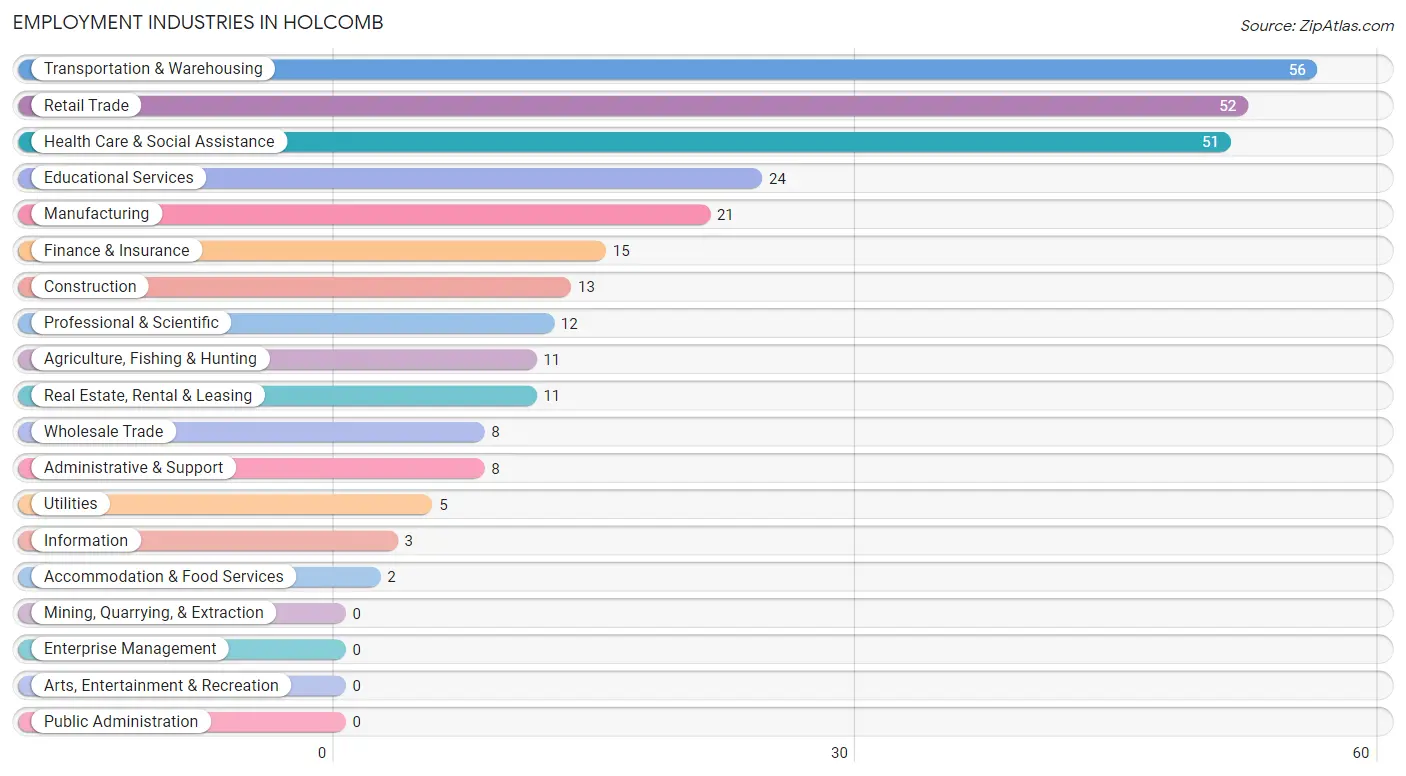
Employment Industries in Holcomb
The major employment industries in Holcomb include Transportation & Warehousing (56 | 18.6%), Retail Trade (52 | 17.3%), Health Care & Social Assistance (51 | 16.9%), Educational Services (24 | 8.0%), and Manufacturing (21 | 7.0%).
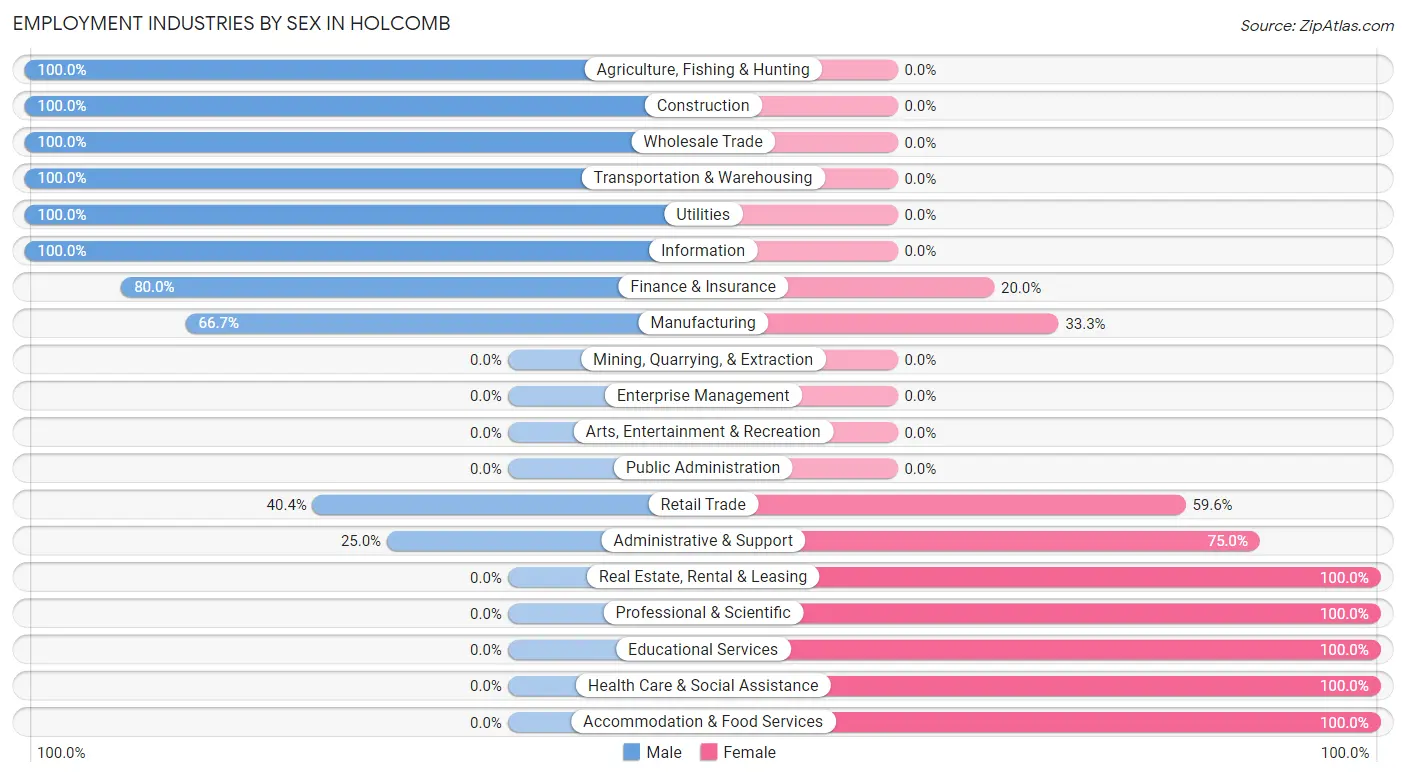
Employment Industries by Sex in Holcomb
The Holcomb industries that see more men than women are Agriculture, Fishing & Hunting (100.0%), Construction (100.0%), and Wholesale Trade (100.0%), whereas the industries that tend to have a higher number of women are Real Estate, Rental & Leasing (100.0%), Professional & Scientific (100.0%), and Educational Services (100.0%).
| Industry | Male | Female |
| Agriculture, Fishing & Hunting | 11 (100.0%) | 0 (0.0%) |
| Mining, Quarrying, & Extraction | 0 (0.0%) | 0 (0.0%) |
| Construction | 13 (100.0%) | 0 (0.0%) |
| Manufacturing | 14 (66.7%) | 7 (33.3%) |
| Wholesale Trade | 8 (100.0%) | 0 (0.0%) |
| Retail Trade | 21 (40.4%) | 31 (59.6%) |
| Transportation & Warehousing | 56 (100.0%) | 0 (0.0%) |
| Utilities | 5 (100.0%) | 0 (0.0%) |
| Information | 3 (100.0%) | 0 (0.0%) |
| Finance & Insurance | 12 (80.0%) | 3 (20.0%) |
| Real Estate, Rental & Leasing | 0 (0.0%) | 11 (100.0%) |
| Professional & Scientific | 0 (0.0%) | 12 (100.0%) |
| Enterprise Management | 0 (0.0%) | 0 (0.0%) |
| Administrative & Support | 2 (25.0%) | 6 (75.0%) |
| Educational Services | 0 (0.0%) | 24 (100.0%) |
| Health Care & Social Assistance | 0 (0.0%) | 51 (100.0%) |
| Arts, Entertainment & Recreation | 0 (0.0%) | 0 (0.0%) |
| Accommodation & Food Services | 0 (0.0%) | 2 (100.0%) |
| Public Administration | 0 (0.0%) | 0 (0.0%) |
| Total | 145 (48.2%) | 156 (51.8%) |
Education in Holcomb
School Enrollment in Holcomb
The most common levels of schooling among the 270 students in Holcomb are high school (98 | 36.3%), middle school (61 | 22.6%), and elementary school (38 | 14.1%).
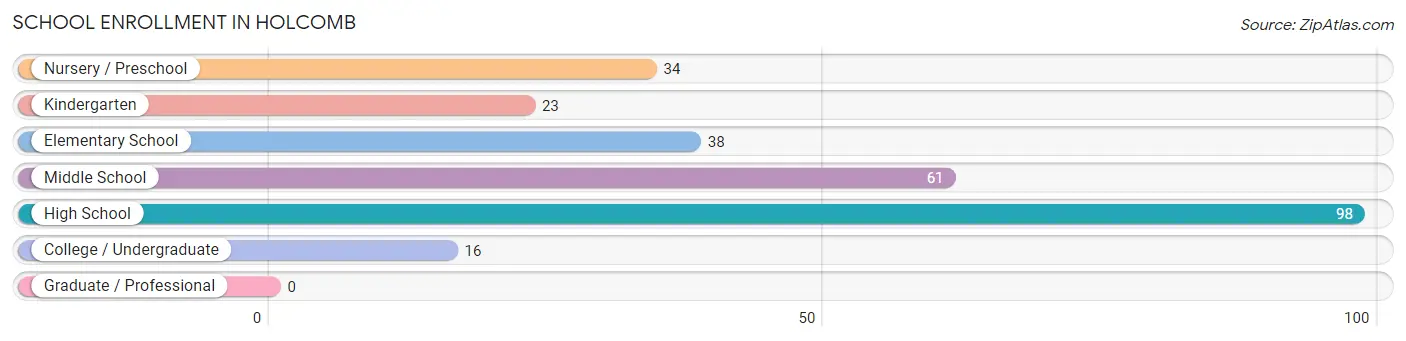
| School Level | # Students | % Students |
| Nursery / Preschool | 34 | 12.6% |
| Kindergarten | 23 | 8.5% |
| Elementary School | 38 | 14.1% |
| Middle School | 61 | 22.6% |
| High School | 98 | 36.3% |
| College / Undergraduate | 16 | 5.9% |
| Graduate / Professional | 0 | 0.0% |
| Total | 270 | 100.0% |
School Enrollment by Age by Funding Source in Holcomb
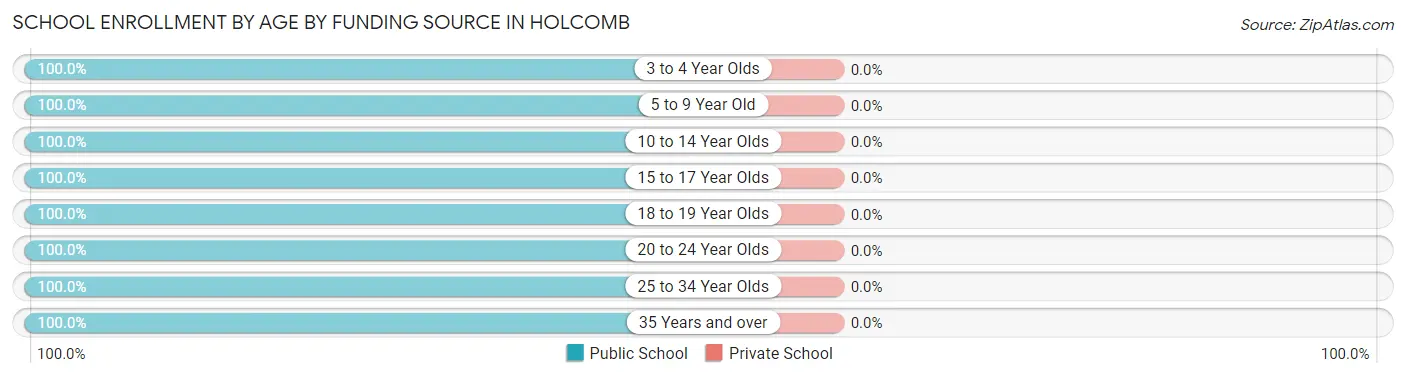
| Age Bracket | Public School | Private School |
| 3 to 4 Year Olds | 32 (100.0%) | 0 (0.0%) |
| 5 to 9 Year Old | 63 (100.0%) | 0 (0.0%) |
| 10 to 14 Year Olds | 90 (100.0%) | 0 (0.0%) |
| 15 to 17 Year Olds | 13 (100.0%) | 0 (0.0%) |
| 18 to 19 Year Olds | 56 (100.0%) | 0 (0.0%) |
| 20 to 24 Year Olds | 4 (100.0%) | 0 (0.0%) |
| 25 to 34 Year Olds | 4 (100.0%) | 0 (0.0%) |
| 35 Years and over | 8 (100.0%) | 0 (0.0%) |
| Total | 270 (100.0%) | 0 (0.0%) |
Educational Attainment by Field of Study in Holcomb
Education (13 | 36.1%), computers & mathematics (8 | 22.2%), liberal arts & history (8 | 22.2%), arts & humanities (4 | 11.1%), and science & technology (3 | 8.3%) are the most common fields of study among 36 individuals in Holcomb who have obtained a bachelor's degree or higher.
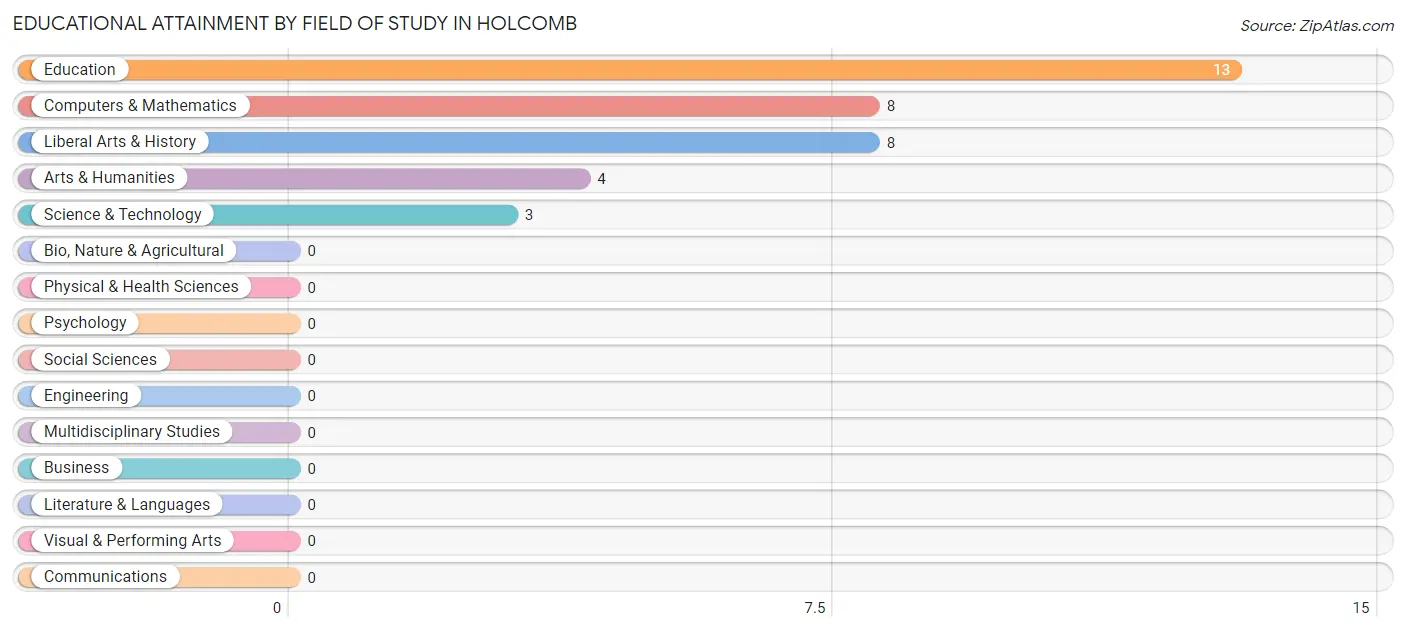
| Field of Study | # Graduates | % Graduates |
| Computers & Mathematics | 8 | 22.2% |
| Bio, Nature & Agricultural | 0 | 0.0% |
| Physical & Health Sciences | 0 | 0.0% |
| Psychology | 0 | 0.0% |
| Social Sciences | 0 | 0.0% |
| Engineering | 0 | 0.0% |
| Multidisciplinary Studies | 0 | 0.0% |
| Science & Technology | 3 | 8.3% |
| Business | 0 | 0.0% |
| Education | 13 | 36.1% |
| Literature & Languages | 0 | 0.0% |
| Liberal Arts & History | 8 | 22.2% |
| Visual & Performing Arts | 0 | 0.0% |
| Communications | 0 | 0.0% |
| Arts & Humanities | 4 | 11.1% |
| Total | 36 | 100.0% |
Transportation & Commute in Holcomb
Vehicle Availability by Sex in Holcomb
The most prevalent vehicle ownership categories in Holcomb are males with 4 vehicles (60, accounting for 42.0%) and females with 4 vehicles (16, making up 45.5%).
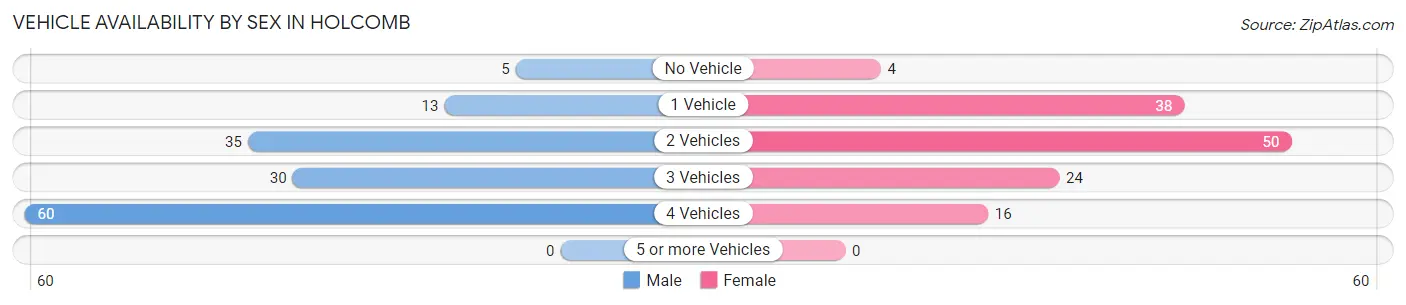
| Vehicles Available | Male | Female |
| No Vehicle | 5 (3.5%) | 4 (3.0%) |
| 1 Vehicle | 13 (9.1%) | 38 (28.8%) |
| 2 Vehicles | 35 (24.5%) | 50 (37.9%) |
| 3 Vehicles | 30 (21.0%) | 24 (18.2%) |
| 4 Vehicles | 60 (42.0%) | 16 (12.1%) |
| 5 or more Vehicles | 0 (0.0%) | 0 (0.0%) |
| Total | 143 (100.0%) | 132 (100.0%) |
Commute Time in Holcomb
The most frequently occuring commute durations in Holcomb are 45 to 59 minutes (70 commuters, 25.5%), 15 to 19 minutes (65 commuters, 23.6%), and 5 to 9 minutes (29 commuters, 10.5%).
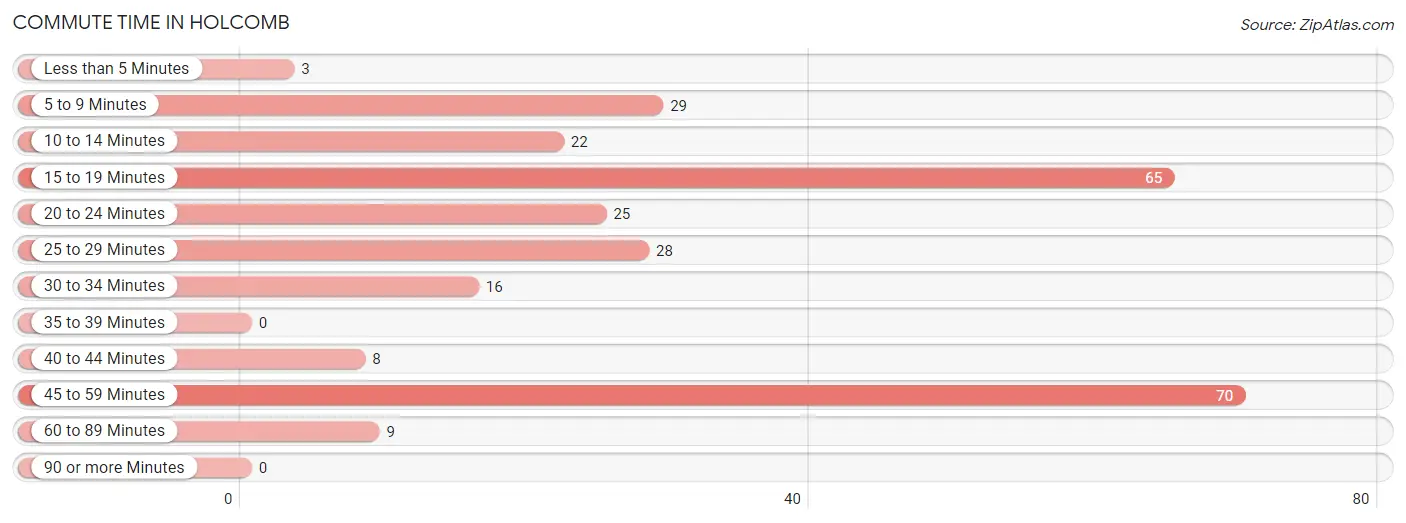
| Commute Time | # Commuters | % Commuters |
| Less than 5 Minutes | 3 | 1.1% |
| 5 to 9 Minutes | 29 | 10.5% |
| 10 to 14 Minutes | 22 | 8.0% |
| 15 to 19 Minutes | 65 | 23.6% |
| 20 to 24 Minutes | 25 | 9.1% |
| 25 to 29 Minutes | 28 | 10.2% |
| 30 to 34 Minutes | 16 | 5.8% |
| 35 to 39 Minutes | 0 | 0.0% |
| 40 to 44 Minutes | 8 | 2.9% |
| 45 to 59 Minutes | 70 | 25.5% |
| 60 to 89 Minutes | 9 | 3.3% |
| 90 or more Minutes | 0 | 0.0% |
Commute Time by Sex in Holcomb
The most common commute times in Holcomb are 45 to 59 minutes (70 commuters, 48.9%) for males and 15 to 19 minutes (50 commuters, 37.9%) for females.
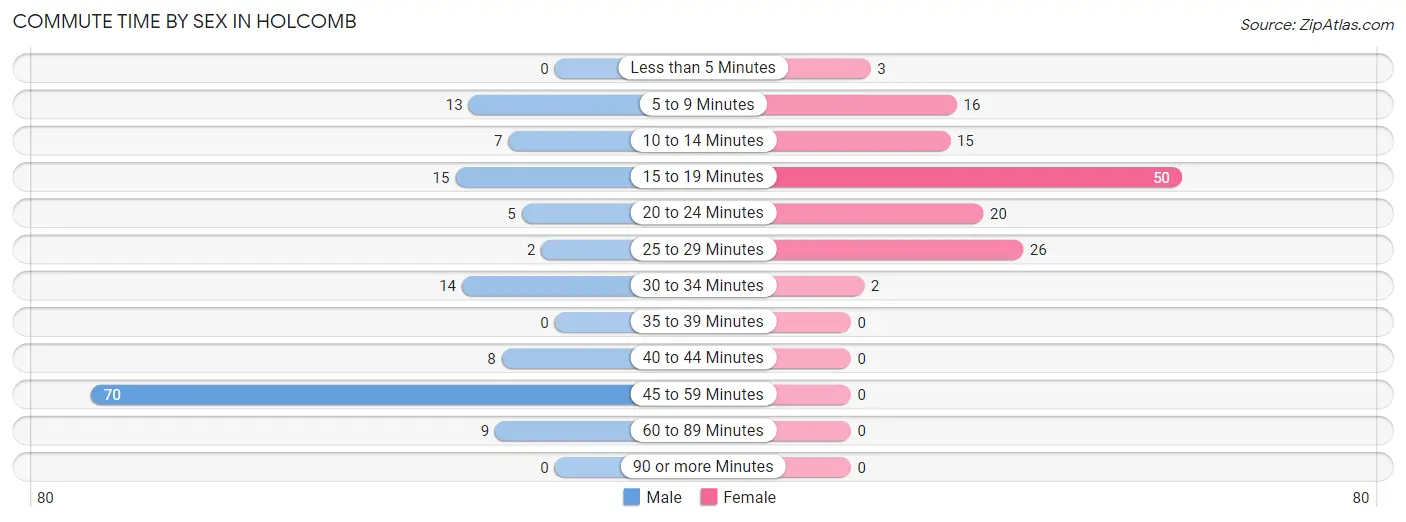
| Commute Time | Male | Female |
| Less than 5 Minutes | 0 (0.0%) | 3 (2.3%) |
| 5 to 9 Minutes | 13 (9.1%) | 16 (12.1%) |
| 10 to 14 Minutes | 7 (4.9%) | 15 (11.4%) |
| 15 to 19 Minutes | 15 (10.5%) | 50 (37.9%) |
| 20 to 24 Minutes | 5 (3.5%) | 20 (15.1%) |
| 25 to 29 Minutes | 2 (1.4%) | 26 (19.7%) |
| 30 to 34 Minutes | 14 (9.8%) | 2 (1.5%) |
| 35 to 39 Minutes | 0 (0.0%) | 0 (0.0%) |
| 40 to 44 Minutes | 8 (5.6%) | 0 (0.0%) |
| 45 to 59 Minutes | 70 (48.9%) | 0 (0.0%) |
| 60 to 89 Minutes | 9 (6.3%) | 0 (0.0%) |
| 90 or more Minutes | 0 (0.0%) | 0 (0.0%) |
Time of Departure to Work by Sex in Holcomb
The most frequent times of departure to work in Holcomb are 6:00 AM to 6:29 AM (60, 42.0%) for males and 6:30 AM to 6:59 AM (33, 25.0%) for females.
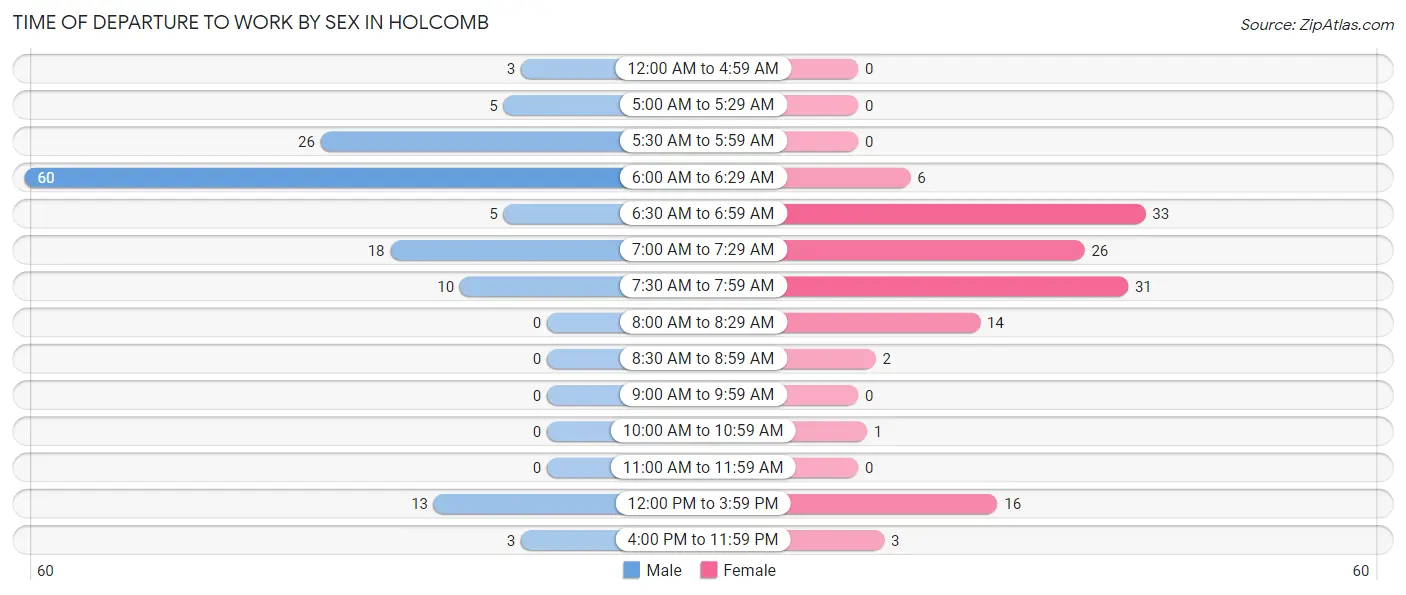
| Time of Departure | Male | Female |
| 12:00 AM to 4:59 AM | 3 (2.1%) | 0 (0.0%) |
| 5:00 AM to 5:29 AM | 5 (3.5%) | 0 (0.0%) |
| 5:30 AM to 5:59 AM | 26 (18.2%) | 0 (0.0%) |
| 6:00 AM to 6:29 AM | 60 (42.0%) | 6 (4.5%) |
| 6:30 AM to 6:59 AM | 5 (3.5%) | 33 (25.0%) |
| 7:00 AM to 7:29 AM | 18 (12.6%) | 26 (19.7%) |
| 7:30 AM to 7:59 AM | 10 (7.0%) | 31 (23.5%) |
| 8:00 AM to 8:29 AM | 0 (0.0%) | 14 (10.6%) |
| 8:30 AM to 8:59 AM | 0 (0.0%) | 2 (1.5%) |
| 9:00 AM to 9:59 AM | 0 (0.0%) | 0 (0.0%) |
| 10:00 AM to 10:59 AM | 0 (0.0%) | 1 (0.8%) |
| 11:00 AM to 11:59 AM | 0 (0.0%) | 0 (0.0%) |
| 12:00 PM to 3:59 PM | 13 (9.1%) | 16 (12.1%) |
| 4:00 PM to 11:59 PM | 3 (2.1%) | 3 (2.3%) |
| Total | 143 (100.0%) | 132 (100.0%) |
Housing Occupancy in Holcomb
Occupancy by Ownership in Holcomb
Of the total 282 dwellings in Holcomb, owner-occupied units account for 181 (64.2%), while renter-occupied units make up 101 (35.8%).
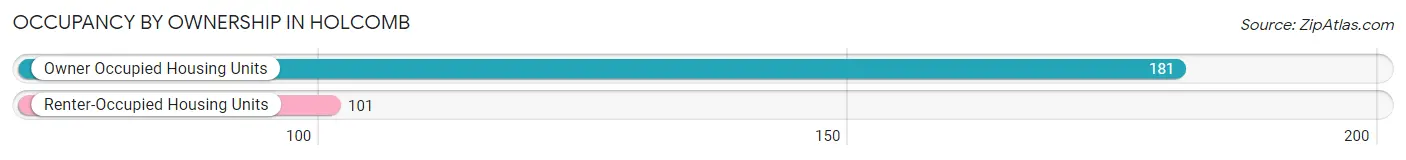
| Occupancy | # Housing Units | % Housing Units |
| Owner Occupied Housing Units | 181 | 64.2% |
| Renter-Occupied Housing Units | 101 | 35.8% |
| Total Occupied Housing Units | 282 | 100.0% |
Occupancy by Household Size in Holcomb
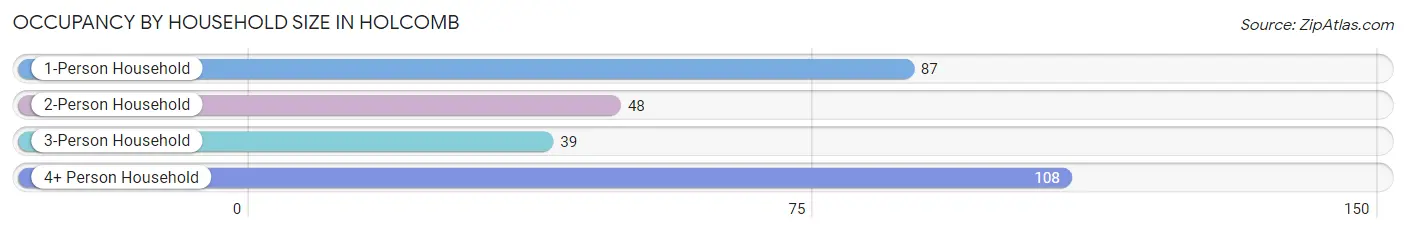
| Household Size | # Housing Units | % Housing Units |
| 1-Person Household | 87 | 30.8% |
| 2-Person Household | 48 | 17.0% |
| 3-Person Household | 39 | 13.8% |
| 4+ Person Household | 108 | 38.3% |
| Total Housing Units | 282 | 100.0% |
Occupancy by Ownership by Household Size in Holcomb
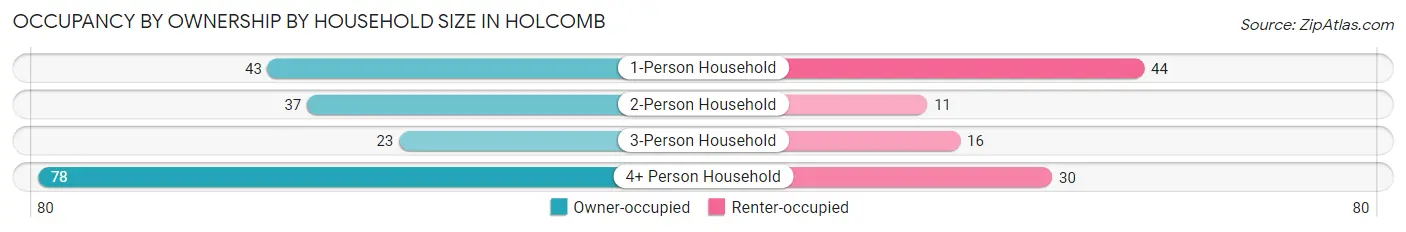
| Household Size | Owner-occupied | Renter-occupied |
| 1-Person Household | 43 (49.4%) | 44 (50.6%) |
| 2-Person Household | 37 (77.1%) | 11 (22.9%) |
| 3-Person Household | 23 (59.0%) | 16 (41.0%) |
| 4+ Person Household | 78 (72.2%) | 30 (27.8%) |
| Total Housing Units | 181 (64.2%) | 101 (35.8%) |
Occupancy by Educational Attainment in Holcomb
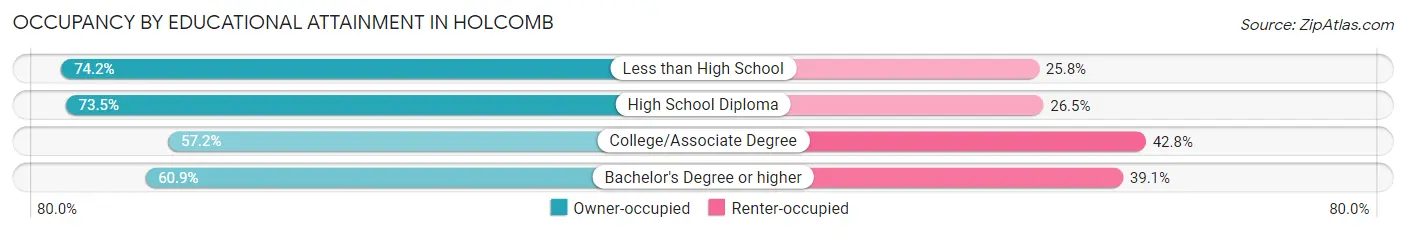
| Household Size | Owner-occupied | Renter-occupied |
| Less than High School | 23 (74.2%) | 8 (25.8%) |
| High School Diploma | 61 (73.5%) | 22 (26.5%) |
| College/Associate Degree | 83 (57.2%) | 62 (42.8%) |
| Bachelor's Degree or higher | 14 (60.9%) | 9 (39.1%) |
Occupancy by Age of Householder in Holcomb
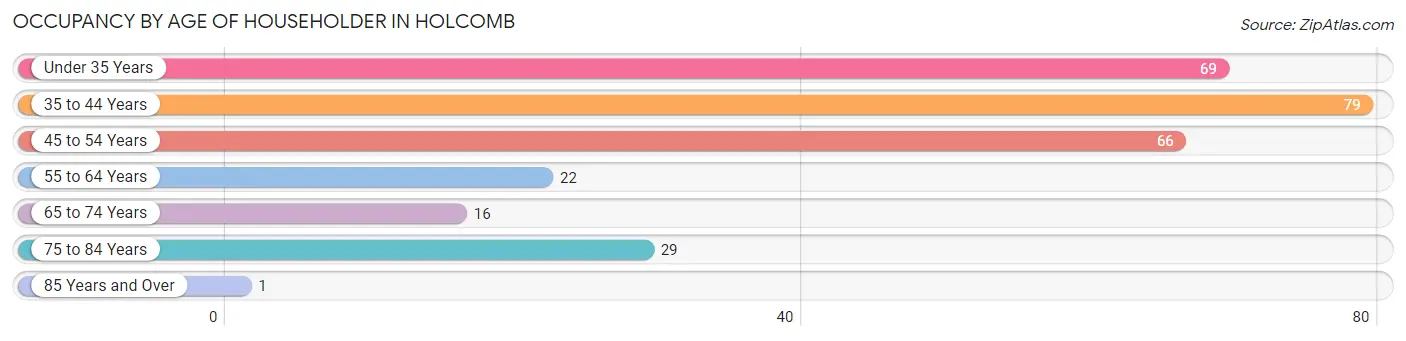
| Age Bracket | # Households | % Households |
| Under 35 Years | 69 | 24.5% |
| 35 to 44 Years | 79 | 28.0% |
| 45 to 54 Years | 66 | 23.4% |
| 55 to 64 Years | 22 | 7.8% |
| 65 to 74 Years | 16 | 5.7% |
| 75 to 84 Years | 29 | 10.3% |
| 85 Years and Over | 1 | 0.4% |
| Total | 282 | 100.0% |
Housing Finances in Holcomb
Median Income by Occupancy in Holcomb
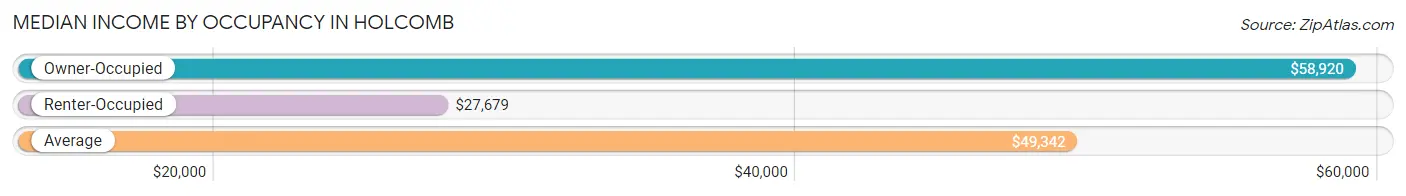
| Occupancy Type | # Households | Median Income |
| Owner-Occupied | 181 (64.2%) | $58,920 |
| Renter-Occupied | 101 (35.8%) | $27,679 |
| Average | 282 (100.0%) | $49,342 |
Occupancy by Householder Income Bracket in Holcomb
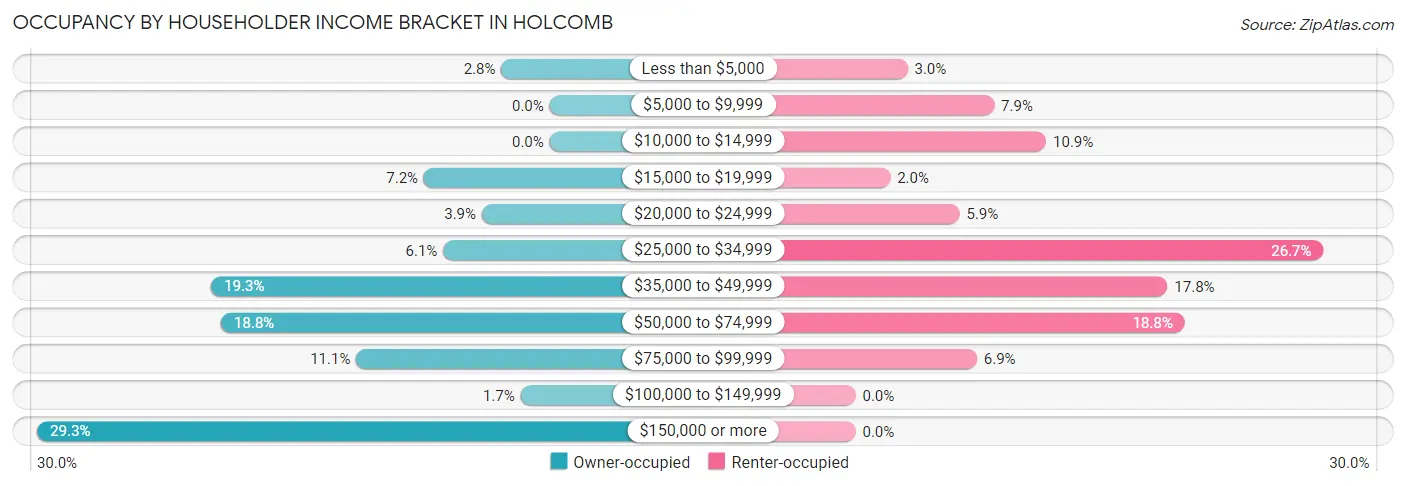
| Income Bracket | Owner-occupied | Renter-occupied |
| Less than $5,000 | 5 (2.8%) | 3 (3.0%) |
| $5,000 to $9,999 | 0 (0.0%) | 8 (7.9%) |
| $10,000 to $14,999 | 0 (0.0%) | 11 (10.9%) |
| $15,000 to $19,999 | 13 (7.2%) | 2 (2.0%) |
| $20,000 to $24,999 | 7 (3.9%) | 6 (5.9%) |
| $25,000 to $34,999 | 11 (6.1%) | 27 (26.7%) |
| $35,000 to $49,999 | 35 (19.3%) | 18 (17.8%) |
| $50,000 to $74,999 | 34 (18.8%) | 19 (18.8%) |
| $75,000 to $99,999 | 20 (11.1%) | 7 (6.9%) |
| $100,000 to $149,999 | 3 (1.7%) | 0 (0.0%) |
| $150,000 or more | 53 (29.3%) | 0 (0.0%) |
| Total | 181 (100.0%) | 101 (100.0%) |
Monthly Housing Cost Tiers in Holcomb
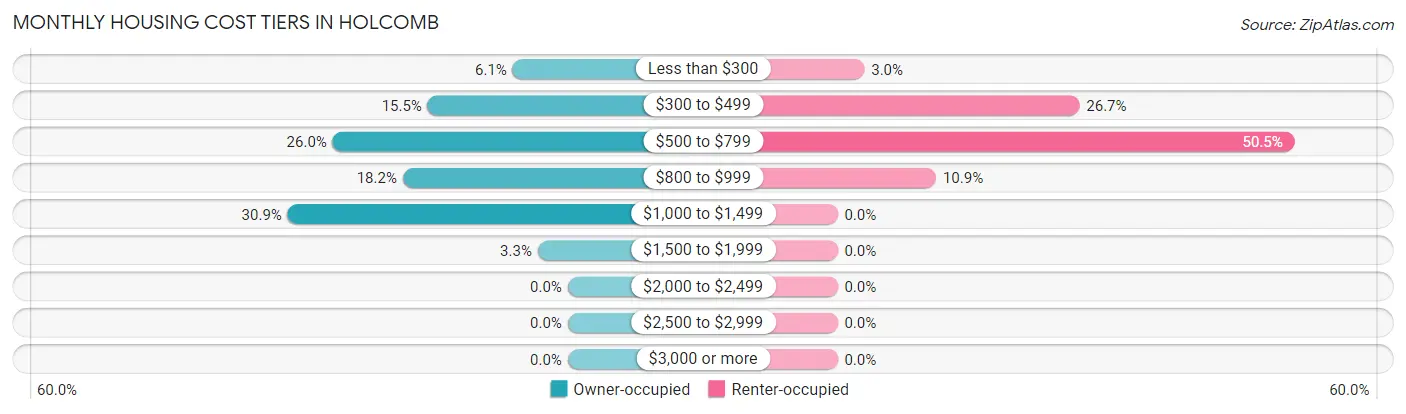
| Monthly Cost | Owner-occupied | Renter-occupied |
| Less than $300 | 11 (6.1%) | 3 (3.0%) |
| $300 to $499 | 28 (15.5%) | 27 (26.7%) |
| $500 to $799 | 47 (26.0%) | 51 (50.5%) |
| $800 to $999 | 33 (18.2%) | 11 (10.9%) |
| $1,000 to $1,499 | 56 (30.9%) | 0 (0.0%) |
| $1,500 to $1,999 | 6 (3.3%) | 0 (0.0%) |
| $2,000 to $2,499 | 0 (0.0%) | 0 (0.0%) |
| $2,500 to $2,999 | 0 (0.0%) | 0 (0.0%) |
| $3,000 or more | 0 (0.0%) | 0 (0.0%) |
| Total | 181 (100.0%) | 101 (100.0%) |
Physical Housing Characteristics in Holcomb
Housing Structures in Holcomb
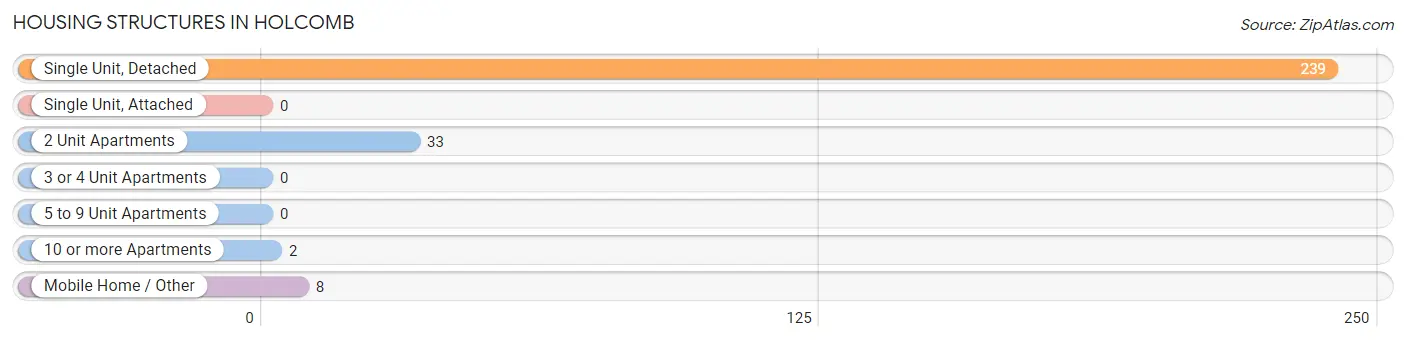
| Structure Type | # Housing Units | % Housing Units |
| Single Unit, Detached | 239 | 84.8% |
| Single Unit, Attached | 0 | 0.0% |
| 2 Unit Apartments | 33 | 11.7% |
| 3 or 4 Unit Apartments | 0 | 0.0% |
| 5 to 9 Unit Apartments | 0 | 0.0% |
| 10 or more Apartments | 2 | 0.7% |
| Mobile Home / Other | 8 | 2.8% |
| Total | 282 | 100.0% |
Housing Structures by Occupancy in Holcomb
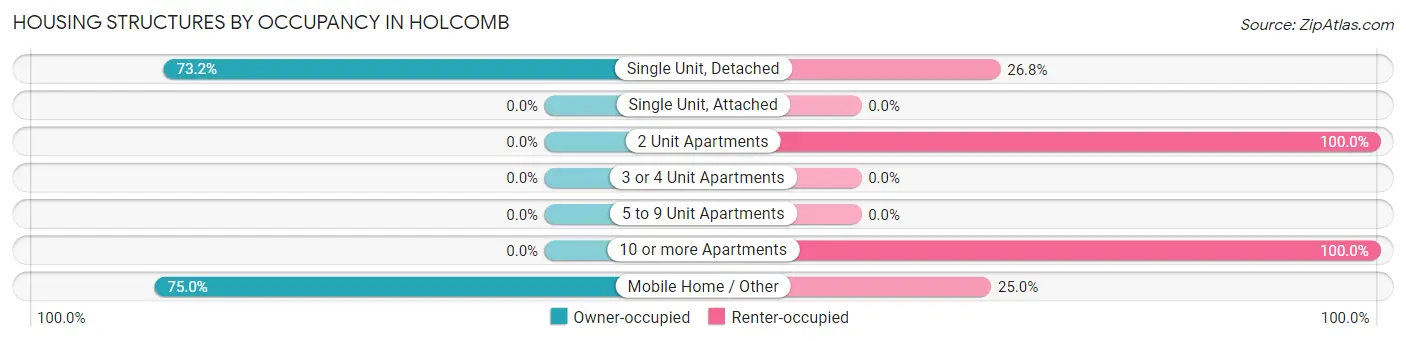
| Structure Type | Owner-occupied | Renter-occupied |
| Single Unit, Detached | 175 (73.2%) | 64 (26.8%) |
| Single Unit, Attached | 0 (0.0%) | 0 (0.0%) |
| 2 Unit Apartments | 0 (0.0%) | 33 (100.0%) |
| 3 or 4 Unit Apartments | 0 (0.0%) | 0 (0.0%) |
| 5 to 9 Unit Apartments | 0 (0.0%) | 0 (0.0%) |
| 10 or more Apartments | 0 (0.0%) | 2 (100.0%) |
| Mobile Home / Other | 6 (75.0%) | 2 (25.0%) |
| Total | 181 (64.2%) | 101 (35.8%) |
Housing Structures by Number of Rooms in Holcomb
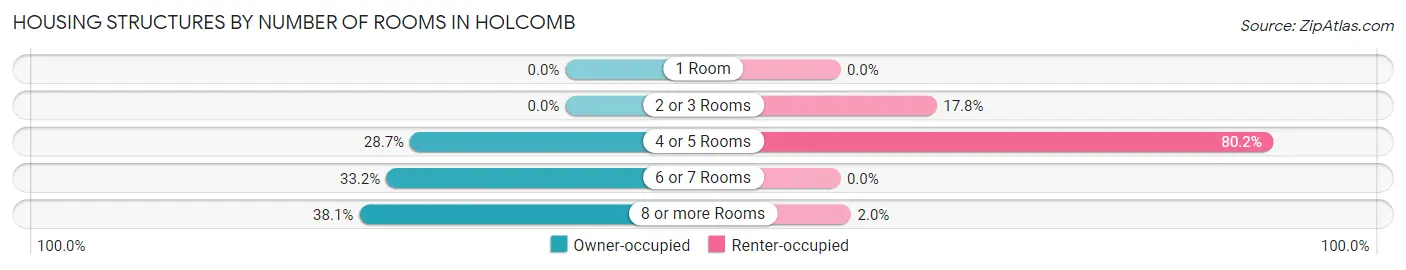
| Number of Rooms | Owner-occupied | Renter-occupied |
| 1 Room | 0 (0.0%) | 0 (0.0%) |
| 2 or 3 Rooms | 0 (0.0%) | 18 (17.8%) |
| 4 or 5 Rooms | 52 (28.7%) | 81 (80.2%) |
| 6 or 7 Rooms | 60 (33.2%) | 0 (0.0%) |
| 8 or more Rooms | 69 (38.1%) | 2 (2.0%) |
| Total | 181 (100.0%) | 101 (100.0%) |
Housing Structure by Heating Type in Holcomb
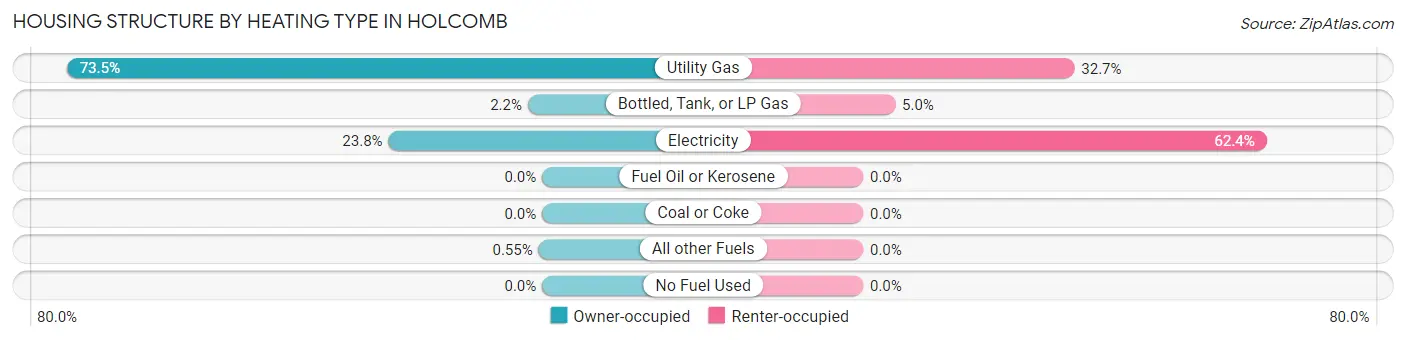
| Heating Type | Owner-occupied | Renter-occupied |
| Utility Gas | 133 (73.5%) | 33 (32.7%) |
| Bottled, Tank, or LP Gas | 4 (2.2%) | 5 (5.0%) |
| Electricity | 43 (23.8%) | 63 (62.4%) |
| Fuel Oil or Kerosene | 0 (0.0%) | 0 (0.0%) |
| Coal or Coke | 0 (0.0%) | 0 (0.0%) |
| All other Fuels | 1 (0.5%) | 0 (0.0%) |
| No Fuel Used | 0 (0.0%) | 0 (0.0%) |
| Total | 181 (100.0%) | 101 (100.0%) |
Household Vehicle Usage in Holcomb
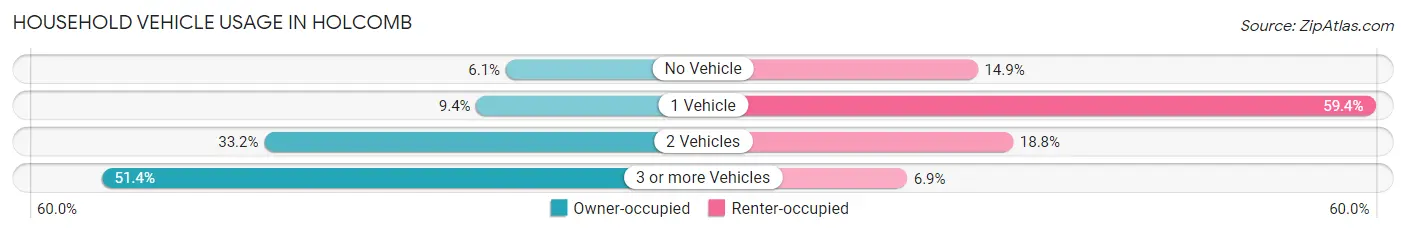
| Vehicles per Household | Owner-occupied | Renter-occupied |
| No Vehicle | 11 (6.1%) | 15 (14.8%) |
| 1 Vehicle | 17 (9.4%) | 60 (59.4%) |
| 2 Vehicles | 60 (33.2%) | 19 (18.8%) |
| 3 or more Vehicles | 93 (51.4%) | 7 (6.9%) |
| Total | 181 (100.0%) | 101 (100.0%) |
Real Estate & Mortgages in Holcomb
Real Estate and Mortgage Overview in Holcomb
| Characteristic | Without Mortgage | With Mortgage |
| Housing Units | 48 | 133 |
| Median Property Value | $60,000 | $125,600 |
| Median Household Income | $36,000 | $51 |
| Monthly Housing Costs | $346 | $0 |
| Real Estate Taxes | $767 | $0 |
Property Value by Mortgage Status in Holcomb
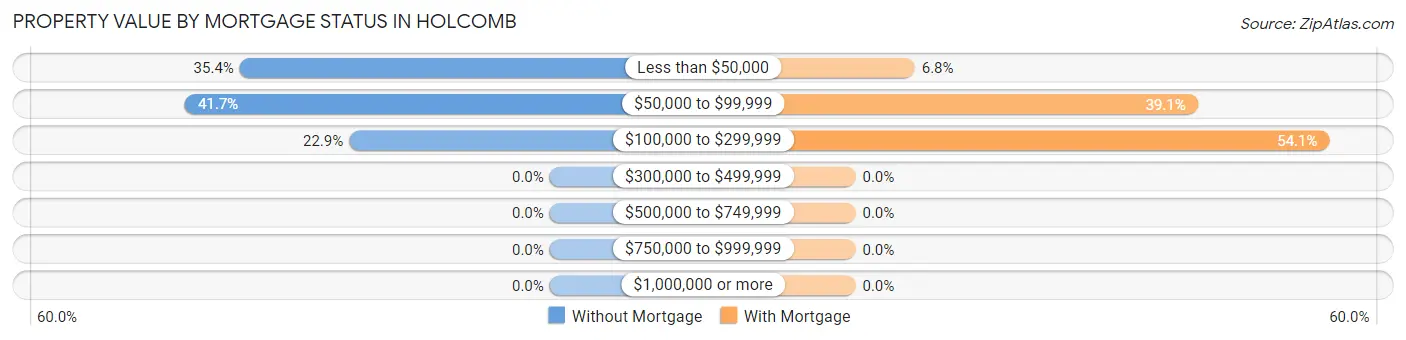
| Property Value | Without Mortgage | With Mortgage |
| Less than $50,000 | 17 (35.4%) | 9 (6.8%) |
| $50,000 to $99,999 | 20 (41.7%) | 52 (39.1%) |
| $100,000 to $299,999 | 11 (22.9%) | 72 (54.1%) |
| $300,000 to $499,999 | 0 (0.0%) | 0 (0.0%) |
| $500,000 to $749,999 | 0 (0.0%) | 0 (0.0%) |
| $750,000 to $999,999 | 0 (0.0%) | 0 (0.0%) |
| $1,000,000 or more | 0 (0.0%) | 0 (0.0%) |
| Total | 48 (100.0%) | 133 (100.0%) |
Household Income by Mortgage Status in Holcomb
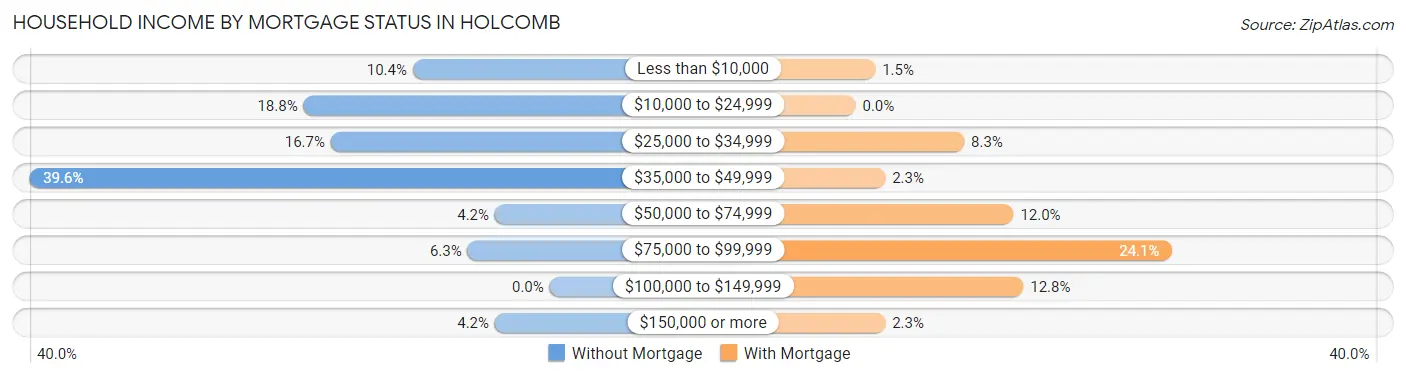
| Household Income | Without Mortgage | With Mortgage |
| Less than $10,000 | 5 (10.4%) | 2 (1.5%) |
| $10,000 to $24,999 | 9 (18.8%) | 0 (0.0%) |
| $25,000 to $34,999 | 8 (16.7%) | 11 (8.3%) |
| $35,000 to $49,999 | 19 (39.6%) | 3 (2.3%) |
| $50,000 to $74,999 | 2 (4.2%) | 16 (12.0%) |
| $75,000 to $99,999 | 3 (6.2%) | 32 (24.1%) |
| $100,000 to $149,999 | 0 (0.0%) | 17 (12.8%) |
| $150,000 or more | 2 (4.2%) | 3 (2.3%) |
| Total | 48 (100.0%) | 133 (100.0%) |
Property Value to Household Income Ratio in Holcomb
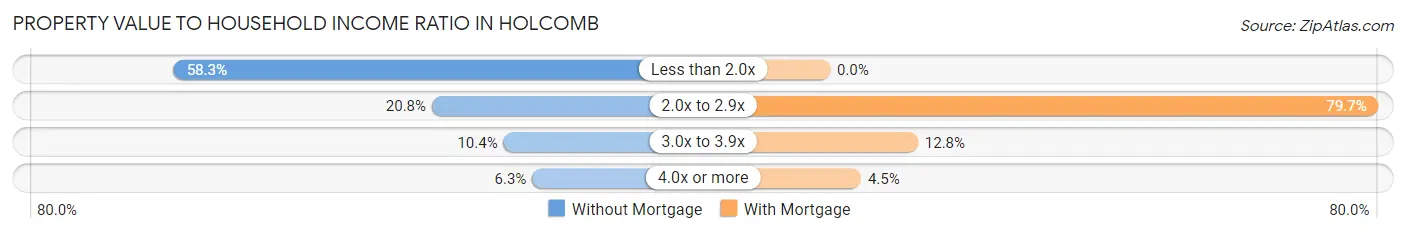
| Value-to-Income Ratio | Without Mortgage | With Mortgage |
| Less than 2.0x | 28 (58.3%) | 0 (0.0%) |
| 2.0x to 2.9x | 10 (20.8%) | 106 (79.7%) |
| 3.0x to 3.9x | 5 (10.4%) | 17 (12.8%) |
| 4.0x or more | 3 (6.2%) | 6 (4.5%) |
| Total | 48 (100.0%) | 133 (100.0%) |
Real Estate Taxes by Mortgage Status in Holcomb
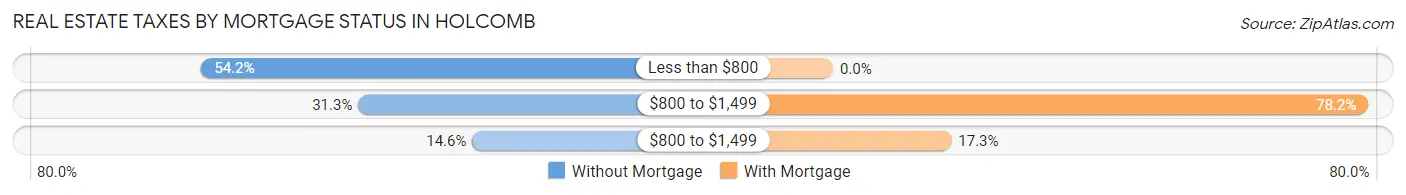
| Property Taxes | Without Mortgage | With Mortgage |
| Less than $800 | 26 (54.2%) | 0 (0.0%) |
| $800 to $1,499 | 15 (31.2%) | 104 (78.2%) |
| $800 to $1,499 | 7 (14.6%) | 23 (17.3%) |
| Total | 48 (100.0%) | 133 (100.0%) |
Health & Disability in Holcomb
Health Insurance Coverage by Age in Holcomb
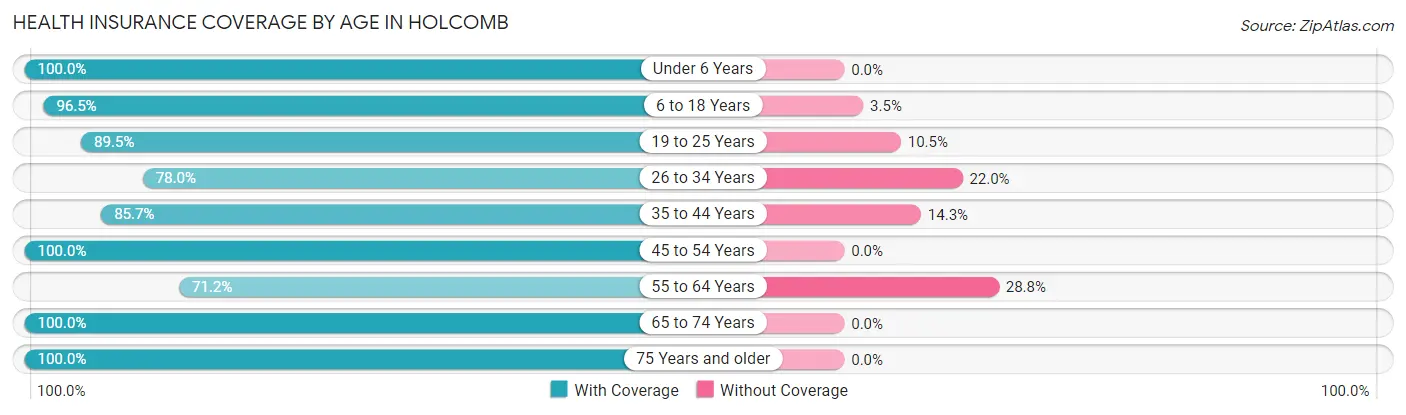
| Age Bracket | With Coverage | Without Coverage |
| Under 6 Years | 86 (100.0%) | 0 (0.0%) |
| 6 to 18 Years | 192 (96.5%) | 7 (3.5%) |
| 19 to 25 Years | 68 (89.5%) | 8 (10.5%) |
| 26 to 34 Years | 46 (78.0%) | 13 (22.0%) |
| 35 to 44 Years | 114 (85.7%) | 19 (14.3%) |
| 45 to 54 Years | 94 (100.0%) | 0 (0.0%) |
| 55 to 64 Years | 42 (71.2%) | 17 (28.8%) |
| 65 to 74 Years | 25 (100.0%) | 0 (0.0%) |
| 75 Years and older | 33 (100.0%) | 0 (0.0%) |
| Total | 700 (91.6%) | 64 (8.4%) |
Health Insurance Coverage by Citizenship Status in Holcomb
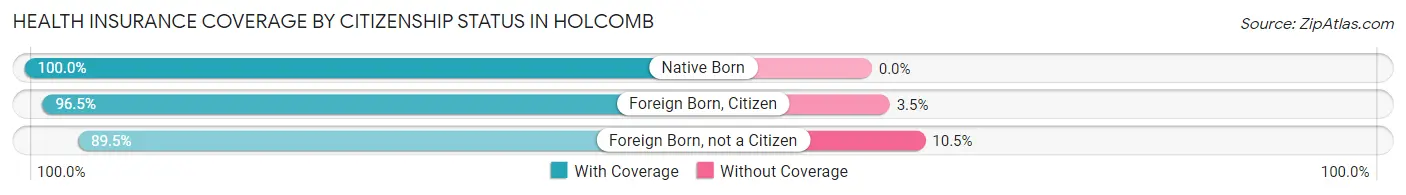
| Citizenship Status | With Coverage | Without Coverage |
| Native Born | 86 (100.0%) | 0 (0.0%) |
| Foreign Born, Citizen | 192 (96.5%) | 7 (3.5%) |
| Foreign Born, not a Citizen | 68 (89.5%) | 8 (10.5%) |
Health Insurance Coverage by Household Income in Holcomb
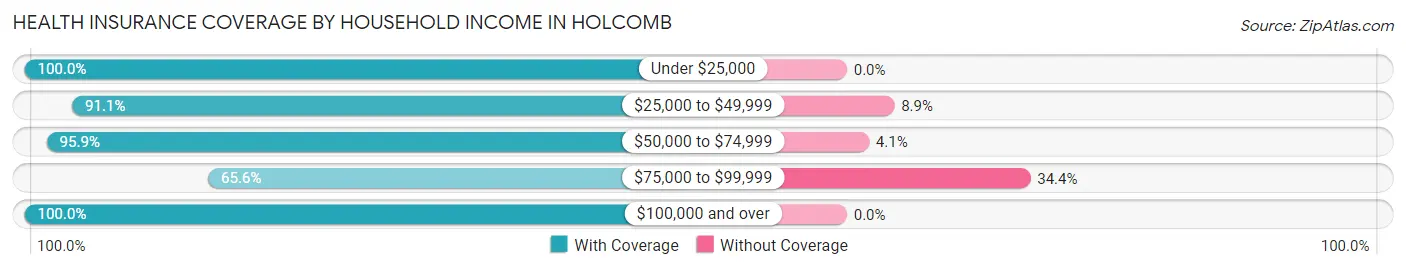
| Household Income | With Coverage | Without Coverage |
| Under $25,000 | 84 (100.0%) | 0 (0.0%) |
| $25,000 to $49,999 | 246 (91.1%) | 24 (8.9%) |
| $50,000 to $74,999 | 162 (95.9%) | 7 (4.1%) |
| $75,000 to $99,999 | 63 (65.6%) | 33 (34.4%) |
| $100,000 and over | 137 (100.0%) | 0 (0.0%) |
Public vs Private Health Insurance Coverage by Age in Holcomb
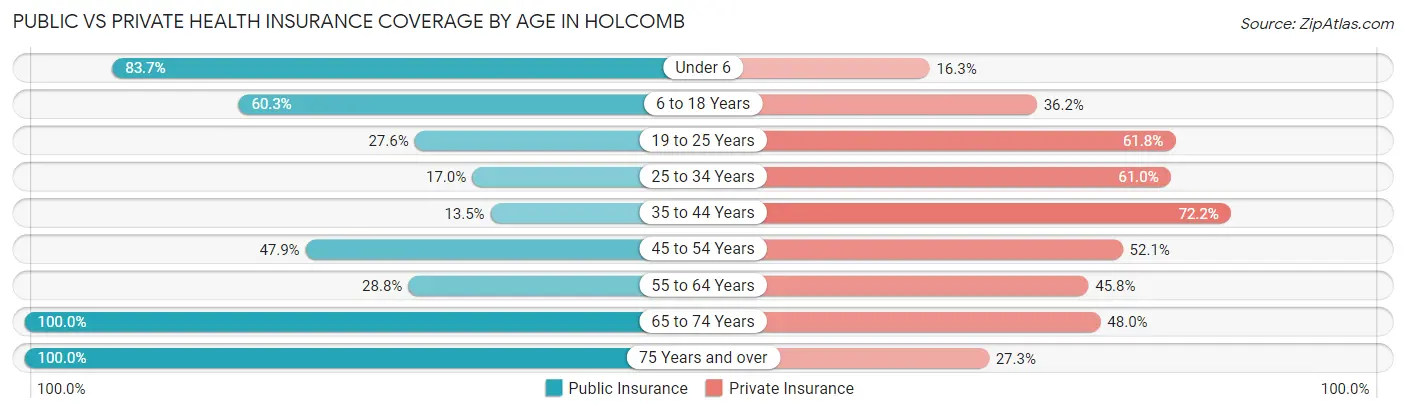
| Age Bracket | Public Insurance | Private Insurance |
| Under 6 | 72 (83.7%) | 14 (16.3%) |
| 6 to 18 Years | 120 (60.3%) | 72 (36.2%) |
| 19 to 25 Years | 21 (27.6%) | 47 (61.8%) |
| 25 to 34 Years | 10 (17.0%) | 36 (61.0%) |
| 35 to 44 Years | 18 (13.5%) | 96 (72.2%) |
| 45 to 54 Years | 45 (47.9%) | 49 (52.1%) |
| 55 to 64 Years | 17 (28.8%) | 27 (45.8%) |
| 65 to 74 Years | 25 (100.0%) | 12 (48.0%) |
| 75 Years and over | 33 (100.0%) | 9 (27.3%) |
| Total | 361 (47.2%) | 362 (47.4%) |
Disability Status by Sex by Age in Holcomb
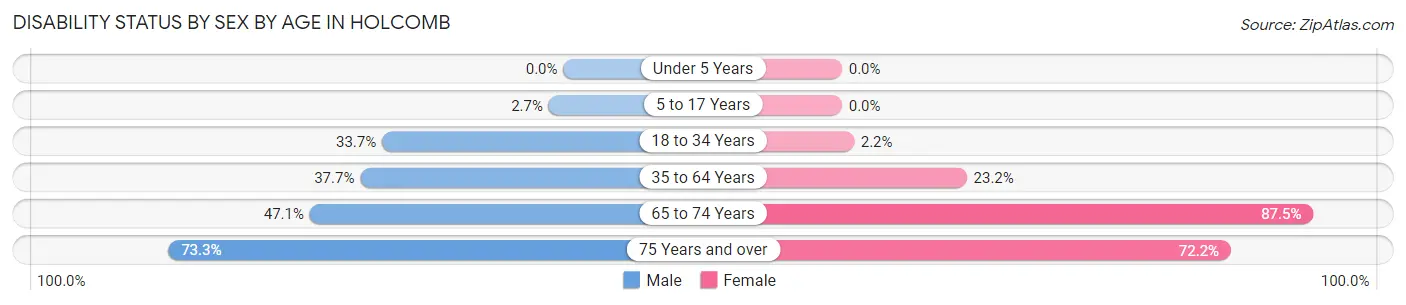
| Age Bracket | Male | Female |
| Under 5 Years | 0 (0.0%) | 0 (0.0%) |
| 5 to 17 Years | 2 (2.7%) | 0 (0.0%) |
| 18 to 34 Years | 34 (33.7%) | 2 (2.2%) |
| 35 to 64 Years | 46 (37.7%) | 38 (23.2%) |
| 65 to 74 Years | 8 (47.1%) | 7 (87.5%) |
| 75 Years and over | 11 (73.3%) | 13 (72.2%) |
Disability Class by Sex by Age in Holcomb
Disability Class: Hearing Difficulty
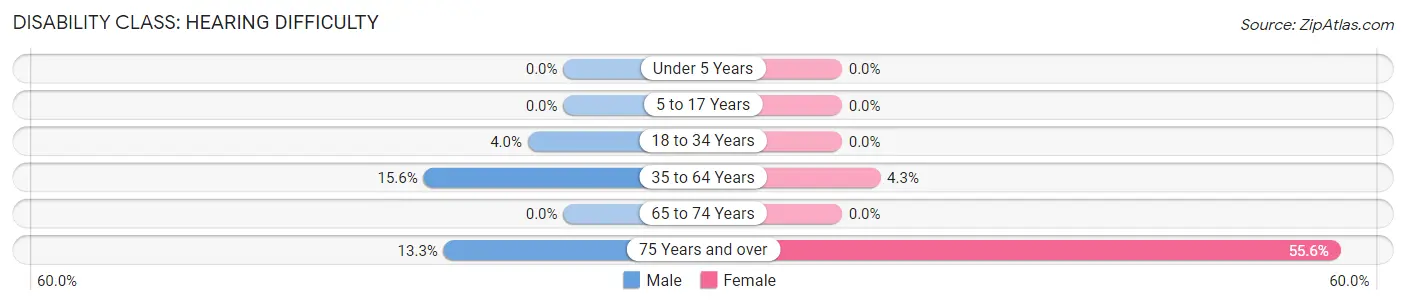
| Age Bracket | Male | Female |
| Under 5 Years | 0 (0.0%) | 0 (0.0%) |
| 5 to 17 Years | 0 (0.0%) | 0 (0.0%) |
| 18 to 34 Years | 4 (4.0%) | 0 (0.0%) |
| 35 to 64 Years | 19 (15.6%) | 7 (4.3%) |
| 65 to 74 Years | 0 (0.0%) | 0 (0.0%) |
| 75 Years and over | 2 (13.3%) | 10 (55.6%) |
Disability Class: Vision Difficulty
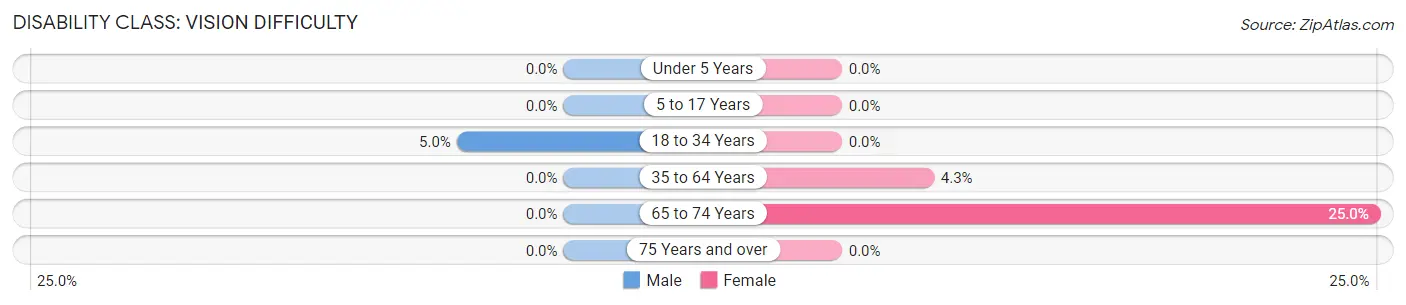
| Age Bracket | Male | Female |
| Under 5 Years | 0 (0.0%) | 0 (0.0%) |
| 5 to 17 Years | 0 (0.0%) | 0 (0.0%) |
| 18 to 34 Years | 5 (5.0%) | 0 (0.0%) |
| 35 to 64 Years | 0 (0.0%) | 7 (4.3%) |
| 65 to 74 Years | 0 (0.0%) | 2 (25.0%) |
| 75 Years and over | 0 (0.0%) | 0 (0.0%) |
Disability Class: Cognitive Difficulty
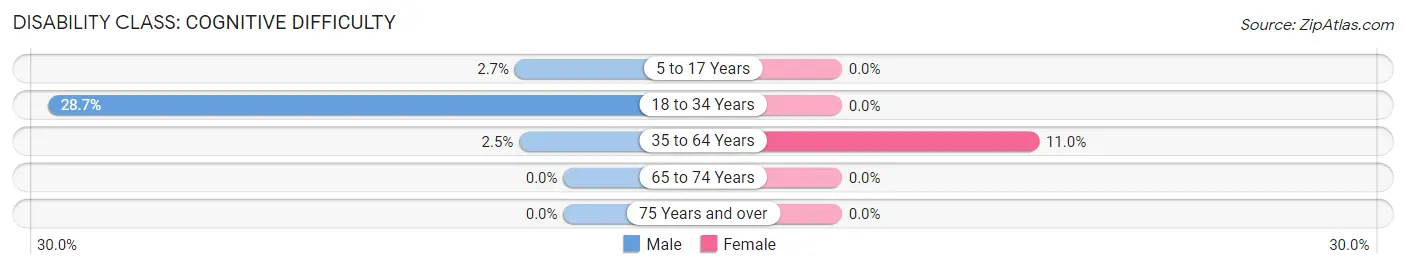
| Age Bracket | Male | Female |
| 5 to 17 Years | 2 (2.7%) | 0 (0.0%) |
| 18 to 34 Years | 29 (28.7%) | 0 (0.0%) |
| 35 to 64 Years | 3 (2.5%) | 18 (11.0%) |
| 65 to 74 Years | 0 (0.0%) | 0 (0.0%) |
| 75 Years and over | 0 (0.0%) | 0 (0.0%) |
Disability Class: Ambulatory Difficulty
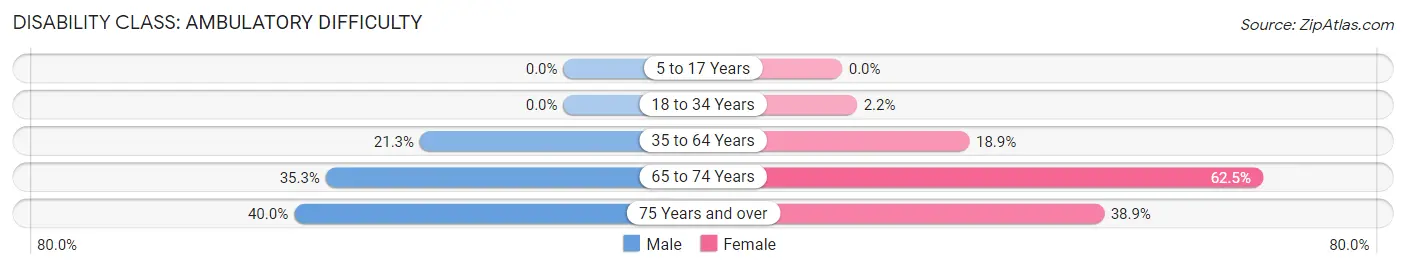
| Age Bracket | Male | Female |
| 5 to 17 Years | 0 (0.0%) | 0 (0.0%) |
| 18 to 34 Years | 0 (0.0%) | 2 (2.2%) |
| 35 to 64 Years | 26 (21.3%) | 31 (18.9%) |
| 65 to 74 Years | 6 (35.3%) | 5 (62.5%) |
| 75 Years and over | 6 (40.0%) | 7 (38.9%) |
Disability Class: Self-Care Difficulty
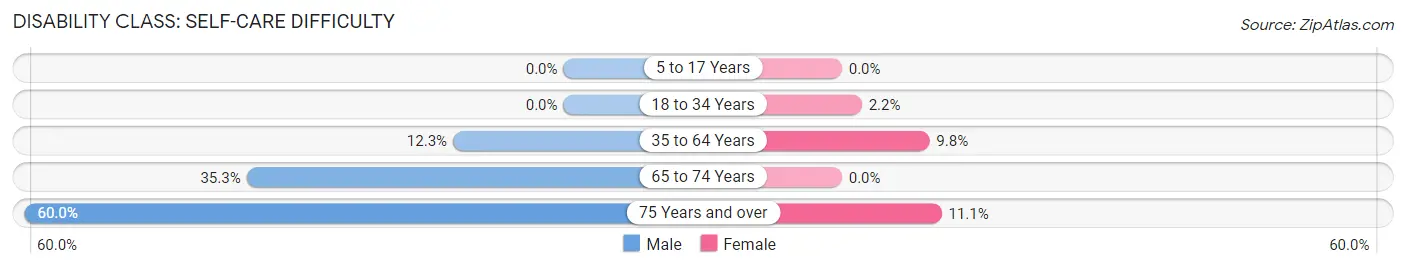
| Age Bracket | Male | Female |
| 5 to 17 Years | 0 (0.0%) | 0 (0.0%) |
| 18 to 34 Years | 0 (0.0%) | 2 (2.2%) |
| 35 to 64 Years | 15 (12.3%) | 16 (9.8%) |
| 65 to 74 Years | 6 (35.3%) | 0 (0.0%) |
| 75 Years and over | 9 (60.0%) | 2 (11.1%) |
Technology Access in Holcomb
Computing Device Access in Holcomb
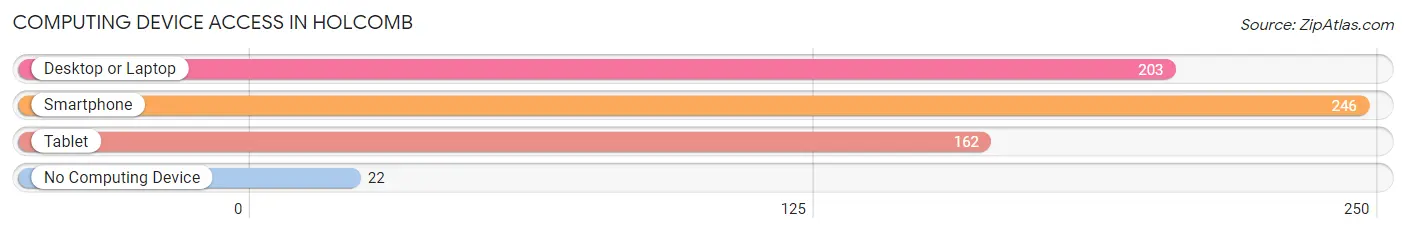
| Device Type | # Households | % Households |
| Desktop or Laptop | 203 | 72.0% |
| Smartphone | 246 | 87.2% |
| Tablet | 162 | 57.5% |
| No Computing Device | 22 | 7.8% |
| Total | 282 | 100.0% |
Internet Access in Holcomb
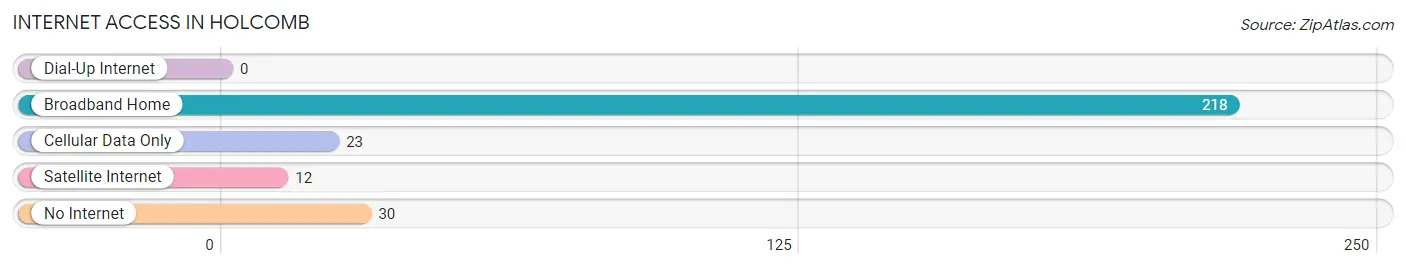
| Internet Type | # Households | % Households |
| Dial-Up Internet | 0 | 0.0% |
| Broadband Home | 218 | 77.3% |
| Cellular Data Only | 23 | 8.2% |
| Satellite Internet | 12 | 4.3% |
| No Internet | 30 | 10.6% |
| Total | 282 | 100.0% |
Holcomb Summary
Holcomb, Missouri is a small town located in Dunklin County in the southeastern corner of the state. It is situated on the banks of the St. Francis River, and is surrounded by the Ozark Mountains. The town was founded in 1883 and has a population of approximately 1,000 people.
History
Holcomb was founded in 1883 by a group of settlers from Kentucky and Tennessee. The town was named after a local creek, which was named after a man named Holcomb. The town was originally a farming community, and the main crops grown were cotton, corn, and wheat. The town also had a sawmill and a gristmill.
In the early 1900s, the town began to grow and develop. The first school was built in 1906, and the first bank opened in 1908. The town also had a post office, a hotel, and a general store.
In the 1920s, the town began to experience a decline in population due to the Great Depression. However, the town was able to survive and continued to grow. In the 1940s, the town experienced a population boom due to the influx of workers from the nearby steel mill.
Geography
Holcomb is located in the southeastern corner of Missouri, in Dunklin County. It is situated on the banks of the St. Francis River, and is surrounded by the Ozark Mountains. The town is located approximately 30 miles from the Arkansas border.
The town has a total area of 1.2 square miles, all of which is land. The town has a humid subtropical climate, with hot, humid summers and mild winters. The average temperature in the summer is around 80 degrees Fahrenheit, and the average temperature in the winter is around 40 degrees Fahrenheit.
Economy
The economy of Holcomb is largely based on agriculture. The main crops grown in the area are cotton, corn, and wheat. The town also has a sawmill and a gristmill.
In addition to agriculture, the town also has a few small businesses, including a grocery store, a hardware store, and a few restaurants. The town also has a few small manufacturing companies, which produce items such as furniture and clothing.
Demographics
As of the 2010 census, the population of Holcomb was 1,000 people. The racial makeup of the town was 97.2% White, 0.7% African American, 0.2% Native American, 0.2% Asian, 0.2% from other races, and 1.7% from two or more races.
The median household income in Holcomb was $30,000, and the median family income was $35,000. The per capita income was $14,000. About 17.5% of the population was below the poverty line.
Holcomb is a small town with a rich history and a strong sense of community. The town has a diverse economy, and the people of Holcomb are proud of their town and its history.
Common Questions
What is Per Capita Income in Holcomb?
Per Capita income in Holcomb is $27,286.
What is the Median Family Income in Holcomb?
Median Family Income in Holcomb is $58,587.
What is the Median Household income in Holcomb?
Median Household Income in Holcomb is $49,342.
What is Income or Wage Gap in Holcomb?
Income or Wage Gap in Holcomb is 47.3%.
Women in Holcomb earn 52.7 cents for every dollar earned by a man.
What is Family Income Deficit in Holcomb?
Family Income Deficit in Holcomb is $10,585.
Families that are below poverty line in Holcomb earn $10,585 less on average than the poverty threshold level.
What is Inequality or Gini Index in Holcomb?
Inequality or Gini Index in Holcomb is 0.45.
What is the Total Population of Holcomb?
Total Population of Holcomb is 764.
What is the Total Male Population of Holcomb?
Total Male Population of Holcomb is 366.
What is the Total Female Population of Holcomb?
Total Female Population of Holcomb is 398.
What is the Ratio of Males per 100 Females in Holcomb?
There are 91.96 Males per 100 Females in Holcomb.
What is the Ratio of Females per 100 Males in Holcomb?
There are 108.74 Females per 100 Males in Holcomb.
What is the Median Population Age in Holcomb?
Median Population Age in Holcomb is 29.1 Years.
What is the Average Family Size in Holcomb
Average Family Size in Holcomb is 3.3 People.
What is the Average Household Size in Holcomb
Average Household Size in Holcomb is 2.7 People.
How Large is the Labor Force in Holcomb?
There are 315 People in the Labor Forcein in Holcomb.
What is the Percentage of People in the Labor Force in Holcomb?
57.7% of People are in the Labor Force in Holcomb.
What is the Unemployment Rate in Holcomb?
Unemployment Rate in Holcomb is 4.4%.