Gentry, MO Map & Demographics
Gentry Map
Gentry Overview
$28,791
PER CAPITA INCOME
$76,000
AVG FAMILY INCOME
$75,893
AVG HOUSEHOLD INCOME
28.1%
WAGE / INCOME GAP [ % ]
71.9¢/ $1
WAGE / INCOME GAP [ $ ]
0.16
INEQUALITY / GINI INDEX
76
TOTAL POPULATION
53
MALE POPULATION
23
FEMALE POPULATION
230.43
MALES / 100 FEMALES
43.40
FEMALES / 100 MALES
23.8
MEDIAN AGE
3.2
AVG FAMILY SIZE
3.3
AVG HOUSEHOLD SIZE
53
LABOR FORCE [ PEOPLE ]
85.5%
PERCENT IN LABOR FORCE
5.7%
UNEMPLOYMENT RATE
Gentry Zip Codes
Gentry Area Codes
Income in Gentry
Income Overview in Gentry
Per Capita Income in Gentry is $28,791, while median incomes of families and households are $76,000 and $75,893 respectively.
| Characteristic | Number | Measure |
| Per Capita Income | 76 | $28,791 |
| Median Family Income | 12 | $76,000 |
| Mean Family Income | 12 | $64,833 |
| Median Household Income | 23 | $75,893 |
| Mean Household Income | 23 | $81,896 |
| Income Deficit | 12 | $0 |
| Wage / Income Gap (%) | 76 | 28.08% |
| Wage / Income Gap ($) | 76 | 71.92¢ per $1 |
| Gini / Inequality Index | 76 | 0.16 |
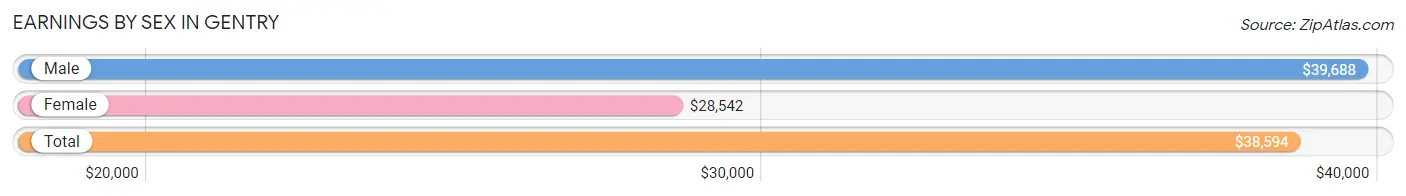
Earnings by Sex in Gentry
Average Earnings in Gentry are $38,594, $39,688 for men and $28,542 for women, a difference of 28.1%.
| Sex | Number | Average Earnings |
| Male | 44 (86.3%) | $39,688 |
| Female | 7 (13.7%) | $28,542 |
| Total | 51 (100.0%) | $38,594 |
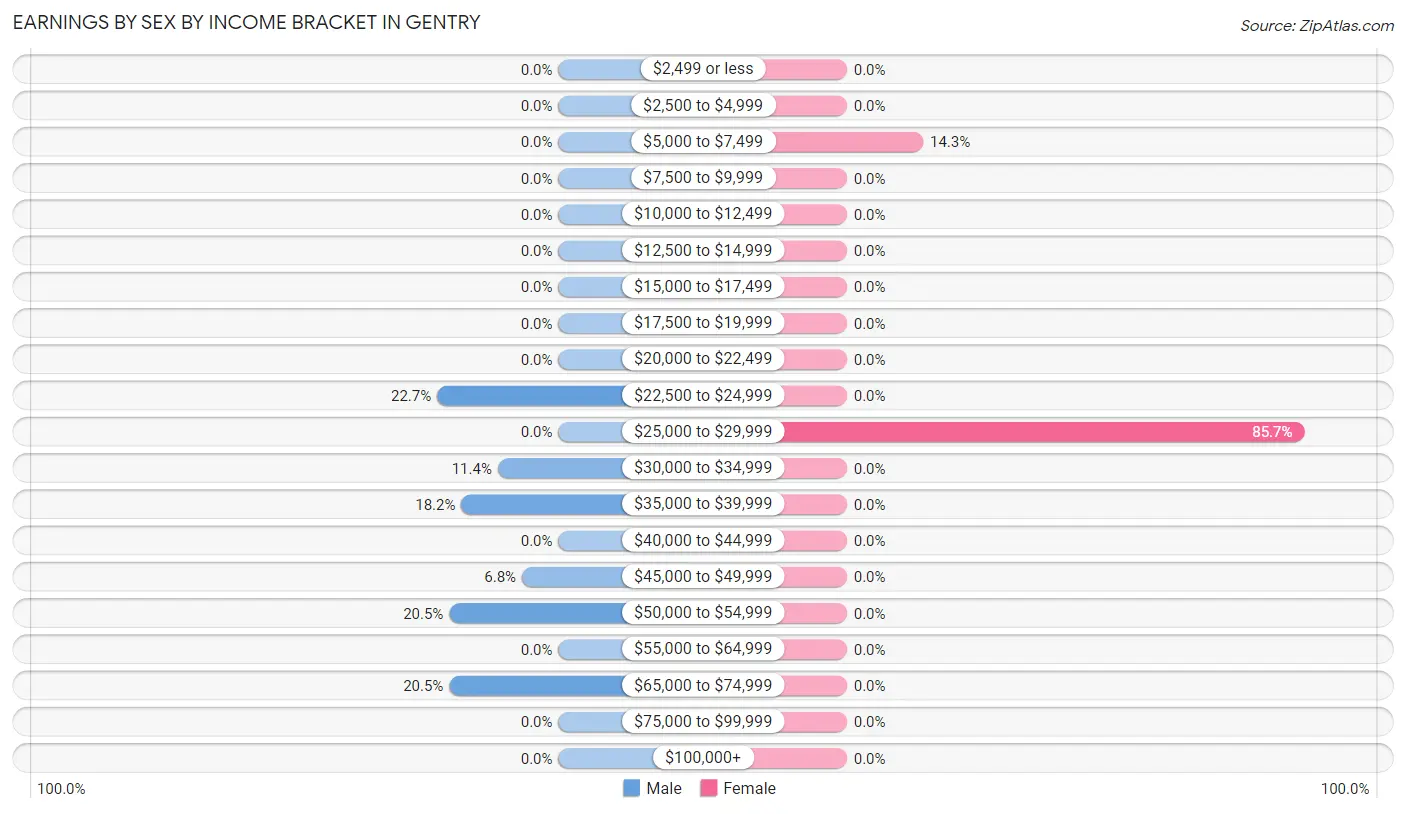
Earnings by Sex by Income Bracket in Gentry
The most common earnings brackets in Gentry are $22,500 to $24,999 for men (10 | 22.7%) and $25,000 to $29,999 for women (6 | 85.7%).
| Income | Male | Female |
| $2,499 or less | 0 (0.0%) | 0 (0.0%) |
| $2,500 to $4,999 | 0 (0.0%) | 0 (0.0%) |
| $5,000 to $7,499 | 0 (0.0%) | 1 (14.3%) |
| $7,500 to $9,999 | 0 (0.0%) | 0 (0.0%) |
| $10,000 to $12,499 | 0 (0.0%) | 0 (0.0%) |
| $12,500 to $14,999 | 0 (0.0%) | 0 (0.0%) |
| $15,000 to $17,499 | 0 (0.0%) | 0 (0.0%) |
| $17,500 to $19,999 | 0 (0.0%) | 0 (0.0%) |
| $20,000 to $22,499 | 0 (0.0%) | 0 (0.0%) |
| $22,500 to $24,999 | 10 (22.7%) | 0 (0.0%) |
| $25,000 to $29,999 | 0 (0.0%) | 6 (85.7%) |
| $30,000 to $34,999 | 5 (11.4%) | 0 (0.0%) |
| $35,000 to $39,999 | 8 (18.2%) | 0 (0.0%) |
| $40,000 to $44,999 | 0 (0.0%) | 0 (0.0%) |
| $45,000 to $49,999 | 3 (6.8%) | 0 (0.0%) |
| $50,000 to $54,999 | 9 (20.4%) | 0 (0.0%) |
| $55,000 to $64,999 | 0 (0.0%) | 0 (0.0%) |
| $65,000 to $74,999 | 9 (20.4%) | 0 (0.0%) |
| $75,000 to $99,999 | 0 (0.0%) | 0 (0.0%) |
| $100,000+ | 0 (0.0%) | 0 (0.0%) |
| Total | 44 (100.0%) | 7 (100.0%) |
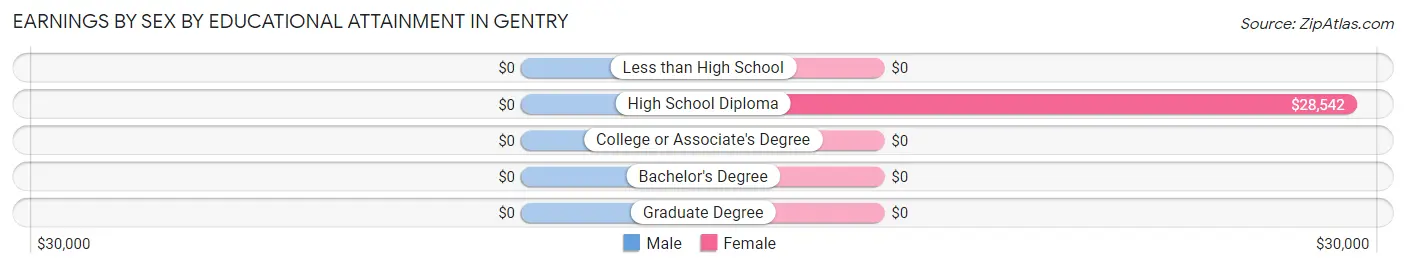
Earnings by Sex by Educational Attainment in Gentry
| Educational Attainment | Male Income | Female Income |
| Less than High School | - | - |
| High School Diploma | - | - |
| College or Associate's Degree | - | - |
| Bachelor's Degree | - | - |
| Graduate Degree | - | - |
| Total | $53,250 | $28,542 |
Family Income in Gentry
Family Income Brackets in Gentry
According to the Gentry family income data, there are 8 families falling into the $75,000 to $99,999 income range, which is the most common income bracket and makes up 66.7% of all families.
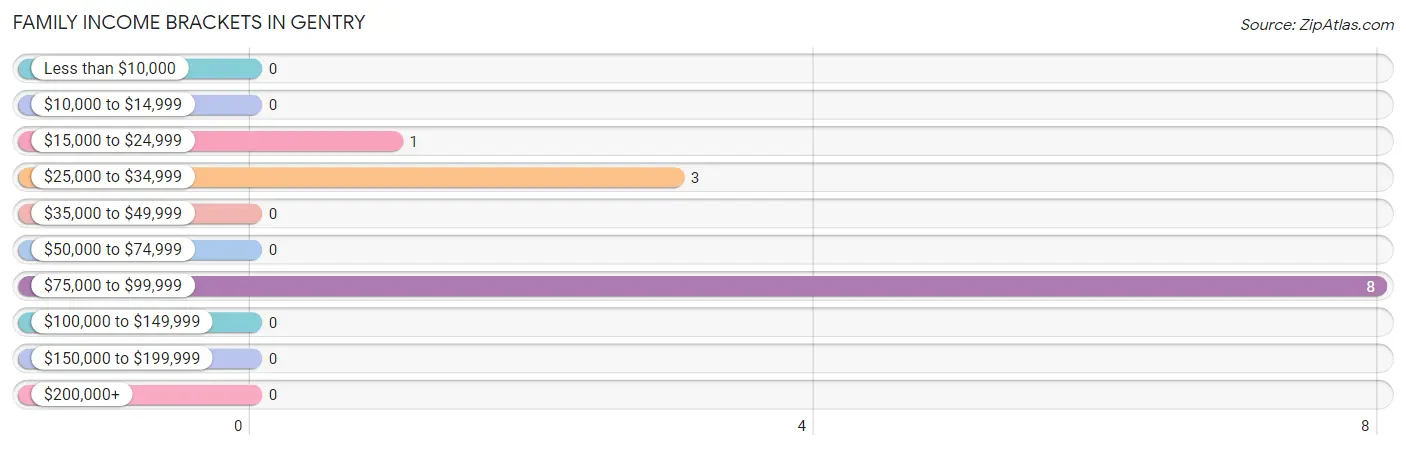
| Income Bracket | # Families | % Families |
| Less than $10,000 | 0 | 0.0% |
| $10,000 to $14,999 | 0 | 0.0% |
| $15,000 to $24,999 | 1 | 8.3% |
| $25,000 to $34,999 | 3 | 25.0% |
| $35,000 to $49,999 | 0 | 0.0% |
| $50,000 to $74,999 | 0 | 0.0% |
| $75,000 to $99,999 | 8 | 66.7% |
| $100,000 to $149,999 | 0 | 0.0% |
| $150,000 to $199,999 | 0 | 0.0% |
| $200,000+ | 0 | 0.0% |
Family Income by Famaliy Size in Gentry
| Income Bracket | # Families | Median Income |
| 2-Person Families | 6 (50.0%) | $0 |
| 3-Person Families | 6 (50.0%) | $0 |
| 4-Person Families | 0 (0.0%) | $0 |
| 5-Person Families | 0 (0.0%) | $0 |
| 6-Person Families | 0 (0.0%) | $0 |
| 7+ Person Families | 0 (0.0%) | $0 |
| Total | 12 (100.0%) | $76,000 |
Family Income by Number of Earners in Gentry
| Number of Earners | # Families | Median Income |
| No Earners | 1 (8.3%) | $0 |
| 1 Earner | 3 (25.0%) | $0 |
| 2 Earners | 8 (66.7%) | $0 |
| 3+ Earners | 0 (0.0%) | $0 |
| Total | 12 (100.0%) | $76,000 |
Household Income in Gentry
Household Income Brackets in Gentry
With 10 households falling in the category, the $75,000 to $99,999 income range is the most frequent in Gentry, accounting for 43.5% of all households.
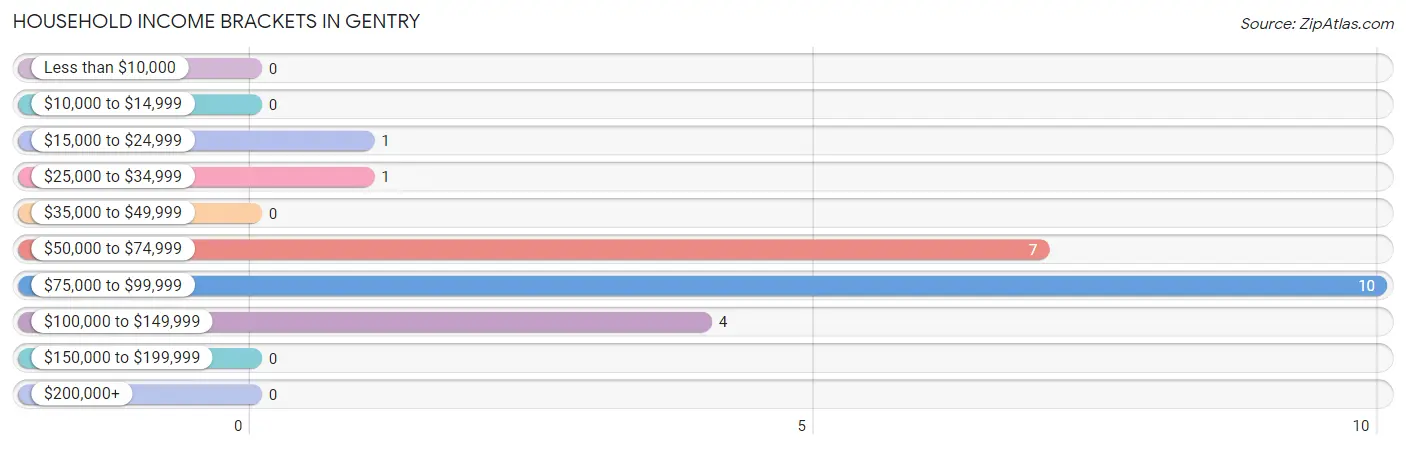
| Income Bracket | # Households | % Households |
| Less than $10,000 | 0 | 0.0% |
| $10,000 to $14,999 | 0 | 0.0% |
| $15,000 to $24,999 | 1 | 4.3% |
| $25,000 to $34,999 | 1 | 4.3% |
| $35,000 to $49,999 | 0 | 0.0% |
| $50,000 to $74,999 | 7 | 30.4% |
| $75,000 to $99,999 | 10 | 43.5% |
| $100,000 to $149,999 | 4 | 17.4% |
| $150,000 to $199,999 | 0 | 0.0% |
| $200,000+ | 0 | 0.0% |
Household Income by Householder Age in Gentry
The median household income in Gentry is $75,893, with the highest median household income of $75,000 found in the 45 to 64 years age bracket for the primary householder. A total of 16 households (69.6%) fall into this category. Meanwhile, the 15 to 24 years age bracket for the primary householder has the lowest median household income of $0, with 4 households (17.4%) in this group.
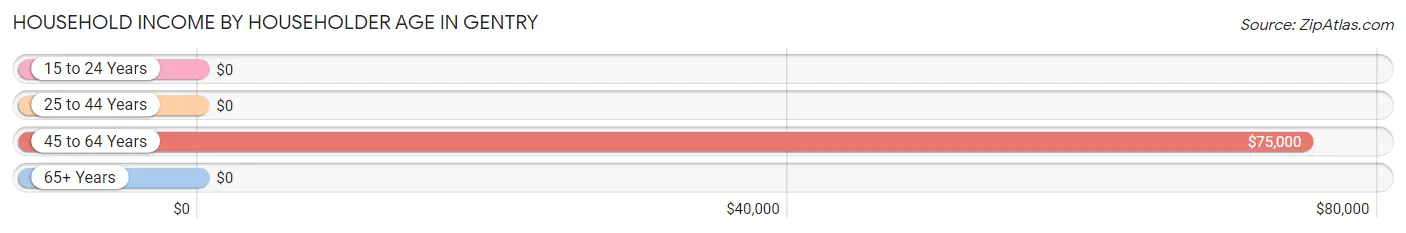
| Income Bracket | # Households | Median Income |
| 15 to 24 Years | 4 (17.4%) | $0 |
| 25 to 44 Years | 2 (8.7%) | $0 |
| 45 to 64 Years | 16 (69.6%) | $75,000 |
| 65+ Years | 1 (4.3%) | $0 |
| Total | 23 (100.0%) | $75,893 |
Poverty in Gentry
Income Below Poverty by Sex and Age in Gentry
With 2.1% poverty level for males and 39.1% for females among the residents of Gentry, under 5 year old males and 5 year old females are the most vulnerable to poverty, with 1 males (33.3%) and 2 females (100.0%) in their respective age groups living below the poverty level.
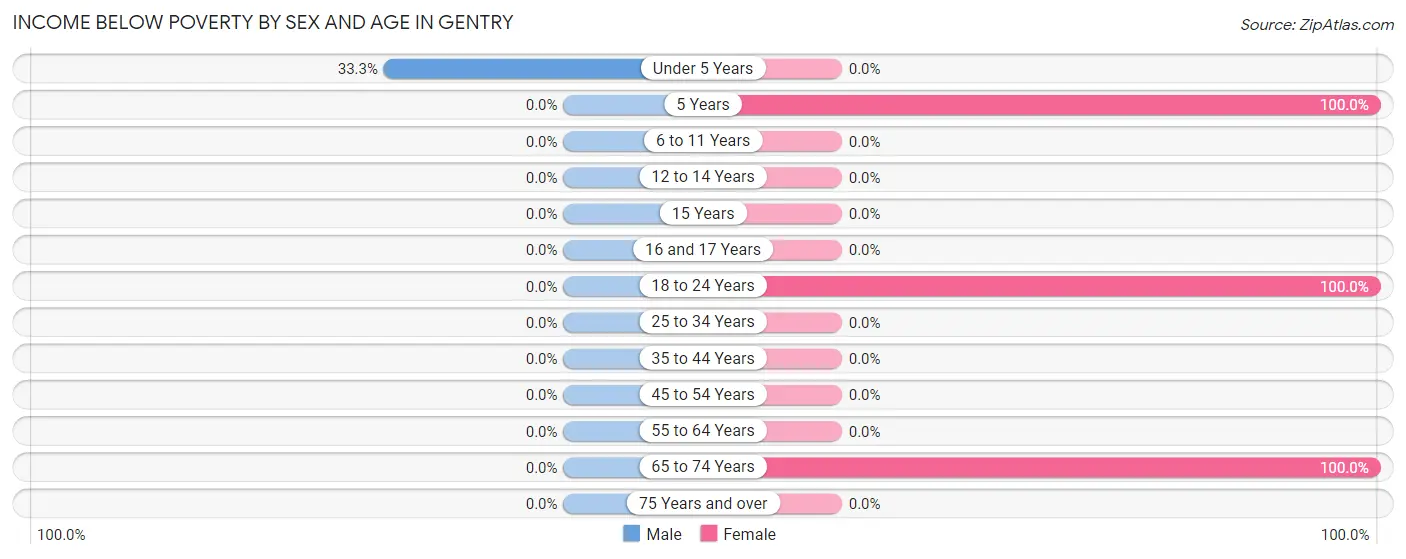
| Age Bracket | Male | Female |
| Under 5 Years | 1 (33.3%) | 0 (0.0%) |
| 5 Years | 0 (0.0%) | 2 (100.0%) |
| 6 to 11 Years | 0 (0.0%) | 0 (0.0%) |
| 12 to 14 Years | 0 (0.0%) | 0 (0.0%) |
| 15 Years | 0 (0.0%) | 0 (0.0%) |
| 16 and 17 Years | 0 (0.0%) | 0 (0.0%) |
| 18 to 24 Years | 0 (0.0%) | 6 (100.0%) |
| 25 to 34 Years | 0 (0.0%) | 0 (0.0%) |
| 35 to 44 Years | 0 (0.0%) | 0 (0.0%) |
| 45 to 54 Years | 0 (0.0%) | 0 (0.0%) |
| 55 to 64 Years | 0 (0.0%) | 0 (0.0%) |
| 65 to 74 Years | 0 (0.0%) | 1 (100.0%) |
| 75 Years and over | 0 (0.0%) | 0 (0.0%) |
| Total | 1 (2.1%) | 9 (39.1%) |
Income Above Poverty by Sex and Age in Gentry
According to the poverty statistics in Gentry, males aged 18 to 24 years and females aged 6 to 11 years are the age groups that are most secure financially, with 100.0% of males and 100.0% of females in these age groups living above the poverty line.
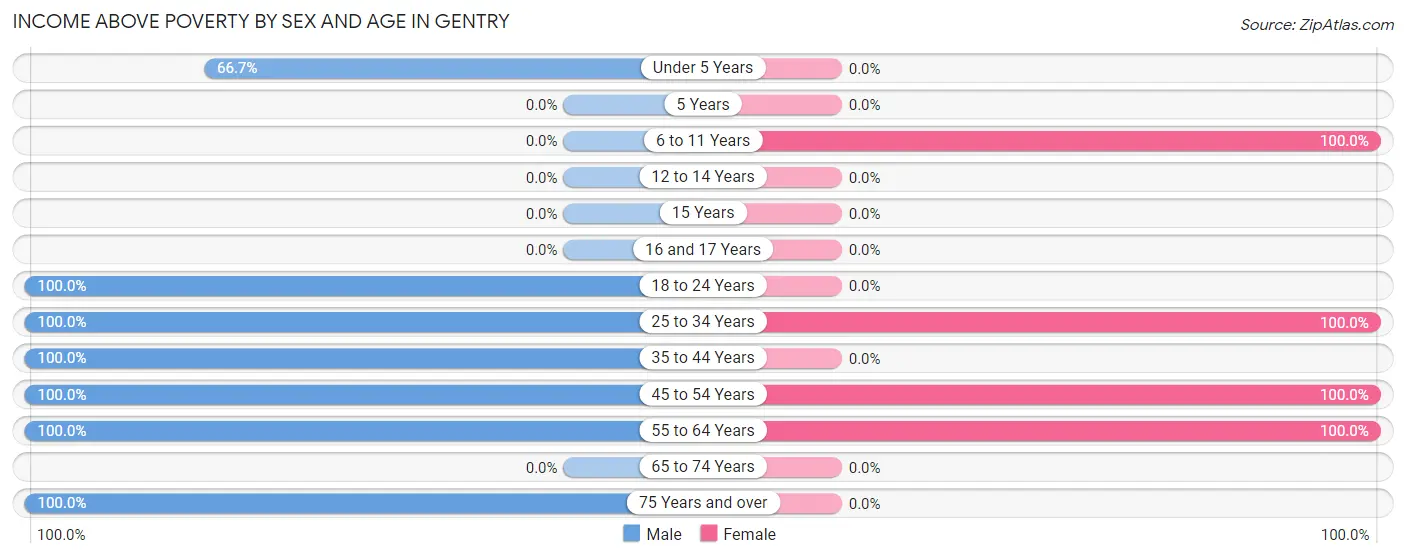
| Age Bracket | Male | Female |
| Under 5 Years | 2 (66.7%) | 0 (0.0%) |
| 5 Years | 0 (0.0%) | 0 (0.0%) |
| 6 to 11 Years | 0 (0.0%) | 4 (100.0%) |
| 12 to 14 Years | 0 (0.0%) | 0 (0.0%) |
| 15 Years | 0 (0.0%) | 0 (0.0%) |
| 16 and 17 Years | 0 (0.0%) | 0 (0.0%) |
| 18 to 24 Years | 19 (100.0%) | 0 (0.0%) |
| 25 to 34 Years | 8 (100.0%) | 6 (100.0%) |
| 35 to 44 Years | 3 (100.0%) | 0 (0.0%) |
| 45 to 54 Years | 7 (100.0%) | 3 (100.0%) |
| 55 to 64 Years | 7 (100.0%) | 1 (100.0%) |
| 65 to 74 Years | 0 (0.0%) | 0 (0.0%) |
| 75 Years and over | 1 (100.0%) | 0 (0.0%) |
| Total | 47 (97.9%) | 14 (60.9%) |
Income Below Poverty Among Married-Couple Families in Gentry
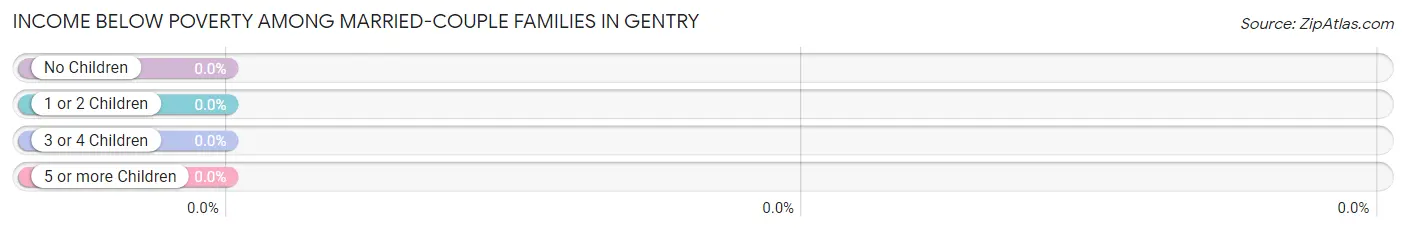
| Children | Above Poverty | Below Poverty |
| No Children | 4 (100.0%) | 0 (0.0%) |
| 1 or 2 Children | 0 (0.0%) | 0 (0.0%) |
| 3 or 4 Children | 0 (0.0%) | 0 (0.0%) |
| 5 or more Children | 0 (0.0%) | 0 (0.0%) |
| Total | 4 (100.0%) | 0 (0.0%) |
Income Below Poverty Among Single-Parent Households in Gentry
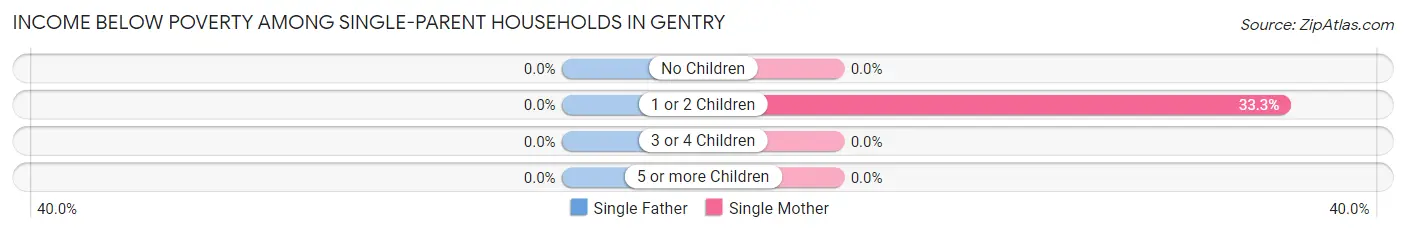
| Children | Single Father | Single Mother |
| No Children | 0 (0.0%) | 0 (0.0%) |
| 1 or 2 Children | 0 (0.0%) | 1 (33.3%) |
| 3 or 4 Children | 0 (0.0%) | 0 (0.0%) |
| 5 or more Children | 0 (0.0%) | 0 (0.0%) |
| Total | 0 (0.0%) | 1 (33.3%) |
Income Below Poverty Among Married-Couple vs Single-Parent Households in Gentry
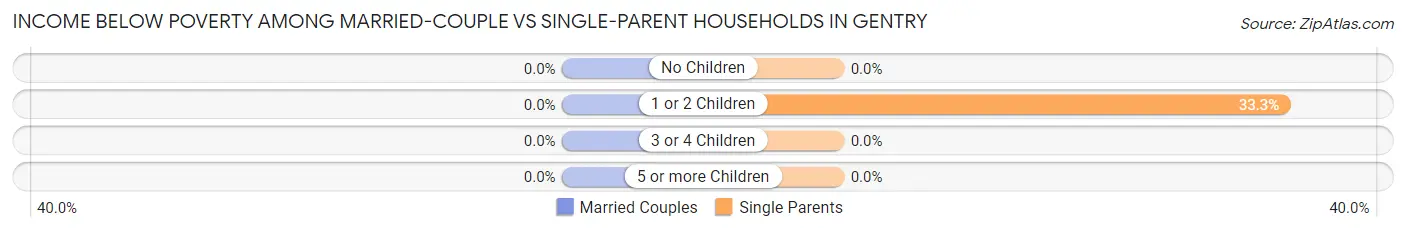
| Children | Married-Couple Families | Single-Parent Households |
| No Children | 0 (0.0%) | 0 (0.0%) |
| 1 or 2 Children | 0 (0.0%) | 1 (33.3%) |
| 3 or 4 Children | 0 (0.0%) | 0 (0.0%) |
| 5 or more Children | 0 (0.0%) | 0 (0.0%) |
| Total | 0 (0.0%) | 1 (12.5%) |
Race in Gentry
The most populous races in Gentry are , and White / Caucasian (76 | 100.0%).
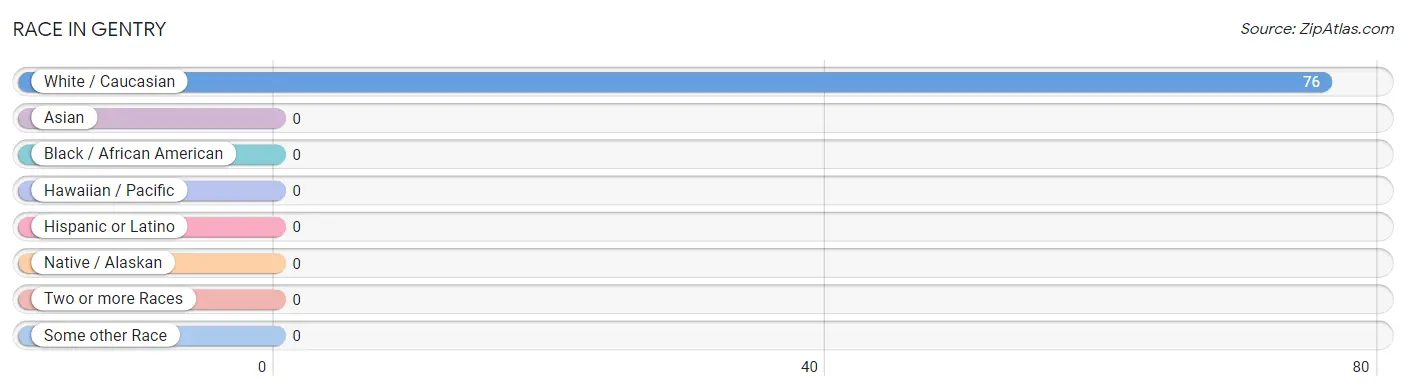
| Race | # Population | % Population |
| Asian | 0 | 0.0% |
| Black / African American | 0 | 0.0% |
| Hawaiian / Pacific | 0 | 0.0% |
| Hispanic or Latino | 0 | 0.0% |
| Native / Alaskan | 0 | 0.0% |
| White / Caucasian | 76 | 100.0% |
| Two or more Races | 0 | 0.0% |
| Some other Race | 0 | 0.0% |
| Total | 76 | 100.0% |
Ancestry in Gentry
The most populous ancestries reported in Gentry are American (36 | 47.4%), Irish (9 | 11.8%), English (3 | 4.0%), and German (1 | 1.3%), together accounting for 64.5% of all Gentry residents.
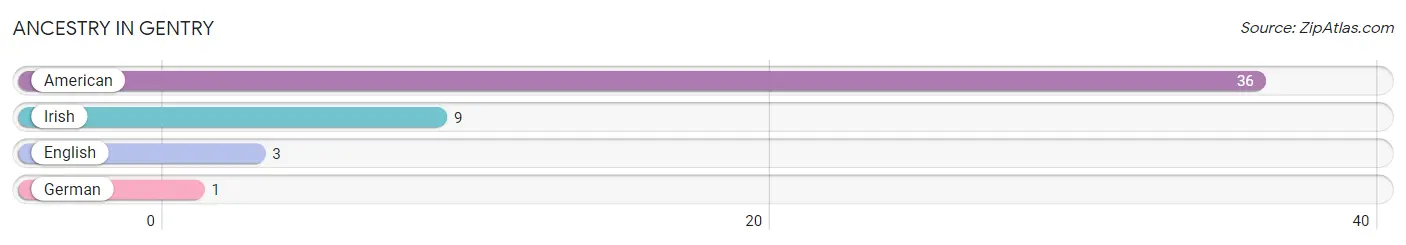
| Ancestry | # Population | % Population |
| American | 36 | 47.4% |
| English | 3 | 4.0% |
| German | 1 | 1.3% |
| Irish | 9 | 11.8% | View All 4 Rows |
Immigrants in Gentry

| Immigration Origin | # Population | % Population | View All 0 Rows |
Sex and Age in Gentry
Sex and Age in Gentry
The most populous age groups in Gentry are 20 to 24 Years (19 | 35.8%) for men and 5 to 9 Years (6 | 26.1%) for women.
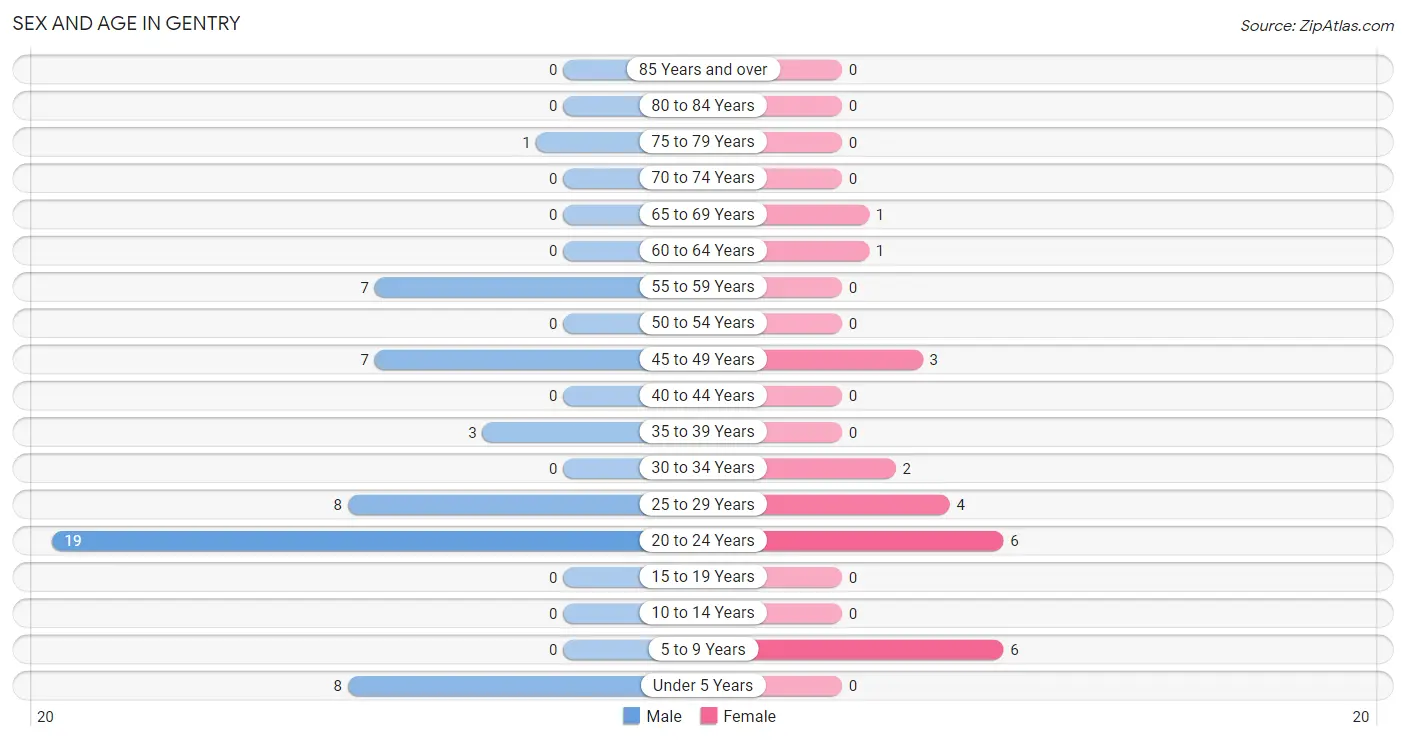
| Age Bracket | Male | Female |
| Under 5 Years | 8 (15.1%) | 0 (0.0%) |
| 5 to 9 Years | 0 (0.0%) | 6 (26.1%) |
| 10 to 14 Years | 0 (0.0%) | 0 (0.0%) |
| 15 to 19 Years | 0 (0.0%) | 0 (0.0%) |
| 20 to 24 Years | 19 (35.8%) | 6 (26.1%) |
| 25 to 29 Years | 8 (15.1%) | 4 (17.4%) |
| 30 to 34 Years | 0 (0.0%) | 2 (8.7%) |
| 35 to 39 Years | 3 (5.7%) | 0 (0.0%) |
| 40 to 44 Years | 0 (0.0%) | 0 (0.0%) |
| 45 to 49 Years | 7 (13.2%) | 3 (13.0%) |
| 50 to 54 Years | 0 (0.0%) | 0 (0.0%) |
| 55 to 59 Years | 7 (13.2%) | 0 (0.0%) |
| 60 to 64 Years | 0 (0.0%) | 1 (4.3%) |
| 65 to 69 Years | 0 (0.0%) | 1 (4.3%) |
| 70 to 74 Years | 0 (0.0%) | 0 (0.0%) |
| 75 to 79 Years | 1 (1.9%) | 0 (0.0%) |
| 80 to 84 Years | 0 (0.0%) | 0 (0.0%) |
| 85 Years and over | 0 (0.0%) | 0 (0.0%) |
| Total | 53 (100.0%) | 23 (100.0%) |
Families and Households in Gentry
Median Family Size in Gentry
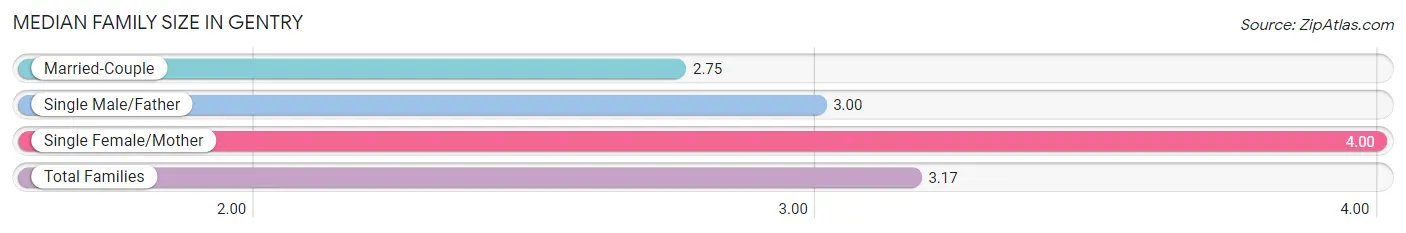
The median family size in Gentry is 3.17 persons per family, with single female/mother families (3 | 25.0%) accounting for the largest median family size of 4 persons per family. On the other hand, married-couple families (4 | 33.3%) represent the smallest median family size with 2.75 persons per family.
| Family Type | # Families | Family Size |
| Married-Couple | 4 (33.3%) | 2.75 |
| Single Male/Father | 5 (41.7%) | 3.00 |
| Single Female/Mother | 3 (25.0%) | 4.00 |
| Total Families | 12 (100.0%) | 3.17 |
Median Household Size in Gentry
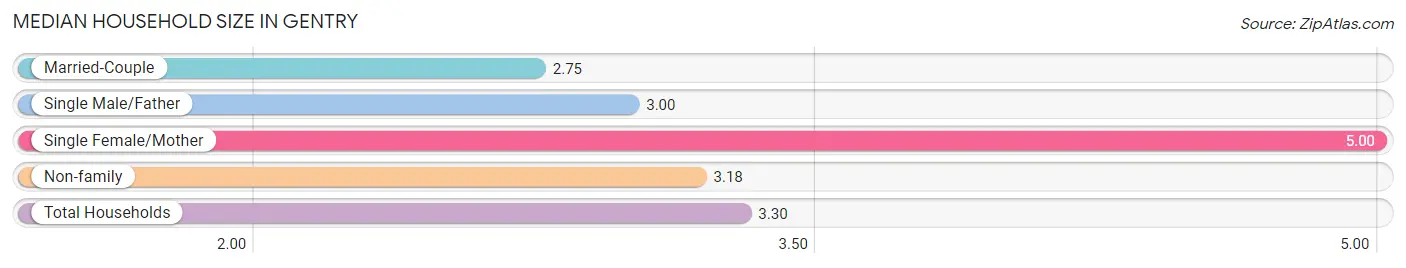
The median household size in Gentry is 3.30 persons per household, with single female/mother households (3 | 13.0%) accounting for the largest median household size of 5 persons per household. married-couple households (4 | 17.4%) represent the smallest median household size with 2.75 persons per household.
| Household Type | # Households | Household Size |
| Married-Couple | 4 (17.4%) | 2.75 |
| Single Male/Father | 5 (21.7%) | 3.00 |
| Single Female/Mother | 3 (13.0%) | 5.00 |
| Non-family | 11 (47.8%) | 3.18 |
| Total Households | 23 (100.0%) | 3.30 |
Household Size by Marriage Status in Gentry
Out of a total of 23 households in Gentry, 12 (52.2%) are family households, while 11 (47.8%) are nonfamily households. The most numerous type of family households are 2-person households, comprising 6, and the most common type of nonfamily households are 1-person households, comprising 7.
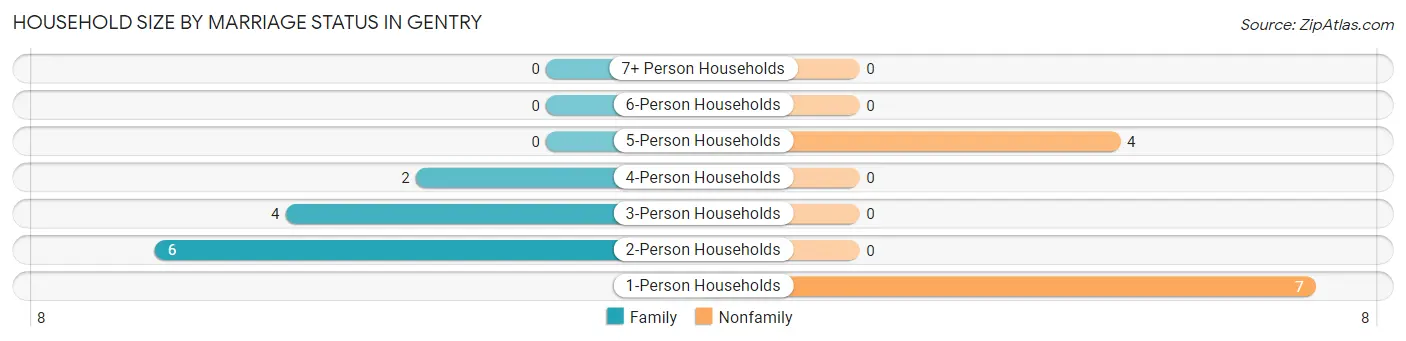
| Household Size | Family Households | Nonfamily Households |
| 1-Person Households | - | 7 (30.4%) |
| 2-Person Households | 6 (26.1%) | 0 (0.0%) |
| 3-Person Households | 4 (17.4%) | 0 (0.0%) |
| 4-Person Households | 2 (8.7%) | 0 (0.0%) |
| 5-Person Households | 0 (0.0%) | 4 (17.4%) |
| 6-Person Households | 0 (0.0%) | 0 (0.0%) |
| 7+ Person Households | 0 (0.0%) | 0 (0.0%) |
| Total | 12 (52.2%) | 11 (47.8%) |
Female Fertility in Gentry
Fertility by Age in Gentry
| Age Bracket | Women with Births | Births / 1,000 Women |
| 15 to 19 years | 0 (0.0%) | 0.0 |
| 20 to 34 years | 0 (0.0%) | 0.0 |
| 35 to 50 years | 0 (0.0%) | 0.0 |
| Total | 0 (0.0%) | 0.0 |
Fertility by Age by Marriage Status in Gentry
| Age Bracket | Married | Unmarried |
| 15 to 19 years | 0 (0.0%) | 0 (0.0%) |
| 20 to 34 years | 0 (0.0%) | 0 (0.0%) |
| 35 to 50 years | 0 (0.0%) | 0 (0.0%) |
| Total | 0 (0.0%) | 0 (0.0%) |
Fertility by Education in Gentry
| Educational Attainment | Women with Births | Births / 1,000 Women |
| Less than High School | 0 (0.0%) | 0.0 |
| High School Diploma | 0 (0.0%) | 0.0 |
| College or Associate's Degree | 0 (0.0%) | 0.0 |
| Bachelor's Degree | 0 (0.0%) | 0.0 |
| Graduate Degree | 0 (0.0%) | 0.0 |
| Total | 0 (0.0%) | 0.0 |
Fertility by Education by Marriage Status in Gentry
| Educational Attainment | Married | Unmarried |
| Less than High School | 0 (0.0%) | 0 (0.0%) |
| High School Diploma | 0 (0.0%) | 0 (0.0%) |
| College or Associate's Degree | 0 (0.0%) | 0 (0.0%) |
| Bachelor's Degree | 0 (0.0%) | 0 (0.0%) |
| Graduate Degree | 0 (0.0%) | 0 (0.0%) |
| Total | 0 (0.0%) | 0 (0.0%) |
Employment Characteristics in Gentry
Employment by Class of Employer in Gentry
Among the 50 employed individuals in Gentry, , and private company employees (50 | 100.0%) make up the most common classes of employment.
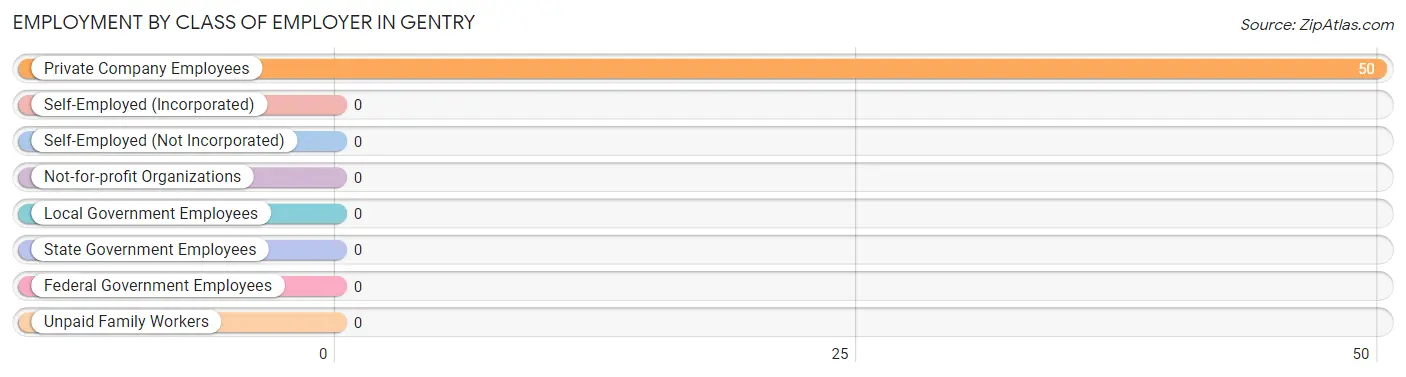
| Employer Class | # Employees | % Employees |
| Private Company Employees | 50 | 100.0% |
| Self-Employed (Incorporated) | 0 | 0.0% |
| Self-Employed (Not Incorporated) | 0 | 0.0% |
| Not-for-profit Organizations | 0 | 0.0% |
| Local Government Employees | 0 | 0.0% |
| State Government Employees | 0 | 0.0% |
| Federal Government Employees | 0 | 0.0% |
| Unpaid Family Workers | 0 | 0.0% |
| Total | 50 | 100.0% |
Employment Status by Age in Gentry
According to the labor force statistics for Gentry, out of the total population over 16 years of age (62), 85.5% or 53 individuals are in the labor force, with 5.7% or 3 of them unemployed. The age group with the highest labor force participation rate is 25 to 29 years, with 100.0% or 12 individuals in the labor force. Within the labor force, the 45 to 54 years age range has the highest percentage of unemployed individuals, with 30.0% or 3 of them being unemployed.
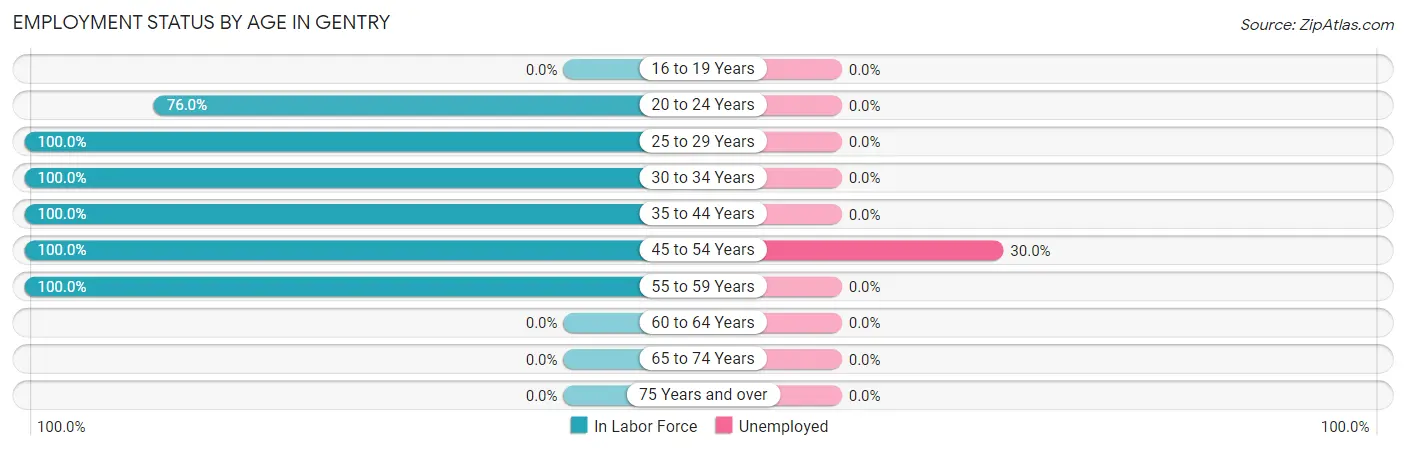
| Age Bracket | In Labor Force | Unemployed |
| 16 to 19 Years | 0 (0.0%) | 0 (0.0%) |
| 20 to 24 Years | 19 (76.0%) | 0 (0.0%) |
| 25 to 29 Years | 12 (100.0%) | 0 (0.0%) |
| 30 to 34 Years | 2 (100.0%) | 0 (0.0%) |
| 35 to 44 Years | 3 (100.0%) | 0 (0.0%) |
| 45 to 54 Years | 10 (100.0%) | 3 (30.0%) |
| 55 to 59 Years | 7 (100.0%) | 0 (0.0%) |
| 60 to 64 Years | 0 (0.0%) | 0 (0.0%) |
| 65 to 74 Years | 0 (0.0%) | 0 (0.0%) |
| 75 Years and over | 0 (0.0%) | 0 (0.0%) |
| Total | 53 (85.5%) | 3 (5.7%) |
Employment Status by Educational Attainment in Gentry
According to labor force statistics for Gentry, 97.1% of individuals (34) out of the total population between 25 and 64 years of age (35) are in the labor force, with 8.8% or 3 of them being unemployed. The group with the highest labor force participation rate are those with the educational attainment of less than high school, with 100.0% or 7 individuals in the labor force. Within the labor force, individuals with high school diploma education have the highest percentage of unemployment, with 21.4% or 3 of them being unemployed.
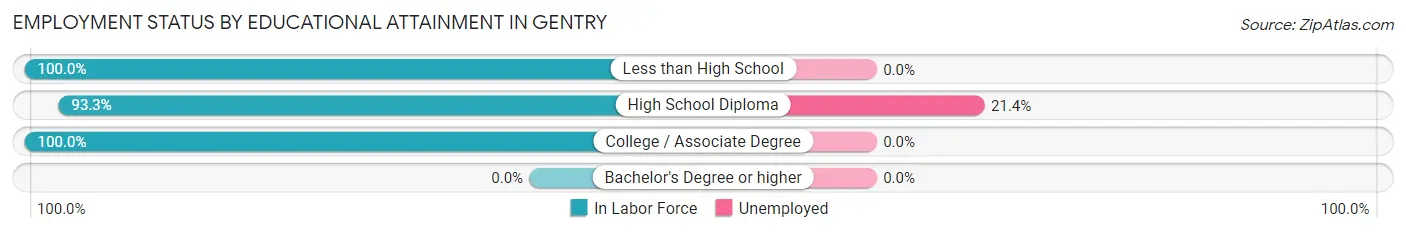
| Educational Attainment | In Labor Force | Unemployed |
| Less than High School | 7 (100.0%) | 0 (0.0%) |
| High School Diploma | 14 (93.3%) | 3 (21.4%) |
| College / Associate Degree | 13 (100.0%) | 0 (0.0%) |
| Bachelor's Degree or higher | 0 (0.0%) | 0 (0.0%) |
| Total | 34 (97.1%) | 3 (8.8%) |
Employment Occupations by Sex in Gentry
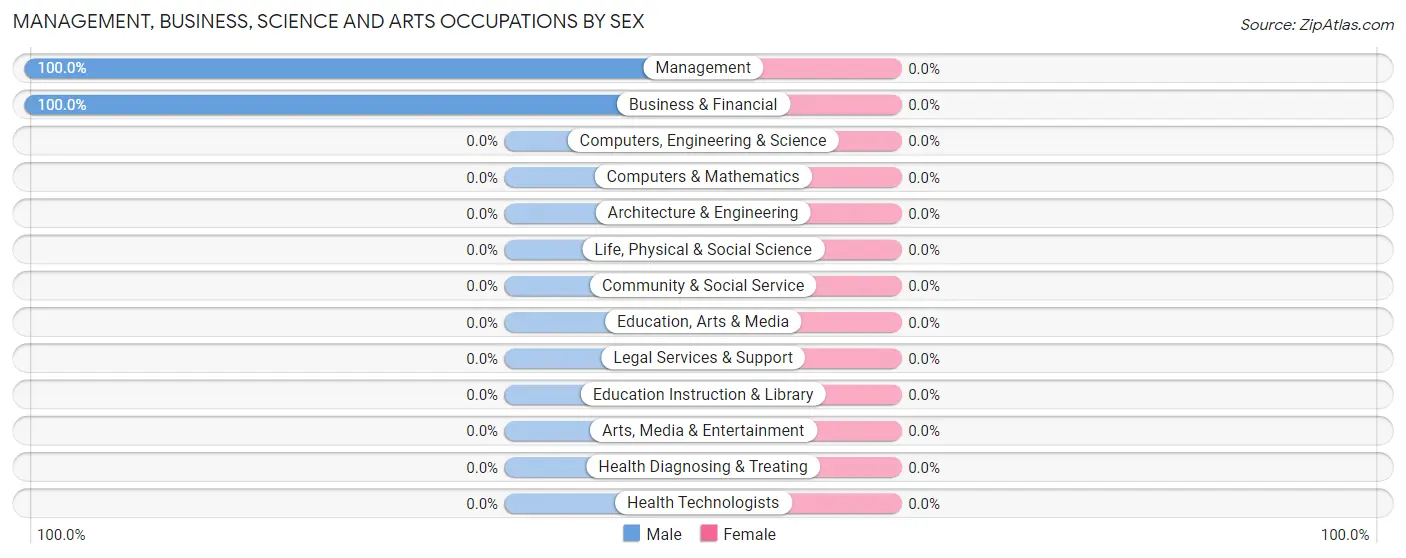
Management, Business, Science and Arts Occupations
The most common Management, Business, Science and Arts occupations in Gentry are Business & Financial (5 | 10.0%), and Management (3 | 6.0%).
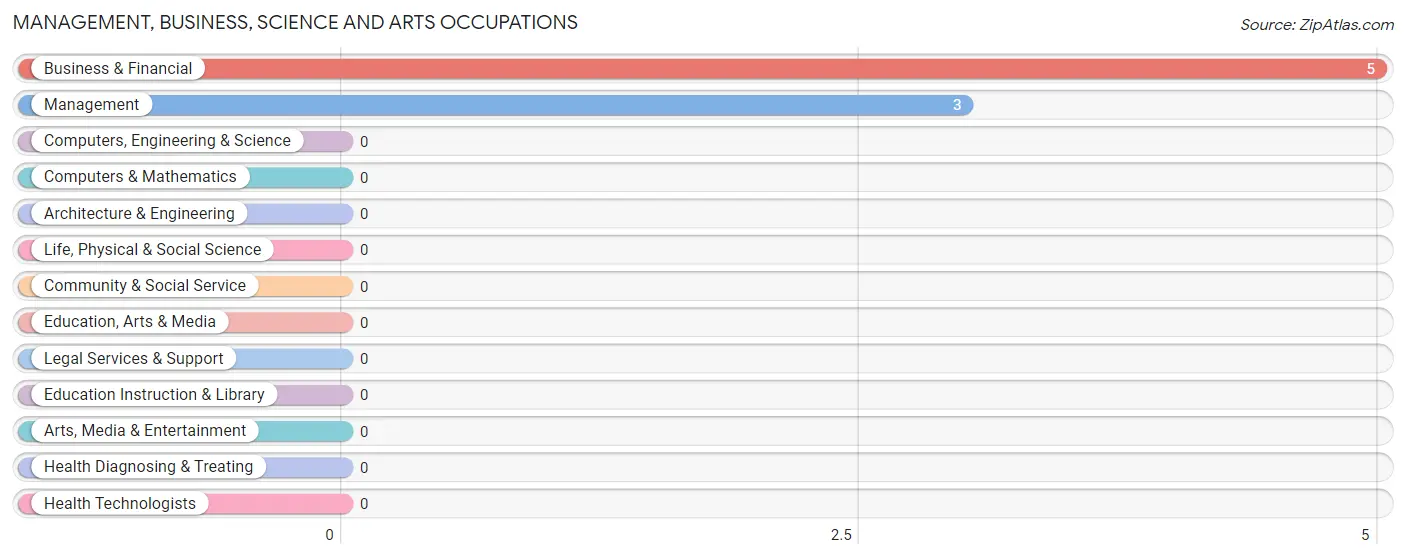
Management, Business, Science and Arts Occupations by Sex
| Occupation | Male | Female |
| Management | 3 (100.0%) | 0 (0.0%) |
| Business & Financial | 5 (100.0%) | 0 (0.0%) |
| Computers, Engineering & Science | 0 (0.0%) | 0 (0.0%) |
| Computers & Mathematics | 0 (0.0%) | 0 (0.0%) |
| Architecture & Engineering | 0 (0.0%) | 0 (0.0%) |
| Life, Physical & Social Science | 0 (0.0%) | 0 (0.0%) |
| Community & Social Service | 0 (0.0%) | 0 (0.0%) |
| Education, Arts & Media | 0 (0.0%) | 0 (0.0%) |
| Legal Services & Support | 0 (0.0%) | 0 (0.0%) |
| Education Instruction & Library | 0 (0.0%) | 0 (0.0%) |
| Arts, Media & Entertainment | 0 (0.0%) | 0 (0.0%) |
| Health Diagnosing & Treating | 0 (0.0%) | 0 (0.0%) |
| Health Technologists | 0 (0.0%) | 0 (0.0%) |
| Total (Category) | 8 (100.0%) | 0 (0.0%) |
| Total (Overall) | 44 (88.0%) | 6 (12.0%) |
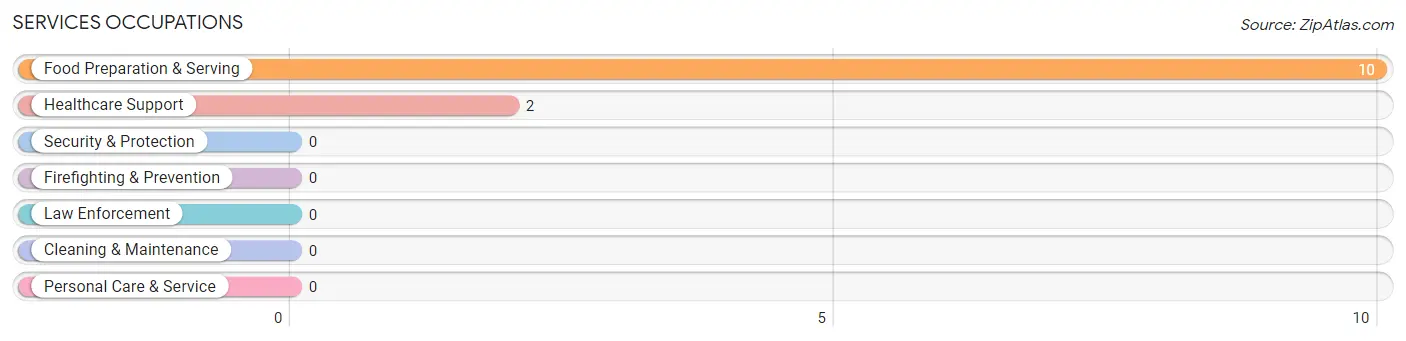
Services Occupations
The most common Services occupations in Gentry are Food Preparation & Serving (10 | 20.0%), and Healthcare Support (2 | 4.0%).
Services Occupations by Sex
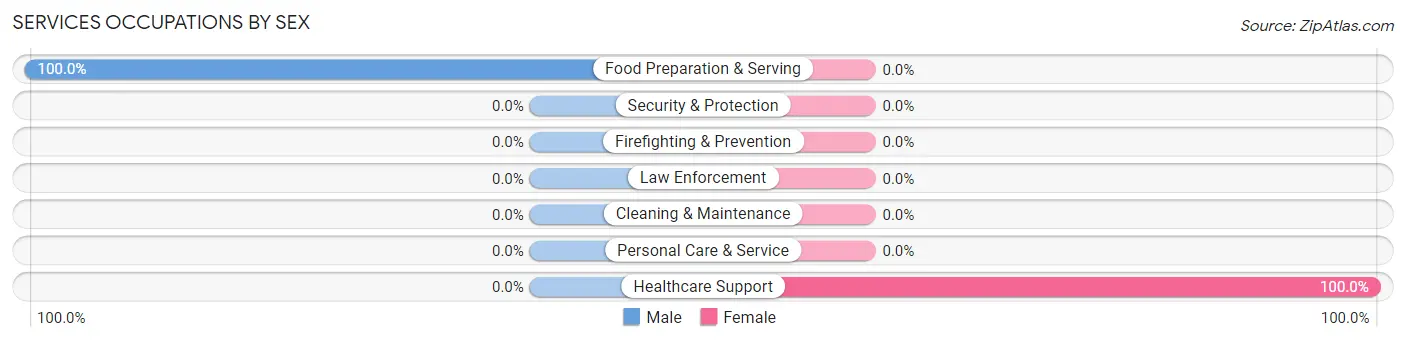
| Occupation | Male | Female |
| Healthcare Support | 0 (0.0%) | 2 (100.0%) |
| Security & Protection | 0 (0.0%) | 0 (0.0%) |
| Firefighting & Prevention | 0 (0.0%) | 0 (0.0%) |
| Law Enforcement | 0 (0.0%) | 0 (0.0%) |
| Food Preparation & Serving | 10 (100.0%) | 0 (0.0%) |
| Cleaning & Maintenance | 0 (0.0%) | 0 (0.0%) |
| Personal Care & Service | 0 (0.0%) | 0 (0.0%) |
| Total (Category) | 10 (83.3%) | 2 (16.7%) |
| Total (Overall) | 44 (88.0%) | 6 (12.0%) |
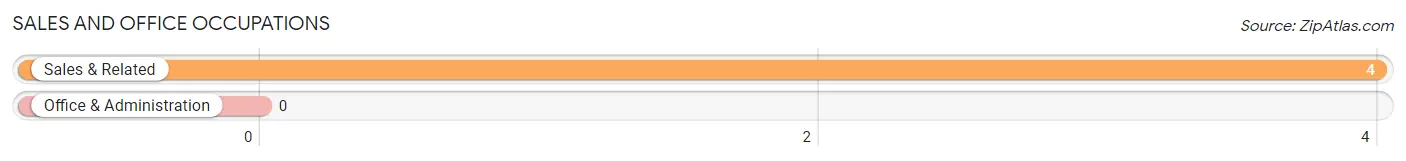
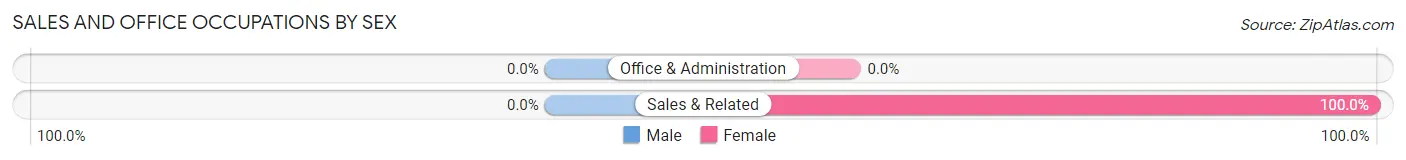
Sales and Office Occupations
The most common Sales and Office occupations in Gentry are , and Sales & Related (4 | 8.0%).
Sales and Office Occupations by Sex
| Occupation | Male | Female |
| Sales & Related | 0 (0.0%) | 4 (100.0%) |
| Office & Administration | 0 (0.0%) | 0 (0.0%) |
| Total (Category) | 0 (0.0%) | 4 (100.0%) |
| Total (Overall) | 44 (88.0%) | 6 (12.0%) |
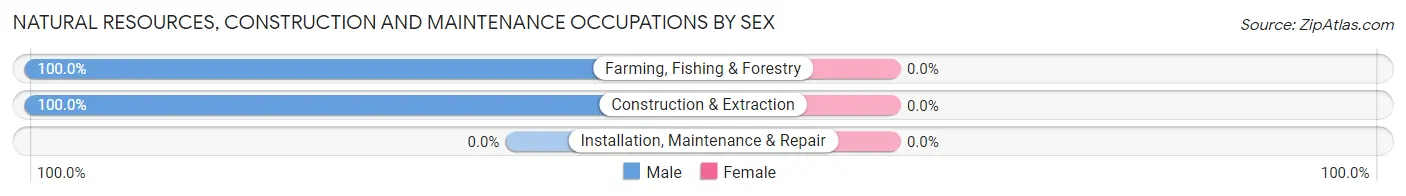
Natural Resources, Construction and Maintenance Occupations
The most common Natural Resources, Construction and Maintenance occupations in Gentry are Construction & Extraction (13 | 26.0%), and Farming, Fishing & Forestry (4 | 8.0%).
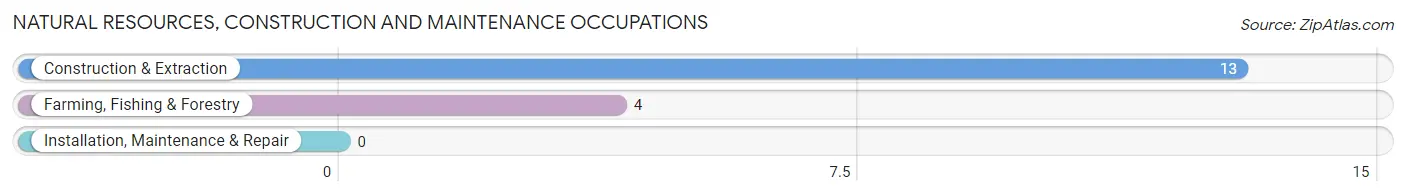
Natural Resources, Construction and Maintenance Occupations by Sex
| Occupation | Male | Female |
| Farming, Fishing & Forestry | 4 (100.0%) | 0 (0.0%) |
| Construction & Extraction | 13 (100.0%) | 0 (0.0%) |
| Installation, Maintenance & Repair | 0 (0.0%) | 0 (0.0%) |
| Total (Category) | 17 (100.0%) | 0 (0.0%) |
| Total (Overall) | 44 (88.0%) | 6 (12.0%) |
Production, Transportation and Moving Occupations
The most common Production, Transportation and Moving occupations in Gentry are Production (7 | 14.0%), and Material Moving (2 | 4.0%).
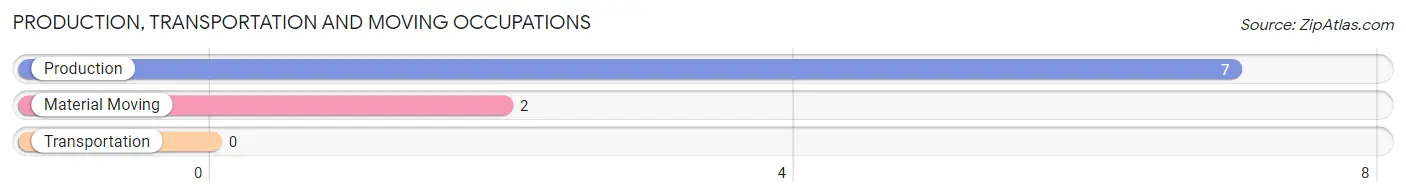
Production, Transportation and Moving Occupations by Sex
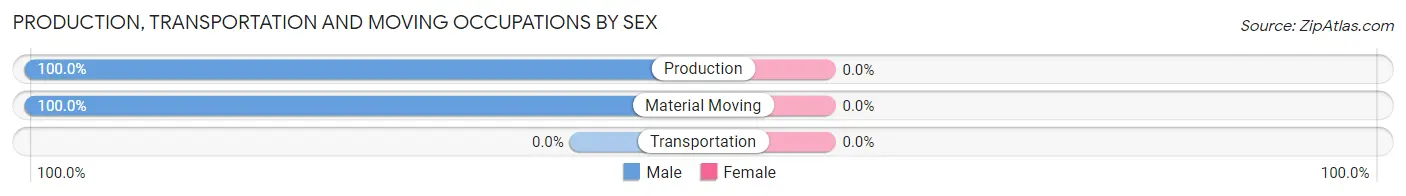
| Occupation | Male | Female |
| Production | 7 (100.0%) | 0 (0.0%) |
| Transportation | 0 (0.0%) | 0 (0.0%) |
| Material Moving | 2 (100.0%) | 0 (0.0%) |
| Total (Category) | 9 (100.0%) | 0 (0.0%) |
| Total (Overall) | 44 (88.0%) | 6 (12.0%) |
Employment Industries by Sex in Gentry
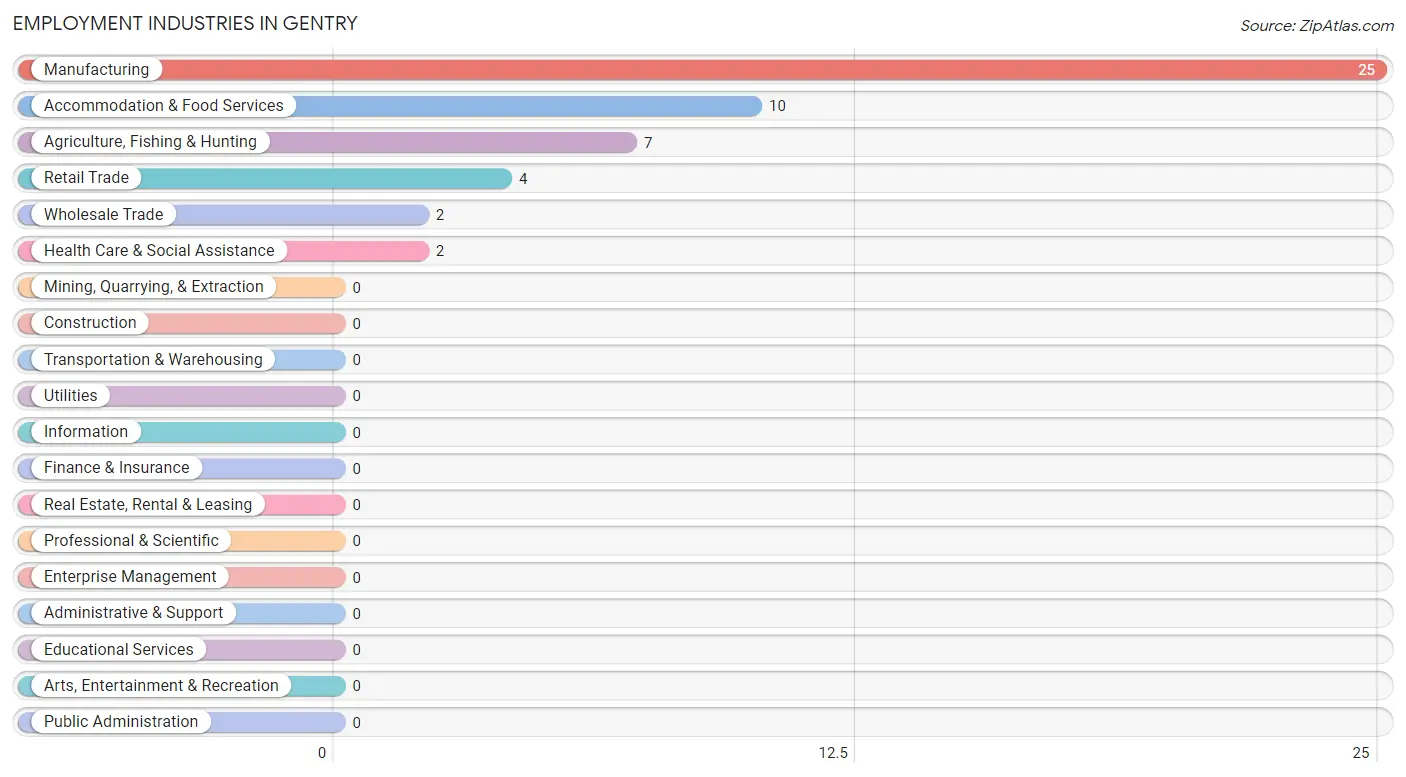
Employment Industries in Gentry
The major employment industries in Gentry include Manufacturing (25 | 50.0%), Accommodation & Food Services (10 | 20.0%), Agriculture, Fishing & Hunting (7 | 14.0%), Retail Trade (4 | 8.0%), and Wholesale Trade (2 | 4.0%).
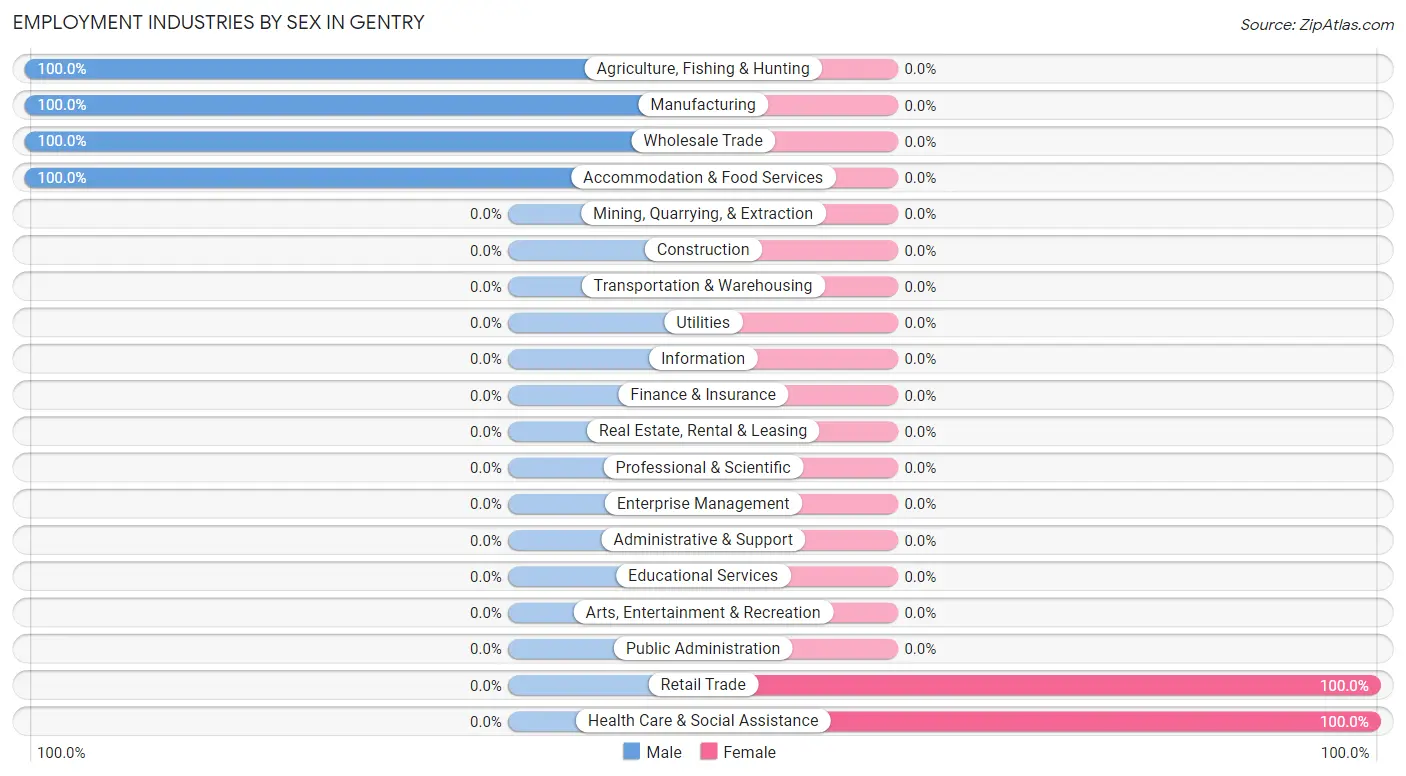
Employment Industries by Sex in Gentry
The Gentry industries that see more men than women are Agriculture, Fishing & Hunting (100.0%), Manufacturing (100.0%), and Wholesale Trade (100.0%), whereas the industries that tend to have a higher number of women are Retail Trade (100.0%), and Health Care & Social Assistance (100.0%).
| Industry | Male | Female |
| Agriculture, Fishing & Hunting | 7 (100.0%) | 0 (0.0%) |
| Mining, Quarrying, & Extraction | 0 (0.0%) | 0 (0.0%) |
| Construction | 0 (0.0%) | 0 (0.0%) |
| Manufacturing | 25 (100.0%) | 0 (0.0%) |
| Wholesale Trade | 2 (100.0%) | 0 (0.0%) |
| Retail Trade | 0 (0.0%) | 4 (100.0%) |
| Transportation & Warehousing | 0 (0.0%) | 0 (0.0%) |
| Utilities | 0 (0.0%) | 0 (0.0%) |
| Information | 0 (0.0%) | 0 (0.0%) |
| Finance & Insurance | 0 (0.0%) | 0 (0.0%) |
| Real Estate, Rental & Leasing | 0 (0.0%) | 0 (0.0%) |
| Professional & Scientific | 0 (0.0%) | 0 (0.0%) |
| Enterprise Management | 0 (0.0%) | 0 (0.0%) |
| Administrative & Support | 0 (0.0%) | 0 (0.0%) |
| Educational Services | 0 (0.0%) | 0 (0.0%) |
| Health Care & Social Assistance | 0 (0.0%) | 2 (100.0%) |
| Arts, Entertainment & Recreation | 0 (0.0%) | 0 (0.0%) |
| Accommodation & Food Services | 10 (100.0%) | 0 (0.0%) |
| Public Administration | 0 (0.0%) | 0 (0.0%) |
| Total | 44 (88.0%) | 6 (12.0%) |
Education in Gentry
School Enrollment in Gentry
The most common levels of schooling among the 8 students in Gentry are kindergarten (6 | 75.0%), and college / undergraduate (2 | 25.0%).
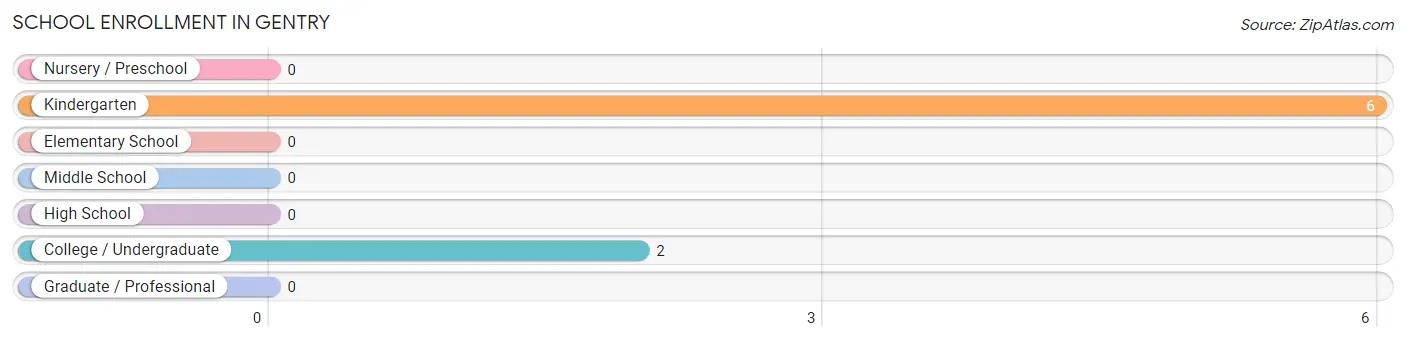
| School Level | # Students | % Students |
| Nursery / Preschool | 0 | 0.0% |
| Kindergarten | 6 | 75.0% |
| Elementary School | 0 | 0.0% |
| Middle School | 0 | 0.0% |
| High School | 0 | 0.0% |
| College / Undergraduate | 2 | 25.0% |
| Graduate / Professional | 0 | 0.0% |
| Total | 8 | 100.0% |
School Enrollment by Age by Funding Source in Gentry
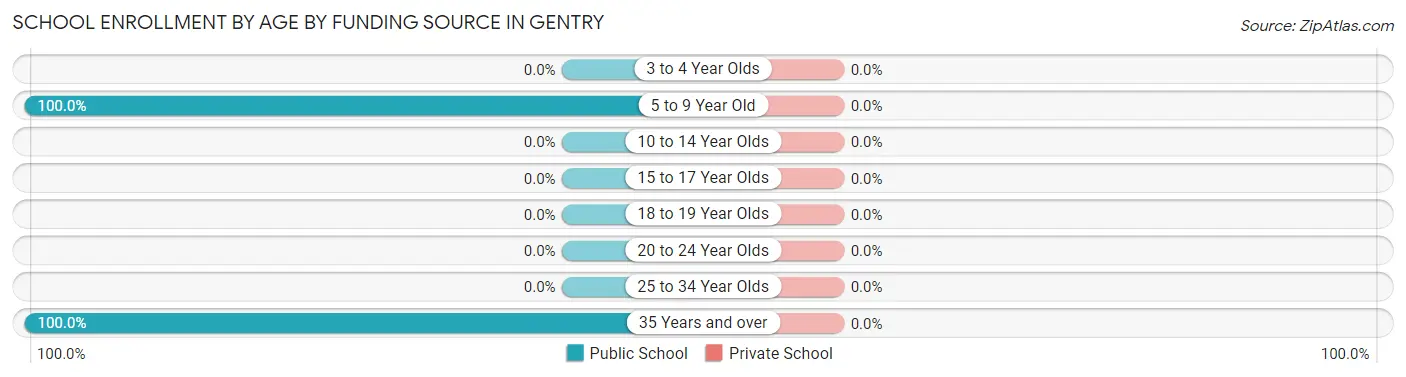
| Age Bracket | Public School | Private School |
| 3 to 4 Year Olds | 0 (0.0%) | 0 (0.0%) |
| 5 to 9 Year Old | 6 (100.0%) | 0 (0.0%) |
| 10 to 14 Year Olds | 0 (0.0%) | 0 (0.0%) |
| 15 to 17 Year Olds | 0 (0.0%) | 0 (0.0%) |
| 18 to 19 Year Olds | 0 (0.0%) | 0 (0.0%) |
| 20 to 24 Year Olds | 0 (0.0%) | 0 (0.0%) |
| 25 to 34 Year Olds | 0 (0.0%) | 0 (0.0%) |
| 35 Years and over | 2 (100.0%) | 0 (0.0%) |
| Total | 8 (100.0%) | 0 (0.0%) |
Educational Attainment by Field of Study in Gentry
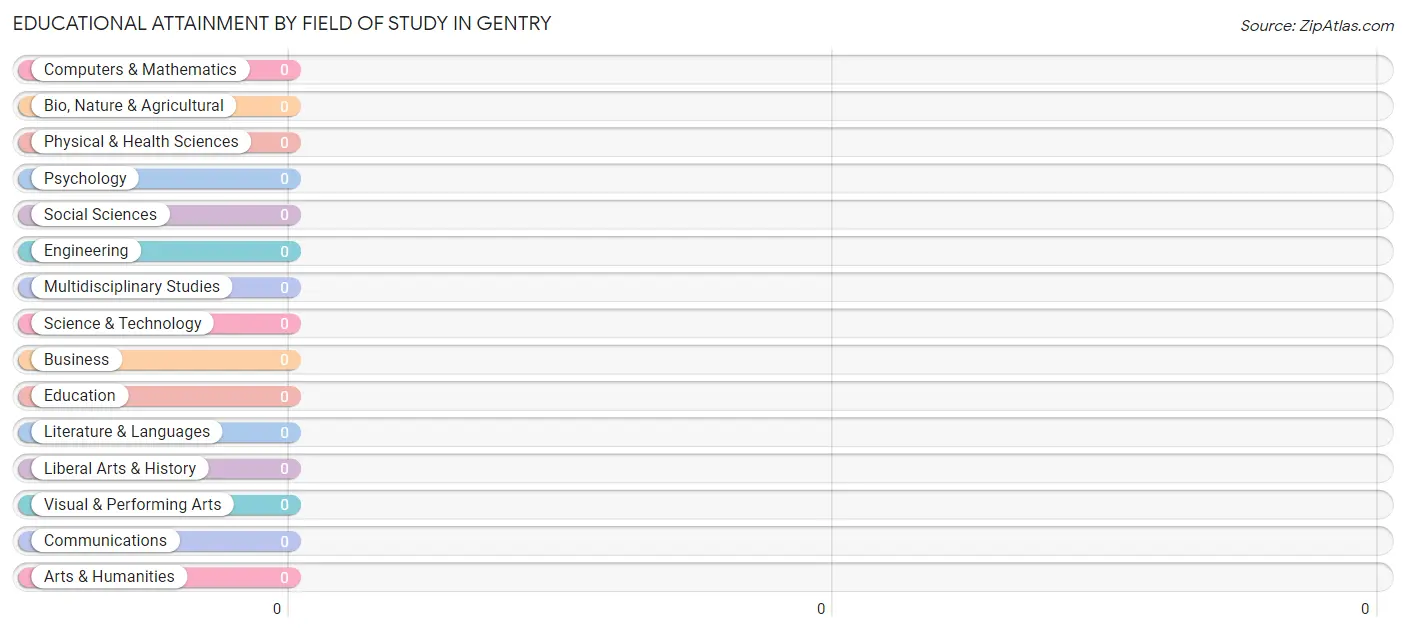
| Field of Study | # Graduates | % Graduates |
| Computers & Mathematics | 0 | 0.0% |
| Bio, Nature & Agricultural | 0 | 0.0% |
| Physical & Health Sciences | 0 | 0.0% |
| Psychology | 0 | 0.0% |
| Social Sciences | 0 | 0.0% |
| Engineering | 0 | 0.0% |
| Multidisciplinary Studies | 0 | 0.0% |
| Science & Technology | 0 | 0.0% |
| Business | 0 | 0.0% |
| Education | 0 | 0.0% |
| Literature & Languages | 0 | 0.0% |
| Liberal Arts & History | 0 | 0.0% |
| Visual & Performing Arts | 0 | 0.0% |
| Communications | 0 | 0.0% |
| Arts & Humanities | 0 | 0.0% |
| Total | 0 | 0.0% |
Transportation & Commute in Gentry
Vehicle Availability by Sex in Gentry
The most prevalent vehicle ownership categories in Gentry are males with 4 vehicles (20, accounting for 45.5%) and females with 4 vehicles (2, making up 333.3%).
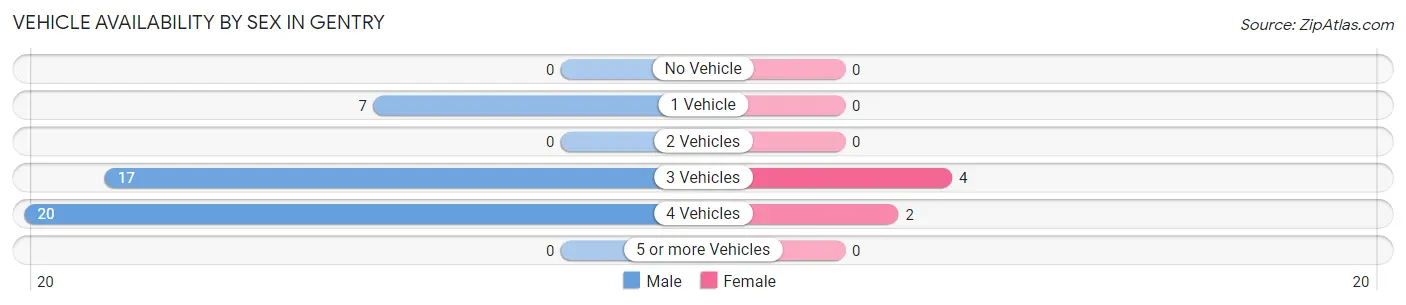
| Vehicles Available | Male | Female |
| No Vehicle | 0 (0.0%) | 0 (0.0%) |
| 1 Vehicle | 7 (15.9%) | 0 (0.0%) |
| 2 Vehicles | 0 (0.0%) | 0 (0.0%) |
| 3 Vehicles | 17 (38.6%) | 4 (66.7%) |
| 4 Vehicles | 20 (45.5%) | 2 (33.3%) |
| 5 or more Vehicles | 0 (0.0%) | 0 (0.0%) |
| Total | 44 (100.0%) | 6 (100.0%) |
Commute Time in Gentry
The most frequently occuring commute durations in Gentry are 10 to 14 minutes (18 commuters, 36.0%), 15 to 19 minutes (13 commuters, 26.0%), and 20 to 24 minutes (9 commuters, 18.0%).
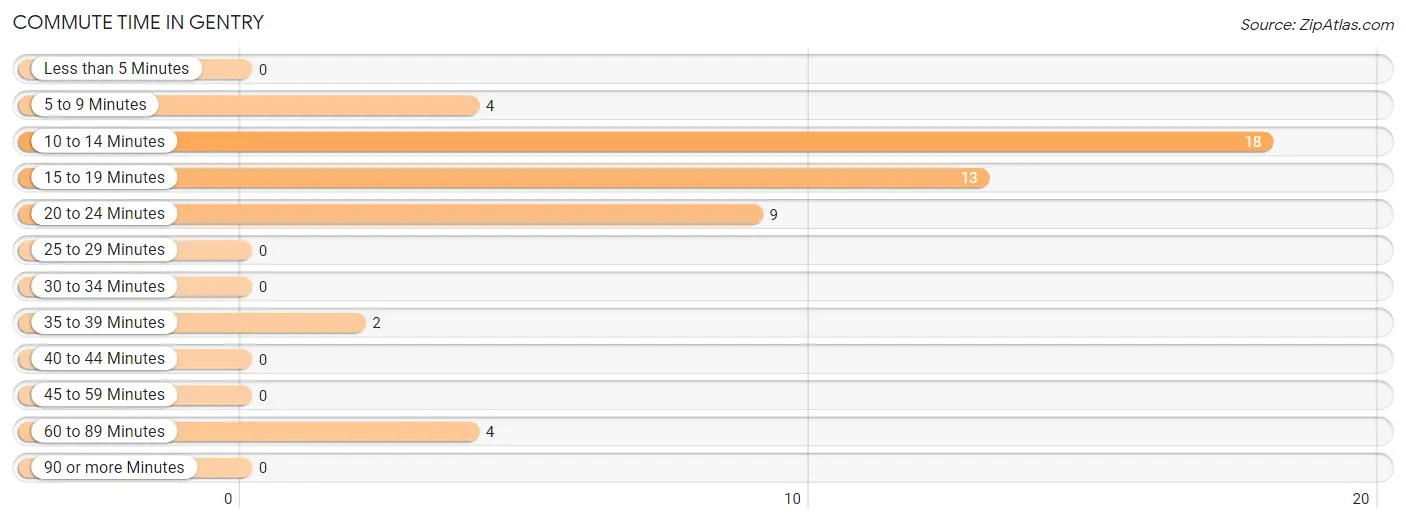
| Commute Time | # Commuters | % Commuters |
| Less than 5 Minutes | 0 | 0.0% |
| 5 to 9 Minutes | 4 | 8.0% |
| 10 to 14 Minutes | 18 | 36.0% |
| 15 to 19 Minutes | 13 | 26.0% |
| 20 to 24 Minutes | 9 | 18.0% |
| 25 to 29 Minutes | 0 | 0.0% |
| 30 to 34 Minutes | 0 | 0.0% |
| 35 to 39 Minutes | 2 | 4.0% |
| 40 to 44 Minutes | 0 | 0.0% |
| 45 to 59 Minutes | 0 | 0.0% |
| 60 to 89 Minutes | 4 | 8.0% |
| 90 or more Minutes | 0 | 0.0% |
Commute Time by Sex in Gentry
The most common commute times in Gentry are 10 to 14 minutes (18 commuters, 40.9%) for males and 60 to 89 minutes (4 commuters, 66.7%) for females.
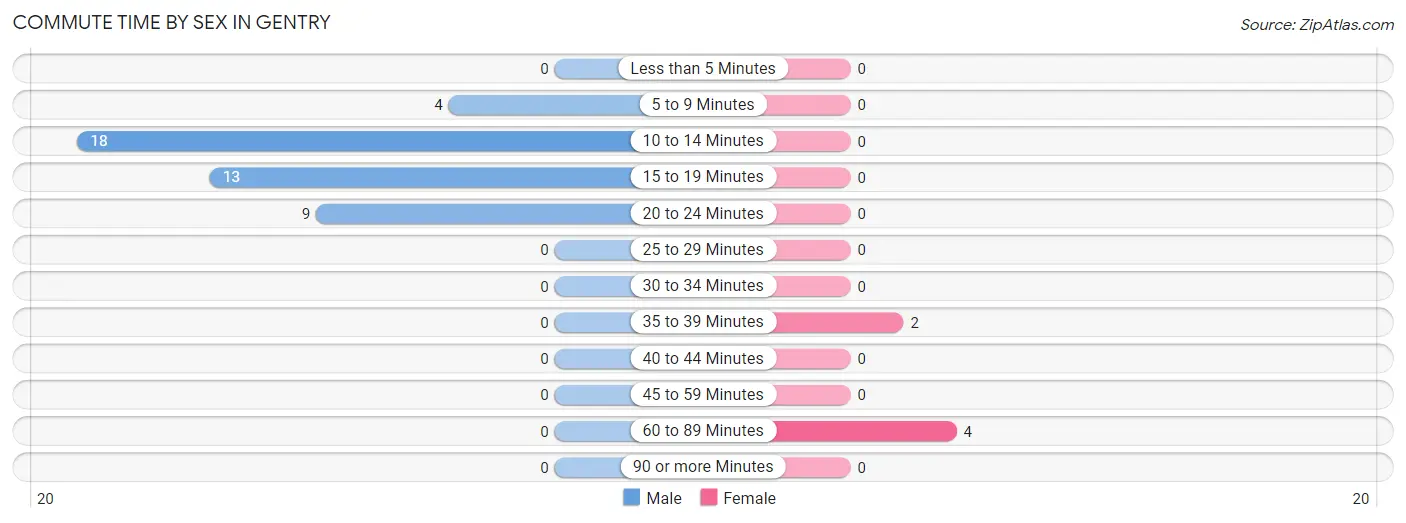
| Commute Time | Male | Female |
| Less than 5 Minutes | 0 (0.0%) | 0 (0.0%) |
| 5 to 9 Minutes | 4 (9.1%) | 0 (0.0%) |
| 10 to 14 Minutes | 18 (40.9%) | 0 (0.0%) |
| 15 to 19 Minutes | 13 (29.5%) | 0 (0.0%) |
| 20 to 24 Minutes | 9 (20.4%) | 0 (0.0%) |
| 25 to 29 Minutes | 0 (0.0%) | 0 (0.0%) |
| 30 to 34 Minutes | 0 (0.0%) | 0 (0.0%) |
| 35 to 39 Minutes | 0 (0.0%) | 2 (33.3%) |
| 40 to 44 Minutes | 0 (0.0%) | 0 (0.0%) |
| 45 to 59 Minutes | 0 (0.0%) | 0 (0.0%) |
| 60 to 89 Minutes | 0 (0.0%) | 4 (66.7%) |
| 90 or more Minutes | 0 (0.0%) | 0 (0.0%) |
Time of Departure to Work by Sex in Gentry
The most frequent times of departure to work in Gentry are 7:00 AM to 7:29 AM (18, 40.9%) for males and 5:00 AM to 5:29 AM (4, 66.7%) for females.
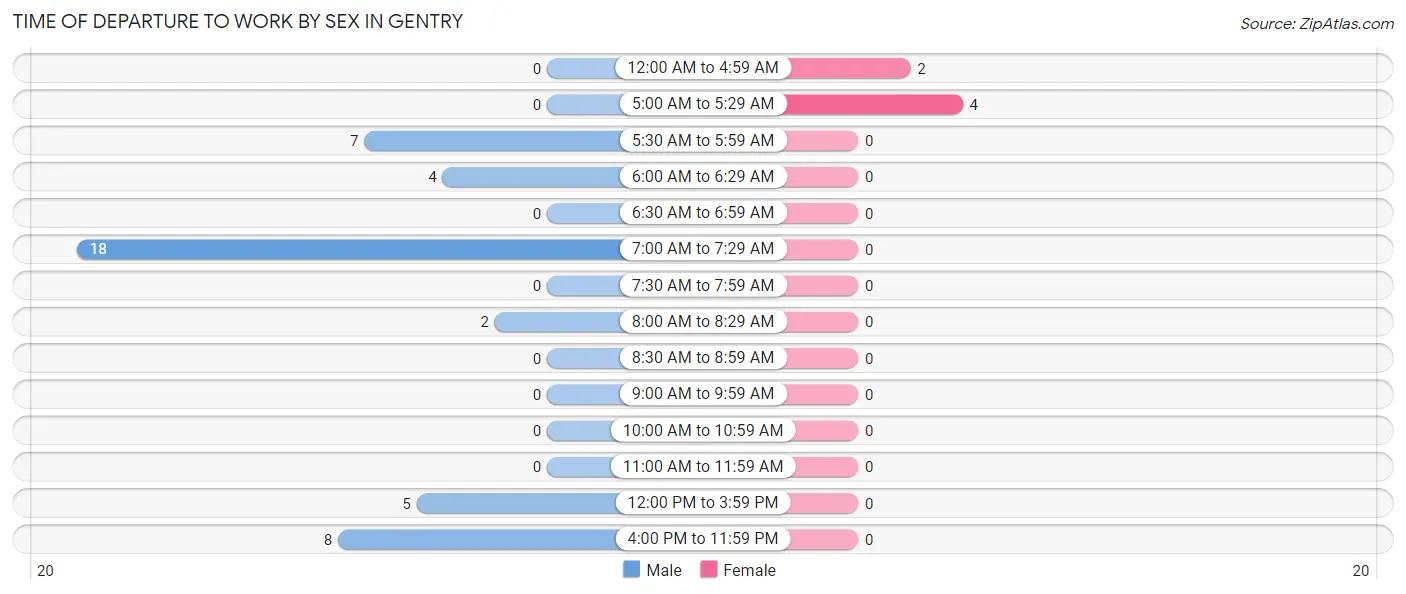
| Time of Departure | Male | Female |
| 12:00 AM to 4:59 AM | 0 (0.0%) | 2 (33.3%) |
| 5:00 AM to 5:29 AM | 0 (0.0%) | 4 (66.7%) |
| 5:30 AM to 5:59 AM | 7 (15.9%) | 0 (0.0%) |
| 6:00 AM to 6:29 AM | 4 (9.1%) | 0 (0.0%) |
| 6:30 AM to 6:59 AM | 0 (0.0%) | 0 (0.0%) |
| 7:00 AM to 7:29 AM | 18 (40.9%) | 0 (0.0%) |
| 7:30 AM to 7:59 AM | 0 (0.0%) | 0 (0.0%) |
| 8:00 AM to 8:29 AM | 2 (4.5%) | 0 (0.0%) |
| 8:30 AM to 8:59 AM | 0 (0.0%) | 0 (0.0%) |
| 9:00 AM to 9:59 AM | 0 (0.0%) | 0 (0.0%) |
| 10:00 AM to 10:59 AM | 0 (0.0%) | 0 (0.0%) |
| 11:00 AM to 11:59 AM | 0 (0.0%) | 0 (0.0%) |
| 12:00 PM to 3:59 PM | 5 (11.4%) | 0 (0.0%) |
| 4:00 PM to 11:59 PM | 8 (18.2%) | 0 (0.0%) |
| Total | 44 (100.0%) | 6 (100.0%) |
Housing Occupancy in Gentry
Occupancy by Ownership in Gentry
Of the total 23 dwellings in Gentry, owner-occupied units account for 21 (91.3%), while renter-occupied units make up 2 (8.7%).
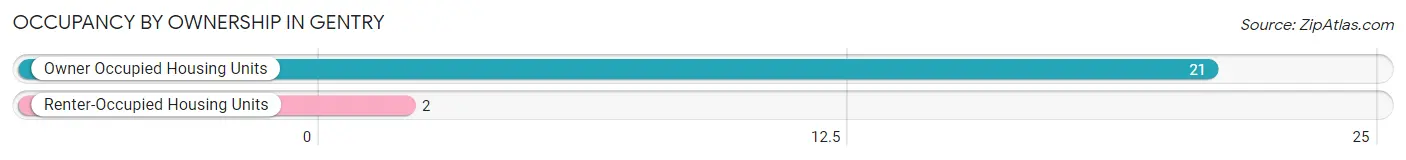
| Occupancy | # Housing Units | % Housing Units |
| Owner Occupied Housing Units | 21 | 91.3% |
| Renter-Occupied Housing Units | 2 | 8.7% |
| Total Occupied Housing Units | 23 | 100.0% |
Occupancy by Household Size in Gentry
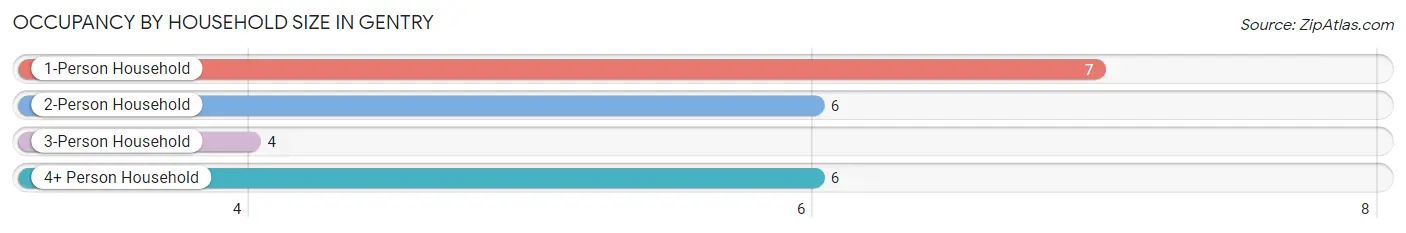
| Household Size | # Housing Units | % Housing Units |
| 1-Person Household | 7 | 30.4% |
| 2-Person Household | 6 | 26.1% |
| 3-Person Household | 4 | 17.4% |
| 4+ Person Household | 6 | 26.1% |
| Total Housing Units | 23 | 100.0% |
Occupancy by Ownership by Household Size in Gentry
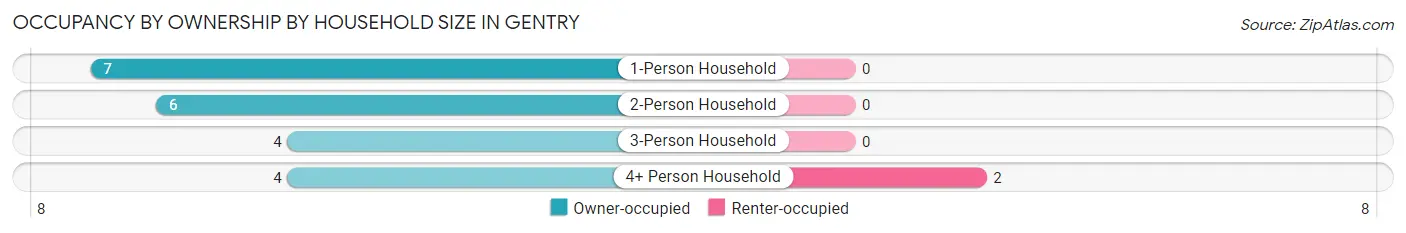
| Household Size | Owner-occupied | Renter-occupied |
| 1-Person Household | 7 (100.0%) | 0 (0.0%) |
| 2-Person Household | 6 (100.0%) | 0 (0.0%) |
| 3-Person Household | 4 (100.0%) | 0 (0.0%) |
| 4+ Person Household | 4 (66.7%) | 2 (33.3%) |
| Total Housing Units | 21 (91.3%) | 2 (8.7%) |
Occupancy by Educational Attainment in Gentry
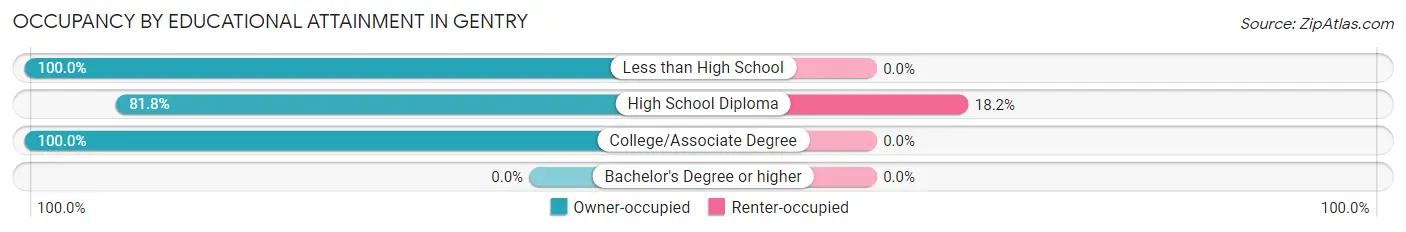
| Household Size | Owner-occupied | Renter-occupied |
| Less than High School | 7 (100.0%) | 0 (0.0%) |
| High School Diploma | 9 (81.8%) | 2 (18.2%) |
| College/Associate Degree | 5 (100.0%) | 0 (0.0%) |
| Bachelor's Degree or higher | 0 (0.0%) | 0 (0.0%) |
Occupancy by Age of Householder in Gentry
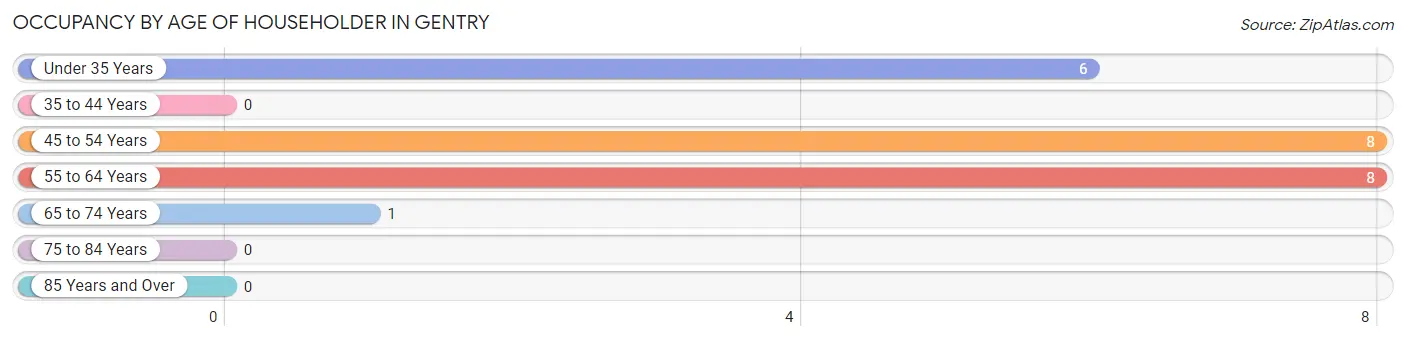
| Age Bracket | # Households | % Households |
| Under 35 Years | 6 | 26.1% |
| 35 to 44 Years | 0 | 0.0% |
| 45 to 54 Years | 8 | 34.8% |
| 55 to 64 Years | 8 | 34.8% |
| 65 to 74 Years | 1 | 4.3% |
| 75 to 84 Years | 0 | 0.0% |
| 85 Years and Over | 0 | 0.0% |
| Total | 23 | 100.0% |
Housing Finances in Gentry
Median Income by Occupancy in Gentry
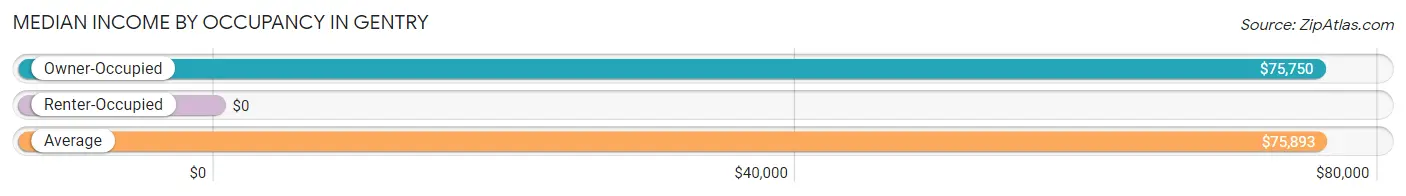
| Occupancy Type | # Households | Median Income |
| Owner-Occupied | 21 (91.3%) | $75,750 |
| Renter-Occupied | 2 (8.7%) | $0 |
| Average | 23 (100.0%) | $75,893 |
Occupancy by Householder Income Bracket in Gentry
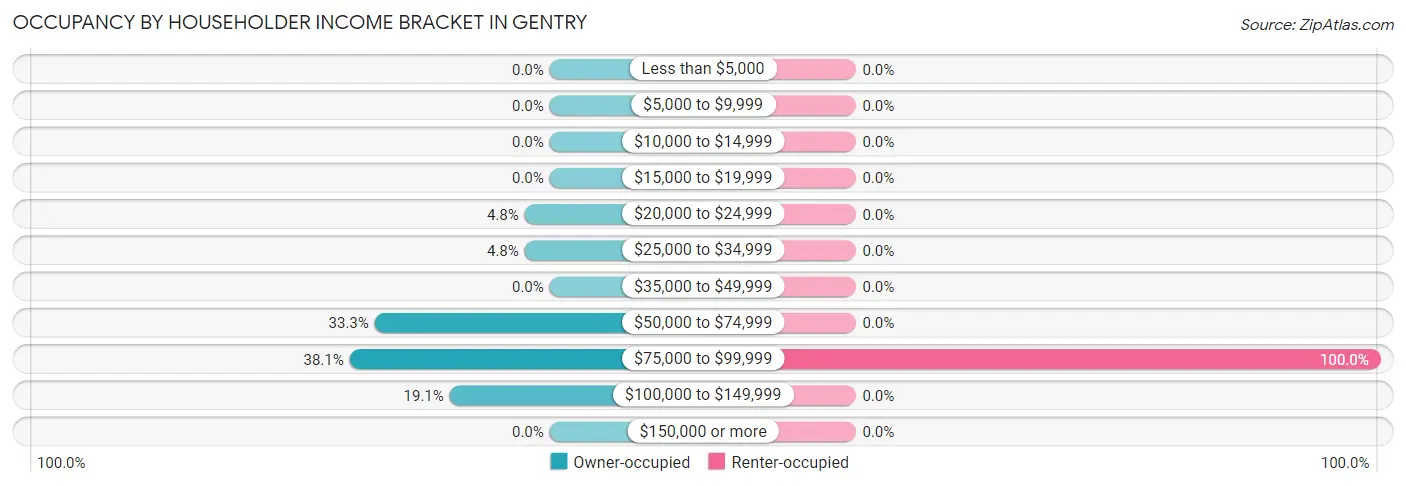
| Income Bracket | Owner-occupied | Renter-occupied |
| Less than $5,000 | 0 (0.0%) | 0 (0.0%) |
| $5,000 to $9,999 | 0 (0.0%) | 0 (0.0%) |
| $10,000 to $14,999 | 0 (0.0%) | 0 (0.0%) |
| $15,000 to $19,999 | 0 (0.0%) | 0 (0.0%) |
| $20,000 to $24,999 | 1 (4.8%) | 0 (0.0%) |
| $25,000 to $34,999 | 1 (4.8%) | 0 (0.0%) |
| $35,000 to $49,999 | 0 (0.0%) | 0 (0.0%) |
| $50,000 to $74,999 | 7 (33.3%) | 0 (0.0%) |
| $75,000 to $99,999 | 8 (38.1%) | 2 (100.0%) |
| $100,000 to $149,999 | 4 (19.1%) | 0 (0.0%) |
| $150,000 or more | 0 (0.0%) | 0 (0.0%) |
| Total | 21 (100.0%) | 2 (100.0%) |
Monthly Housing Cost Tiers in Gentry
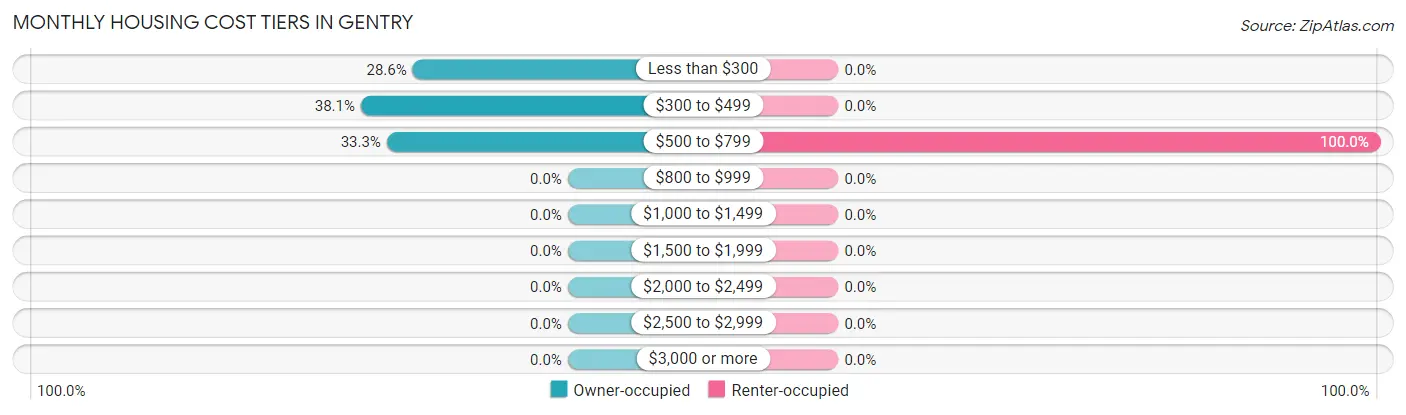
| Monthly Cost | Owner-occupied | Renter-occupied |
| Less than $300 | 6 (28.6%) | 0 (0.0%) |
| $300 to $499 | 8 (38.1%) | 0 (0.0%) |
| $500 to $799 | 7 (33.3%) | 2 (100.0%) |
| $800 to $999 | 0 (0.0%) | 0 (0.0%) |
| $1,000 to $1,499 | 0 (0.0%) | 0 (0.0%) |
| $1,500 to $1,999 | 0 (0.0%) | 0 (0.0%) |
| $2,000 to $2,499 | 0 (0.0%) | 0 (0.0%) |
| $2,500 to $2,999 | 0 (0.0%) | 0 (0.0%) |
| $3,000 or more | 0 (0.0%) | 0 (0.0%) |
| Total | 21 (100.0%) | 2 (100.0%) |
Physical Housing Characteristics in Gentry
Housing Structures in Gentry
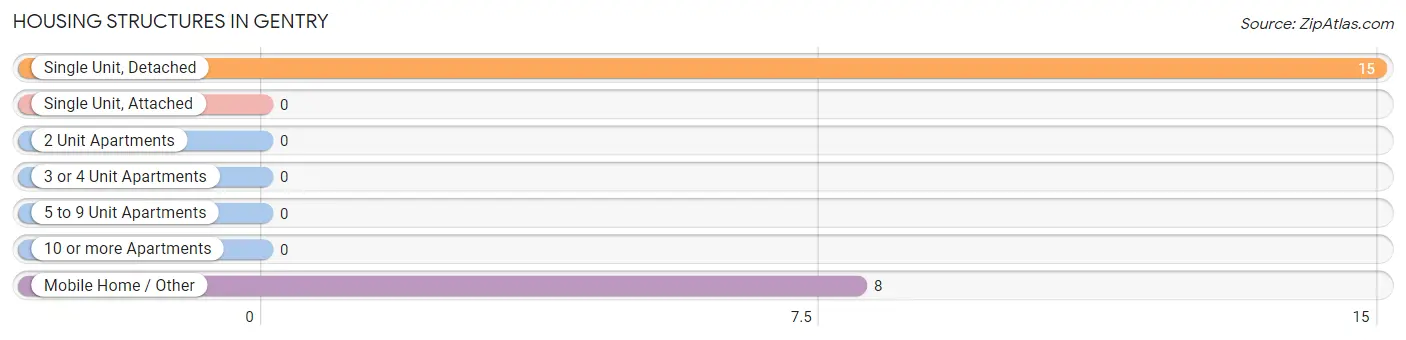
| Structure Type | # Housing Units | % Housing Units |
| Single Unit, Detached | 15 | 65.2% |
| Single Unit, Attached | 0 | 0.0% |
| 2 Unit Apartments | 0 | 0.0% |
| 3 or 4 Unit Apartments | 0 | 0.0% |
| 5 to 9 Unit Apartments | 0 | 0.0% |
| 10 or more Apartments | 0 | 0.0% |
| Mobile Home / Other | 8 | 34.8% |
| Total | 23 | 100.0% |
Housing Structures by Occupancy in Gentry
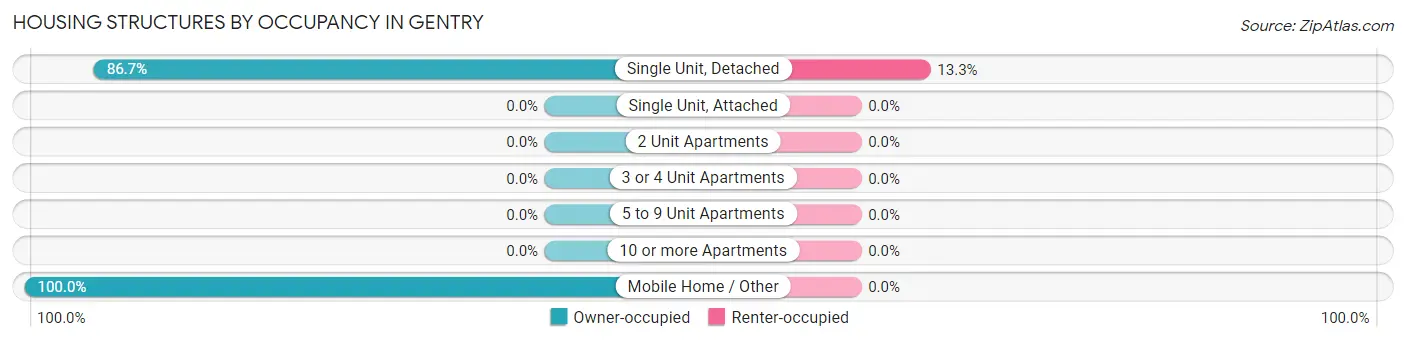
| Structure Type | Owner-occupied | Renter-occupied |
| Single Unit, Detached | 13 (86.7%) | 2 (13.3%) |
| Single Unit, Attached | 0 (0.0%) | 0 (0.0%) |
| 2 Unit Apartments | 0 (0.0%) | 0 (0.0%) |
| 3 or 4 Unit Apartments | 0 (0.0%) | 0 (0.0%) |
| 5 to 9 Unit Apartments | 0 (0.0%) | 0 (0.0%) |
| 10 or more Apartments | 0 (0.0%) | 0 (0.0%) |
| Mobile Home / Other | 8 (100.0%) | 0 (0.0%) |
| Total | 21 (91.3%) | 2 (8.7%) |
Housing Structures by Number of Rooms in Gentry
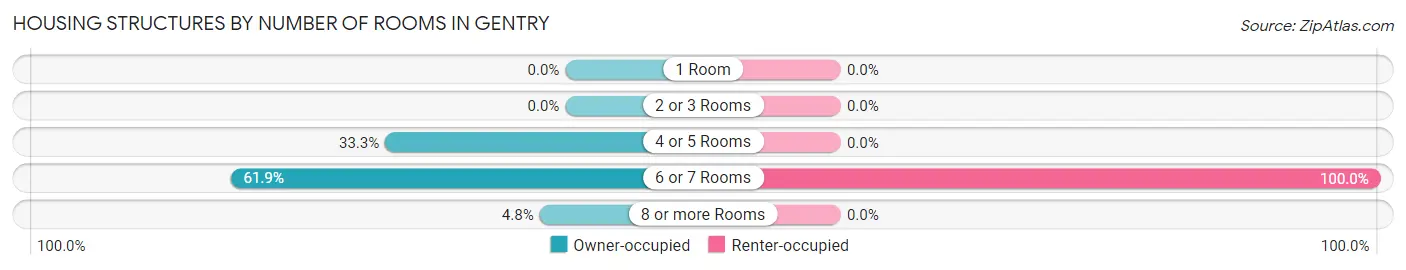
| Number of Rooms | Owner-occupied | Renter-occupied |
| 1 Room | 0 (0.0%) | 0 (0.0%) |
| 2 or 3 Rooms | 0 (0.0%) | 0 (0.0%) |
| 4 or 5 Rooms | 7 (33.3%) | 0 (0.0%) |
| 6 or 7 Rooms | 13 (61.9%) | 2 (100.0%) |
| 8 or more Rooms | 1 (4.8%) | 0 (0.0%) |
| Total | 21 (100.0%) | 2 (100.0%) |
Housing Structure by Heating Type in Gentry
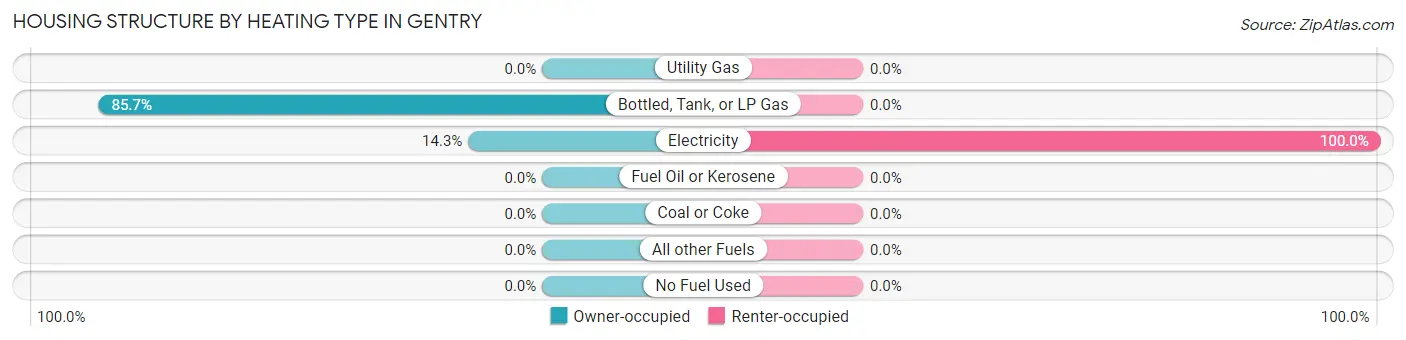
| Heating Type | Owner-occupied | Renter-occupied |
| Utility Gas | 0 (0.0%) | 0 (0.0%) |
| Bottled, Tank, or LP Gas | 18 (85.7%) | 0 (0.0%) |
| Electricity | 3 (14.3%) | 2 (100.0%) |
| Fuel Oil or Kerosene | 0 (0.0%) | 0 (0.0%) |
| Coal or Coke | 0 (0.0%) | 0 (0.0%) |
| All other Fuels | 0 (0.0%) | 0 (0.0%) |
| No Fuel Used | 0 (0.0%) | 0 (0.0%) |
| Total | 21 (100.0%) | 2 (100.0%) |
Household Vehicle Usage in Gentry
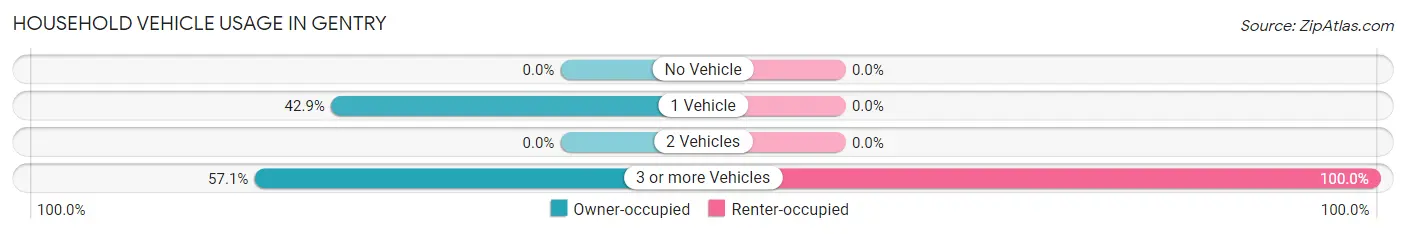
| Vehicles per Household | Owner-occupied | Renter-occupied |
| No Vehicle | 0 (0.0%) | 0 (0.0%) |
| 1 Vehicle | 9 (42.9%) | 0 (0.0%) |
| 2 Vehicles | 0 (0.0%) | 0 (0.0%) |
| 3 or more Vehicles | 12 (57.1%) | 2 (100.0%) |
| Total | 21 (100.0%) | 2 (100.0%) |
Real Estate & Mortgages in Gentry
Real Estate and Mortgage Overview in Gentry
| Characteristic | Without Mortgage | With Mortgage |
| Housing Units | 17 | 4 |
| Median Property Value | $21,900 | $0 |
| Median Household Income | $74,821 | $0 |
| Monthly Housing Costs | $361 | $0 |
| Real Estate Taxes | $335 | $0 |
Property Value by Mortgage Status in Gentry
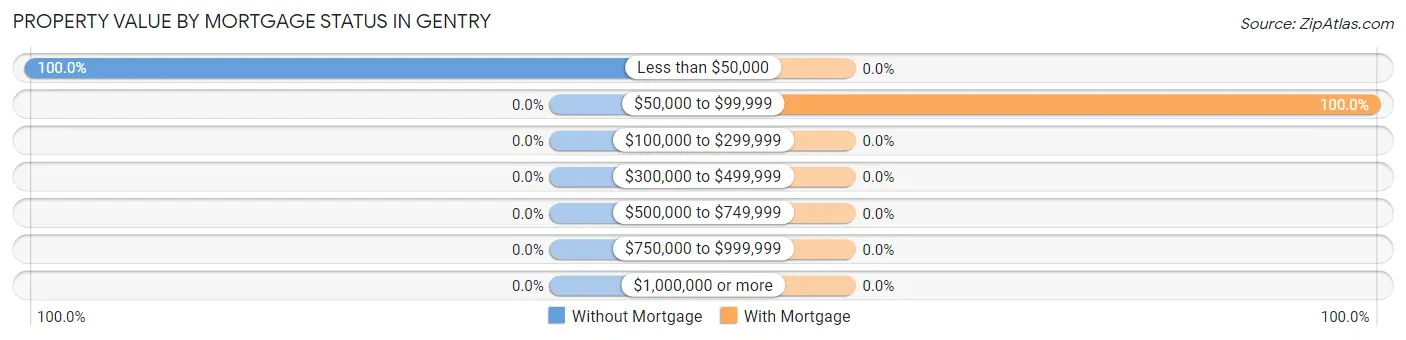
| Property Value | Without Mortgage | With Mortgage |
| Less than $50,000 | 17 (100.0%) | 0 (0.0%) |
| $50,000 to $99,999 | 0 (0.0%) | 4 (100.0%) |
| $100,000 to $299,999 | 0 (0.0%) | 0 (0.0%) |
| $300,000 to $499,999 | 0 (0.0%) | 0 (0.0%) |
| $500,000 to $749,999 | 0 (0.0%) | 0 (0.0%) |
| $750,000 to $999,999 | 0 (0.0%) | 0 (0.0%) |
| $1,000,000 or more | 0 (0.0%) | 0 (0.0%) |
| Total | 17 (100.0%) | 4 (100.0%) |
Household Income by Mortgage Status in Gentry
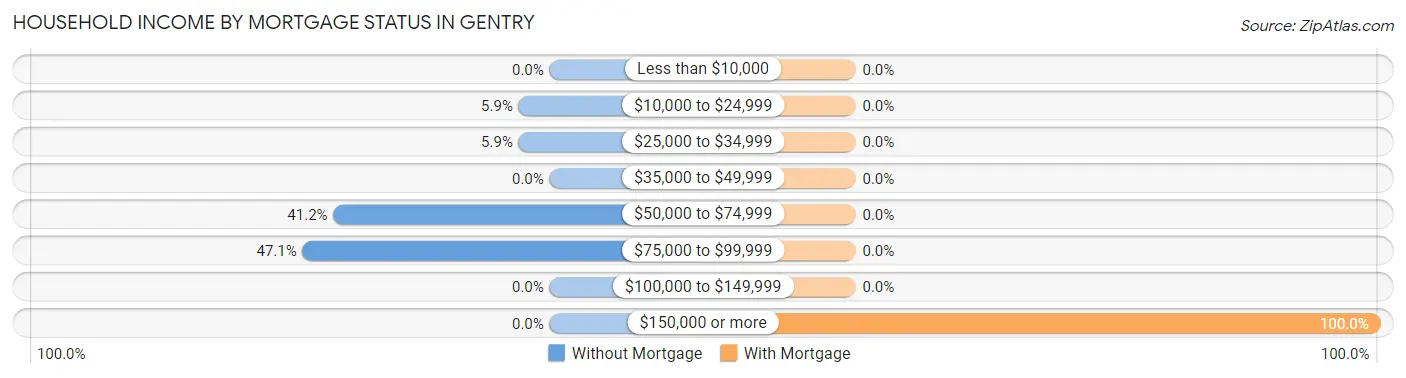
| Household Income | Without Mortgage | With Mortgage |
| Less than $10,000 | 0 (0.0%) | 0 (0.0%) |
| $10,000 to $24,999 | 1 (5.9%) | 0 (0.0%) |
| $25,000 to $34,999 | 1 (5.9%) | 0 (0.0%) |
| $35,000 to $49,999 | 0 (0.0%) | 0 (0.0%) |
| $50,000 to $74,999 | 7 (41.2%) | 0 (0.0%) |
| $75,000 to $99,999 | 8 (47.1%) | 0 (0.0%) |
| $100,000 to $149,999 | 0 (0.0%) | 0 (0.0%) |
| $150,000 or more | 0 (0.0%) | 4 (100.0%) |
| Total | 17 (100.0%) | 4 (100.0%) |
Property Value to Household Income Ratio in Gentry
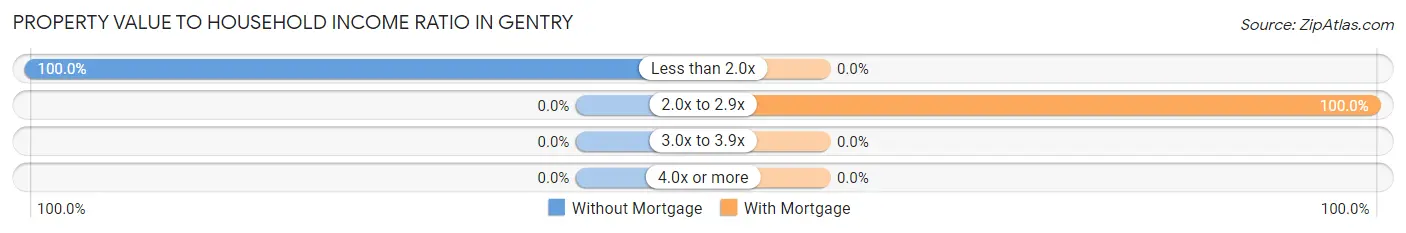
| Value-to-Income Ratio | Without Mortgage | With Mortgage |
| Less than 2.0x | 17 (100.0%) | 0 (0.0%) |
| 2.0x to 2.9x | 0 (0.0%) | 4 (100.0%) |
| 3.0x to 3.9x | 0 (0.0%) | 0 (0.0%) |
| 4.0x or more | 0 (0.0%) | 0 (0.0%) |
| Total | 17 (100.0%) | 4 (100.0%) |
Real Estate Taxes by Mortgage Status in Gentry
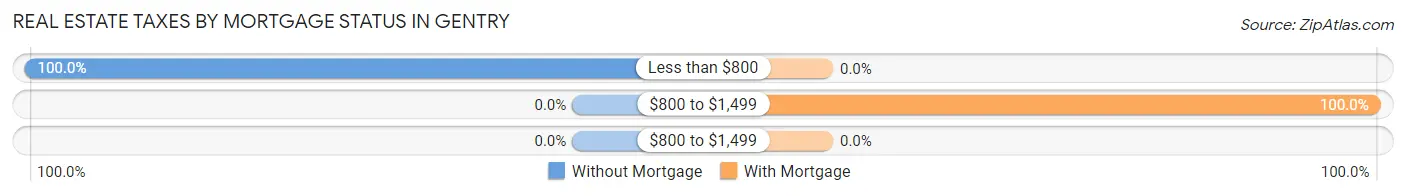
| Property Taxes | Without Mortgage | With Mortgage |
| Less than $800 | 17 (100.0%) | 0 (0.0%) |
| $800 to $1,499 | 0 (0.0%) | 4 (100.0%) |
| $800 to $1,499 | 0 (0.0%) | 0 (0.0%) |
| Total | 17 (100.0%) | 4 (100.0%) |
Health & Disability in Gentry
Health Insurance Coverage by Age in Gentry
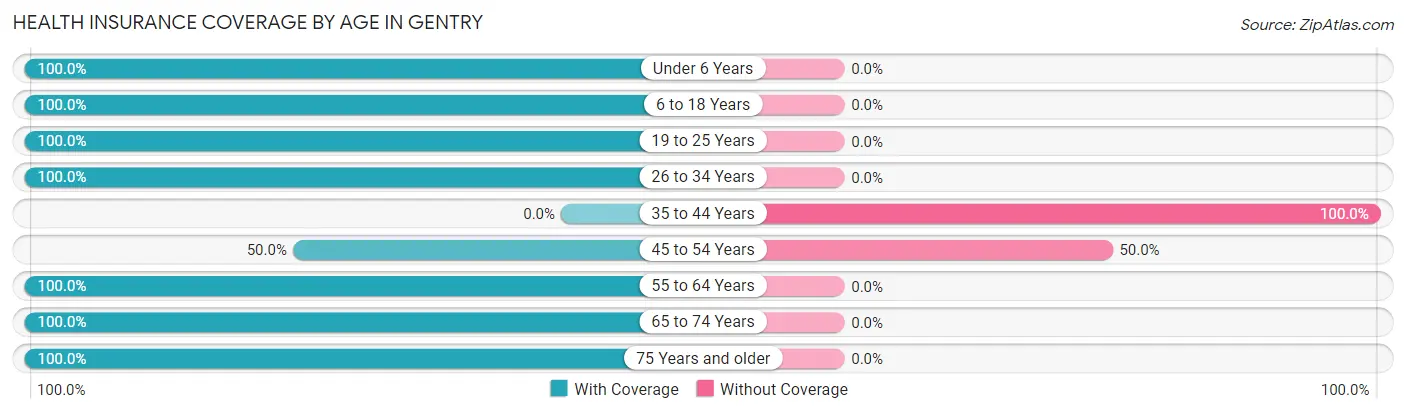
| Age Bracket | With Coverage | Without Coverage |
| Under 6 Years | 10 (100.0%) | 0 (0.0%) |
| 6 to 18 Years | 4 (100.0%) | 0 (0.0%) |
| 19 to 25 Years | 29 (100.0%) | 0 (0.0%) |
| 26 to 34 Years | 10 (100.0%) | 0 (0.0%) |
| 35 to 44 Years | 0 (0.0%) | 3 (100.0%) |
| 45 to 54 Years | 5 (50.0%) | 5 (50.0%) |
| 55 to 64 Years | 8 (100.0%) | 0 (0.0%) |
| 65 to 74 Years | 1 (100.0%) | 0 (0.0%) |
| 75 Years and older | 1 (100.0%) | 0 (0.0%) |
| Total | 68 (89.5%) | 8 (10.5%) |
Health Insurance Coverage by Citizenship Status in Gentry
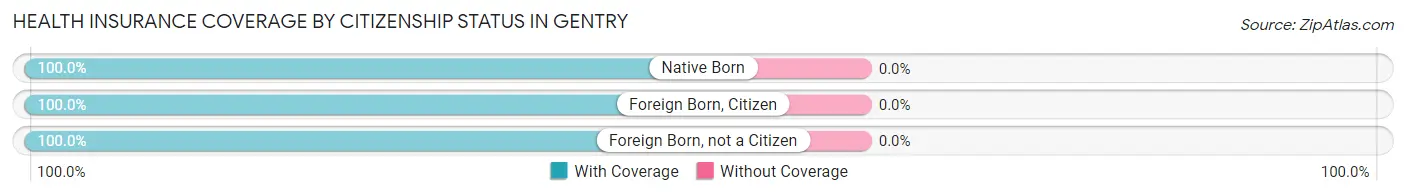
| Citizenship Status | With Coverage | Without Coverage |
| Native Born | 10 (100.0%) | 0 (0.0%) |
| Foreign Born, Citizen | 4 (100.0%) | 0 (0.0%) |
| Foreign Born, not a Citizen | 29 (100.0%) | 0 (0.0%) |
Health Insurance Coverage by Household Income in Gentry
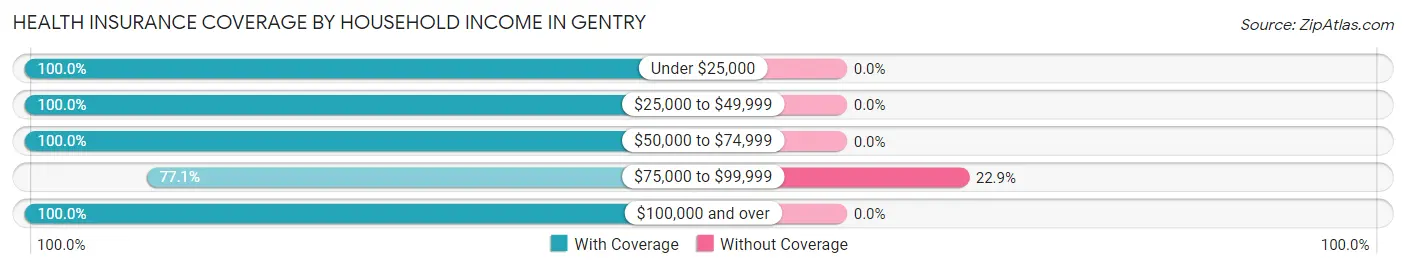
| Household Income | With Coverage | Without Coverage |
| Under $25,000 | 4 (100.0%) | 0 (0.0%) |
| $25,000 to $49,999 | 2 (100.0%) | 0 (0.0%) |
| $50,000 to $74,999 | 7 (100.0%) | 0 (0.0%) |
| $75,000 to $99,999 | 27 (77.1%) | 8 (22.9%) |
| $100,000 and over | 28 (100.0%) | 0 (0.0%) |
Public vs Private Health Insurance Coverage by Age in Gentry
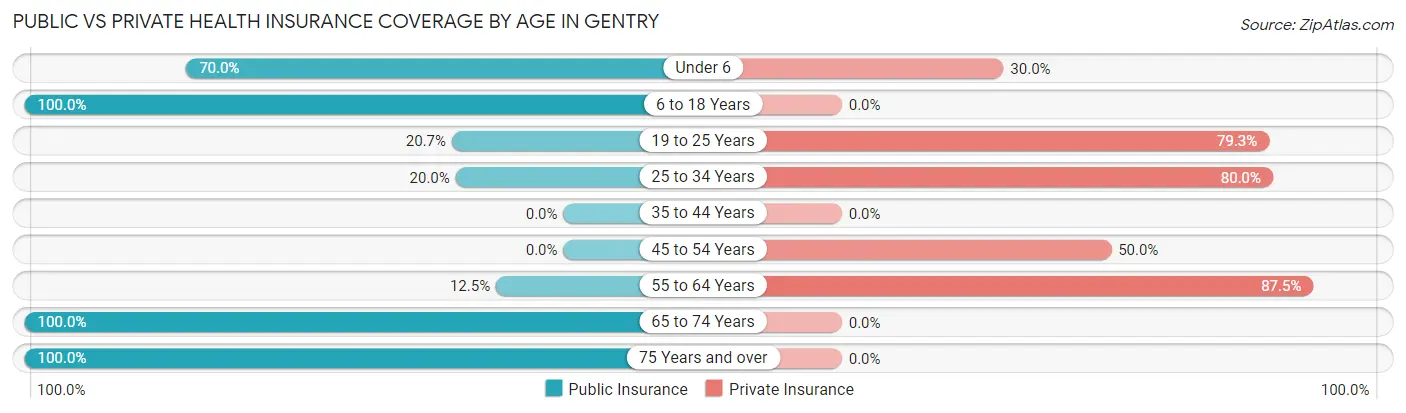
| Age Bracket | Public Insurance | Private Insurance |
| Under 6 | 7 (70.0%) | 3 (30.0%) |
| 6 to 18 Years | 4 (100.0%) | 0 (0.0%) |
| 19 to 25 Years | 6 (20.7%) | 23 (79.3%) |
| 25 to 34 Years | 2 (20.0%) | 8 (80.0%) |
| 35 to 44 Years | 0 (0.0%) | 0 (0.0%) |
| 45 to 54 Years | 0 (0.0%) | 5 (50.0%) |
| 55 to 64 Years | 1 (12.5%) | 7 (87.5%) |
| 65 to 74 Years | 1 (100.0%) | 0 (0.0%) |
| 75 Years and over | 1 (100.0%) | 0 (0.0%) |
| Total | 22 (28.9%) | 46 (60.5%) |
Disability Status by Sex by Age in Gentry
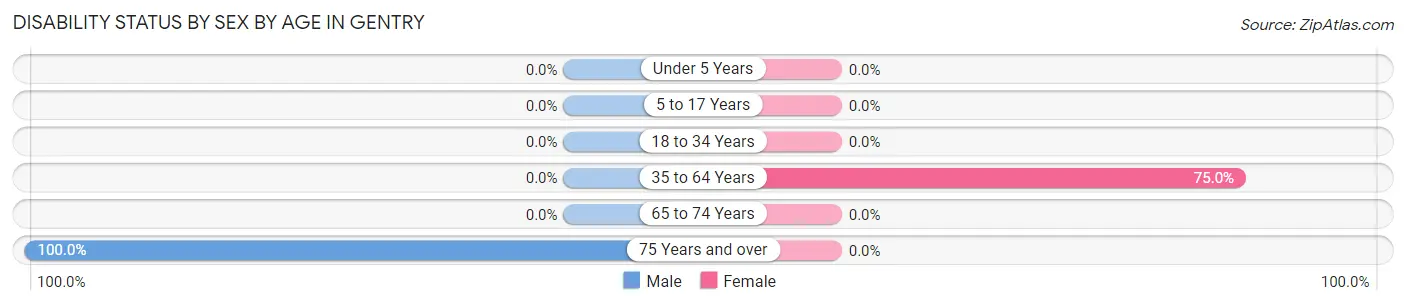
| Age Bracket | Male | Female |
| Under 5 Years | 0 (0.0%) | 0 (0.0%) |
| 5 to 17 Years | 0 (0.0%) | 0 (0.0%) |
| 18 to 34 Years | 0 (0.0%) | 0 (0.0%) |
| 35 to 64 Years | 0 (0.0%) | 3 (75.0%) |
| 65 to 74 Years | 0 (0.0%) | 0 (0.0%) |
| 75 Years and over | 1 (100.0%) | 0 (0.0%) |
Disability Class by Sex by Age in Gentry
Disability Class: Hearing Difficulty
| Age Bracket | Male | Female |
| Under 5 Years | 0 (0.0%) | 0 (0.0%) |
| 5 to 17 Years | 0 (0.0%) | 0 (0.0%) |
| 18 to 34 Years | 0 (0.0%) | 0 (0.0%) |
| 35 to 64 Years | 0 (0.0%) | 0 (0.0%) |
| 65 to 74 Years | 0 (0.0%) | 0 (0.0%) |
| 75 Years and over | 0 (0.0%) | 0 (0.0%) |
Disability Class: Vision Difficulty
| Age Bracket | Male | Female |
| Under 5 Years | 0 (0.0%) | 0 (0.0%) |
| 5 to 17 Years | 0 (0.0%) | 0 (0.0%) |
| 18 to 34 Years | 0 (0.0%) | 0 (0.0%) |
| 35 to 64 Years | 0 (0.0%) | 0 (0.0%) |
| 65 to 74 Years | 0 (0.0%) | 0 (0.0%) |
| 75 Years and over | 0 (0.0%) | 0 (0.0%) |
Disability Class: Cognitive Difficulty
| Age Bracket | Male | Female |
| 5 to 17 Years | 0 (0.0%) | 0 (0.0%) |
| 18 to 34 Years | 0 (0.0%) | 0 (0.0%) |
| 35 to 64 Years | 0 (0.0%) | 0 (0.0%) |
| 65 to 74 Years | 0 (0.0%) | 0 (0.0%) |
| 75 Years and over | 0 (0.0%) | 0 (0.0%) |
Disability Class: Ambulatory Difficulty
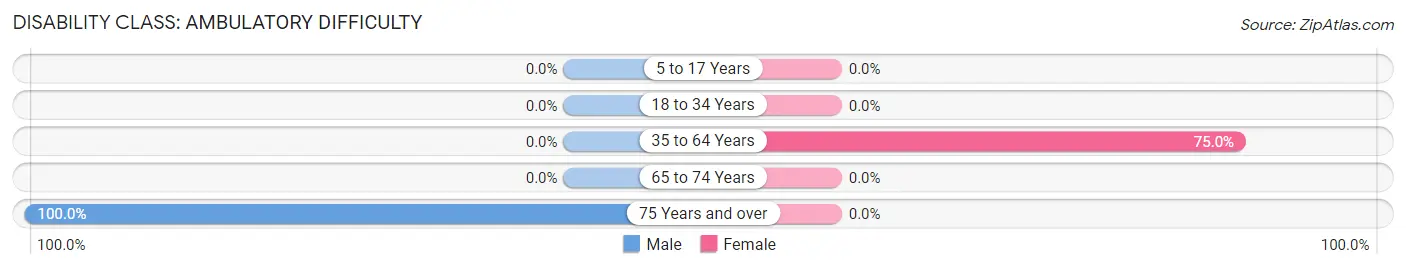
| Age Bracket | Male | Female |
| 5 to 17 Years | 0 (0.0%) | 0 (0.0%) |
| 18 to 34 Years | 0 (0.0%) | 0 (0.0%) |
| 35 to 64 Years | 0 (0.0%) | 3 (75.0%) |
| 65 to 74 Years | 0 (0.0%) | 0 (0.0%) |
| 75 Years and over | 1 (100.0%) | 0 (0.0%) |
Disability Class: Self-Care Difficulty
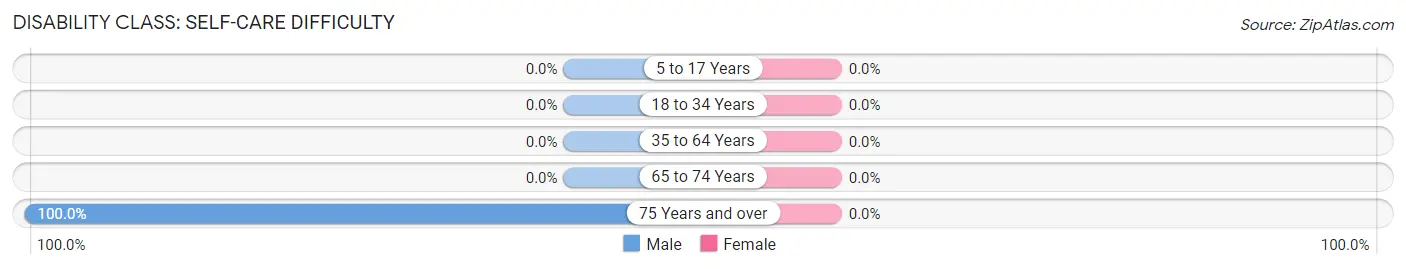
| Age Bracket | Male | Female |
| 5 to 17 Years | 0 (0.0%) | 0 (0.0%) |
| 18 to 34 Years | 0 (0.0%) | 0 (0.0%) |
| 35 to 64 Years | 0 (0.0%) | 0 (0.0%) |
| 65 to 74 Years | 0 (0.0%) | 0 (0.0%) |
| 75 Years and over | 1 (100.0%) | 0 (0.0%) |
Technology Access in Gentry
Computing Device Access in Gentry
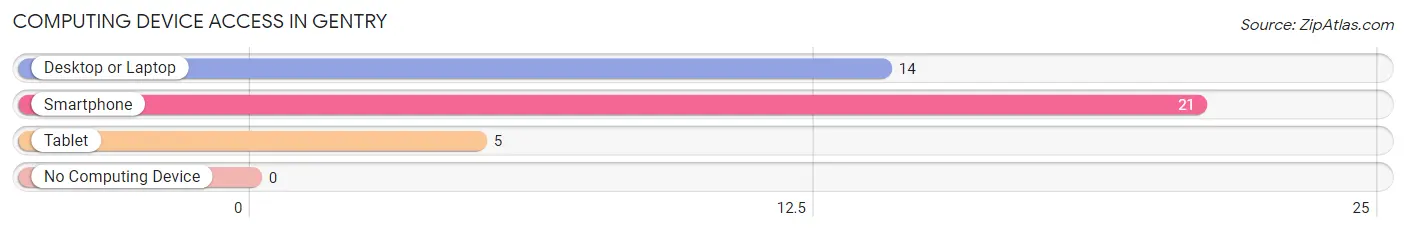
| Device Type | # Households | % Households |
| Desktop or Laptop | 14 | 60.9% |
| Smartphone | 21 | 91.3% |
| Tablet | 5 | 21.7% |
| No Computing Device | 0 | 0.0% |
| Total | 23 | 100.0% |
Internet Access in Gentry
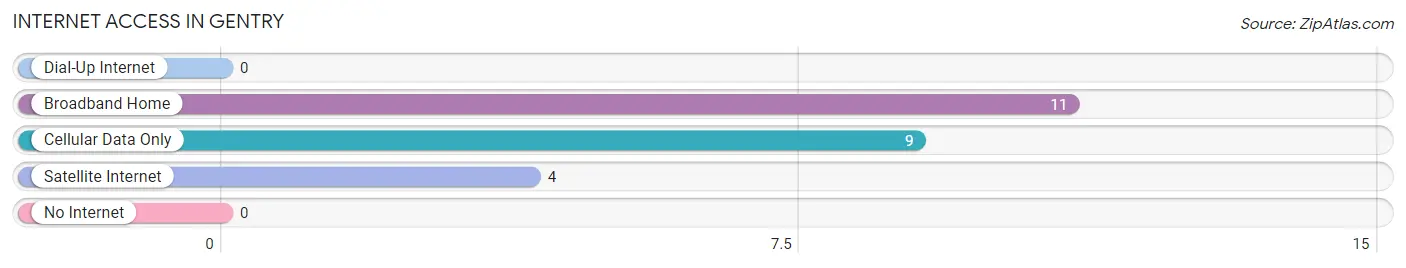
| Internet Type | # Households | % Households |
| Dial-Up Internet | 0 | 0.0% |
| Broadband Home | 11 | 47.8% |
| Cellular Data Only | 9 | 39.1% |
| Satellite Internet | 4 | 17.4% |
| No Internet | 0 | 0.0% |
| Total | 23 | 100.0% |
Gentry Summary
Gentry, Missouri is a small town located in the northwest corner of the state, near the Iowa border. It is part of the St. Joseph metropolitan area and is home to a population of just over 1,000 people. The town was founded in 1871 and has a rich history of farming, industry, and small-town life.
Geography
Gentry is located in the northwest corner of Missouri, near the Iowa border. It is part of the St. Joseph metropolitan area and is situated in Andrew County. The town is located on the banks of the Nodaway River, which flows through the town and provides a scenic backdrop. The town is surrounded by rolling hills and farmland, and is located about an hour and a half from Kansas City.
Economy
Gentry’s economy is largely based on agriculture and small businesses. The town is home to several small businesses, including a grocery store, a hardware store, and a few restaurants. The town also has a few manufacturing plants, including a plastics factory and a furniture factory. The town is also home to a few farms, which produce corn, soybeans, and other crops.
Demographics
Gentry’s population is just over 1,000 people, with a median age of 39. The town is predominantly white, with a small Hispanic population. The town has a median household income of $41,000, and the poverty rate is around 10%. The town is served by the Gentry School District, which includes an elementary school, a middle school, and a high school.
History
Gentry was founded in 1871 by a group of settlers from Iowa. The town was named after a local farmer, John Gentry, who donated the land for the town. The town quickly grew, and by the early 1900s, it had become a thriving agricultural center. The town was also home to several small businesses, including a grocery store, a hardware store, and a few restaurants.
In the mid-1900s, the town began to decline as the agricultural industry shifted away from small towns. The town’s population began to decline, and many of the businesses closed. In the late 1990s, the town began to experience a resurgence, as new businesses opened and the population began to grow again. Today, Gentry is a small but vibrant town, with a strong sense of community and a rich history.
Common Questions
What is Per Capita Income in Gentry?
Per Capita income in Gentry is $28,791.
What is the Median Family Income in Gentry?
Median Family Income in Gentry is $76,000.
What is the Median Household income in Gentry?
Median Household Income in Gentry is $75,893.
What is Income or Wage Gap in Gentry?
Income or Wage Gap in Gentry is 28.1%.
Women in Gentry earn 71.9 cents for every dollar earned by a man.
What is Inequality or Gini Index in Gentry?
Inequality or Gini Index in Gentry is 0.16.
What is the Total Population of Gentry?
Total Population of Gentry is 76.
What is the Total Male Population of Gentry?
Total Male Population of Gentry is 53.
What is the Total Female Population of Gentry?
Total Female Population of Gentry is 23.
What is the Ratio of Males per 100 Females in Gentry?
There are 230.43 Males per 100 Females in Gentry.
What is the Ratio of Females per 100 Males in Gentry?
There are 43.40 Females per 100 Males in Gentry.
What is the Median Population Age in Gentry?
Median Population Age in Gentry is 23.8 Years.
What is the Average Family Size in Gentry
Average Family Size in Gentry is 3.2 People.
What is the Average Household Size in Gentry
Average Household Size in Gentry is 3.3 People.
How Large is the Labor Force in Gentry?
There are 53 People in the Labor Forcein in Gentry.
What is the Percentage of People in the Labor Force in Gentry?
85.5% of People are in the Labor Force in Gentry.
What is the Unemployment Rate in Gentry?
Unemployment Rate in Gentry is 5.7%.