La Monte, MO Map & Demographics
La Monte Map
La Monte Overview
$24,967
PER CAPITA INCOME
$63,380
AVG FAMILY INCOME
$60,474
AVG HOUSEHOLD INCOME
38.3%
WAGE / INCOME GAP [ % ]
61.7¢/ $1
WAGE / INCOME GAP [ $ ]
0.46
INEQUALITY / GINI INDEX
1,029
TOTAL POPULATION
510
MALE POPULATION
519
FEMALE POPULATION
98.27
MALES / 100 FEMALES
101.76
FEMALES / 100 MALES
29.8
MEDIAN AGE
3.6
AVG FAMILY SIZE
3.0
AVG HOUSEHOLD SIZE
509
LABOR FORCE [ PEOPLE ]
64.0%
PERCENT IN LABOR FORCE
2.6%
UNEMPLOYMENT RATE
La Monte Zip Codes
La Monte Area Codes
Income in La Monte
Income Overview in La Monte
Per Capita Income in La Monte is $24,967, while median incomes of families and households are $63,380 and $60,474 respectively.
| Characteristic | Number | Measure |
| Per Capita Income | 1,029 | $24,967 |
| Median Family Income | 233 | $63,380 |
| Mean Family Income | 233 | $86,549 |
| Median Household Income | 347 | $60,474 |
| Mean Household Income | 347 | $73,299 |
| Income Deficit | 233 | $0 |
| Wage / Income Gap (%) | 1,029 | 38.28% |
| Wage / Income Gap ($) | 1,029 | 61.72¢ per $1 |
| Gini / Inequality Index | 1,029 | 0.46 |
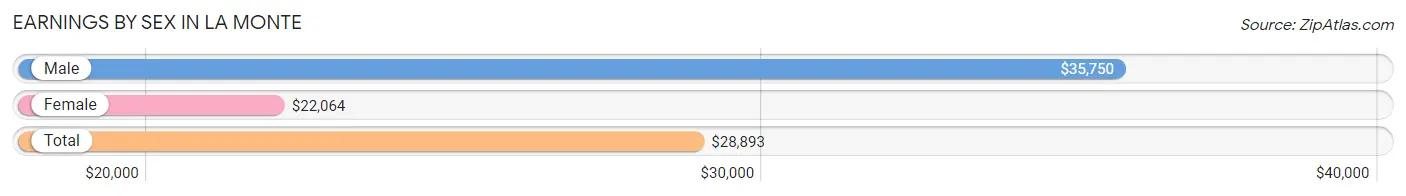
Earnings by Sex in La Monte
Average Earnings in La Monte are $28,893, $35,750 for men and $22,064 for women, a difference of 38.3%.
| Sex | Number | Average Earnings |
| Male | 294 (57.3%) | $35,750 |
| Female | 219 (42.7%) | $22,064 |
| Total | 513 (100.0%) | $28,893 |
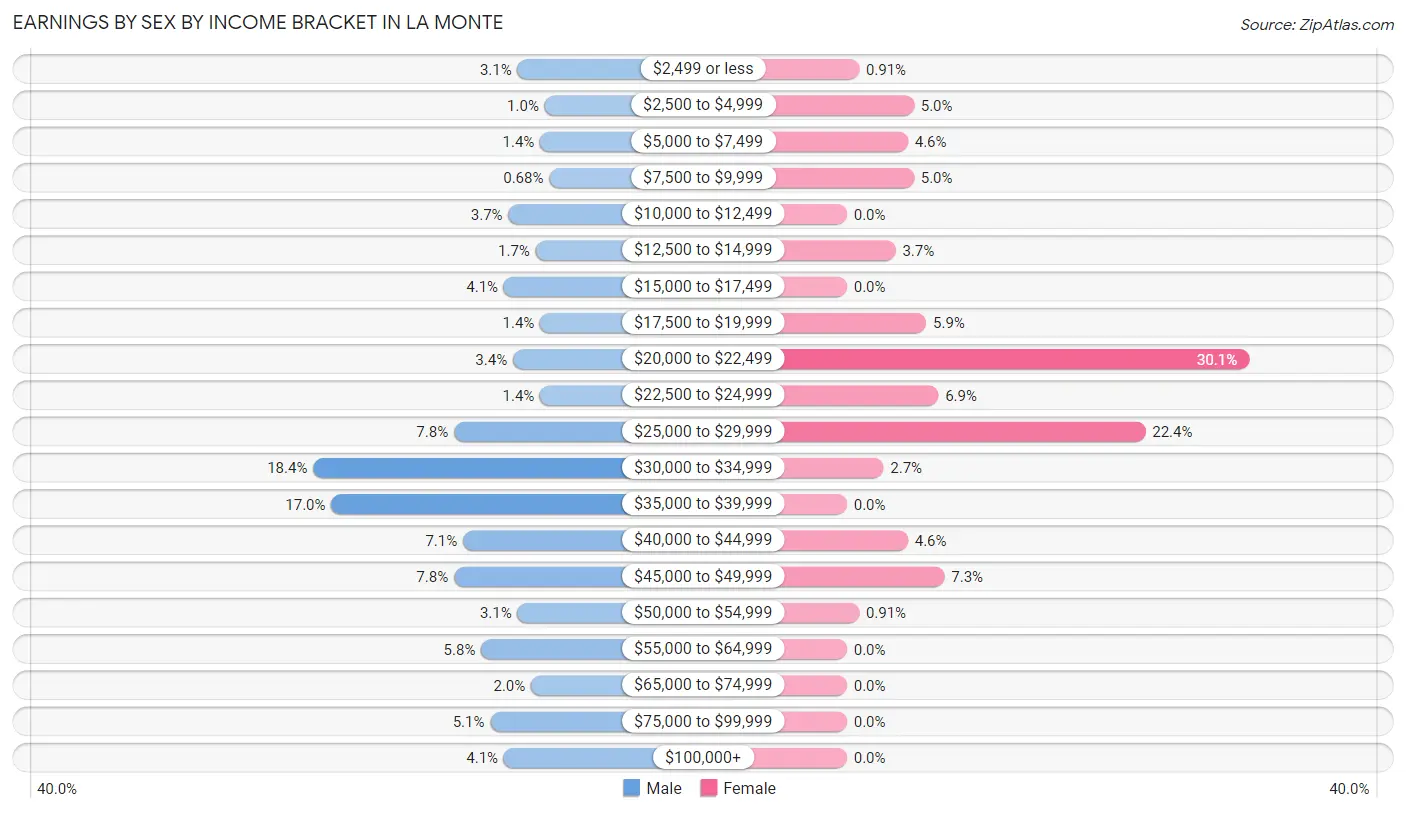
Earnings by Sex by Income Bracket in La Monte
The most common earnings brackets in La Monte are $30,000 to $34,999 for men (54 | 18.4%) and $20,000 to $22,499 for women (66 | 30.1%).
| Income | Male | Female |
| $2,499 or less | 9 (3.1%) | 2 (0.9%) |
| $2,500 to $4,999 | 3 (1.0%) | 11 (5.0%) |
| $5,000 to $7,499 | 4 (1.4%) | 10 (4.6%) |
| $7,500 to $9,999 | 2 (0.7%) | 11 (5.0%) |
| $10,000 to $12,499 | 11 (3.7%) | 0 (0.0%) |
| $12,500 to $14,999 | 5 (1.7%) | 8 (3.6%) |
| $15,000 to $17,499 | 12 (4.1%) | 0 (0.0%) |
| $17,500 to $19,999 | 4 (1.4%) | 13 (5.9%) |
| $20,000 to $22,499 | 10 (3.4%) | 66 (30.1%) |
| $22,500 to $24,999 | 4 (1.4%) | 15 (6.9%) |
| $25,000 to $29,999 | 23 (7.8%) | 49 (22.4%) |
| $30,000 to $34,999 | 54 (18.4%) | 6 (2.7%) |
| $35,000 to $39,999 | 50 (17.0%) | 0 (0.0%) |
| $40,000 to $44,999 | 21 (7.1%) | 10 (4.6%) |
| $45,000 to $49,999 | 23 (7.8%) | 16 (7.3%) |
| $50,000 to $54,999 | 9 (3.1%) | 2 (0.9%) |
| $55,000 to $64,999 | 17 (5.8%) | 0 (0.0%) |
| $65,000 to $74,999 | 6 (2.0%) | 0 (0.0%) |
| $75,000 to $99,999 | 15 (5.1%) | 0 (0.0%) |
| $100,000+ | 12 (4.1%) | 0 (0.0%) |
| Total | 294 (100.0%) | 219 (100.0%) |
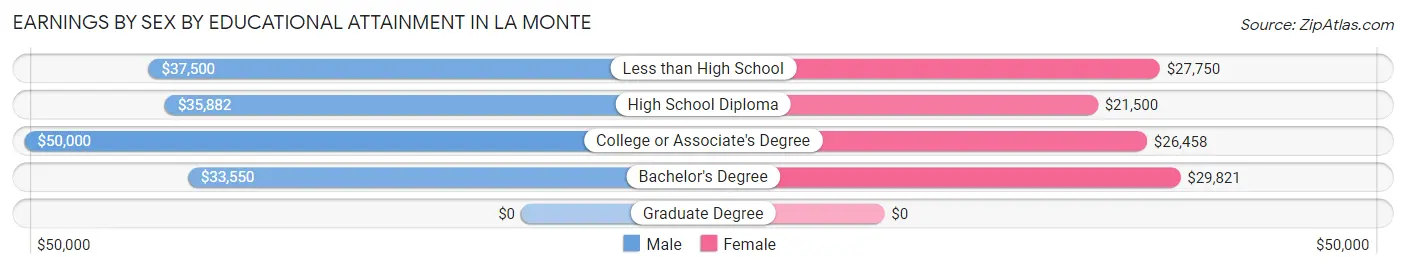
Earnings by Sex by Educational Attainment in La Monte
Average earnings in La Monte are $35,688 for men and $26,944 for women, a difference of 24.5%. Men with an educational attainment of college or associate's degree enjoy the highest average annual earnings of $50,000, while those with bachelor's degree education earn the least with $33,550. Women with an educational attainment of bachelor's degree earn the most with the average annual earnings of $29,821, while those with high school diploma education have the smallest earnings of $21,500.
| Educational Attainment | Male Income | Female Income |
| Less than High School | $37,500 | $27,750 |
| High School Diploma | $35,882 | $21,500 |
| College or Associate's Degree | $50,000 | $26,458 |
| Bachelor's Degree | $33,550 | $29,821 |
| Graduate Degree | - | - |
| Total | $35,688 | $26,944 |
Family Income in La Monte
Family Income Brackets in La Monte
According to the La Monte family income data, there are 85 families falling into the $50,000 to $74,999 income range, which is the most common income bracket and makes up 36.5% of all families. Conversely, the less than $10,000 income bracket is the least frequent group with only 7 families (3.0%) belonging to this category.
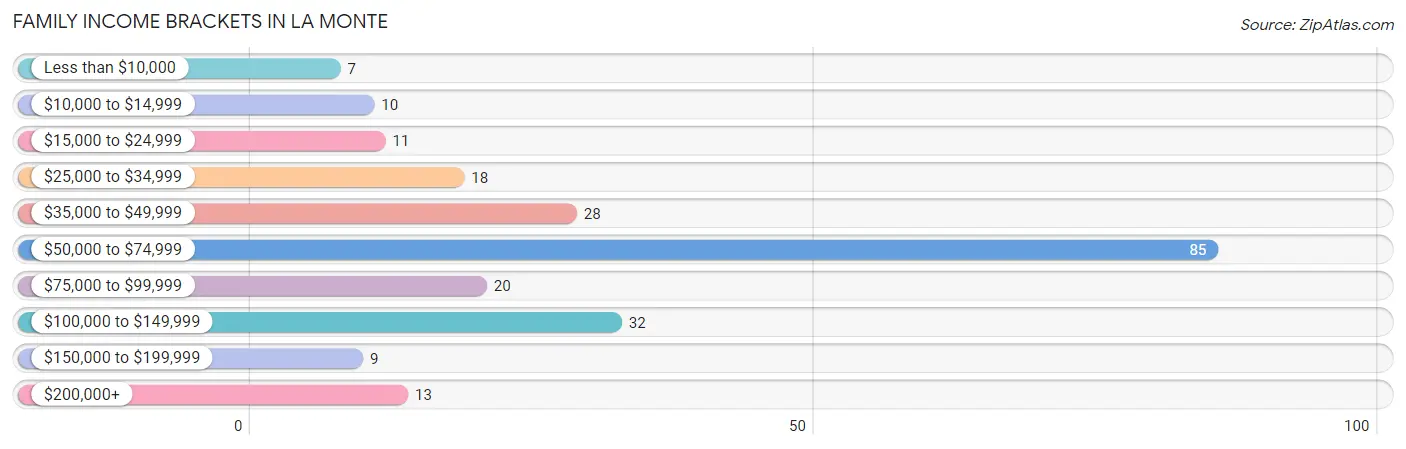
| Income Bracket | # Families | % Families |
| Less than $10,000 | 7 | 3.0% |
| $10,000 to $14,999 | 10 | 4.3% |
| $15,000 to $24,999 | 11 | 4.7% |
| $25,000 to $34,999 | 18 | 7.7% |
| $35,000 to $49,999 | 28 | 12.0% |
| $50,000 to $74,999 | 85 | 36.5% |
| $75,000 to $99,999 | 20 | 8.6% |
| $100,000 to $149,999 | 32 | 13.7% |
| $150,000 to $199,999 | 9 | 3.9% |
| $200,000+ | 13 | 5.6% |
Family Income by Famaliy Size in La Monte
3-person families (51 | 21.9%) account for the highest median family income in La Monte with $73,750 per family, while 2-person families (104 | 44.6%) have the highest median income of $31,806 per family member.
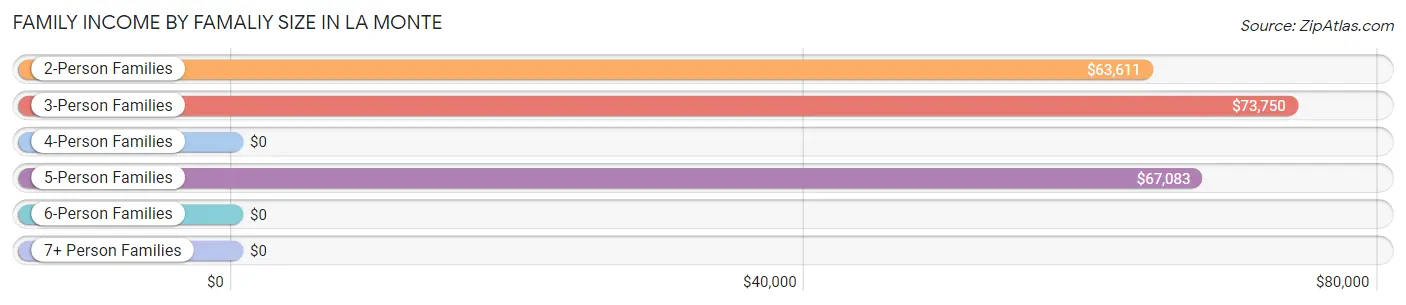
| Income Bracket | # Families | Median Income |
| 2-Person Families | 104 (44.6%) | $63,611 |
| 3-Person Families | 51 (21.9%) | $73,750 |
| 4-Person Families | 20 (8.6%) | $0 |
| 5-Person Families | 32 (13.7%) | $67,083 |
| 6-Person Families | 20 (8.6%) | $0 |
| 7+ Person Families | 6 (2.6%) | $0 |
| Total | 233 (100.0%) | $63,380 |
Family Income by Number of Earners in La Monte
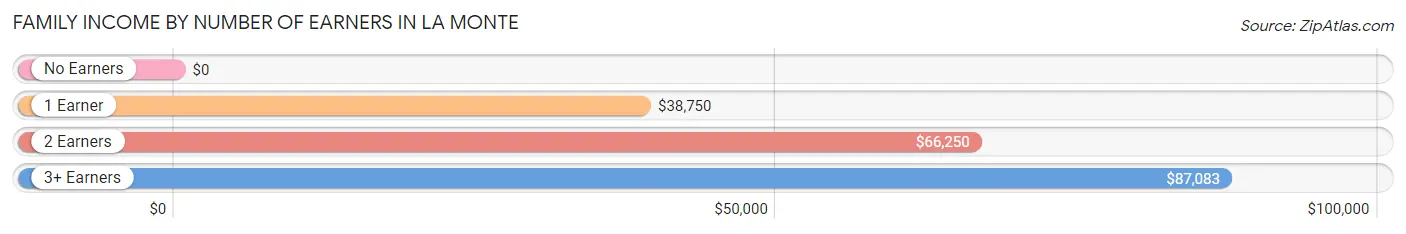
| Number of Earners | # Families | Median Income |
| No Earners | 39 (16.7%) | $0 |
| 1 Earner | 62 (26.6%) | $38,750 |
| 2 Earners | 75 (32.2%) | $66,250 |
| 3+ Earners | 57 (24.5%) | $87,083 |
| Total | 233 (100.0%) | $63,380 |
Household Income in La Monte
Household Income Brackets in La Monte
With 91 households falling in the category, the $50,000 to $74,999 income range is the most frequent in La Monte, accounting for 26.2% of all households. In contrast, only 13 households (3.7%) fall into the $150,000 to $199,999 income bracket, making it the least populous group.
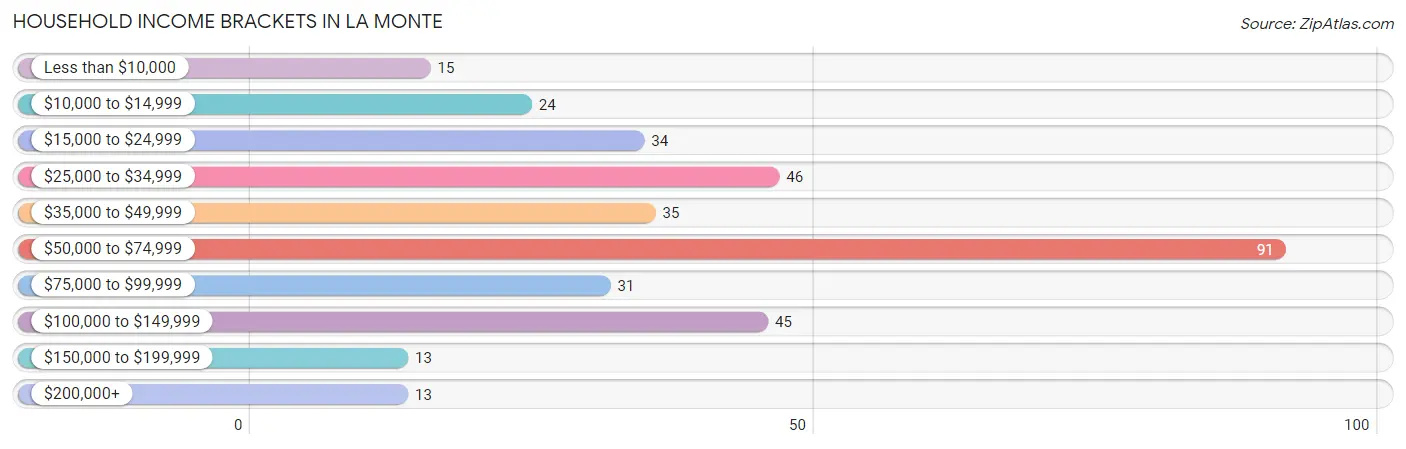
| Income Bracket | # Households | % Households |
| Less than $10,000 | 15 | 4.3% |
| $10,000 to $14,999 | 24 | 6.9% |
| $15,000 to $24,999 | 34 | 9.8% |
| $25,000 to $34,999 | 46 | 13.3% |
| $35,000 to $49,999 | 35 | 10.1% |
| $50,000 to $74,999 | 91 | 26.2% |
| $75,000 to $99,999 | 31 | 8.9% |
| $100,000 to $149,999 | 45 | 13.0% |
| $150,000 to $199,999 | 13 | 3.7% |
| $200,000+ | 13 | 3.7% |
Household Income by Householder Age in La Monte
The median household income in La Monte is $60,474, with the highest median household income of $85,833 found in the 45 to 64 years age bracket for the primary householder. A total of 144 households (41.5%) fall into this category. Meanwhile, the 25 to 44 years age bracket for the primary householder has the lowest median household income of $34,375, with 95 households (27.4%) in this group.
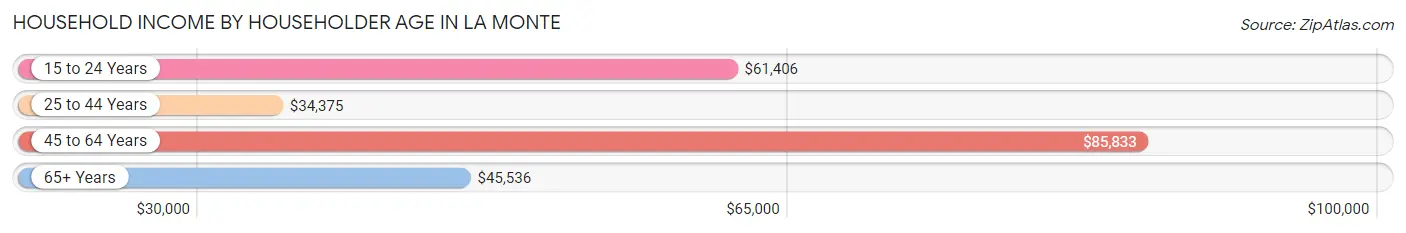
| Income Bracket | # Households | Median Income |
| 15 to 24 Years | 19 (5.5%) | $61,406 |
| 25 to 44 Years | 95 (27.4%) | $34,375 |
| 45 to 64 Years | 144 (41.5%) | $85,833 |
| 65+ Years | 89 (25.7%) | $45,536 |
| Total | 347 (100.0%) | $60,474 |
Poverty in La Monte
Income Below Poverty by Sex and Age in La Monte
With 21.8% poverty level for males and 27.9% for females among the residents of La Monte, under 5 year old males and 6 to 11 year old females are the most vulnerable to poverty, with 26 males (53.1%) and 21 females (72.4%) in their respective age groups living below the poverty level.
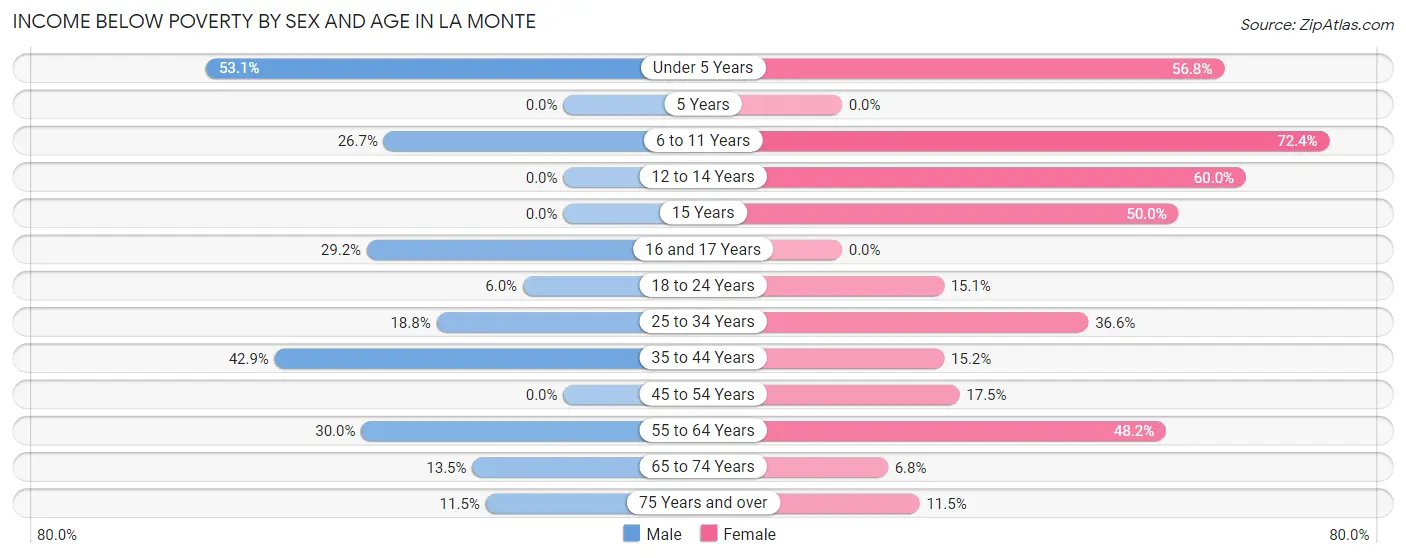
| Age Bracket | Male | Female |
| Under 5 Years | 26 (53.1%) | 42 (56.8%) |
| 5 Years | 0 (0.0%) | 0 (0.0%) |
| 6 to 11 Years | 16 (26.7%) | 21 (72.4%) |
| 12 to 14 Years | 0 (0.0%) | 3 (60.0%) |
| 15 Years | 0 (0.0%) | 4 (50.0%) |
| 16 and 17 Years | 14 (29.2%) | 0 (0.0%) |
| 18 to 24 Years | 3 (6.0%) | 18 (15.1%) |
| 25 to 34 Years | 13 (18.8%) | 15 (36.6%) |
| 35 to 44 Years | 18 (42.9%) | 12 (15.2%) |
| 45 to 54 Years | 0 (0.0%) | 11 (17.5%) |
| 55 to 64 Years | 12 (30.0%) | 13 (48.1%) |
| 65 to 74 Years | 5 (13.5%) | 3 (6.8%) |
| 75 Years and over | 3 (11.5%) | 3 (11.5%) |
| Total | 110 (21.8%) | 145 (27.9%) |
Income Above Poverty by Sex and Age in La Monte
According to the poverty statistics in La Monte, males aged 5 years and females aged 16 and 17 years are the age groups that are most secure financially, with 100.0% of males and 100.0% of females in these age groups living above the poverty line.
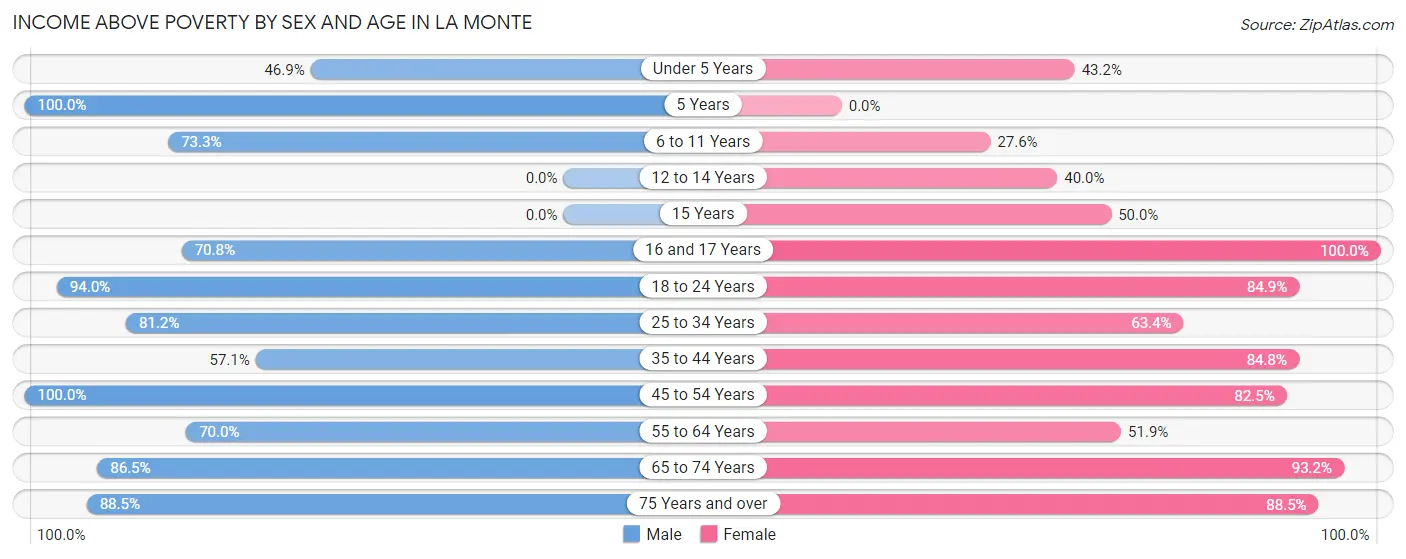
| Age Bracket | Male | Female |
| Under 5 Years | 23 (46.9%) | 32 (43.2%) |
| 5 Years | 4 (100.0%) | 0 (0.0%) |
| 6 to 11 Years | 44 (73.3%) | 8 (27.6%) |
| 12 to 14 Years | 0 (0.0%) | 2 (40.0%) |
| 15 Years | 0 (0.0%) | 4 (50.0%) |
| 16 and 17 Years | 34 (70.8%) | 4 (100.0%) |
| 18 to 24 Years | 47 (94.0%) | 101 (84.9%) |
| 25 to 34 Years | 56 (81.2%) | 26 (63.4%) |
| 35 to 44 Years | 24 (57.1%) | 67 (84.8%) |
| 45 to 54 Years | 80 (100.0%) | 52 (82.5%) |
| 55 to 64 Years | 28 (70.0%) | 14 (51.8%) |
| 65 to 74 Years | 32 (86.5%) | 41 (93.2%) |
| 75 Years and over | 23 (88.5%) | 23 (88.5%) |
| Total | 395 (78.2%) | 374 (72.1%) |
Income Below Poverty Among Married-Couple Families in La Monte
The poverty statistics for married-couple families in La Monte show that 16.1% or 27 of the total 168 families live below the poverty line. Families with 3 or 4 children have the highest poverty rate of 68.4%, comprising of 13 families. On the other hand, families with no children have the lowest poverty rate of 5.4%, which includes 4 families.
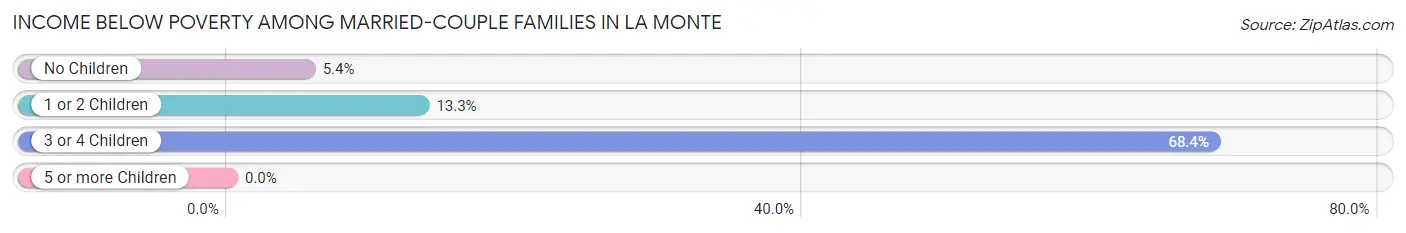
| Children | Above Poverty | Below Poverty |
| No Children | 70 (94.6%) | 4 (5.4%) |
| 1 or 2 Children | 65 (86.7%) | 10 (13.3%) |
| 3 or 4 Children | 6 (31.6%) | 13 (68.4%) |
| 5 or more Children | 0 (0.0%) | 0 (0.0%) |
| Total | 141 (83.9%) | 27 (16.1%) |
Income Below Poverty Among Single-Parent Households in La Monte
According to the poverty data in La Monte, 10.8% or 4 single-father households and 14.3% or 4 single-mother households are living below the poverty line. Among single-father households, those with 1 or 2 children have the highest poverty rate, with 4 households (33.3%) experiencing poverty. Likewise, among single-mother households, those with 3 or 4 children have the highest poverty rate, with 4 households (100.0%) falling below the poverty line.
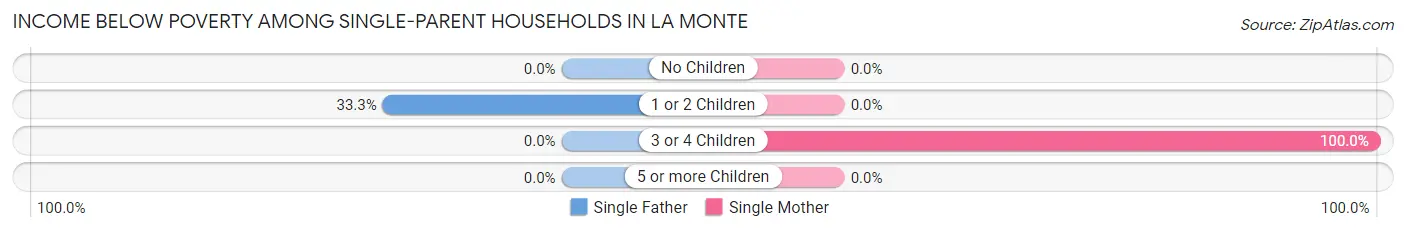
| Children | Single Father | Single Mother |
| No Children | 0 (0.0%) | 0 (0.0%) |
| 1 or 2 Children | 4 (33.3%) | 0 (0.0%) |
| 3 or 4 Children | 0 (0.0%) | 4 (100.0%) |
| 5 or more Children | 0 (0.0%) | 0 (0.0%) |
| Total | 4 (10.8%) | 4 (14.3%) |
Income Below Poverty Among Married-Couple vs Single-Parent Households in La Monte
The poverty data for La Monte shows that 27 of the married-couple family households (16.1%) and 8 of the single-parent households (12.3%) are living below the poverty level. Within the married-couple family households, those with 3 or 4 children have the highest poverty rate, with 13 households (68.4%) falling below the poverty line. Among the single-parent households, those with 3 or 4 children have the highest poverty rate, with 4 household (100.0%) living below poverty.
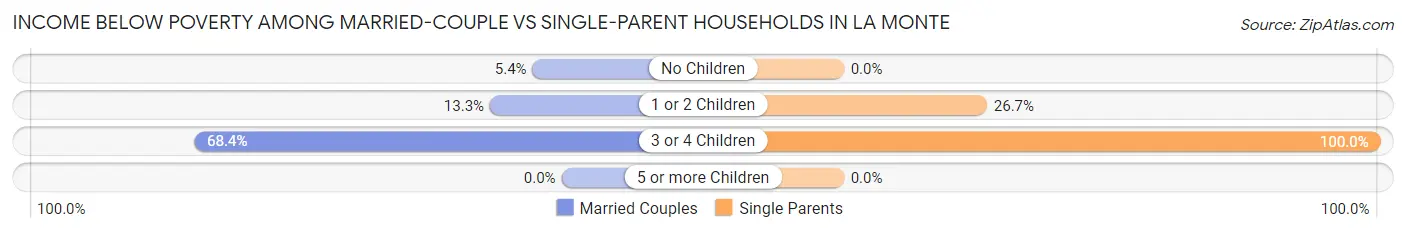
| Children | Married-Couple Families | Single-Parent Households |
| No Children | 4 (5.4%) | 0 (0.0%) |
| 1 or 2 Children | 10 (13.3%) | 4 (26.7%) |
| 3 or 4 Children | 13 (68.4%) | 4 (100.0%) |
| 5 or more Children | 0 (0.0%) | 0 (0.0%) |
| Total | 27 (16.1%) | 8 (12.3%) |
Race in La Monte
The most populous races in La Monte are White / Caucasian (574 | 55.8%), Hispanic or Latino (543 | 52.8%), and Some other Race (389 | 37.8%).
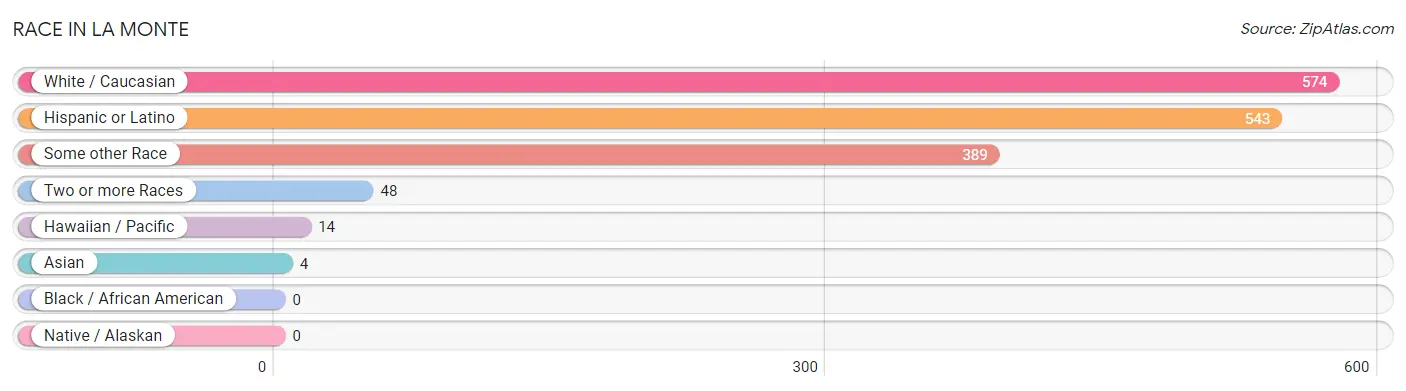
| Race | # Population | % Population |
| Asian | 4 | 0.4% |
| Black / African American | 0 | 0.0% |
| Hawaiian / Pacific | 14 | 1.4% |
| Hispanic or Latino | 543 | 52.8% |
| Native / Alaskan | 0 | 0.0% |
| White / Caucasian | 574 | 55.8% |
| Two or more Races | 48 | 4.7% |
| Some other Race | 389 | 37.8% |
| Total | 1,029 | 100.0% |
Ancestry in La Monte
The most populous ancestries reported in La Monte are Mexican (536 | 52.1%), German (63 | 6.1%), English (57 | 5.5%), Irish (38 | 3.7%), and American (21 | 2.0%), together accounting for 69.5% of all La Monte residents.
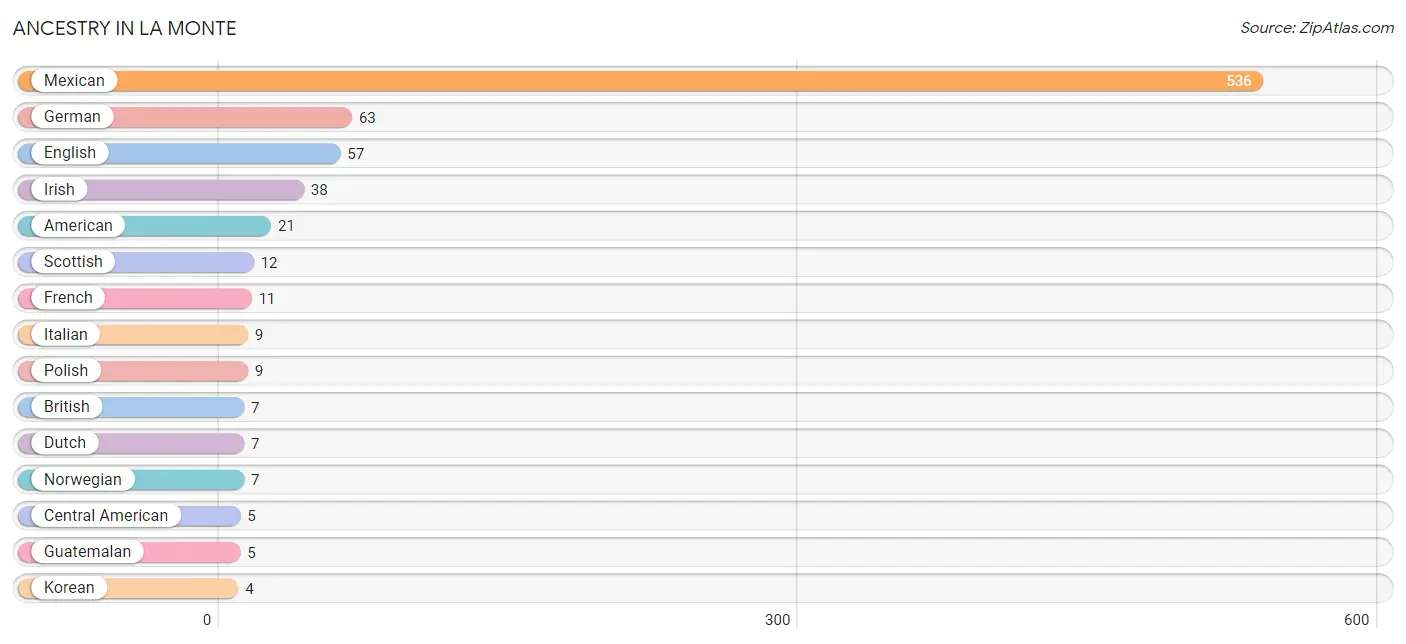
| Ancestry | # Population | % Population |
| American | 21 | 2.0% |
| British | 7 | 0.7% |
| Central American | 5 | 0.5% |
| Dutch | 7 | 0.7% |
| English | 57 | 5.5% |
| European | 3 | 0.3% |
| French | 11 | 1.1% |
| German | 63 | 6.1% |
| Guatemalan | 5 | 0.5% |
| Irish | 38 | 3.7% |
| Italian | 9 | 0.9% |
| Korean | 4 | 0.4% |
| Mexican | 536 | 52.1% |
| Norwegian | 7 | 0.7% |
| Polish | 9 | 0.9% |
| Scotch-Irish | 3 | 0.3% |
| Scottish | 12 | 1.2% |
| Spanish | 2 | 0.2% | View All 18 Rows |
Immigrants in La Monte
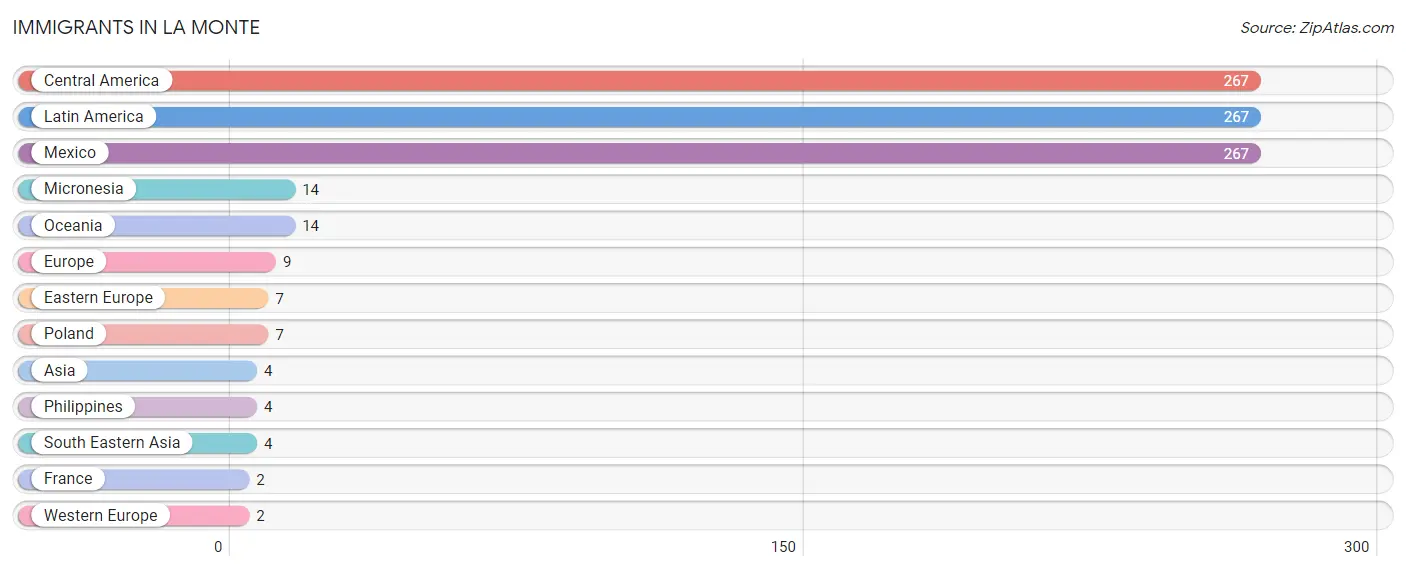
The most numerous immigrant groups reported in La Monte came from Central America (267 | 26.0%), Latin America (267 | 26.0%), Mexico (267 | 26.0%), Micronesia (14 | 1.4%), and Oceania (14 | 1.4%), together accounting for 80.6% of all La Monte residents.
| Immigration Origin | # Population | % Population |
| Asia | 4 | 0.4% |
| Central America | 267 | 26.0% |
| Eastern Europe | 7 | 0.7% |
| Europe | 9 | 0.9% |
| France | 2 | 0.2% |
| Latin America | 267 | 26.0% |
| Mexico | 267 | 26.0% |
| Micronesia | 14 | 1.4% |
| Oceania | 14 | 1.4% |
| Philippines | 4 | 0.4% |
| Poland | 7 | 0.7% |
| South Eastern Asia | 4 | 0.4% |
| Western Europe | 2 | 0.2% | View All 13 Rows |
Sex and Age in La Monte
Sex and Age in La Monte
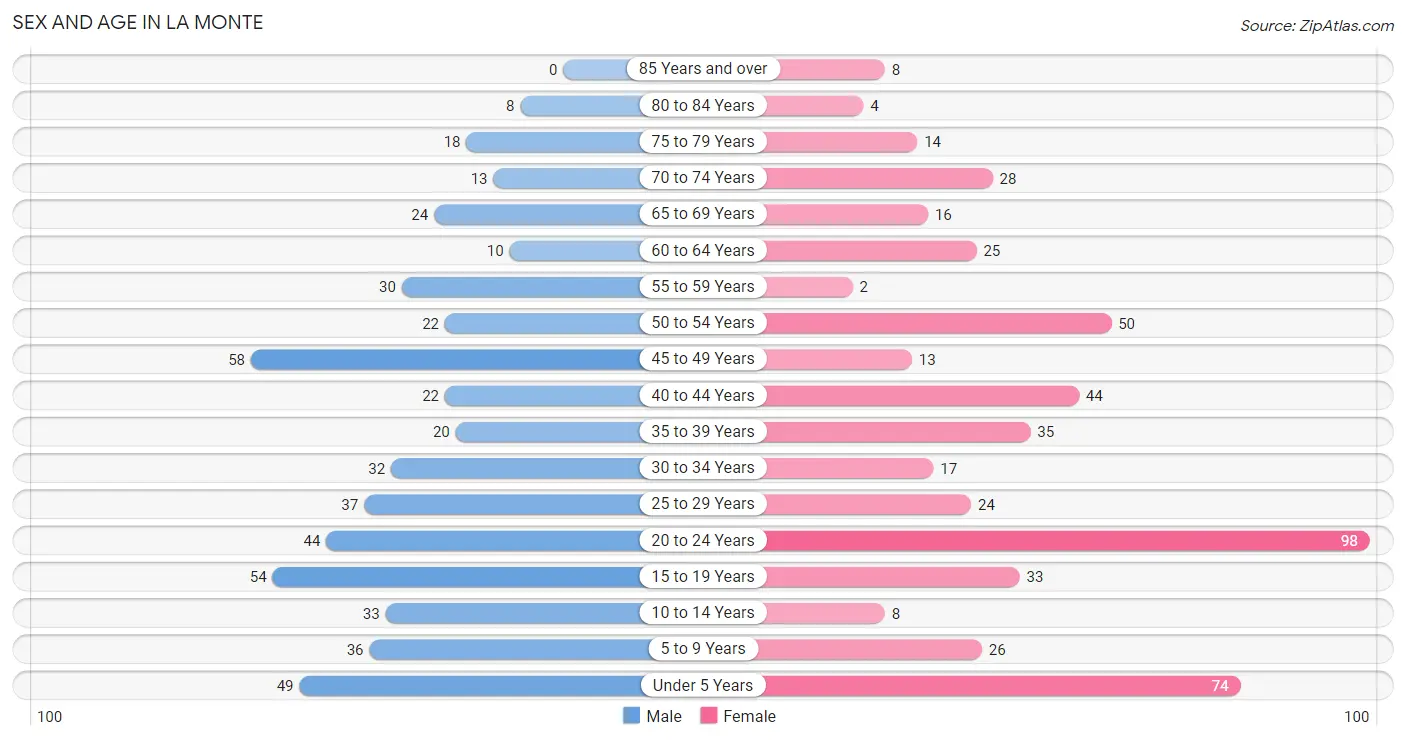
The most populous age groups in La Monte are 45 to 49 Years (58 | 11.4%) for men and 20 to 24 Years (98 | 18.9%) for women.
| Age Bracket | Male | Female |
| Under 5 Years | 49 (9.6%) | 74 (14.3%) |
| 5 to 9 Years | 36 (7.1%) | 26 (5.0%) |
| 10 to 14 Years | 33 (6.5%) | 8 (1.5%) |
| 15 to 19 Years | 54 (10.6%) | 33 (6.4%) |
| 20 to 24 Years | 44 (8.6%) | 98 (18.9%) |
| 25 to 29 Years | 37 (7.2%) | 24 (4.6%) |
| 30 to 34 Years | 32 (6.3%) | 17 (3.3%) |
| 35 to 39 Years | 20 (3.9%) | 35 (6.7%) |
| 40 to 44 Years | 22 (4.3%) | 44 (8.5%) |
| 45 to 49 Years | 58 (11.4%) | 13 (2.5%) |
| 50 to 54 Years | 22 (4.3%) | 50 (9.6%) |
| 55 to 59 Years | 30 (5.9%) | 2 (0.4%) |
| 60 to 64 Years | 10 (2.0%) | 25 (4.8%) |
| 65 to 69 Years | 24 (4.7%) | 16 (3.1%) |
| 70 to 74 Years | 13 (2.5%) | 28 (5.4%) |
| 75 to 79 Years | 18 (3.5%) | 14 (2.7%) |
| 80 to 84 Years | 8 (1.6%) | 4 (0.8%) |
| 85 Years and over | 0 (0.0%) | 8 (1.5%) |
| Total | 510 (100.0%) | 519 (100.0%) |
Families and Households in La Monte
Median Family Size in La Monte
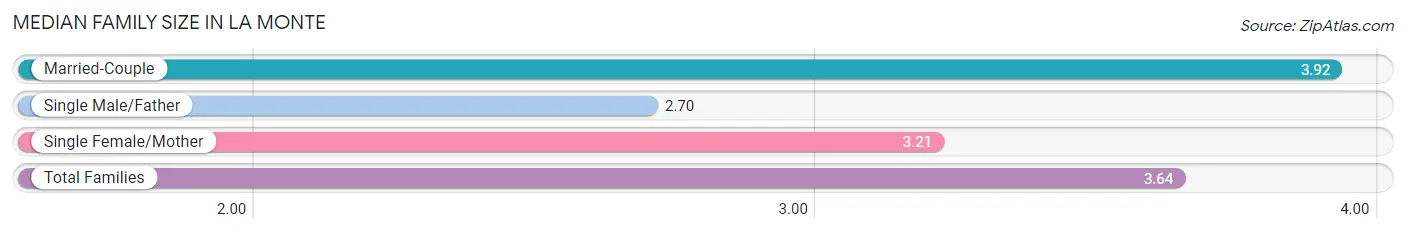
The median family size in La Monte is 3.64 persons per family, with married-couple families (168 | 72.1%) accounting for the largest median family size of 3.92 persons per family. On the other hand, single male/father families (37 | 15.9%) represent the smallest median family size with 2.70 persons per family.
| Family Type | # Families | Family Size |
| Married-Couple | 168 (72.1%) | 3.92 |
| Single Male/Father | 37 (15.9%) | 2.70 |
| Single Female/Mother | 28 (12.0%) | 3.21 |
| Total Families | 233 (100.0%) | 3.64 |
Median Household Size in La Monte
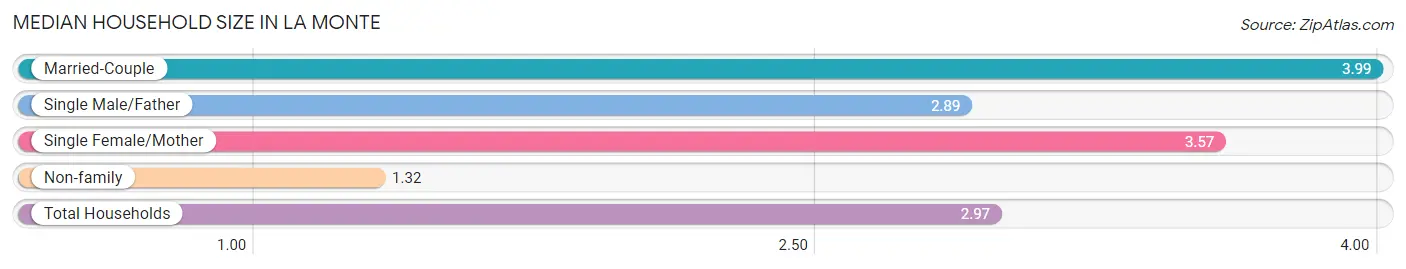
The median household size in La Monte is 2.97 persons per household, with married-couple households (168 | 48.4%) accounting for the largest median household size of 3.99 persons per household. non-family households (114 | 32.9%) represent the smallest median household size with 1.32 persons per household.
| Household Type | # Households | Household Size |
| Married-Couple | 168 (48.4%) | 3.99 |
| Single Male/Father | 37 (10.7%) | 2.89 |
| Single Female/Mother | 28 (8.1%) | 3.57 |
| Non-family | 114 (32.9%) | 1.32 |
| Total Households | 347 (100.0%) | 2.97 |
Household Size by Marriage Status in La Monte
Out of a total of 347 households in La Monte, 233 (67.1%) are family households, while 114 (32.9%) are nonfamily households. The most numerous type of family households are 2-person households, comprising 99, and the most common type of nonfamily households are 1-person households, comprising 85.
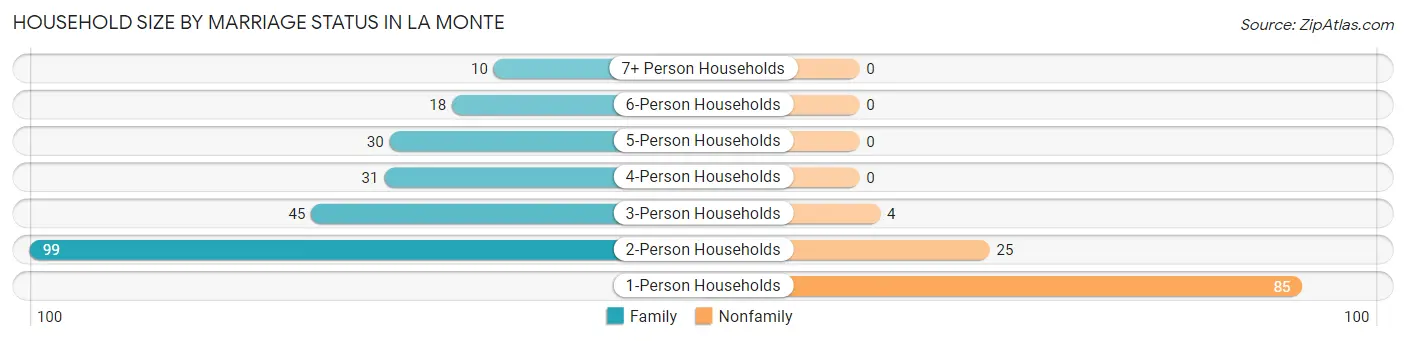
| Household Size | Family Households | Nonfamily Households |
| 1-Person Households | - | 85 (24.5%) |
| 2-Person Households | 99 (28.5%) | 25 (7.2%) |
| 3-Person Households | 45 (13.0%) | 4 (1.1%) |
| 4-Person Households | 31 (8.9%) | 0 (0.0%) |
| 5-Person Households | 30 (8.6%) | 0 (0.0%) |
| 6-Person Households | 18 (5.2%) | 0 (0.0%) |
| 7+ Person Households | 10 (2.9%) | 0 (0.0%) |
| Total | 233 (67.1%) | 114 (32.9%) |
Female Fertility in La Monte
Fertility by Age in La Monte
Average fertility rate in La Monte is 60.0 births per 1,000 women. Women in the age bracket of 20 to 34 years have the highest fertility rate with 94.0 births per 1,000 women. Women in the age bracket of 20 to 34 years acount for 81.2% of all women with births.
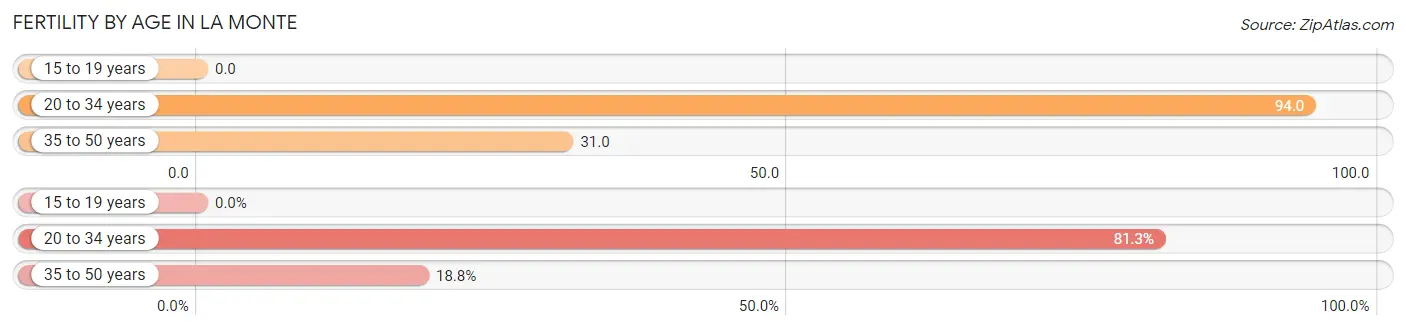
| Age Bracket | Women with Births | Births / 1,000 Women |
| 15 to 19 years | 0 (0.0%) | 0.0 |
| 20 to 34 years | 13 (81.2%) | 94.0 |
| 35 to 50 years | 3 (18.8%) | 31.0 |
| Total | 16 (100.0%) | 60.0 |
Fertility by Age by Marriage Status in La Monte
68.8% of women with births (16) in La Monte are married. The highest percentage of unmarried women with births falls into 20 to 34 years age bracket with 38.5% of them unmarried at the time of birth, while the lowest percentage of unmarried women with births belong to 35 to 50 years age bracket with 0.0% of them unmarried.
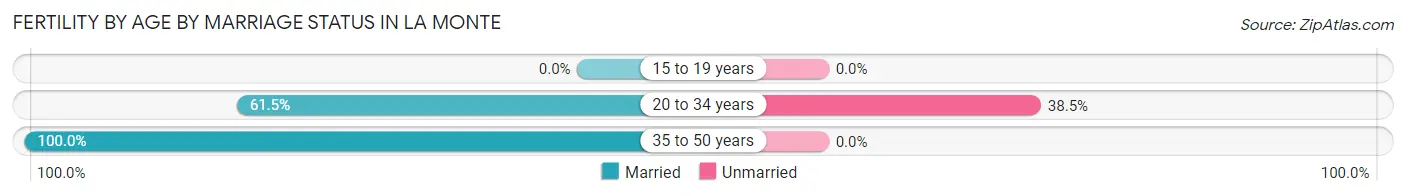
| Age Bracket | Married | Unmarried |
| 15 to 19 years | 0 (0.0%) | 0 (0.0%) |
| 20 to 34 years | 8 (61.5%) | 5 (38.5%) |
| 35 to 50 years | 3 (100.0%) | 0 (0.0%) |
| Total | 11 (68.8%) | 5 (31.2%) |
Fertility by Education in La Monte
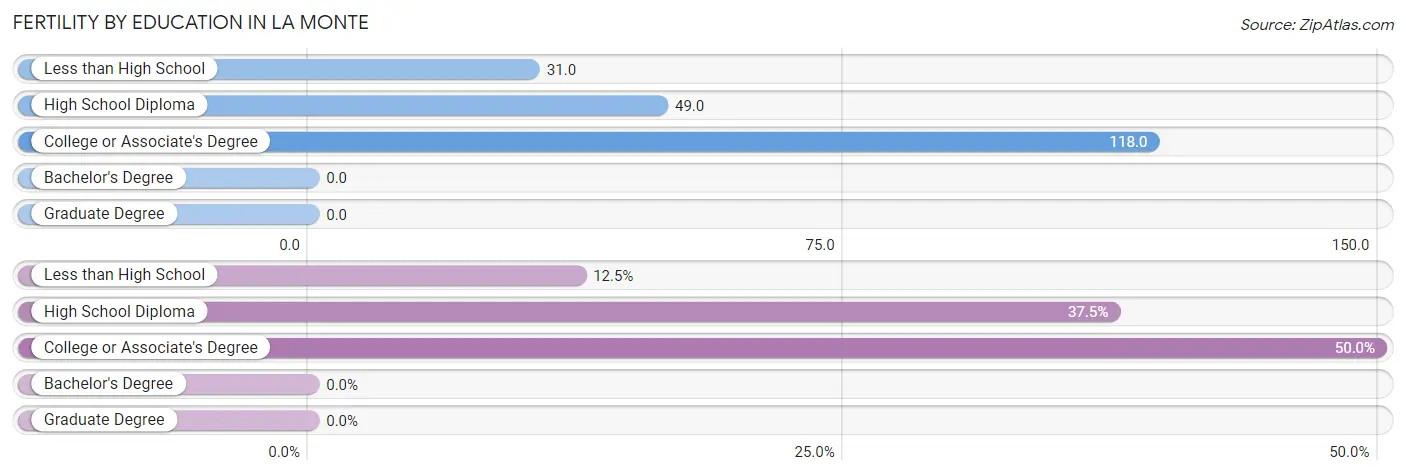
| Educational Attainment | Women with Births | Births / 1,000 Women |
| Less than High School | 2 (12.5%) | 31.0 |
| High School Diploma | 6 (37.5%) | 49.0 |
| College or Associate's Degree | 8 (50.0%) | 118.0 |
| Bachelor's Degree | 0 (0.0%) | 0.0 |
| Graduate Degree | 0 (0.0%) | 0.0 |
| Total | 16 (100.0%) | 60.0 |
Fertility by Education by Marriage Status in La Monte
31.2% of women with births in La Monte are unmarried. Women with the educational attainment of college or associate's degree are most likely to be married with 100.0% of them married at childbirth, while women with the educational attainment of less than high school are least likely to be married with 100.0% of them unmarried at childbirth.
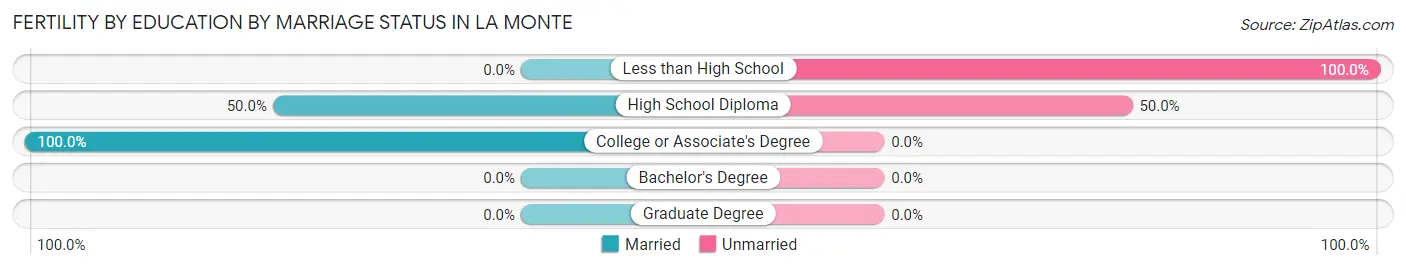
| Educational Attainment | Married | Unmarried |
| Less than High School | 0 (0.0%) | 2 (100.0%) |
| High School Diploma | 3 (50.0%) | 3 (50.0%) |
| College or Associate's Degree | 8 (100.0%) | 0 (0.0%) |
| Bachelor's Degree | 0 (0.0%) | 0 (0.0%) |
| Graduate Degree | 0 (0.0%) | 0 (0.0%) |
| Total | 11 (68.8%) | 5 (31.2%) |
Employment Characteristics in La Monte
Employment by Class of Employer in La Monte
Among the 488 employed individuals in La Monte, private company employees (349 | 71.5%), not-for-profit organizations (58 | 11.9%), and state government employees (27 | 5.5%) make up the most common classes of employment.
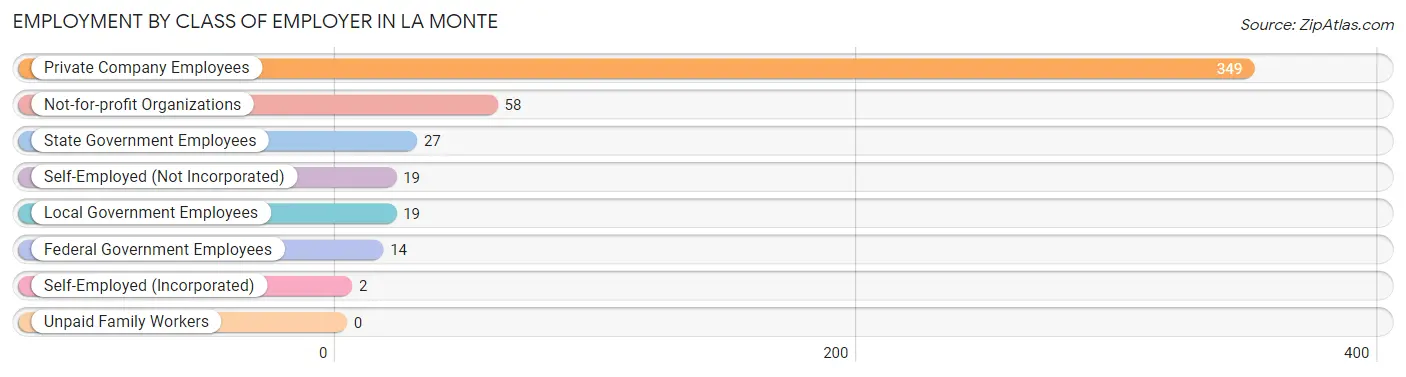
| Employer Class | # Employees | % Employees |
| Private Company Employees | 349 | 71.5% |
| Self-Employed (Incorporated) | 2 | 0.4% |
| Self-Employed (Not Incorporated) | 19 | 3.9% |
| Not-for-profit Organizations | 58 | 11.9% |
| Local Government Employees | 19 | 3.9% |
| State Government Employees | 27 | 5.5% |
| Federal Government Employees | 14 | 2.9% |
| Unpaid Family Workers | 0 | 0.0% |
| Total | 488 | 100.0% |
Employment Status by Age in La Monte
According to the labor force statistics for La Monte, out of the total population over 16 years of age (795), 64.0% or 509 individuals are in the labor force, with 2.6% or 13 of them unemployed. The age group with the highest labor force participation rate is 20 to 24 years, with 90.8% or 129 individuals in the labor force. Within the labor force, the 20 to 24 years age range has the highest percentage of unemployed individuals, with 7.9% or 10 of them being unemployed.
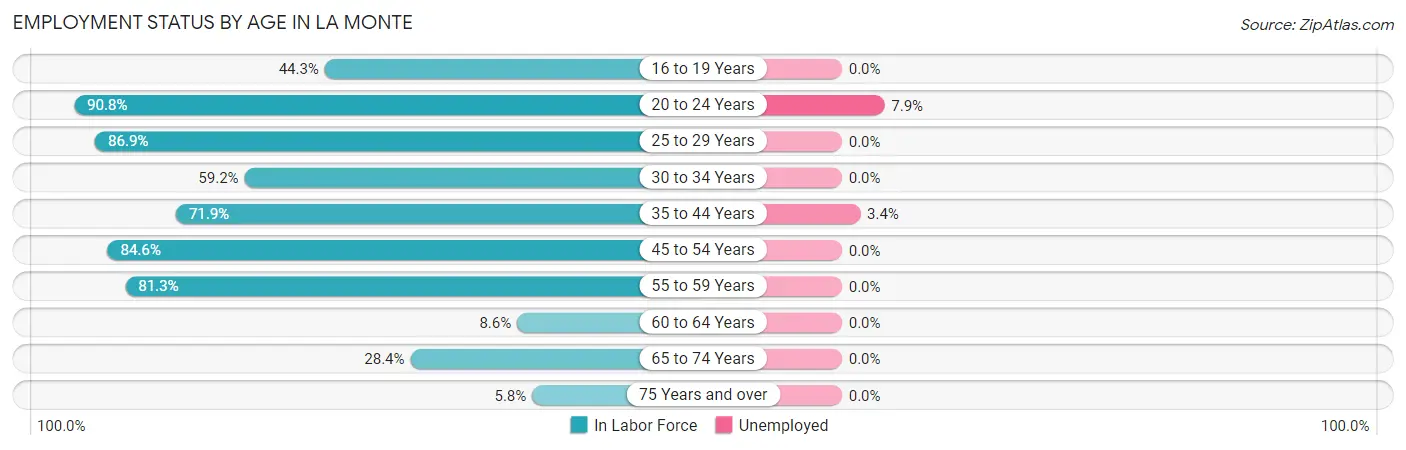
| Age Bracket | In Labor Force | Unemployed |
| 16 to 19 Years | 35 (44.3%) | 0 (0.0%) |
| 20 to 24 Years | 129 (90.8%) | 10 (7.9%) |
| 25 to 29 Years | 53 (86.9%) | 0 (0.0%) |
| 30 to 34 Years | 29 (59.2%) | 0 (0.0%) |
| 35 to 44 Years | 87 (71.9%) | 3 (3.4%) |
| 45 to 54 Years | 121 (84.6%) | 0 (0.0%) |
| 55 to 59 Years | 26 (81.3%) | 0 (0.0%) |
| 60 to 64 Years | 3 (8.6%) | 0 (0.0%) |
| 65 to 74 Years | 23 (28.4%) | 0 (0.0%) |
| 75 Years and over | 3 (5.8%) | 0 (0.0%) |
| Total | 509 (64.0%) | 13 (2.6%) |
Employment Status by Educational Attainment in La Monte
According to labor force statistics for La Monte, 72.3% of individuals (319) out of the total population between 25 and 64 years of age (441) are in the labor force, with 0.9% or 3 of them being unemployed. The group with the highest labor force participation rate are those with the educational attainment of bachelor's degree or higher, with 96.2% or 50 individuals in the labor force. Within the labor force, individuals with high school diploma education have the highest percentage of unemployment, with 4.5% or 3 of them being unemployed.
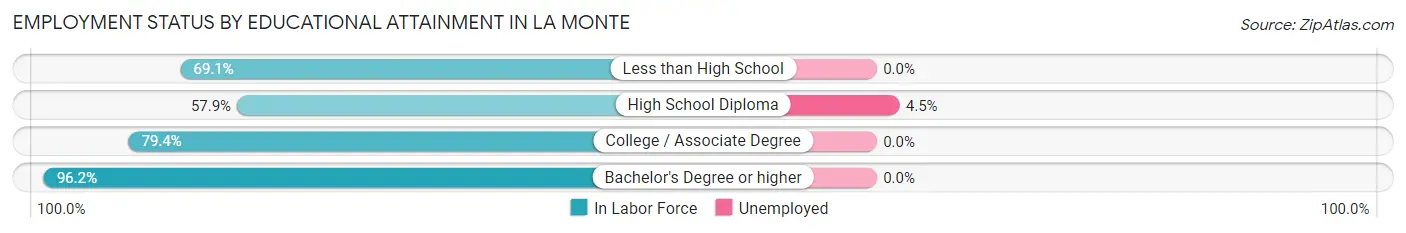
| Educational Attainment | In Labor Force | Unemployed |
| Less than High School | 103 (69.1%) | 0 (0.0%) |
| High School Diploma | 66 (57.9%) | 5 (4.5%) |
| College / Associate Degree | 100 (79.4%) | 0 (0.0%) |
| Bachelor's Degree or higher | 50 (96.2%) | 0 (0.0%) |
| Total | 319 (72.3%) | 4 (0.9%) |
Employment Occupations by Sex in La Monte
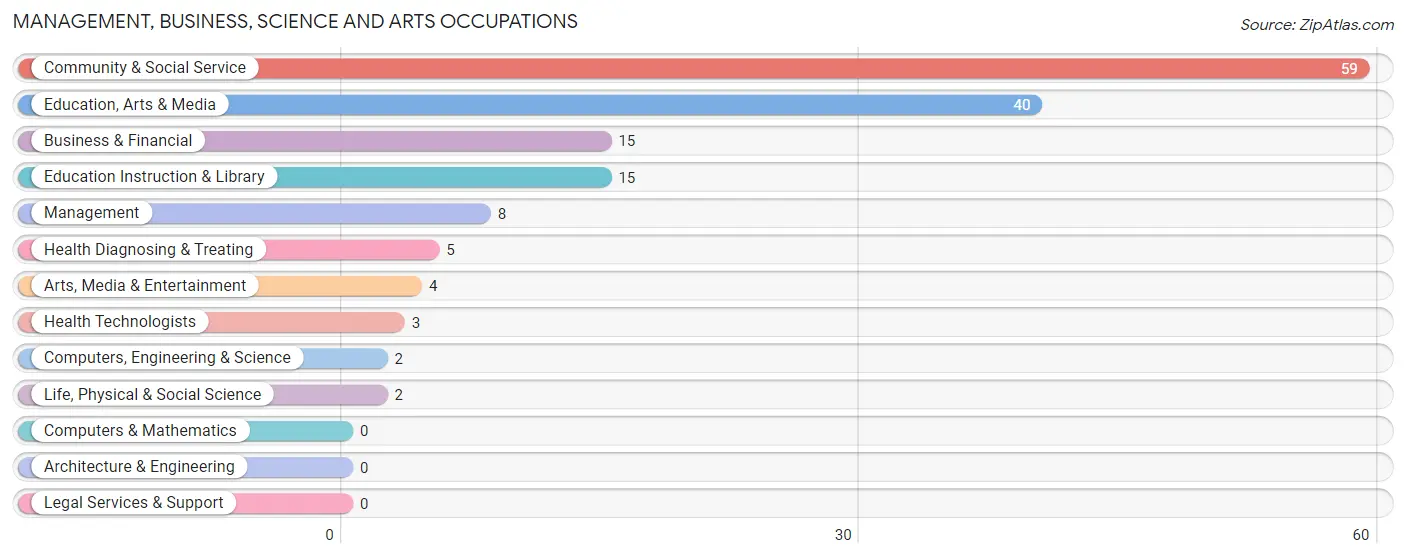
Management, Business, Science and Arts Occupations
The most common Management, Business, Science and Arts occupations in La Monte are Community & Social Service (59 | 12.0%), Education, Arts & Media (40 | 8.2%), Business & Financial (15 | 3.0%), Education Instruction & Library (15 | 3.0%), and Management (8 | 1.6%).
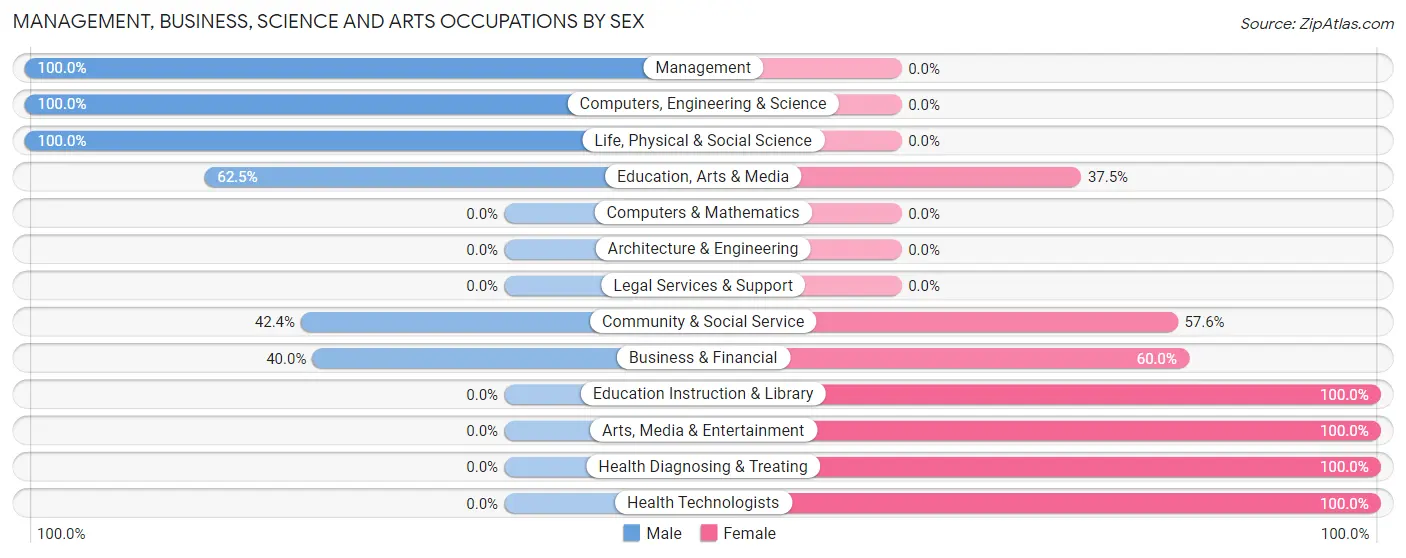
Management, Business, Science and Arts Occupations by Sex
Within the Management, Business, Science and Arts occupations in La Monte, the most male-oriented occupations are Management (100.0%), Computers, Engineering & Science (100.0%), and Life, Physical & Social Science (100.0%), while the most female-oriented occupations are Education Instruction & Library (100.0%), Arts, Media & Entertainment (100.0%), and Health Diagnosing & Treating (100.0%).
| Occupation | Male | Female |
| Management | 8 (100.0%) | 0 (0.0%) |
| Business & Financial | 6 (40.0%) | 9 (60.0%) |
| Computers, Engineering & Science | 2 (100.0%) | 0 (0.0%) |
| Computers & Mathematics | 0 (0.0%) | 0 (0.0%) |
| Architecture & Engineering | 0 (0.0%) | 0 (0.0%) |
| Life, Physical & Social Science | 2 (100.0%) | 0 (0.0%) |
| Community & Social Service | 25 (42.4%) | 34 (57.6%) |
| Education, Arts & Media | 25 (62.5%) | 15 (37.5%) |
| Legal Services & Support | 0 (0.0%) | 0 (0.0%) |
| Education Instruction & Library | 0 (0.0%) | 15 (100.0%) |
| Arts, Media & Entertainment | 0 (0.0%) | 4 (100.0%) |
| Health Diagnosing & Treating | 0 (0.0%) | 5 (100.0%) |
| Health Technologists | 0 (0.0%) | 3 (100.0%) |
| Total (Category) | 41 (46.1%) | 48 (53.9%) |
| Total (Overall) | 281 (57.2%) | 210 (42.8%) |
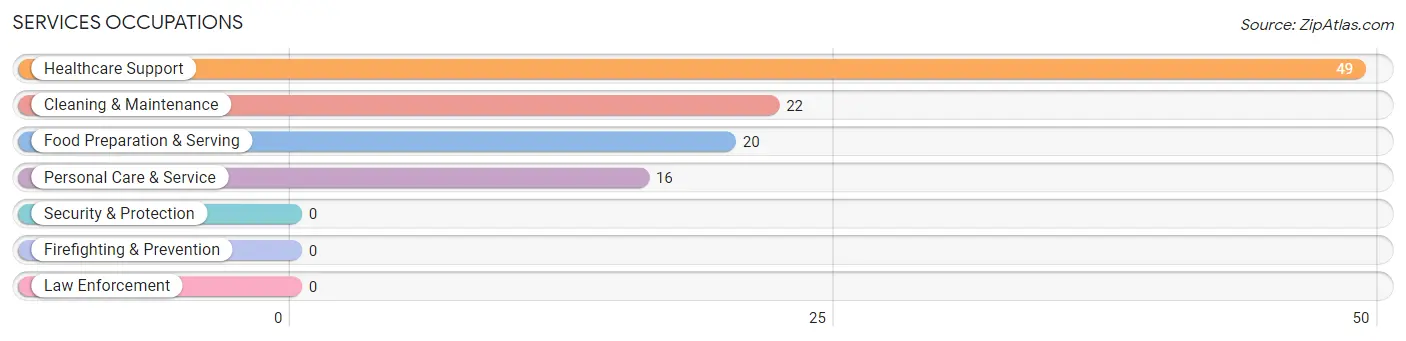
Services Occupations
The most common Services occupations in La Monte are Healthcare Support (49 | 10.0%), Cleaning & Maintenance (22 | 4.5%), Food Preparation & Serving (20 | 4.1%), and Personal Care & Service (16 | 3.3%).
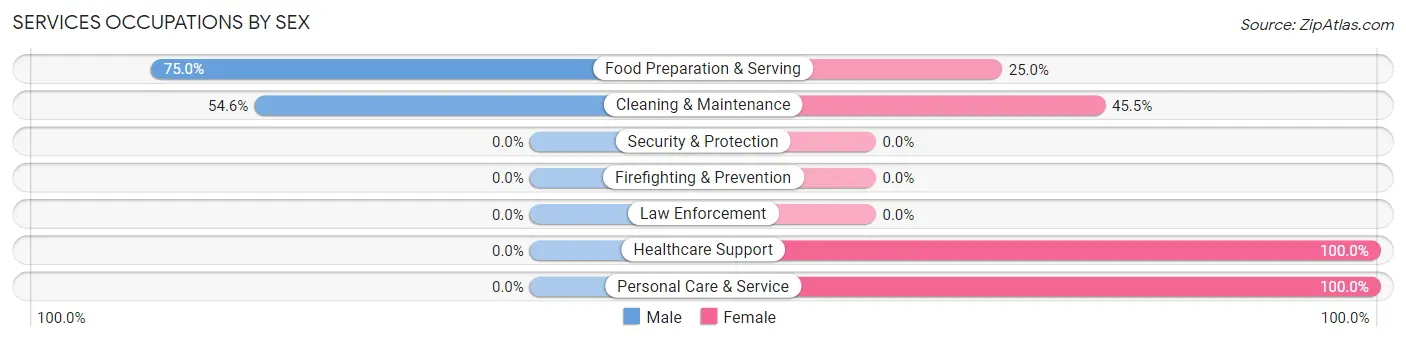
Services Occupations by Sex
Within the Services occupations in La Monte, the most male-oriented occupations are Food Preparation & Serving (75.0%), and Cleaning & Maintenance (54.5%), while the most female-oriented occupations are Healthcare Support (100.0%), Personal Care & Service (100.0%), and Cleaning & Maintenance (45.5%).
| Occupation | Male | Female |
| Healthcare Support | 0 (0.0%) | 49 (100.0%) |
| Security & Protection | 0 (0.0%) | 0 (0.0%) |
| Firefighting & Prevention | 0 (0.0%) | 0 (0.0%) |
| Law Enforcement | 0 (0.0%) | 0 (0.0%) |
| Food Preparation & Serving | 15 (75.0%) | 5 (25.0%) |
| Cleaning & Maintenance | 12 (54.5%) | 10 (45.5%) |
| Personal Care & Service | 0 (0.0%) | 16 (100.0%) |
| Total (Category) | 27 (25.2%) | 80 (74.8%) |
| Total (Overall) | 281 (57.2%) | 210 (42.8%) |
Sales and Office Occupations
The most common Sales and Office occupations in La Monte are Sales & Related (34 | 6.9%), and Office & Administration (20 | 4.1%).
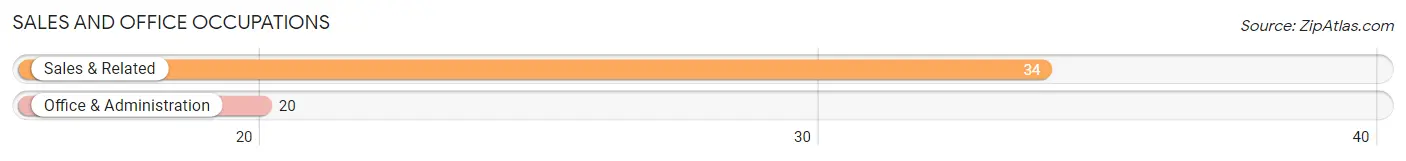
Sales and Office Occupations by Sex
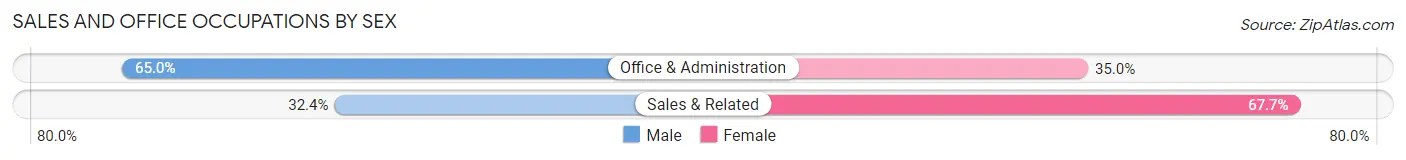
| Occupation | Male | Female |
| Sales & Related | 11 (32.4%) | 23 (67.6%) |
| Office & Administration | 13 (65.0%) | 7 (35.0%) |
| Total (Category) | 24 (44.4%) | 30 (55.6%) |
| Total (Overall) | 281 (57.2%) | 210 (42.8%) |
Natural Resources, Construction and Maintenance Occupations
The most common Natural Resources, Construction and Maintenance occupations in La Monte are Farming, Fishing & Forestry (39 | 7.9%), Installation, Maintenance & Repair (25 | 5.1%), and Construction & Extraction (18 | 3.7%).
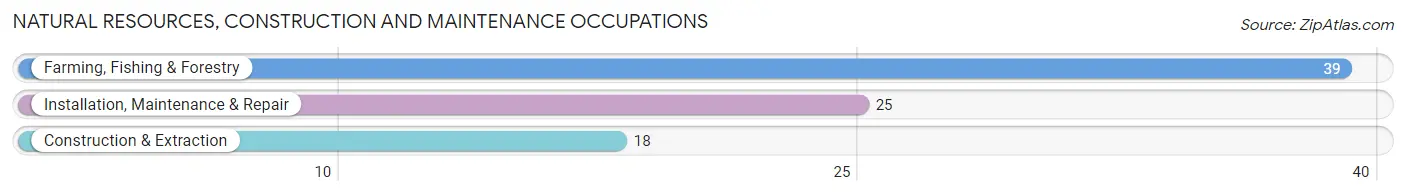
Natural Resources, Construction and Maintenance Occupations by Sex
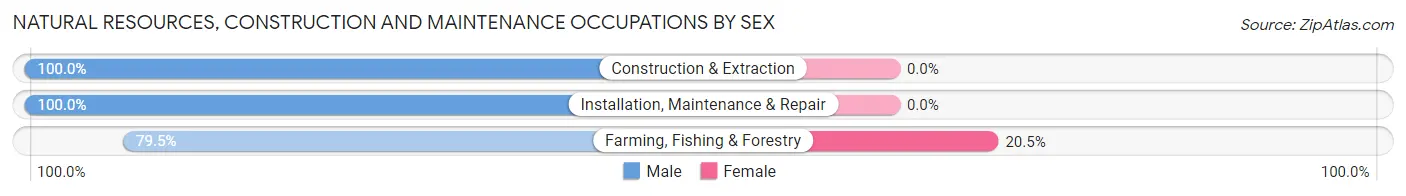
| Occupation | Male | Female |
| Farming, Fishing & Forestry | 31 (79.5%) | 8 (20.5%) |
| Construction & Extraction | 18 (100.0%) | 0 (0.0%) |
| Installation, Maintenance & Repair | 25 (100.0%) | 0 (0.0%) |
| Total (Category) | 74 (90.2%) | 8 (9.8%) |
| Total (Overall) | 281 (57.2%) | 210 (42.8%) |
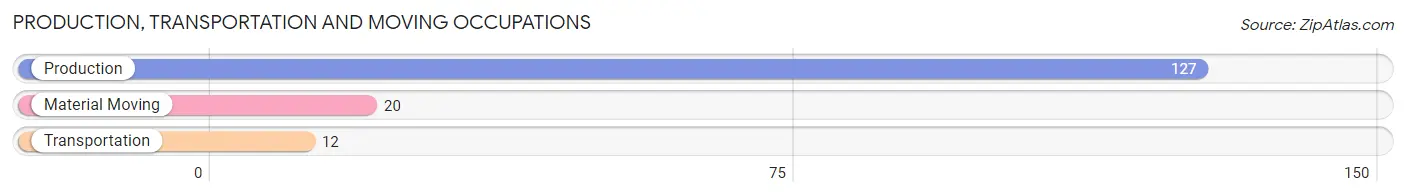
Production, Transportation and Moving Occupations
The most common Production, Transportation and Moving occupations in La Monte are Production (127 | 25.9%), Material Moving (20 | 4.1%), and Transportation (12 | 2.4%).
Production, Transportation and Moving Occupations by Sex
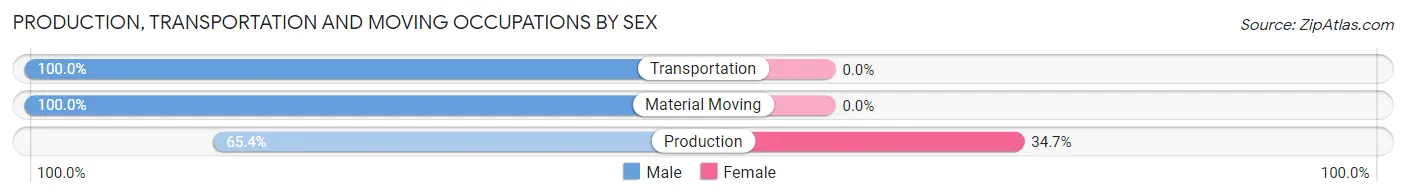
| Occupation | Male | Female |
| Production | 83 (65.3%) | 44 (34.6%) |
| Transportation | 12 (100.0%) | 0 (0.0%) |
| Material Moving | 20 (100.0%) | 0 (0.0%) |
| Total (Category) | 115 (72.3%) | 44 (27.7%) |
| Total (Overall) | 281 (57.2%) | 210 (42.8%) |
Employment Industries by Sex in La Monte
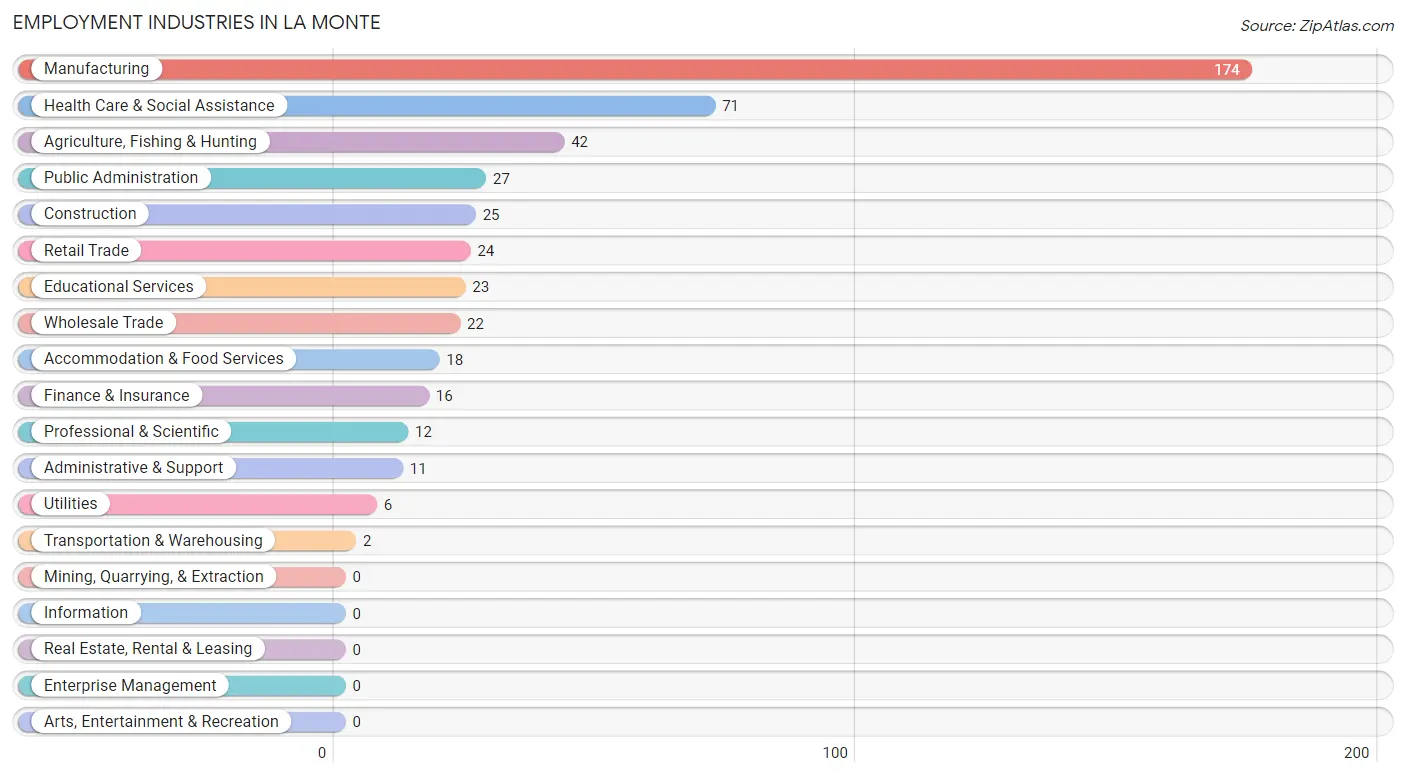
Employment Industries in La Monte
The major employment industries in La Monte include Manufacturing (174 | 35.4%), Health Care & Social Assistance (71 | 14.5%), Agriculture, Fishing & Hunting (42 | 8.6%), Public Administration (27 | 5.5%), and Construction (25 | 5.1%).
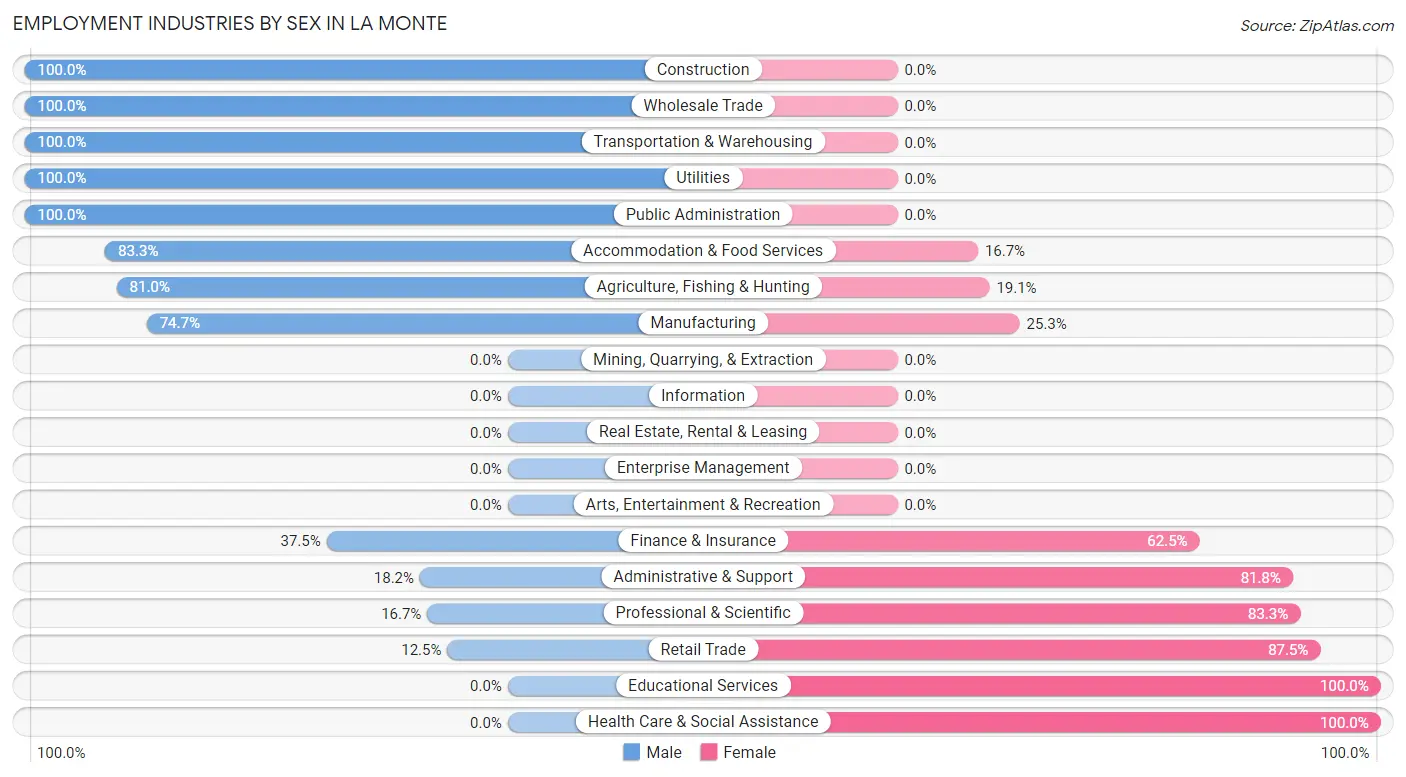
Employment Industries by Sex in La Monte
The La Monte industries that see more men than women are Construction (100.0%), Wholesale Trade (100.0%), and Transportation & Warehousing (100.0%), whereas the industries that tend to have a higher number of women are Educational Services (100.0%), Health Care & Social Assistance (100.0%), and Retail Trade (87.5%).
| Industry | Male | Female |
| Agriculture, Fishing & Hunting | 34 (80.9%) | 8 (19.1%) |
| Mining, Quarrying, & Extraction | 0 (0.0%) | 0 (0.0%) |
| Construction | 25 (100.0%) | 0 (0.0%) |
| Manufacturing | 130 (74.7%) | 44 (25.3%) |
| Wholesale Trade | 22 (100.0%) | 0 (0.0%) |
| Retail Trade | 3 (12.5%) | 21 (87.5%) |
| Transportation & Warehousing | 2 (100.0%) | 0 (0.0%) |
| Utilities | 6 (100.0%) | 0 (0.0%) |
| Information | 0 (0.0%) | 0 (0.0%) |
| Finance & Insurance | 6 (37.5%) | 10 (62.5%) |
| Real Estate, Rental & Leasing | 0 (0.0%) | 0 (0.0%) |
| Professional & Scientific | 2 (16.7%) | 10 (83.3%) |
| Enterprise Management | 0 (0.0%) | 0 (0.0%) |
| Administrative & Support | 2 (18.2%) | 9 (81.8%) |
| Educational Services | 0 (0.0%) | 23 (100.0%) |
| Health Care & Social Assistance | 0 (0.0%) | 71 (100.0%) |
| Arts, Entertainment & Recreation | 0 (0.0%) | 0 (0.0%) |
| Accommodation & Food Services | 15 (83.3%) | 3 (16.7%) |
| Public Administration | 27 (100.0%) | 0 (0.0%) |
| Total | 281 (57.2%) | 210 (42.8%) |
Education in La Monte
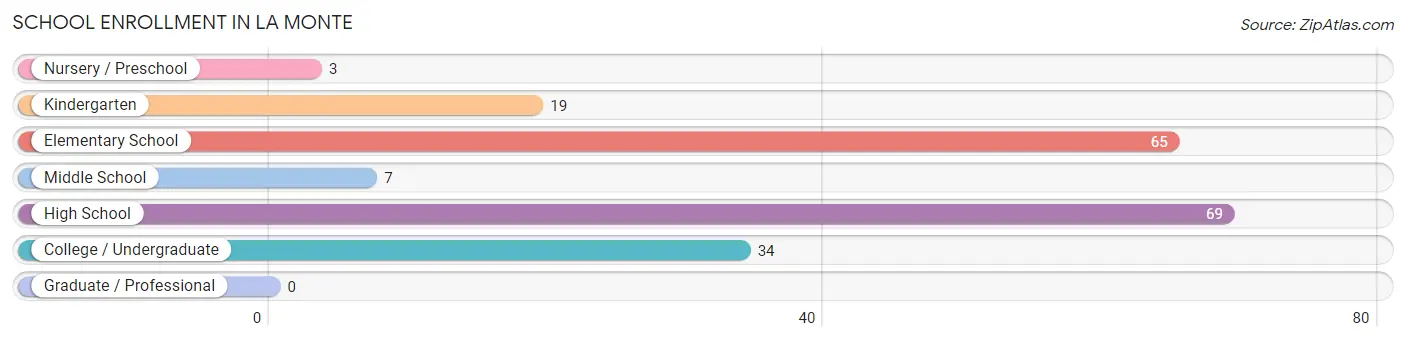
School Enrollment in La Monte
The most common levels of schooling among the 197 students in La Monte are high school (69 | 35.0%), elementary school (65 | 33.0%), and college / undergraduate (34 | 17.3%).
| School Level | # Students | % Students |
| Nursery / Preschool | 3 | 1.5% |
| Kindergarten | 19 | 9.6% |
| Elementary School | 65 | 33.0% |
| Middle School | 7 | 3.5% |
| High School | 69 | 35.0% |
| College / Undergraduate | 34 | 17.3% |
| Graduate / Professional | 0 | 0.0% |
| Total | 197 | 100.0% |
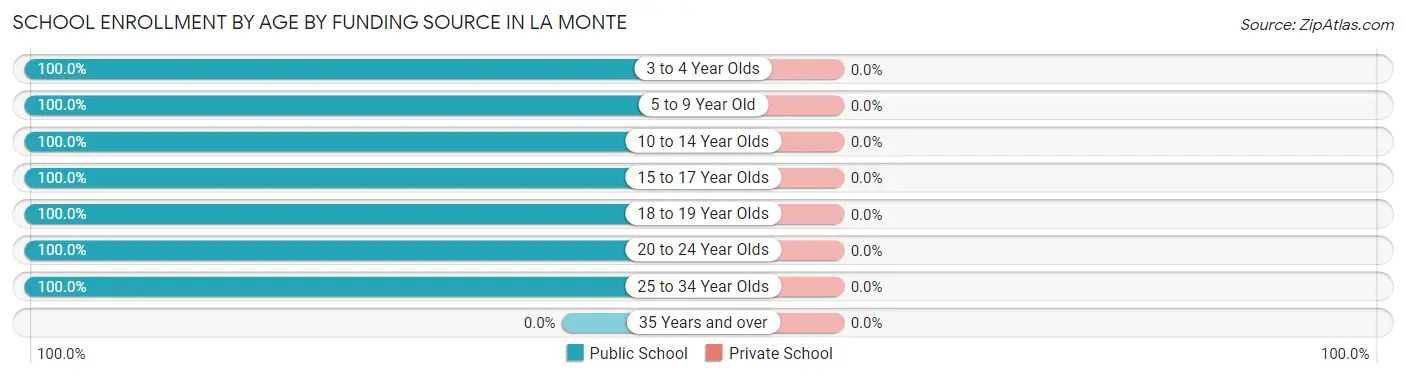
School Enrollment by Age by Funding Source in La Monte
| Age Bracket | Public School | Private School |
| 3 to 4 Year Olds | 3 (100.0%) | 0 (0.0%) |
| 5 to 9 Year Old | 58 (100.0%) | 0 (0.0%) |
| 10 to 14 Year Olds | 33 (100.0%) | 0 (0.0%) |
| 15 to 17 Year Olds | 49 (100.0%) | 0 (0.0%) |
| 18 to 19 Year Olds | 12 (100.0%) | 0 (0.0%) |
| 20 to 24 Year Olds | 22 (100.0%) | 0 (0.0%) |
| 25 to 34 Year Olds | 20 (100.0%) | 0 (0.0%) |
| 35 Years and over | 0 (0.0%) | 0 (0.0%) |
| Total | 197 (100.0%) | 0 (0.0%) |
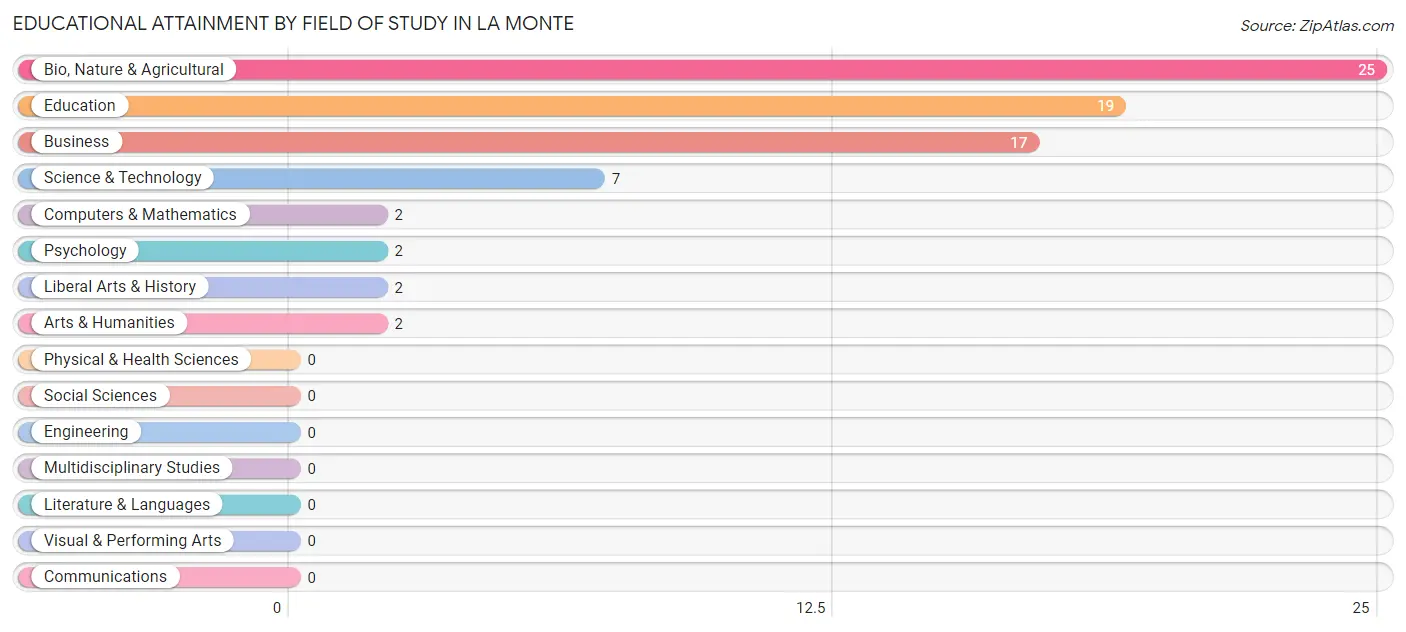
Educational Attainment by Field of Study in La Monte
Bio, nature & agricultural (25 | 32.9%), education (19 | 25.0%), business (17 | 22.4%), science & technology (7 | 9.2%), and computers & mathematics (2 | 2.6%) are the most common fields of study among 76 individuals in La Monte who have obtained a bachelor's degree or higher.
| Field of Study | # Graduates | % Graduates |
| Computers & Mathematics | 2 | 2.6% |
| Bio, Nature & Agricultural | 25 | 32.9% |
| Physical & Health Sciences | 0 | 0.0% |
| Psychology | 2 | 2.6% |
| Social Sciences | 0 | 0.0% |
| Engineering | 0 | 0.0% |
| Multidisciplinary Studies | 0 | 0.0% |
| Science & Technology | 7 | 9.2% |
| Business | 17 | 22.4% |
| Education | 19 | 25.0% |
| Literature & Languages | 0 | 0.0% |
| Liberal Arts & History | 2 | 2.6% |
| Visual & Performing Arts | 0 | 0.0% |
| Communications | 0 | 0.0% |
| Arts & Humanities | 2 | 2.6% |
| Total | 76 | 100.0% |
Transportation & Commute in La Monte
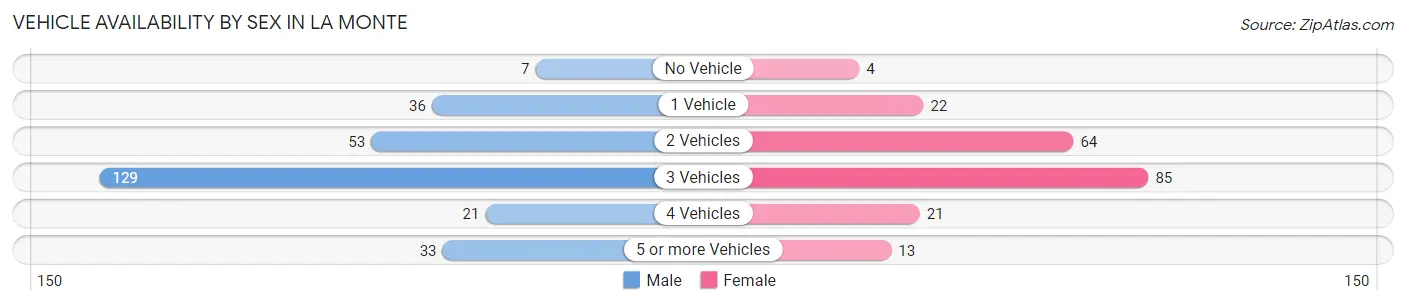
Vehicle Availability by Sex in La Monte
The most prevalent vehicle ownership categories in La Monte are males with 3 vehicles (129, accounting for 46.2%) and females with 3 vehicles (85, making up 61.7%).
| Vehicles Available | Male | Female |
| No Vehicle | 7 (2.5%) | 4 (1.9%) |
| 1 Vehicle | 36 (12.9%) | 22 (10.5%) |
| 2 Vehicles | 53 (19.0%) | 64 (30.6%) |
| 3 Vehicles | 129 (46.2%) | 85 (40.7%) |
| 4 Vehicles | 21 (7.5%) | 21 (10.1%) |
| 5 or more Vehicles | 33 (11.8%) | 13 (6.2%) |
| Total | 279 (100.0%) | 209 (100.0%) |
Commute Time in La Monte
The most frequently occuring commute durations in La Monte are 15 to 19 minutes (117 commuters, 26.6%), 10 to 14 minutes (115 commuters, 26.1%), and 5 to 9 minutes (46 commuters, 10.4%).
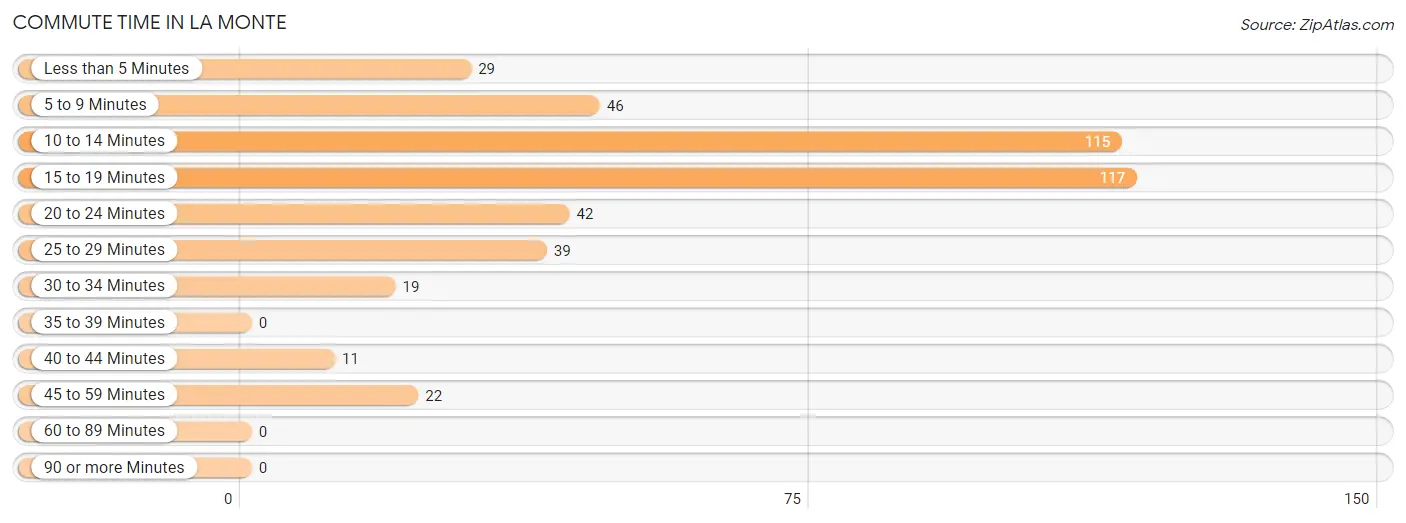
| Commute Time | # Commuters | % Commuters |
| Less than 5 Minutes | 29 | 6.6% |
| 5 to 9 Minutes | 46 | 10.4% |
| 10 to 14 Minutes | 115 | 26.1% |
| 15 to 19 Minutes | 117 | 26.6% |
| 20 to 24 Minutes | 42 | 9.6% |
| 25 to 29 Minutes | 39 | 8.9% |
| 30 to 34 Minutes | 19 | 4.3% |
| 35 to 39 Minutes | 0 | 0.0% |
| 40 to 44 Minutes | 11 | 2.5% |
| 45 to 59 Minutes | 22 | 5.0% |
| 60 to 89 Minutes | 0 | 0.0% |
| 90 or more Minutes | 0 | 0.0% |
Commute Time by Sex in La Monte
The most common commute times in La Monte are 15 to 19 minutes (81 commuters, 29.2%) for males and 10 to 14 minutes (51 commuters, 31.3%) for females.
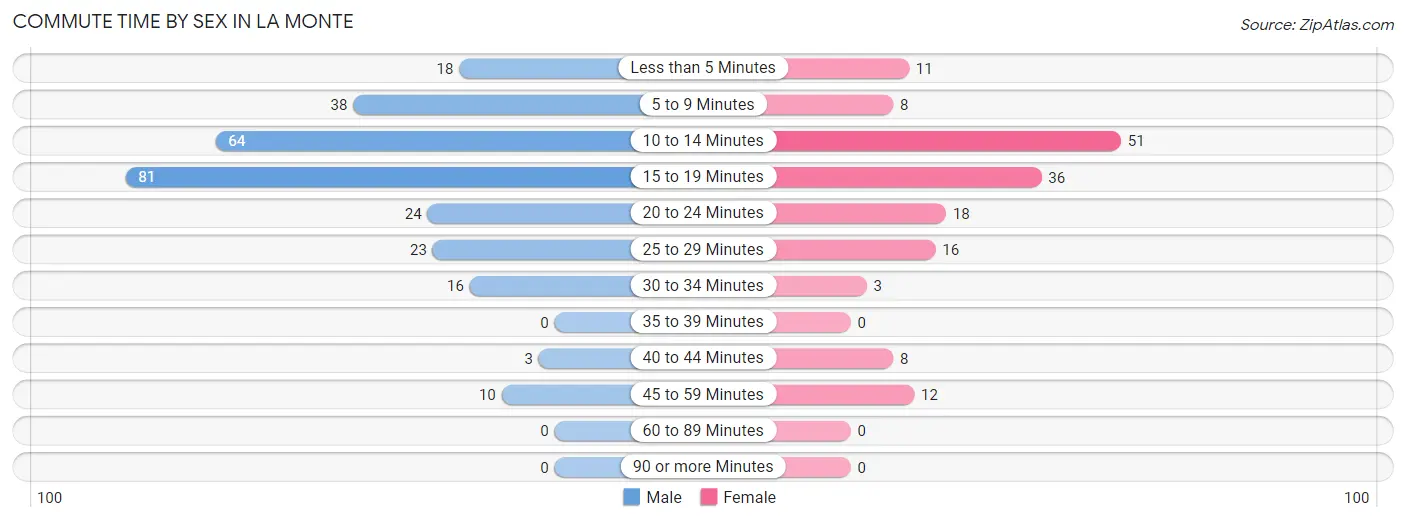
| Commute Time | Male | Female |
| Less than 5 Minutes | 18 (6.5%) | 11 (6.8%) |
| 5 to 9 Minutes | 38 (13.7%) | 8 (4.9%) |
| 10 to 14 Minutes | 64 (23.1%) | 51 (31.3%) |
| 15 to 19 Minutes | 81 (29.2%) | 36 (22.1%) |
| 20 to 24 Minutes | 24 (8.7%) | 18 (11.0%) |
| 25 to 29 Minutes | 23 (8.3%) | 16 (9.8%) |
| 30 to 34 Minutes | 16 (5.8%) | 3 (1.8%) |
| 35 to 39 Minutes | 0 (0.0%) | 0 (0.0%) |
| 40 to 44 Minutes | 3 (1.1%) | 8 (4.9%) |
| 45 to 59 Minutes | 10 (3.6%) | 12 (7.4%) |
| 60 to 89 Minutes | 0 (0.0%) | 0 (0.0%) |
| 90 or more Minutes | 0 (0.0%) | 0 (0.0%) |
Time of Departure to Work by Sex in La Monte
The most frequent times of departure to work in La Monte are 7:00 AM to 7:29 AM (84, 30.3%) for males and 7:00 AM to 7:29 AM (47, 28.8%) for females.
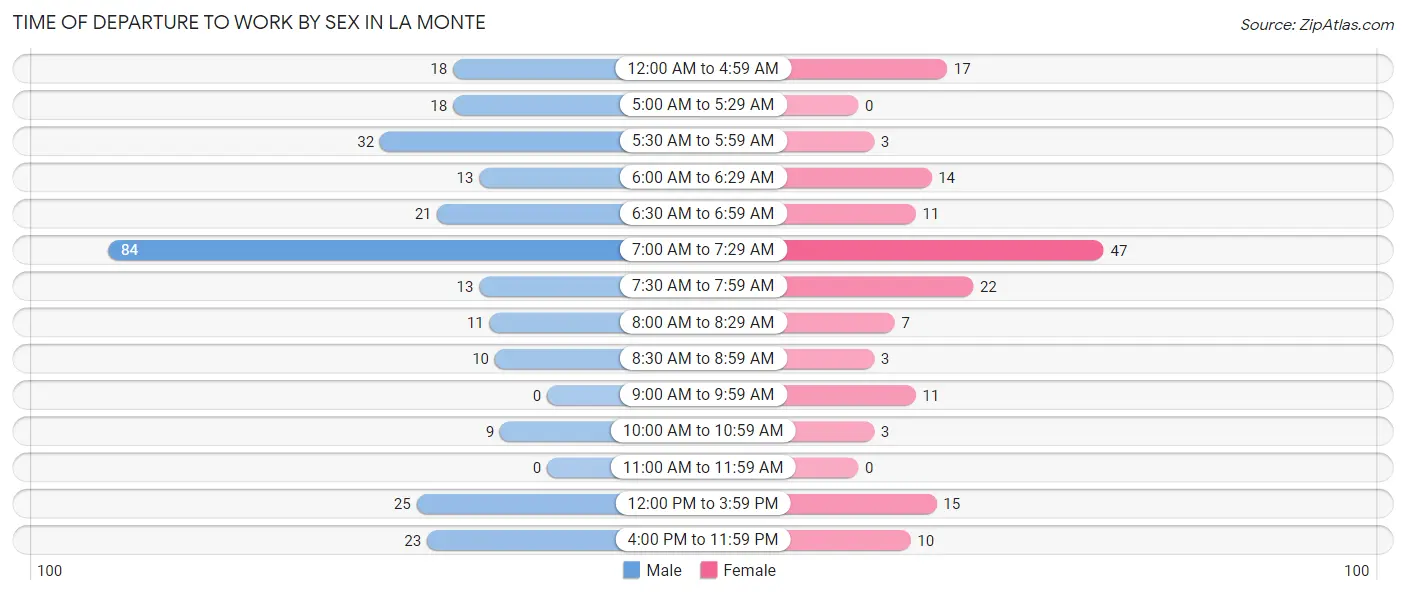
| Time of Departure | Male | Female |
| 12:00 AM to 4:59 AM | 18 (6.5%) | 17 (10.4%) |
| 5:00 AM to 5:29 AM | 18 (6.5%) | 0 (0.0%) |
| 5:30 AM to 5:59 AM | 32 (11.6%) | 3 (1.8%) |
| 6:00 AM to 6:29 AM | 13 (4.7%) | 14 (8.6%) |
| 6:30 AM to 6:59 AM | 21 (7.6%) | 11 (6.8%) |
| 7:00 AM to 7:29 AM | 84 (30.3%) | 47 (28.8%) |
| 7:30 AM to 7:59 AM | 13 (4.7%) | 22 (13.5%) |
| 8:00 AM to 8:29 AM | 11 (4.0%) | 7 (4.3%) |
| 8:30 AM to 8:59 AM | 10 (3.6%) | 3 (1.8%) |
| 9:00 AM to 9:59 AM | 0 (0.0%) | 11 (6.8%) |
| 10:00 AM to 10:59 AM | 9 (3.3%) | 3 (1.8%) |
| 11:00 AM to 11:59 AM | 0 (0.0%) | 0 (0.0%) |
| 12:00 PM to 3:59 PM | 25 (9.0%) | 15 (9.2%) |
| 4:00 PM to 11:59 PM | 23 (8.3%) | 10 (6.1%) |
| Total | 277 (100.0%) | 163 (100.0%) |
Housing Occupancy in La Monte
Occupancy by Ownership in La Monte
Of the total 347 dwellings in La Monte, owner-occupied units account for 203 (58.5%), while renter-occupied units make up 144 (41.5%).
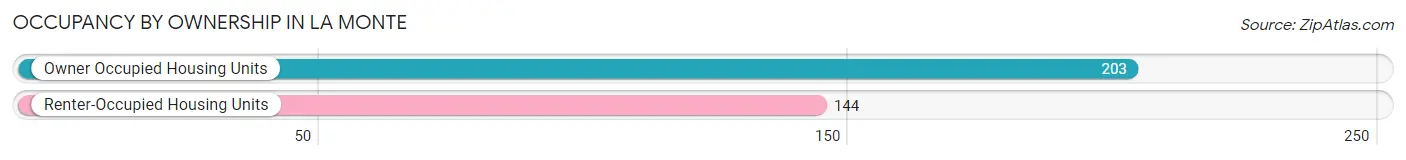
| Occupancy | # Housing Units | % Housing Units |
| Owner Occupied Housing Units | 203 | 58.5% |
| Renter-Occupied Housing Units | 144 | 41.5% |
| Total Occupied Housing Units | 347 | 100.0% |
Occupancy by Household Size in La Monte
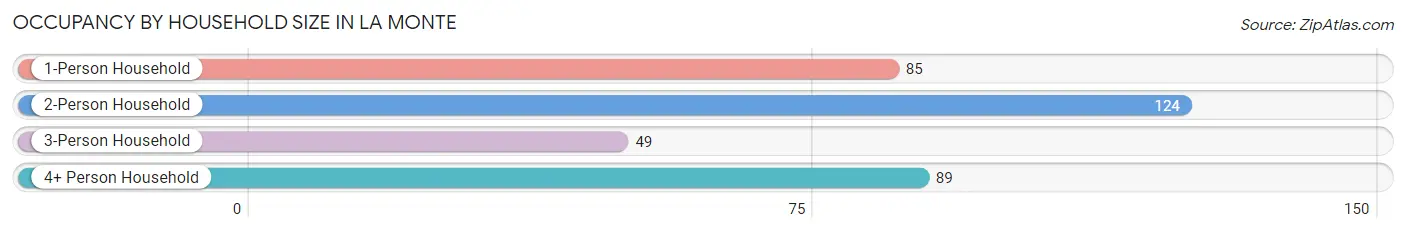
| Household Size | # Housing Units | % Housing Units |
| 1-Person Household | 85 | 24.5% |
| 2-Person Household | 124 | 35.7% |
| 3-Person Household | 49 | 14.1% |
| 4+ Person Household | 89 | 25.7% |
| Total Housing Units | 347 | 100.0% |
Occupancy by Ownership by Household Size in La Monte
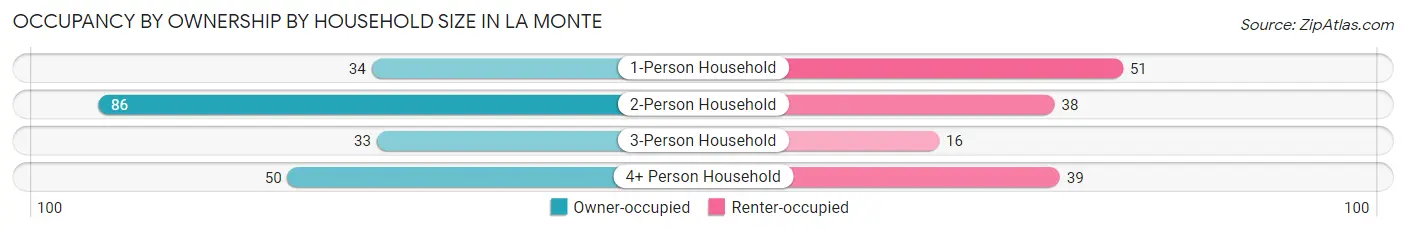
| Household Size | Owner-occupied | Renter-occupied |
| 1-Person Household | 34 (40.0%) | 51 (60.0%) |
| 2-Person Household | 86 (69.4%) | 38 (30.6%) |
| 3-Person Household | 33 (67.3%) | 16 (32.7%) |
| 4+ Person Household | 50 (56.2%) | 39 (43.8%) |
| Total Housing Units | 203 (58.5%) | 144 (41.5%) |
Occupancy by Educational Attainment in La Monte
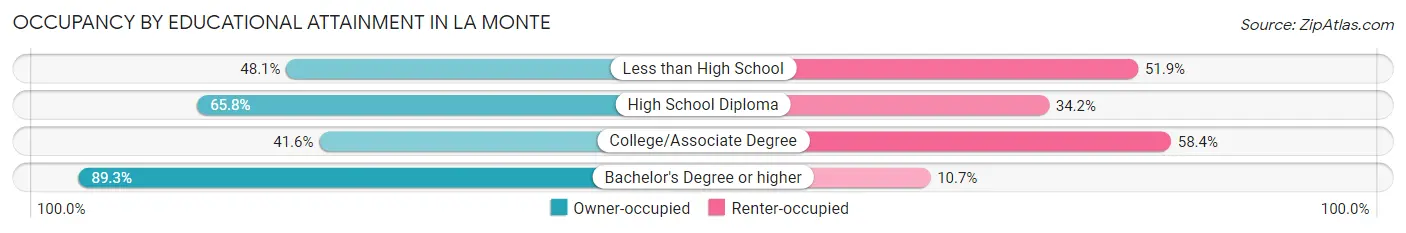
| Household Size | Owner-occupied | Renter-occupied |
| Less than High School | 38 (48.1%) | 41 (51.9%) |
| High School Diploma | 73 (65.8%) | 38 (34.2%) |
| College/Associate Degree | 42 (41.6%) | 59 (58.4%) |
| Bachelor's Degree or higher | 50 (89.3%) | 6 (10.7%) |
Occupancy by Age of Householder in La Monte
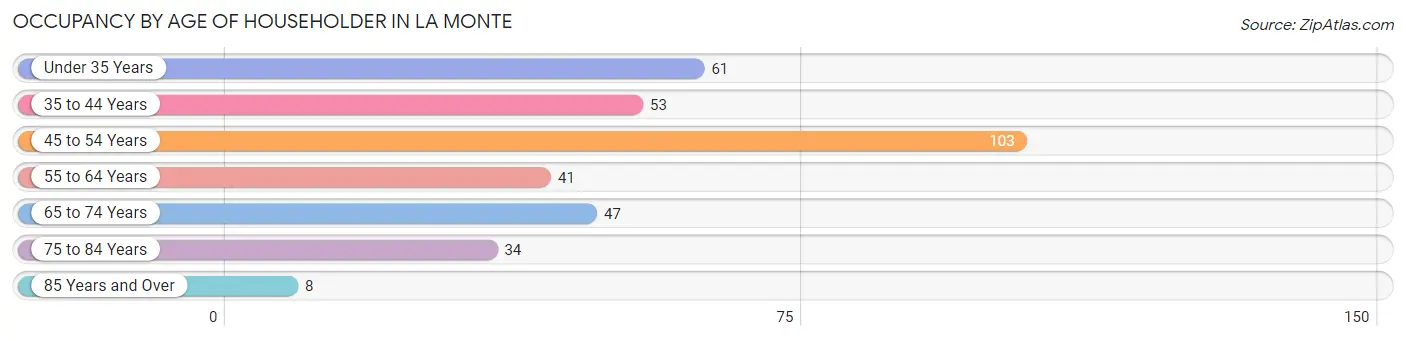
| Age Bracket | # Households | % Households |
| Under 35 Years | 61 | 17.6% |
| 35 to 44 Years | 53 | 15.3% |
| 45 to 54 Years | 103 | 29.7% |
| 55 to 64 Years | 41 | 11.8% |
| 65 to 74 Years | 47 | 13.5% |
| 75 to 84 Years | 34 | 9.8% |
| 85 Years and Over | 8 | 2.3% |
| Total | 347 | 100.0% |
Housing Finances in La Monte
Median Income by Occupancy in La Monte
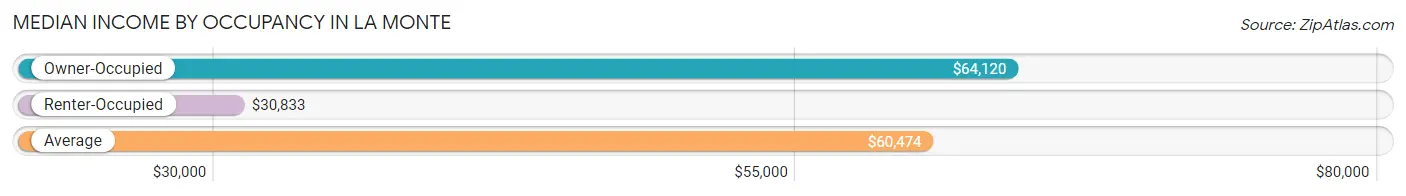
| Occupancy Type | # Households | Median Income |
| Owner-Occupied | 203 (58.5%) | $64,120 |
| Renter-Occupied | 144 (41.5%) | $30,833 |
| Average | 347 (100.0%) | $60,474 |
Occupancy by Householder Income Bracket in La Monte
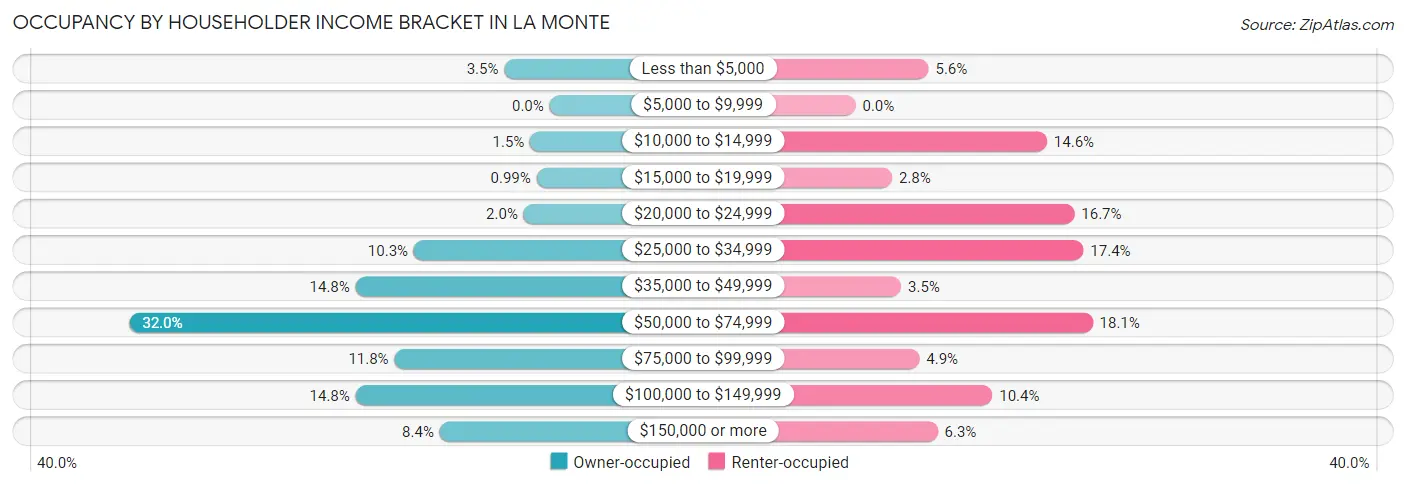
| Income Bracket | Owner-occupied | Renter-occupied |
| Less than $5,000 | 7 (3.5%) | 8 (5.6%) |
| $5,000 to $9,999 | 0 (0.0%) | 0 (0.0%) |
| $10,000 to $14,999 | 3 (1.5%) | 21 (14.6%) |
| $15,000 to $19,999 | 2 (1.0%) | 4 (2.8%) |
| $20,000 to $24,999 | 4 (2.0%) | 24 (16.7%) |
| $25,000 to $34,999 | 21 (10.3%) | 25 (17.4%) |
| $35,000 to $49,999 | 30 (14.8%) | 5 (3.5%) |
| $50,000 to $74,999 | 65 (32.0%) | 26 (18.1%) |
| $75,000 to $99,999 | 24 (11.8%) | 7 (4.9%) |
| $100,000 to $149,999 | 30 (14.8%) | 15 (10.4%) |
| $150,000 or more | 17 (8.4%) | 9 (6.2%) |
| Total | 203 (100.0%) | 144 (100.0%) |
Monthly Housing Cost Tiers in La Monte
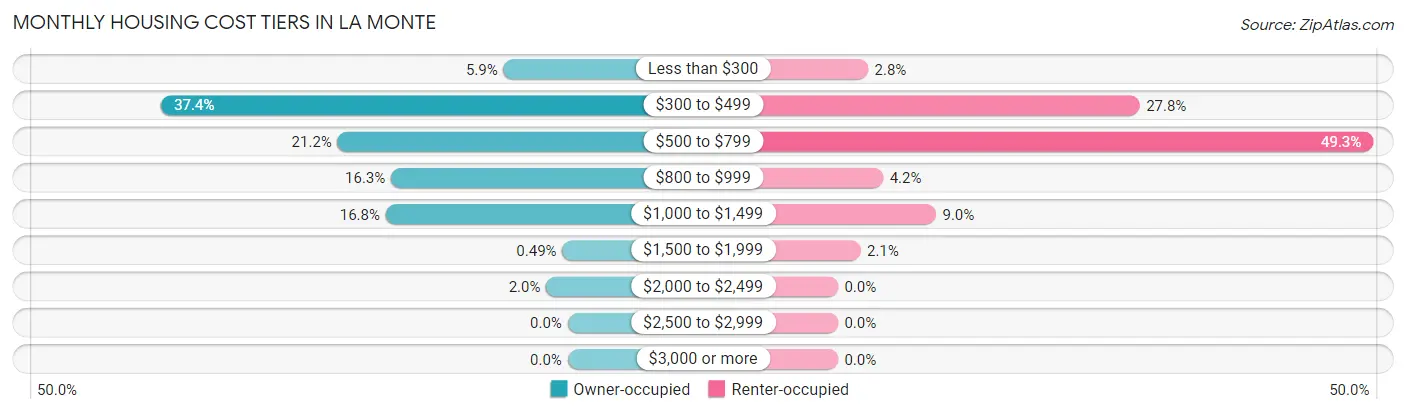
| Monthly Cost | Owner-occupied | Renter-occupied |
| Less than $300 | 12 (5.9%) | 4 (2.8%) |
| $300 to $499 | 76 (37.4%) | 40 (27.8%) |
| $500 to $799 | 43 (21.2%) | 71 (49.3%) |
| $800 to $999 | 33 (16.3%) | 6 (4.2%) |
| $1,000 to $1,499 | 34 (16.8%) | 13 (9.0%) |
| $1,500 to $1,999 | 1 (0.5%) | 3 (2.1%) |
| $2,000 to $2,499 | 4 (2.0%) | 0 (0.0%) |
| $2,500 to $2,999 | 0 (0.0%) | 0 (0.0%) |
| $3,000 or more | 0 (0.0%) | 0 (0.0%) |
| Total | 203 (100.0%) | 144 (100.0%) |
Physical Housing Characteristics in La Monte
Housing Structures in La Monte
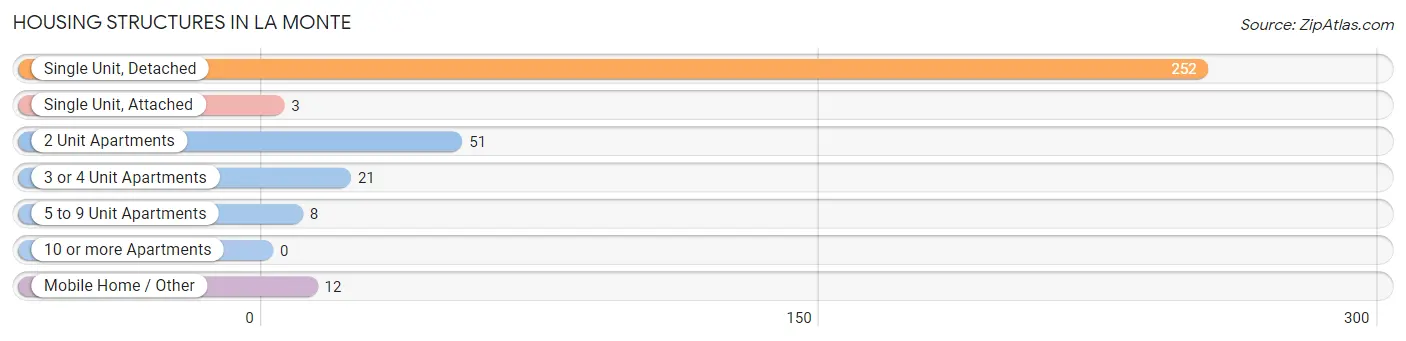
| Structure Type | # Housing Units | % Housing Units |
| Single Unit, Detached | 252 | 72.6% |
| Single Unit, Attached | 3 | 0.9% |
| 2 Unit Apartments | 51 | 14.7% |
| 3 or 4 Unit Apartments | 21 | 6.0% |
| 5 to 9 Unit Apartments | 8 | 2.3% |
| 10 or more Apartments | 0 | 0.0% |
| Mobile Home / Other | 12 | 3.5% |
| Total | 347 | 100.0% |
Housing Structures by Occupancy in La Monte
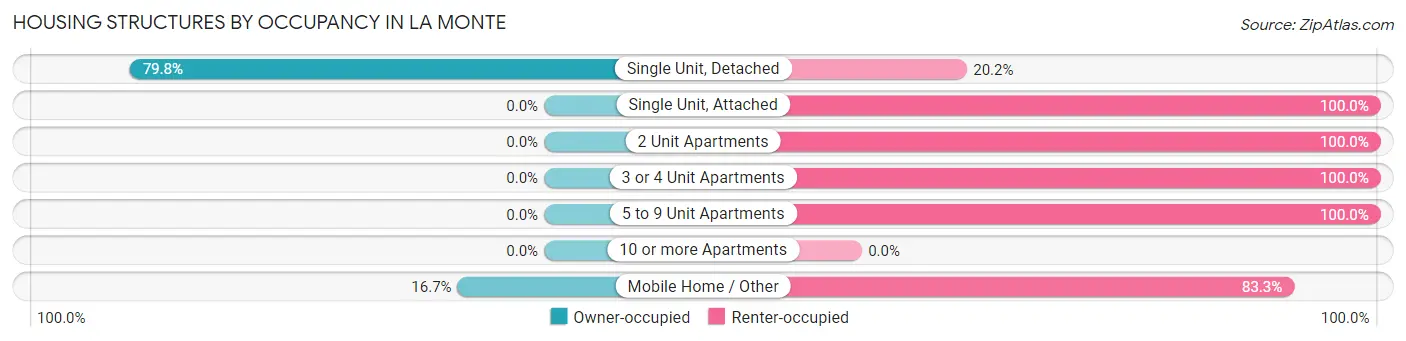
| Structure Type | Owner-occupied | Renter-occupied |
| Single Unit, Detached | 201 (79.8%) | 51 (20.2%) |
| Single Unit, Attached | 0 (0.0%) | 3 (100.0%) |
| 2 Unit Apartments | 0 (0.0%) | 51 (100.0%) |
| 3 or 4 Unit Apartments | 0 (0.0%) | 21 (100.0%) |
| 5 to 9 Unit Apartments | 0 (0.0%) | 8 (100.0%) |
| 10 or more Apartments | 0 (0.0%) | 0 (0.0%) |
| Mobile Home / Other | 2 (16.7%) | 10 (83.3%) |
| Total | 203 (58.5%) | 144 (41.5%) |
Housing Structures by Number of Rooms in La Monte
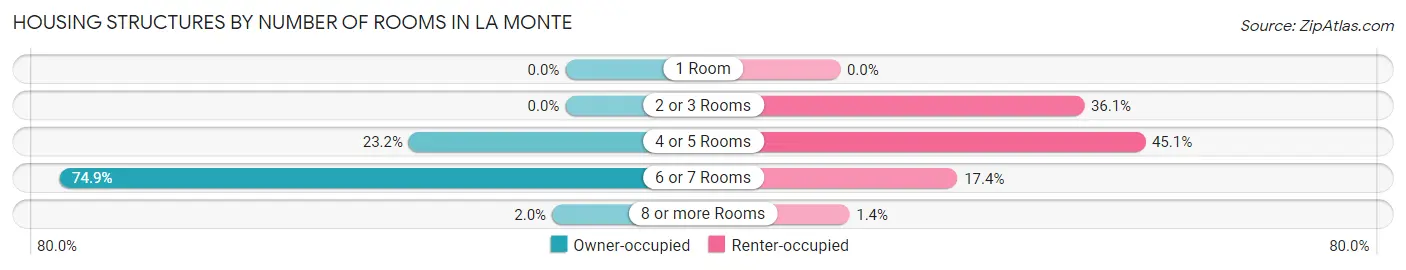
| Number of Rooms | Owner-occupied | Renter-occupied |
| 1 Room | 0 (0.0%) | 0 (0.0%) |
| 2 or 3 Rooms | 0 (0.0%) | 52 (36.1%) |
| 4 or 5 Rooms | 47 (23.2%) | 65 (45.1%) |
| 6 or 7 Rooms | 152 (74.9%) | 25 (17.4%) |
| 8 or more Rooms | 4 (2.0%) | 2 (1.4%) |
| Total | 203 (100.0%) | 144 (100.0%) |
Housing Structure by Heating Type in La Monte
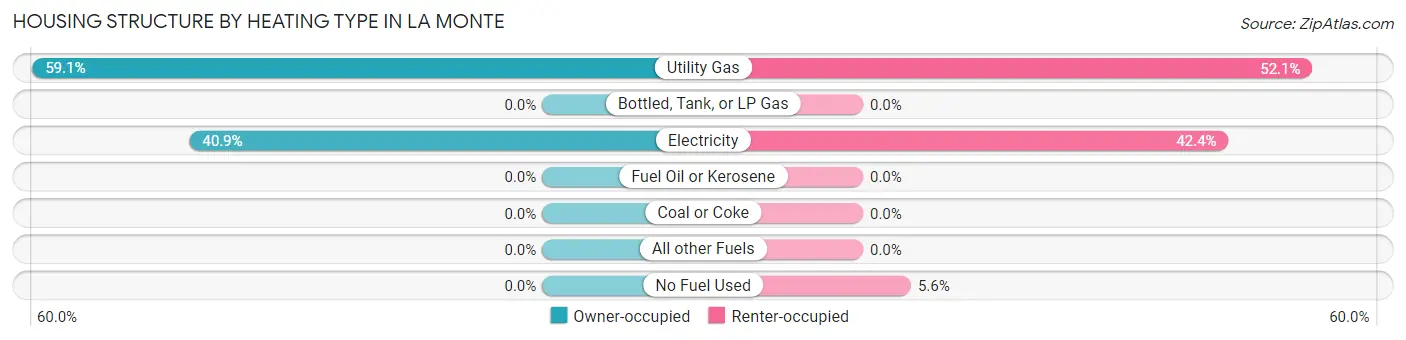
| Heating Type | Owner-occupied | Renter-occupied |
| Utility Gas | 120 (59.1%) | 75 (52.1%) |
| Bottled, Tank, or LP Gas | 0 (0.0%) | 0 (0.0%) |
| Electricity | 83 (40.9%) | 61 (42.4%) |
| Fuel Oil or Kerosene | 0 (0.0%) | 0 (0.0%) |
| Coal or Coke | 0 (0.0%) | 0 (0.0%) |
| All other Fuels | 0 (0.0%) | 0 (0.0%) |
| No Fuel Used | 0 (0.0%) | 8 (5.6%) |
| Total | 203 (100.0%) | 144 (100.0%) |
Household Vehicle Usage in La Monte
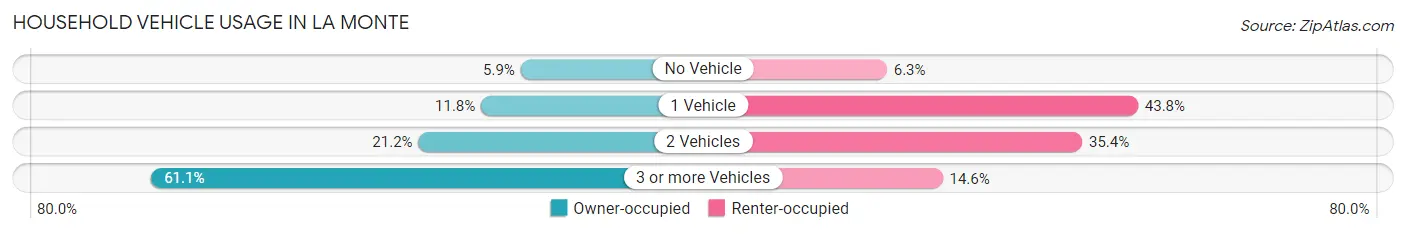
| Vehicles per Household | Owner-occupied | Renter-occupied |
| No Vehicle | 12 (5.9%) | 9 (6.2%) |
| 1 Vehicle | 24 (11.8%) | 63 (43.8%) |
| 2 Vehicles | 43 (21.2%) | 51 (35.4%) |
| 3 or more Vehicles | 124 (61.1%) | 21 (14.6%) |
| Total | 203 (100.0%) | 144 (100.0%) |
Real Estate & Mortgages in La Monte
Real Estate and Mortgage Overview in La Monte
| Characteristic | Without Mortgage | With Mortgage |
| Housing Units | 120 | 83 |
| Median Property Value | $92,500 | $125,700 |
| Median Household Income | $63,300 | $14 |
| Monthly Housing Costs | $391 | $0 |
| Real Estate Taxes | $755 | $0 |
Property Value by Mortgage Status in La Monte
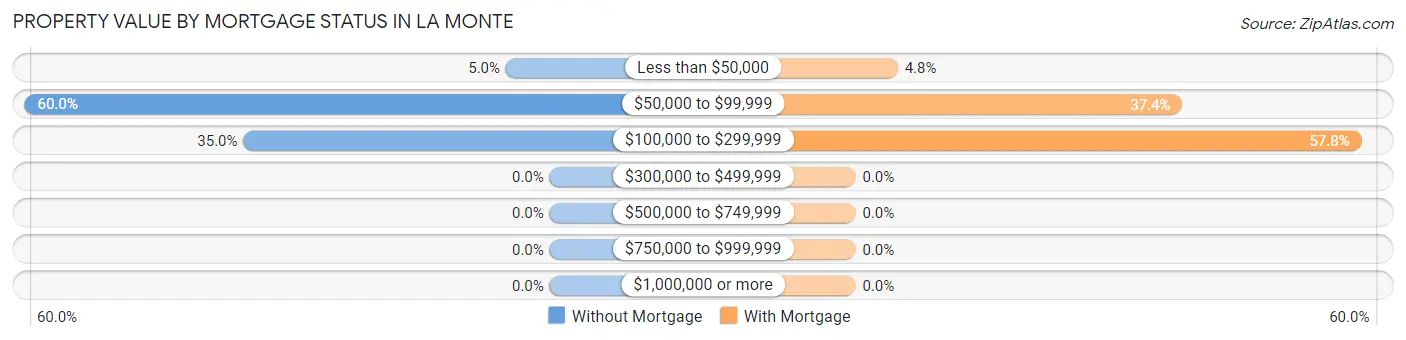
| Property Value | Without Mortgage | With Mortgage |
| Less than $50,000 | 6 (5.0%) | 4 (4.8%) |
| $50,000 to $99,999 | 72 (60.0%) | 31 (37.3%) |
| $100,000 to $299,999 | 42 (35.0%) | 48 (57.8%) |
| $300,000 to $499,999 | 0 (0.0%) | 0 (0.0%) |
| $500,000 to $749,999 | 0 (0.0%) | 0 (0.0%) |
| $750,000 to $999,999 | 0 (0.0%) | 0 (0.0%) |
| $1,000,000 or more | 0 (0.0%) | 0 (0.0%) |
| Total | 120 (100.0%) | 83 (100.0%) |
Household Income by Mortgage Status in La Monte
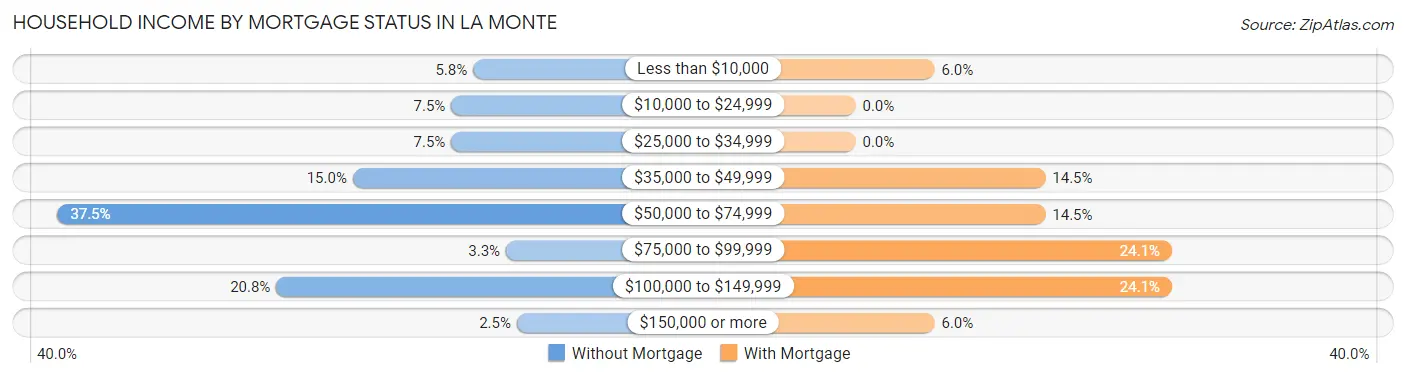
| Household Income | Without Mortgage | With Mortgage |
| Less than $10,000 | 7 (5.8%) | 5 (6.0%) |
| $10,000 to $24,999 | 9 (7.5%) | 0 (0.0%) |
| $25,000 to $34,999 | 9 (7.5%) | 0 (0.0%) |
| $35,000 to $49,999 | 18 (15.0%) | 12 (14.5%) |
| $50,000 to $74,999 | 45 (37.5%) | 12 (14.5%) |
| $75,000 to $99,999 | 4 (3.3%) | 20 (24.1%) |
| $100,000 to $149,999 | 25 (20.8%) | 20 (24.1%) |
| $150,000 or more | 3 (2.5%) | 5 (6.0%) |
| Total | 120 (100.0%) | 83 (100.0%) |
Property Value to Household Income Ratio in La Monte
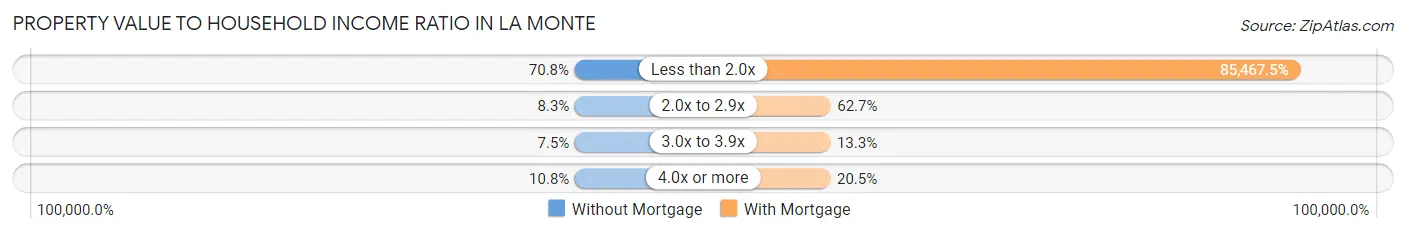
| Value-to-Income Ratio | Without Mortgage | With Mortgage |
| Less than 2.0x | 85 (70.8%) | 70,938 (85,467.5%) |
| 2.0x to 2.9x | 10 (8.3%) | 52 (62.6%) |
| 3.0x to 3.9x | 9 (7.5%) | 11 (13.3%) |
| 4.0x or more | 13 (10.8%) | 17 (20.5%) |
| Total | 120 (100.0%) | 83 (100.0%) |
Real Estate Taxes by Mortgage Status in La Monte
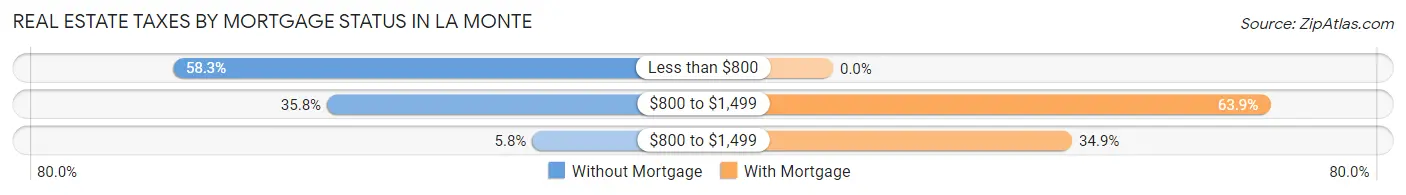
| Property Taxes | Without Mortgage | With Mortgage |
| Less than $800 | 70 (58.3%) | 0 (0.0%) |
| $800 to $1,499 | 43 (35.8%) | 53 (63.9%) |
| $800 to $1,499 | 7 (5.8%) | 29 (34.9%) |
| Total | 120 (100.0%) | 83 (100.0%) |
Health & Disability in La Monte
Health Insurance Coverage by Age in La Monte
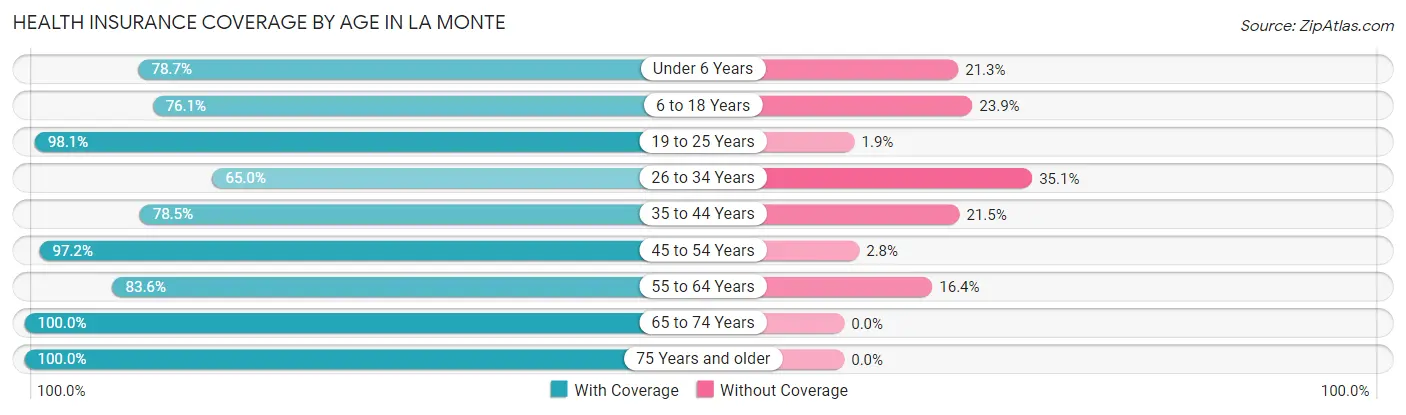
| Age Bracket | With Coverage | Without Coverage |
| Under 6 Years | 100 (78.7%) | 27 (21.3%) |
| 6 to 18 Years | 137 (76.1%) | 43 (23.9%) |
| 19 to 25 Years | 153 (98.1%) | 3 (1.9%) |
| 26 to 34 Years | 63 (64.9%) | 34 (35.0%) |
| 35 to 44 Years | 95 (78.5%) | 26 (21.5%) |
| 45 to 54 Years | 139 (97.2%) | 4 (2.8%) |
| 55 to 64 Years | 56 (83.6%) | 11 (16.4%) |
| 65 to 74 Years | 81 (100.0%) | 0 (0.0%) |
| 75 Years and older | 52 (100.0%) | 0 (0.0%) |
| Total | 876 (85.6%) | 148 (14.4%) |
Health Insurance Coverage by Citizenship Status in La Monte
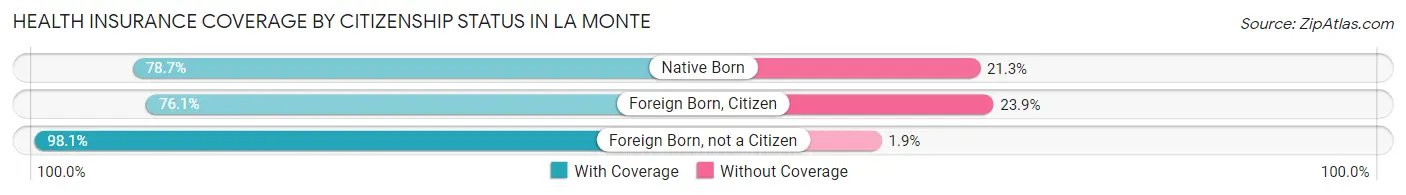
| Citizenship Status | With Coverage | Without Coverage |
| Native Born | 100 (78.7%) | 27 (21.3%) |
| Foreign Born, Citizen | 137 (76.1%) | 43 (23.9%) |
| Foreign Born, not a Citizen | 153 (98.1%) | 3 (1.9%) |
Health Insurance Coverage by Household Income in La Monte
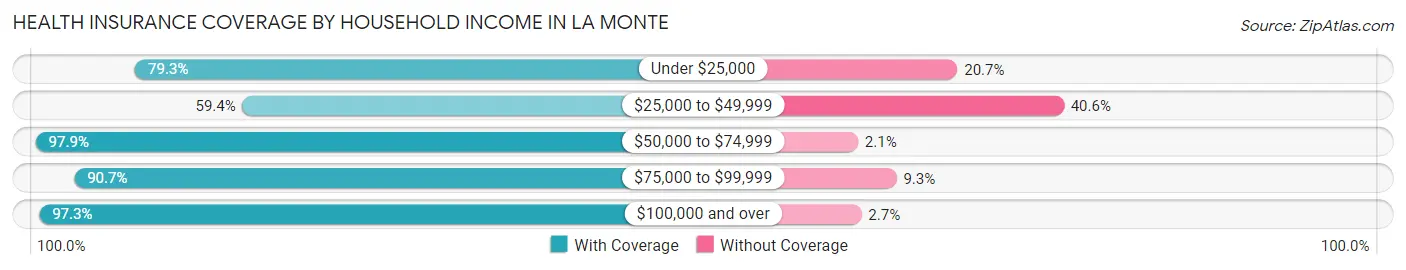
| Household Income | With Coverage | Without Coverage |
| Under $25,000 | 134 (79.3%) | 35 (20.7%) |
| $25,000 to $49,999 | 130 (59.4%) | 89 (40.6%) |
| $50,000 to $74,999 | 282 (97.9%) | 6 (2.1%) |
| $75,000 to $99,999 | 117 (90.7%) | 12 (9.3%) |
| $100,000 and over | 213 (97.3%) | 6 (2.7%) |
Public vs Private Health Insurance Coverage by Age in La Monte
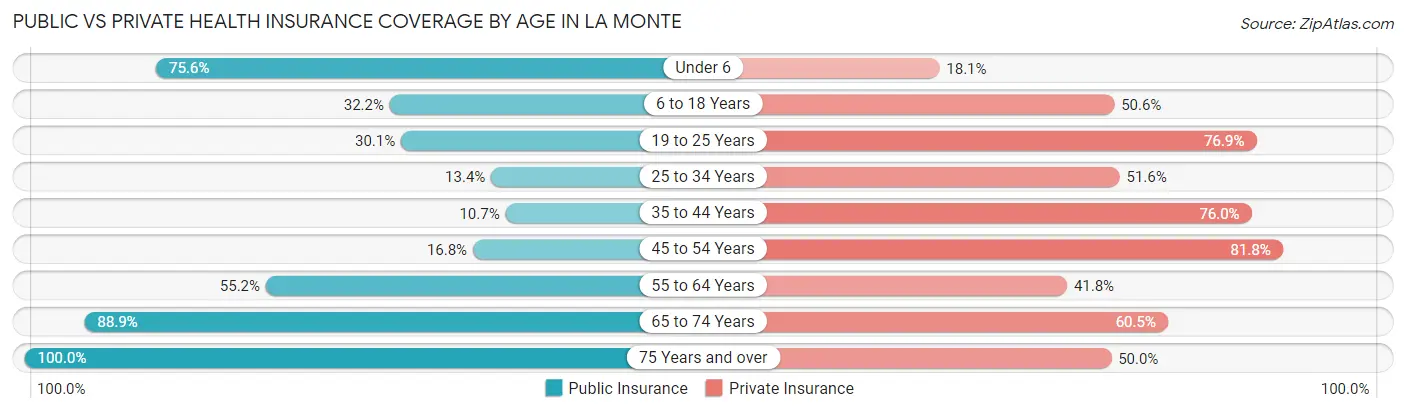
| Age Bracket | Public Insurance | Private Insurance |
| Under 6 | 96 (75.6%) | 23 (18.1%) |
| 6 to 18 Years | 58 (32.2%) | 91 (50.6%) |
| 19 to 25 Years | 47 (30.1%) | 120 (76.9%) |
| 25 to 34 Years | 13 (13.4%) | 50 (51.5%) |
| 35 to 44 Years | 13 (10.7%) | 92 (76.0%) |
| 45 to 54 Years | 24 (16.8%) | 117 (81.8%) |
| 55 to 64 Years | 37 (55.2%) | 28 (41.8%) |
| 65 to 74 Years | 72 (88.9%) | 49 (60.5%) |
| 75 Years and over | 52 (100.0%) | 26 (50.0%) |
| Total | 412 (40.2%) | 596 (58.2%) |
Disability Status by Sex by Age in La Monte
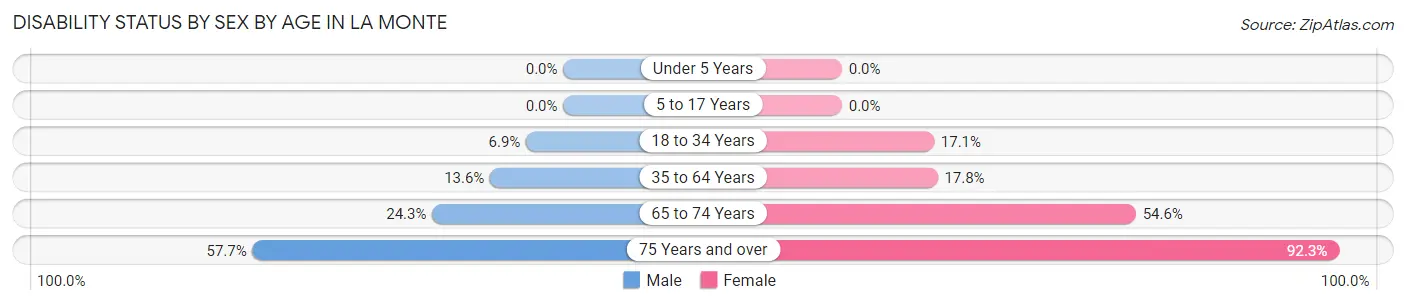
| Age Bracket | Male | Female |
| Under 5 Years | 0 (0.0%) | 0 (0.0%) |
| 5 to 17 Years | 0 (0.0%) | 0 (0.0%) |
| 18 to 34 Years | 8 (6.9%) | 27 (17.1%) |
| 35 to 64 Years | 22 (13.6%) | 30 (17.7%) |
| 65 to 74 Years | 9 (24.3%) | 24 (54.5%) |
| 75 Years and over | 15 (57.7%) | 24 (92.3%) |
Disability Class by Sex by Age in La Monte
Disability Class: Hearing Difficulty
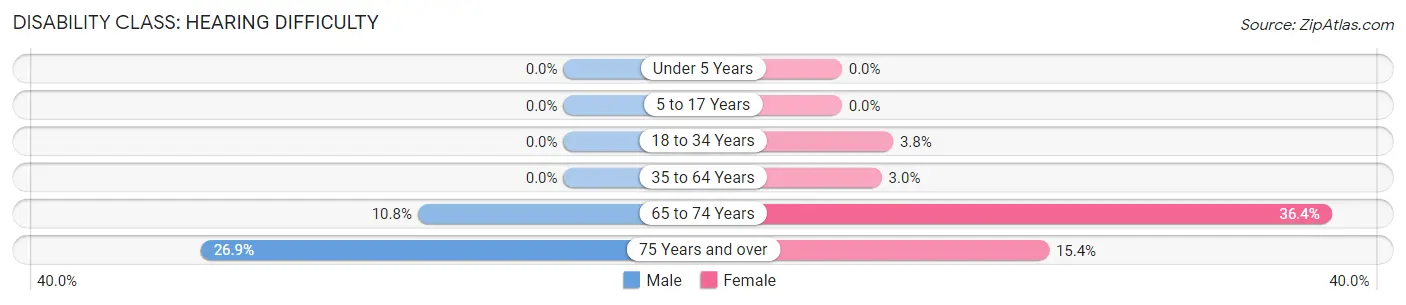
| Age Bracket | Male | Female |
| Under 5 Years | 0 (0.0%) | 0 (0.0%) |
| 5 to 17 Years | 0 (0.0%) | 0 (0.0%) |
| 18 to 34 Years | 0 (0.0%) | 6 (3.8%) |
| 35 to 64 Years | 0 (0.0%) | 5 (3.0%) |
| 65 to 74 Years | 4 (10.8%) | 16 (36.4%) |
| 75 Years and over | 7 (26.9%) | 4 (15.4%) |
Disability Class: Vision Difficulty
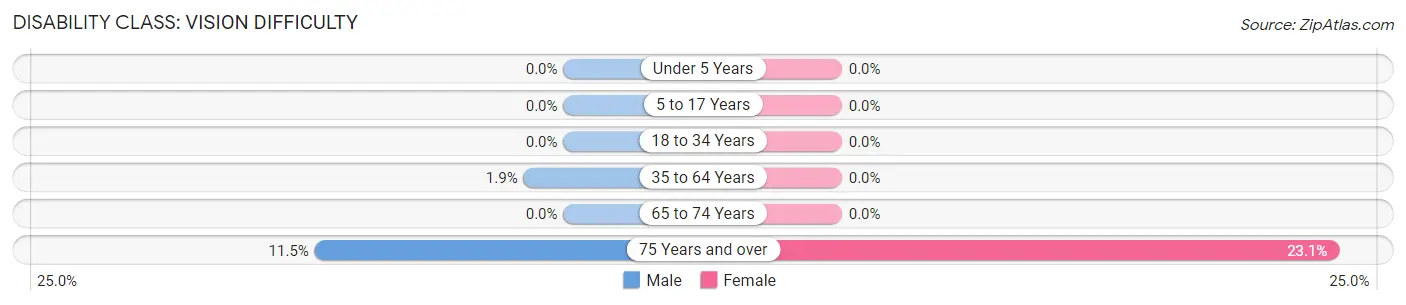
| Age Bracket | Male | Female |
| Under 5 Years | 0 (0.0%) | 0 (0.0%) |
| 5 to 17 Years | 0 (0.0%) | 0 (0.0%) |
| 18 to 34 Years | 0 (0.0%) | 0 (0.0%) |
| 35 to 64 Years | 3 (1.8%) | 0 (0.0%) |
| 65 to 74 Years | 0 (0.0%) | 0 (0.0%) |
| 75 Years and over | 3 (11.5%) | 6 (23.1%) |
Disability Class: Cognitive Difficulty
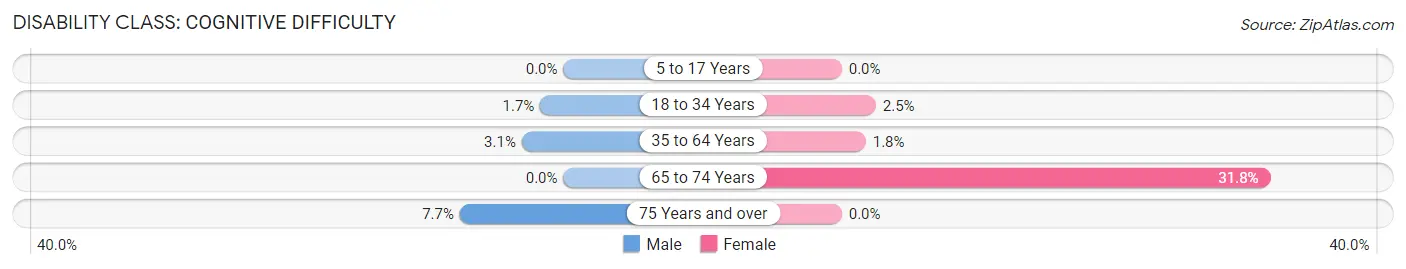
| Age Bracket | Male | Female |
| 5 to 17 Years | 0 (0.0%) | 0 (0.0%) |
| 18 to 34 Years | 2 (1.7%) | 4 (2.5%) |
| 35 to 64 Years | 5 (3.1%) | 3 (1.8%) |
| 65 to 74 Years | 0 (0.0%) | 14 (31.8%) |
| 75 Years and over | 2 (7.7%) | 0 (0.0%) |
Disability Class: Ambulatory Difficulty
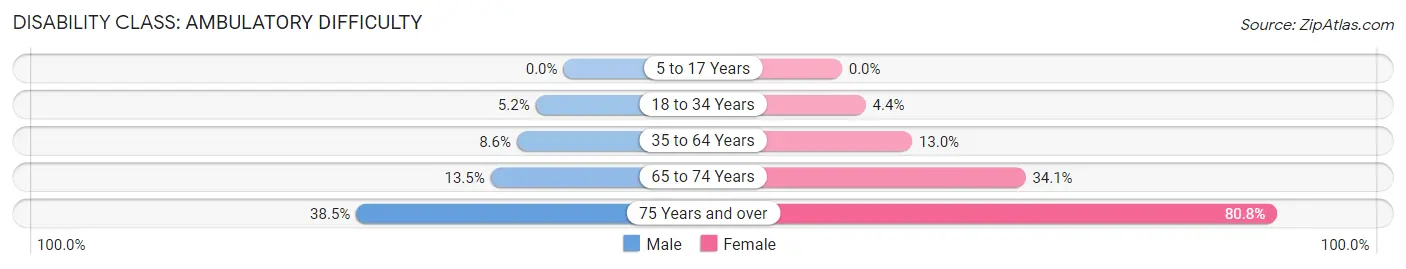
| Age Bracket | Male | Female |
| 5 to 17 Years | 0 (0.0%) | 0 (0.0%) |
| 18 to 34 Years | 6 (5.2%) | 7 (4.4%) |
| 35 to 64 Years | 14 (8.6%) | 22 (13.0%) |
| 65 to 74 Years | 5 (13.5%) | 15 (34.1%) |
| 75 Years and over | 10 (38.5%) | 21 (80.8%) |
Disability Class: Self-Care Difficulty
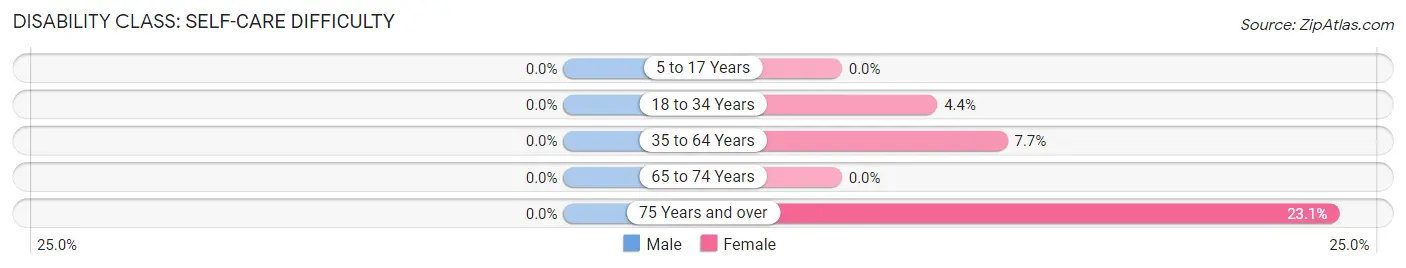
| Age Bracket | Male | Female |
| 5 to 17 Years | 0 (0.0%) | 0 (0.0%) |
| 18 to 34 Years | 0 (0.0%) | 7 (4.4%) |
| 35 to 64 Years | 0 (0.0%) | 13 (7.7%) |
| 65 to 74 Years | 0 (0.0%) | 0 (0.0%) |
| 75 Years and over | 0 (0.0%) | 6 (23.1%) |
Technology Access in La Monte
Computing Device Access in La Monte
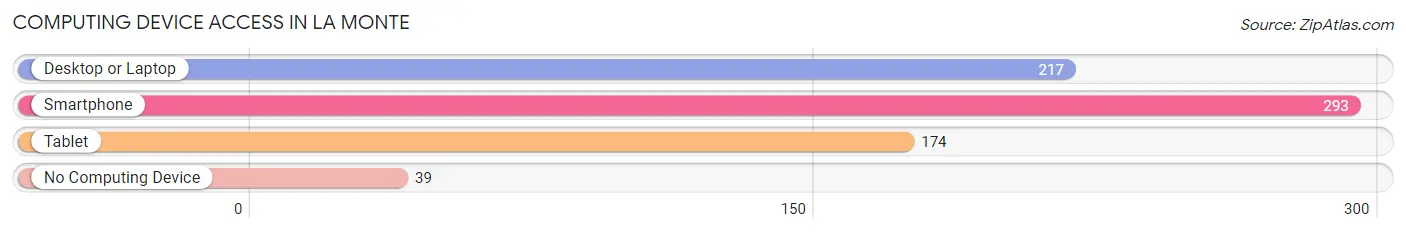
| Device Type | # Households | % Households |
| Desktop or Laptop | 217 | 62.5% |
| Smartphone | 293 | 84.4% |
| Tablet | 174 | 50.1% |
| No Computing Device | 39 | 11.2% |
| Total | 347 | 100.0% |
Internet Access in La Monte
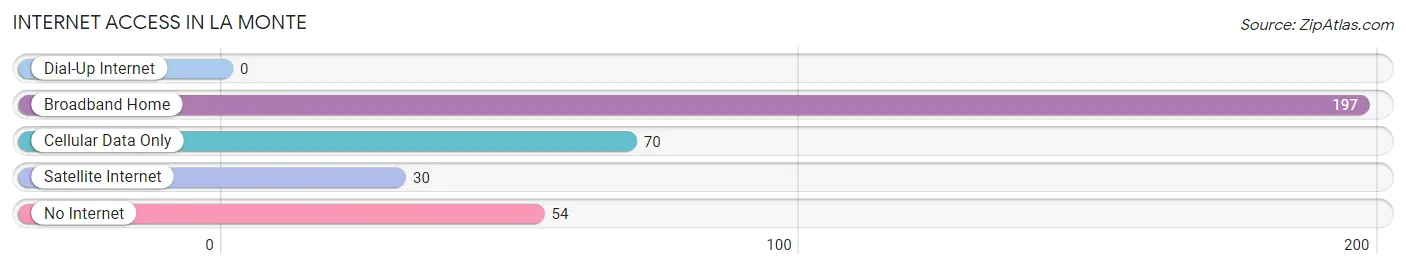
| Internet Type | # Households | % Households |
| Dial-Up Internet | 0 | 0.0% |
| Broadband Home | 197 | 56.8% |
| Cellular Data Only | 70 | 20.2% |
| Satellite Internet | 30 | 8.6% |
| No Internet | 54 | 15.6% |
| Total | 347 | 100.0% |
La Monte Summary
La Monte, Missouri is a small town located in Pettis County, Missouri. It is situated on the banks of the Missouri River, approximately 30 miles east of Sedalia. The town was founded in 1871 and has a population of approximately 1,000 people.
History
La Monte was founded in 1871 by a group of settlers from Kentucky. The town was named after the nearby La Monte Creek, which was named after a French explorer who had traveled through the area in the late 1700s. The town was originally a farming community, but it soon became a center for the lumber industry. The town was also home to a number of businesses, including a hotel, a general store, a blacksmith shop, and a post office.
In the late 1800s, the town began to experience a period of growth. The railroad arrived in 1887, and the town was incorporated in 1889. The town continued to grow throughout the early 1900s, and by the 1920s, it had become a thriving community.
Geography
La Monte is located in Pettis County, Missouri. It is situated on the banks of the Missouri River, approximately 30 miles east of Sedalia. The town is located in the Missouri River Valley, and the surrounding area is mostly flat. The town is located at an elevation of 845 feet above sea level.
The climate in La Monte is humid continental, with hot summers and cold winters. The average annual temperature is around 54 degrees Fahrenheit, and the average annual precipitation is around 40 inches.
Economy
The economy of La Monte is largely based on agriculture. The town is home to several farms, and the surrounding area is known for its production of corn, soybeans, and wheat. The town is also home to a number of businesses, including a grocery store, a hardware store, and a restaurant.
Demographics
As of the 2010 census, the population of La Monte was 1,000 people. The racial makeup of the town was 97.2% White, 0.7% African American, 0.3% Native American, 0.2% Asian, and 1.6% from other races. The median household income was $37,500, and the median family income was $45,000.
La Monte is a small town with a rich history and a strong sense of community. The town is home to a number of businesses, and the surrounding area is known for its agricultural production. The town is also home to a number of churches, and it is a popular destination for outdoor activities such as fishing, hunting, and camping.
Common Questions
What is Per Capita Income in La Monte?
Per Capita income in La Monte is $24,967.
What is the Median Family Income in La Monte?
Median Family Income in La Monte is $63,380.
What is the Median Household income in La Monte?
Median Household Income in La Monte is $60,474.
What is Income or Wage Gap in La Monte?
Income or Wage Gap in La Monte is 38.3%.
Women in La Monte earn 61.7 cents for every dollar earned by a man.
What is Inequality or Gini Index in La Monte?
Inequality or Gini Index in La Monte is 0.46.
What is the Total Population of La Monte?
Total Population of La Monte is 1,029.
What is the Total Male Population of La Monte?
Total Male Population of La Monte is 510.
What is the Total Female Population of La Monte?
Total Female Population of La Monte is 519.
What is the Ratio of Males per 100 Females in La Monte?
There are 98.27 Males per 100 Females in La Monte.
What is the Ratio of Females per 100 Males in La Monte?
There are 101.76 Females per 100 Males in La Monte.
What is the Median Population Age in La Monte?
Median Population Age in La Monte is 29.8 Years.
What is the Average Family Size in La Monte
Average Family Size in La Monte is 3.6 People.
What is the Average Household Size in La Monte
Average Household Size in La Monte is 3.0 People.
How Large is the Labor Force in La Monte?
There are 509 People in the Labor Forcein in La Monte.
What is the Percentage of People in the Labor Force in La Monte?
64.0% of People are in the Labor Force in La Monte.
What is the Unemployment Rate in La Monte?
Unemployment Rate in La Monte is 2.6%.