Zip Codes with the Highest Percentage of Households Without a Vehicle in Burnsville, MN
RELATED REPORTS & OPTIONS
Households without a Cars
Burnsville
Compare Zip Codes
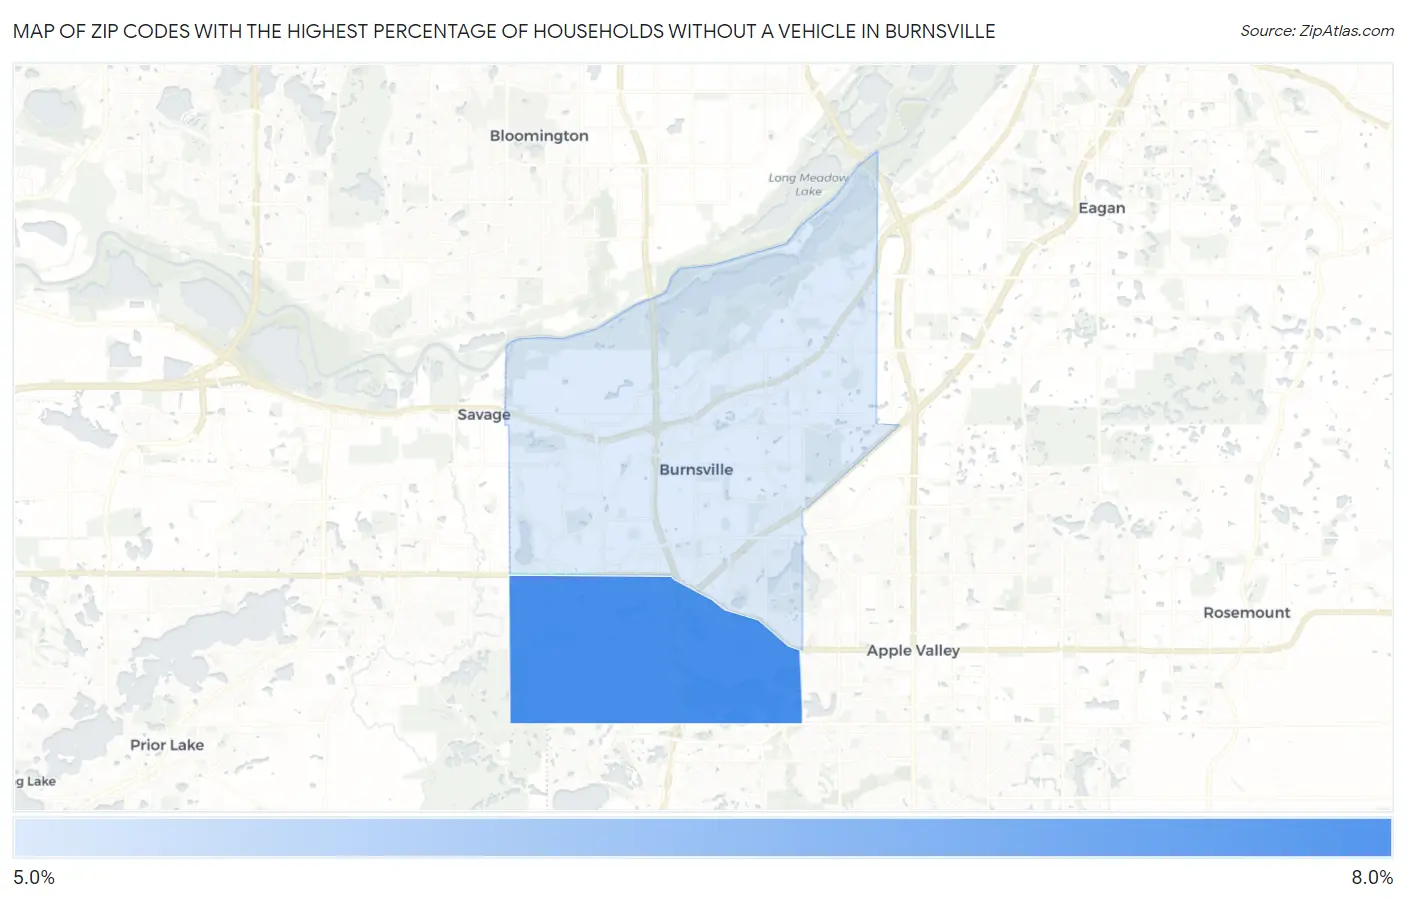
Map of Zip Codes with the Highest Percentage of Households Without a Vehicle in Burnsville
5.5%
6.6%
Zip Codes with the Highest Percentage of Households Without a Vehicle in Burnsville, MN
| Zip Code | Housholds Without a Car | vs State | vs National | |
| 1. | 55306 | 6.6% | 6.6%(=0.000)#199 | 8.3%(-1.70)#9,229 |
| 2. | 55337 | 5.5% | 6.6%(-1.10)#257 | 8.3%(-2.80)#11,586 |
1
Common Questions
What are the Top Zip Codes with the Highest Percentage of Households Without a Vehicle in Burnsville, MN?
Top Zip Codes with the Highest Percentage of Households Without a Vehicle in Burnsville, MN are:
What zip code has the Highest Percentage of Households Without a Vehicle in Burnsville, MN?
55306 has the Highest Percentage of Households Without a Vehicle in Burnsville, MN with 6.6%.
What is the Percentage of Households Without a Vehicle in Burnsville, MN?
Percentage of Households Without a Vehicle in Burnsville is 5.8%.
What is the Percentage of Households Without a Vehicle in Minnesota?
Percentage of Households Without a Vehicle in Minnesota is 6.6%.
What is the Percentage of Households Without a Vehicle in the United States?
Percentage of Households Without a Vehicle in the United States is 8.3%.